Article

Spatial Variability of Grape Berry Maturation Program at the Molecular Level

1
Department of Biotechnology, University of Verona, 37134 Verona, Italy
2
E. & J. Gallo Winery, Modesto, CA 95354, USA
3
Department of Agronomy, Food, Natural Resources, Animals and the Environment, University of Padua, 35020 Legnaro, Italy
*
Authors to whom correspondence should be addressed.
Horticulturae 2024, 10(3), 238; https://doi.org/10.3390/horticulturae10030238
Submission received: 29 January 2024 / Revised: 23 February 2024 / Accepted: 26 February 2024 / Published: 29 February 2024
(This article belongs to the Section Viticulture)

Abstract

:
The application of sensors in viticulture is a fast and efficient method to monitor grapevine vegetative, yield, and quality parameters and determine spatial intra-vineyard variability. Molecular analysis at the gene expression level can further contribute to the understanding of the observed variability by elucidating how pathways contributing to different grape quality traits behave in zones diverging on any of these parameters. The intra-vineyard variability of a Cabernet Sauvignon vineyard was evaluated through a Normalized Difference Vegetation Index (NDVI) map calculated from a multispectral image and detailed ground-truthing (e.g., vegetative, yield, and berry ripening compositional parameters). The relationships between NDVI and ground measurements were explored by correlation analysis. Moreover, berries were investigated by microarray gene expression analysis performed at five time points from fruit set to full ripening. Comparison between the transcriptomes of samples taken from locations with the highest and lowest NDVI values identified 968 differentially expressed genes. Spatial variability maps of the expression level of key berry ripening genes showed consistent patterns aligned with the vineyard vigor map. These insights indicate that berries from different vigor zones present distinct molecular maturation programs and suggest that transcriptome analysis may be a valuable tool for the management of vineyard variability.

1. Introduction

Vines are cultivated in a complex ecosystem composed of climate, soil, topography, and other living organisms. The ecosystem components often vary throughout the vineyard and create non-homogeneous sites. This might affect the vegetative potential of the vines and cause spatial intra-vineyard variability of several agronomic parameters such as shoot growth, fruit development, and yield [1,2]. Vines are usually trained in restrained manners to create a balanced source–sink relationship and to establish a favorable microclimate for high-quality fruit development [3,4]. Knowledge of the spatial variability in a vineyard is essential to address disturbances to these conditions caused by any uncontrolled vigor variation and to achieve the expected fruit quality.
A rapid, non-invasive method to study vineyard variability is the application of remote and proximal sensor systems. The sensor systems are used to deduce the vineyard’s physiological status by associating geo-localized sensor data to specific agronomical, productive, or qualitative parameters of the vines and berries [5,6,7,8]. This information is used to generate spatial variability maps for different vine and berry attributes, which facilitate vineyard management and assist decision-making [9]. One option is to minimize the observed variation between the zones by the application of site-specific interventions [10,11], and another one is to maintain the vineyard variability, allocating grapes from different areas to differentiated enological targets [12].
However, the informative potential of sensors is highly dependent on the nature of the approaches adopted in the field. The sensor performance is affected by many factors, including climate conditions [13], vineyard trellis systems [14], and the distance of the sensor from the canopy [15]. To overcome such obstacles, the use of sensors in a new vineyard ecosystem is usually accompanied by detailed ground truthing. This practice provides empirical evidence of the phenotypic variation within the vineyard by contrasting remotely sensed data with classic agronomical measurements [16]. However, establishing the relationship between these two data sources is rather complicated. Although cases with stable intra-vineyard variability between growing seasons have been reported [17,18], the correlations between the sensor data and the agronomic parameters can change within the season, and the timing at which these correlations are the strongest can vary, as well [19]. Examples of this inconsistency are reported for the relationship between spectral vegetation indices and berry phenolic content, which has been reported to have a peak of negative correlation either at veraison [20] or at harvest [21], and even to correlate positively [22]. Hence, additional insightful research is needed to improve the sensor’s ability to predict the final fruit quality by its application during early vegetative phases.
Over the past decade, the generation and analysis of large-scale transcriptomic datasets have played a crucial role in elucidating the molecular basis of grapevine berry development. Numerous investigations into gene expression patterns have established connections between molecular changes, primary and secondary metabolic pathways, and biological processes, together providing a comprehensive understanding of the transcriptomic program governing berry maturation [23]. However, little is known about the molecular differences during the ripening program associated with intra-vineyard variability of agronomic parameters.
Our study aimed at better characterizing distinct zones within the vineyard by combining standard NDVI detection with molecular approaches. Spatial variability in the vineyard, detected by sensors and established by ground truthing, was further investigated by gene expression analysis on grape berries. This information revealed the berry molecular features at the basis of the phenotypic variability observed in the vineyard, paving the way to increased control over fruit and wine quality.

2. Materials and Methods

2.1. Vineyard

The experiment was conducted in the 2017 growing season in a commercial vineyard of approximately 12 hectares of Vitis vinifera cv. Cabernet Sauvignon (Clone 8 grafted onto 110R rootstock). The vineyard was planted in 1992 and located in the Alexander Valley American Viticultural Area of California (38°42′50″ N, 122°55′4″ W). The vines were trained as a bilateral cordon, established at 1.5 m above the ground, in a split canopy configuration, with the two cordons installed on two separate wires and pointing in opposite directions. Vine and row spacings were 1.8 and 3.35 m, respectively.

2.2. Experimental Design

Data were collected from 14 homogenously distributed blocks across the vineyard to account for any vine vigor and fruit quality spatial variability. Each block comprised a square of 9 vines (3 adjacent vines × 3 rows).

2.3. Vine Measurements

2.3.1. Vine Water Status

Leaf water potential (Ψleaf) was measured on five leaves for each block from three selected vines. Measurements were taken on the youngest, fully expanded, and directly exposed leaves using a 610 PMS pressure chamber (PMS Instrument Co., Albany, OR, USA) at 10:00 a.m. and solar noon. Given the specific environmental conditions of wine growing in California, only the 10:00 a.m. measurements were reliable and were then employed in the correlation analysis with other vine physiology and grape composition parameters.

2.3.2. Canopy Size

Canopy size was assessed through direct measurements of leaf area index (LAI) performed with an LI-2200C Plant Canopy Analyzer (LI-COR Bioscences, Lincoln, NE, USA). LAI was measured on five vines per block using the following procedure. For each vine, a set of five measurements was taken, including one ambient reading above the canopy in the middle of the interrow and four measurements at 30 cm from the ground located ¼, ½, ¾ of the interrow plus directly under the vine. Scattering correction was applied for each vine measurement following the manufacturer’s instructions.

2.3.3. Yield and Pruning Weight

Once the grapes of the vineyard block reached commercial maturity for winemaking (24.5 °Brix on average), the vines were harvested from each block, and cluster number and total fruit weight were recorded. During winter dormancy, pruning weights and cane counts were collected at each block.

2.4. Grape Composition Analysis

Representative grape samples (20 clusters) were collected at harvest from each block and destemmed and homogenized using a Vitamix blender (Vitamix Corporation, Cleveland, OH, USA) to be submitted directly for analytical quantification.

2.4.1. Basic Chemistry

Total soluble solids (TSS; °Brix), malic acid (g/L), and yeast assimilable nitrogen (YAN; mg/L) were determined using a WineScan FT-120 Fourier transform infrared (FTIR) spectroscopy system (FOSS North America, MN, USA). The system was calibrated using standard primary analytical methods.

2.4.2. Color and Phenolic Maturity

The phenolic composition of grapes was assessed using an Agilent 1200 reversed-phase high-performance liquid chromatography (HPLC) system equipped with a diode array detector and a 4.6 × 50 mm Zorbax Eclipse Plus C18 column (Agilent Technologies Inc., CA, USA). HPLC was performed using a gradient mobile phase system of acidified water (0.2% v/v phosphoric acid) and acetonitrile at a flow rate of 1 mL/min, as described by Waterhouse et al. [24]. Monomeric polyphenols were quantified using authentic reference standards at the following absorbances: quercetin glycoside (360 nm) and malvidin (520 nm). Polymeric tannins were quantified against the absorbance of a catechin reference standard measured at 280 nm.

2.4.3. Free and Bound Aroma Compounds

Total C6 compounds were analyzed by headspace solid-phase microextraction following the quantification protocol described by Previtali et al. [25], using an Agilent 7890B gas chromatograph equipped with a multimode inlet coupled to a 5977B mass selective detector (MSD) (Agilent Technologies Inc., Santa Clara, CA, USA) configured with an Agilent J&W DB-WAX Ultra Inert column (30 m × 0.25 mm ID, 0.50 μm thickness), and a Gerstel MPS2 autosampler (Gerstel Inc., Columbia, MD, USA). SPME fiber [23- gauge, 1 cm divinylbenzene/carboxen/poly(methyl siloxane) (DVB/CARB/PDMS)] headspace extraction was conducted by exposing samples for 18 min at 70 °C with continuous agitation. The bound form of β-damascenone was quantified indirectly through isolation of the glycosides via solid-phase extraction (SPE), acid hydrolysis, and quantification of the released volatiles by HS-SPME-GC-MS according to Kotseridis et al. [26].

2.5. Berry Sampling

At each vineyard block pre-bloom, four fully developed inflorescences per vine were labeled, comprising a total of 36 clusters per block. Berry development and ripening were monitored from fruit set to full maturity. Berry samples were collected at five time points, corresponding to key phenological stages reported as days after veraison (DAV): post pea size (–30 DAV), pre veraison (–9 DAV), 50% veraison (0 DAV), post veraison (11 DAV), and full maturity (47 DAV). At each time point, one berry per marked cluster was selected resulting in a sampling size of 36 berries per block. Prior to flash freezing in liquid nitrogen, the berries were weighed to calculate the block average berry weight and capture berry growing profiles by vineyard block. Eighteen frozen berries were ground in liquid nitrogen: 1 g of frozen powder was thawed to measure TSS over time, and the remaining material was stored for gene expression analysis.

2.6. Gene Expression Analysis

Total RNA was extracted from ~200 mg of frozen berry pericarp (pulp plus skin without seeds) powder using the Spectrum™ Plant Total RNA kit (Sigma-Aldrich, St. Louis, MO, USA) as previously described [27]. For microarray analysis, RNA quality and integrity were determined using a Bioanalyzer Chip RNA 7500 series II (Agilent). The cDNA synthesis, labeling, hybridization, and washing reactions were performed according to the Agilent Microarray-Based Gene Expression Analysis Guide (V 6.5). Hybridizations were carried out in an Agilent custom microarray (https://www.ncbi.nlm.nih.gov/geo/query/acc.cgi?acc=GPL22427, accessed on 31 December 2016) representing 29,798 predicted grapevine genes according to the V1 annotation of the 12X grapevine genome. Gene annotations were also implemented considering the VCOST.V3 code and the INTEGRAPE catalog gene name [28]. Scanning and feature extraction were performed using an Agilent Scanner following the instruction manual settings. The QC report for each extraction was analyzed to assess the quality of the overall hybridization procedure. A data matrix was prepared by selecting the gProcessedSignalvalues (raw fluorescence intensities of each probe) from each single sub-array outcome file. The data were normalized on the 75th percentile and a correlation analysis was then conducted to assess the consistency of the biological triplicates. Correlation matrixes were prepared using R software (version 4.2.1) and Pearson’s correlation coefficient (PCC) as the statistical metric. Data reported in the normalized data matrix (Supplementary Dataset S2; https://www.ncbi.nlm.nih.gov/geo/query/acc.cgi?&acc=GSE254304, accessed on 27 February 2024) were used to determine the genes differently expressed in different samples by t-test analysis (TmeV).

2.7. Remote Sensing

A multispectral image was acquired from a fixed-wing manned aircraft flying over the experimental site on 15 August 2017, within one hour of solar noon. The image, with a spatial resolution of 0.22 m/pixel, consisted of 5 spectral bands in the visible and near infra-red regions of the electromagnetic spectrum. The red (R) and the near infra-red (NIR) bands, centered at 670 and 800 nm, respectively, and with a full width at half maximum of 10 nm, were used to calculate the NDVI as follows:
N D V I = N I R R N I R + R
At that time of the season, the vine canopy is the only active vegetation present, and the background is mainly dry cover crop. An NDVI value of 0.49 was set as a threshold to filter out mixed pixels or pixels representing the background using the mclust function of the mclust package in R (version 4.2.1) [29]. All the pixels with NDVI values below 0.49 were removed from the image. Then, the average NDVI value in each block was extracted.

2.8. Statistical Analysis

The coefficient of variation (CV), measured as the ratio of the standard deviation to the mean and expressed as a percentage, was calculated for the NDVI and the vine physiology and berry composition values of the 14 blocks. The NDVI values of the blocks were used to define three vigor classes: high vigor class (HVC; 6 blocks), medium vigor class (MVC; 5 blocks), and low vigor class (LVC; 3 blocks). Each parameter was averaged by vigor class, and one-way ANOVA followed by Tukey’s test as post-hoc (p < 0.05) was performed between the vigor classes (Table 1).
Spatial interpolation-based maps were generated from data collected in the vineyard, within each block, by storing and analyzing it in an open-source QGIS environment (QGIS, 2.18 QGIS Development Team). The inverse distance weighting (IDW) method, which suits low observation numbers and is less affected by outliers, was applied, followed by a quantile classification set for 3 classes.
Additionally, the data collected within blocks were analyzed employing Pearson’s correlation and presented as a correlation matrix clustered by the average-linkage method using the corrplot and hclust functions of the corrplot package in R software.
The microarray data were investigated by principal component analysis (PCA) using the fviz_pca function of the factoextra package in R software.
Differential gene expression analysis was conducted using the MeV tool (https://sourceforge.net/projects/mev-tm4, accessed on 27 February 2024) on blocks showing the lowest (2, 3, and 5) and highest (6, 11, and 12) NDVI values. These blocks were accounted as biological triplication of low and high vigor status, respectively. Differentially expressed genes (DEGs) were identified by between-subjects Student’s t-test (p < 0.05), assuming equal variance among samples, and then selected by fold change (FC) of equal or greater than ±1.5.
The GO enrichment analysis was performed using the ShinyGO v.0.741 software [30] (http://bioinformatics.sdstate.edu/go74/, accessed on 27 February 2024) with a false discovery rate (FDR) cutoff of 0.05.
Cluster analyses were applied to DEGs using Pearson’s correlation and complete-linkage method. The number of significant gene clusters was evaluated by the within-groups sum of squares using the hclust and k-means function using the stat package in R software [31].

2.9. Molecular Phenology Scale

We mapped the time-series grape transcriptomic samples onto the MPhS [32] to depict the effect of vine vigor variability on the progression of grape berry development with higher detail compared to classic time- or phenotype-based approaches. The averaged transcriptome data of the low and high vigor status was mapped onto the MPhS.

3. Results and Discussion

3.1. Vineyard Spatial Variability in Vigor and Quality Traits

Spatial variability in the vineyard is related to changes in terrain and soil physical and chemical properties. These changes result in variable vine vigor throughout the vineyard. Fruit development requires a specific canopy volume range to complete the ripening program. Thin or excessive canopy volume might impair or block berry maturation, while—within a certain interval—small changes in the canopy volume can affect fruit quality [33]. Our work investigated a 12-hectare cv. Cabernet Sauvignon vineyard for its variability in vigor, yield, and berry composition during the 2017 growing season. The study was carried out by a remote sensing approach accompanied by ground measurements, which included detailed vine and berry characterizations in 14 different sampling blocks. NDVI was calculated and mapped from a multispectral image taken on 15 August 2017, 20 days after veraison (Figure 1a). The 14 blocks were grouped into three statistically different vigor classes based on their NDVI values: Low Vigor Class (LVC) included blocks 2, 3, and 5, which exhibited NDVI values ranging from 0.540 to 0.567; Medium Vigor Class (MVC) included blocks 1, 4, 9, 13, and 14 with NDVI values varying from 0.581 to 0.589; High Vigor Class (HVC) included blocks 6, 7, 8, 10, 11, and 12, which showed NDVI values varying from 0.603 to 0.635 (Table 1; Tukey test p < 0.05).
An NDVI class map was generated by interpolation of the block NDVI values and showed high vigor variability from the northeast to the southwest vineyard corner, in which the three LVC and four out of the six HVC blocks were located, respectively. The other two HVC blocks were situated on the east side of the vineyard, whereas all MVC blocks were distributed along the northwest–southeast axis (Figure 1b). The majority (10 out of 13) of vine and berry parameters were statistically different between LVC and HVC classes, whereas the MVC values were, in some cases, significantly different from one or the other vigor class (Table 1).
Pruning weight and LAI are estimations of vine canopy size and have been reported as good indicators for plant vigor classification [10,34]. These two parameters presented, respectively, 34.36 and 12.63% CV across the blocks and showed significantly higher values in HVC as compared to LVC. Usually, more developed canopies are associated with better water status than those at lower vigor. In our case, the Ψleaf measured indeed showed a higher averaged value in HVC (−0.80 MPa) compared to LVC (−0.95 MPa) and a relatively high CV of 17.45%. This indicates that vigor differences within the vineyard are related to variability in the plant water status, which could be dictated by dissimilarities in soil water availability. Sugar level (by TSS) and berry weight were monitored throughout ripening and showed differing berry maturation trends across the vineyard (Figure S1; Supplementary Dataset S1). HVC blocks had higher berry weight from post pea size and lower sugar level from veraison onward, compared to LVC blocks. These differences increased with the season progression to reach 9.52% and 5.4% CV for berry weight and TSS, respectively, at harvest, when the variation by vigor class was statistically significant (Table 1). In addition to bigger berries, HVC vines showed significantly higher yield at harvest as compared to LVC (12.38 and 4.99 kg/vine on average, respectively). Indeed, yield is the parameter that showed the highest variability across the vineyard block (41% CV), demonstrating the high impact of the non-homogeneous agronomic conditions of this vineyard on plant productivity.
In line with the different fruit maturation trends observed in LVC and HVC, high compositional variability between berries from different vigor classes was detected at harvest (Table 1). Compounds associated with unripe berries, such as malic acid that accumulates from fruit set to veraison as a product of photosynthetic activity, were significantly higher in HVC. After veraison, malic acid tends to decline due to berry respiration, which is a process highly accelerated by temperature [35]. Higher concentrations of malic acid in mature HVC berries compared to LVC ones could be the result of greater concentrations reached before veraison or slower depletion, both suggesting a reduced ripening pace possibly related to the higher yield of HVC plants. The cooling effect exerted by larger HVC canopies on cluster microclimate could also have contributed to the slowdown of malic acid degradation.
Other compounds associated with unripe berries are C6 aroma compounds responsible for green/grassy sensory attributes. C6 compounds tend to increase during maturation and decline at late ripening [36]. A high concentration of these compounds in HVC compared to LVC might be due to the more advanced maturation level of the latter at harvest, which agrees with the tight relationship between C6 abundance and berry developmental stage in Cabernet Sauvignon grapes reported by Previtali et al. [25]. The more advanced maturation phase of LVC grapes at harvest can explain the higher concentration of quercetin, anthocyanins, and tannins, which, besides characterizing ripe berries, are also highly susceptible to change in relation to the cluster microclimate [37,38,39]. The LVC canopy, which was thinner and with lower Ψleaf, might have resulted in greater cluster insolation sun exposure and increased water deficit, which may have promoted the accumulation of these compounds. These results are in line with previous reports on spatial variability in berry composition caused by differences in vigor levels within the vineyard [40,41,42,43]. The bound form of the floral-scented norisoprenoid β-damascenone was more abundant in LVC. Norisoprenoids are formed by carotenoid degradation that occurs from veraison to maturity, and their accumulation becomes significant in the most advanced ripening stages [35]. Since carotenoids are photosynthetic pigments that tend to build on light, the thin vegetation of LVC may have resulted in higher light exposure on developing fruit clusters, promoting carotenoid accumulation and, consequently, higher β-damas cenone concentration in LVC berries.
YAN was the berry compositional trait with the greatest intra-vineyard variability (25.49 CV%), and its content was higher in HVC. Nitrogen is the soil nutrient most strictly related to the promotion of plant growth and linked directly with grapevine vigor. It has been reported that an excess of vigor could hinder the YAN content of berries due to a competition between vegetative and reproductive organs for nitrogen [44]. However, in our case, the relationship between YAN and vigor was quite clear, which is consistent with previous observations [45].
For selected parameters, which showed statistically significant differences between the vigor classes (Table 1; Tukey test p < 0.05), spatial variability maps were interpolated (Figure 1b). The maps had comparable patterns among them, which agreed with the NDVI class map pattern, and distinguished the northeast area of the vineyard from the southwest area. LVC was characterized by lower pruning weight and yield per vine, higher concentrations of sugars, β-damascenone, and anthocyanins, and lower concentrations of YAN, C6 compounds, and malic acid. Notable similarities could be observed between the yield, pruning weight, and malic acid maps, as well as between the YAN and C6 maps.
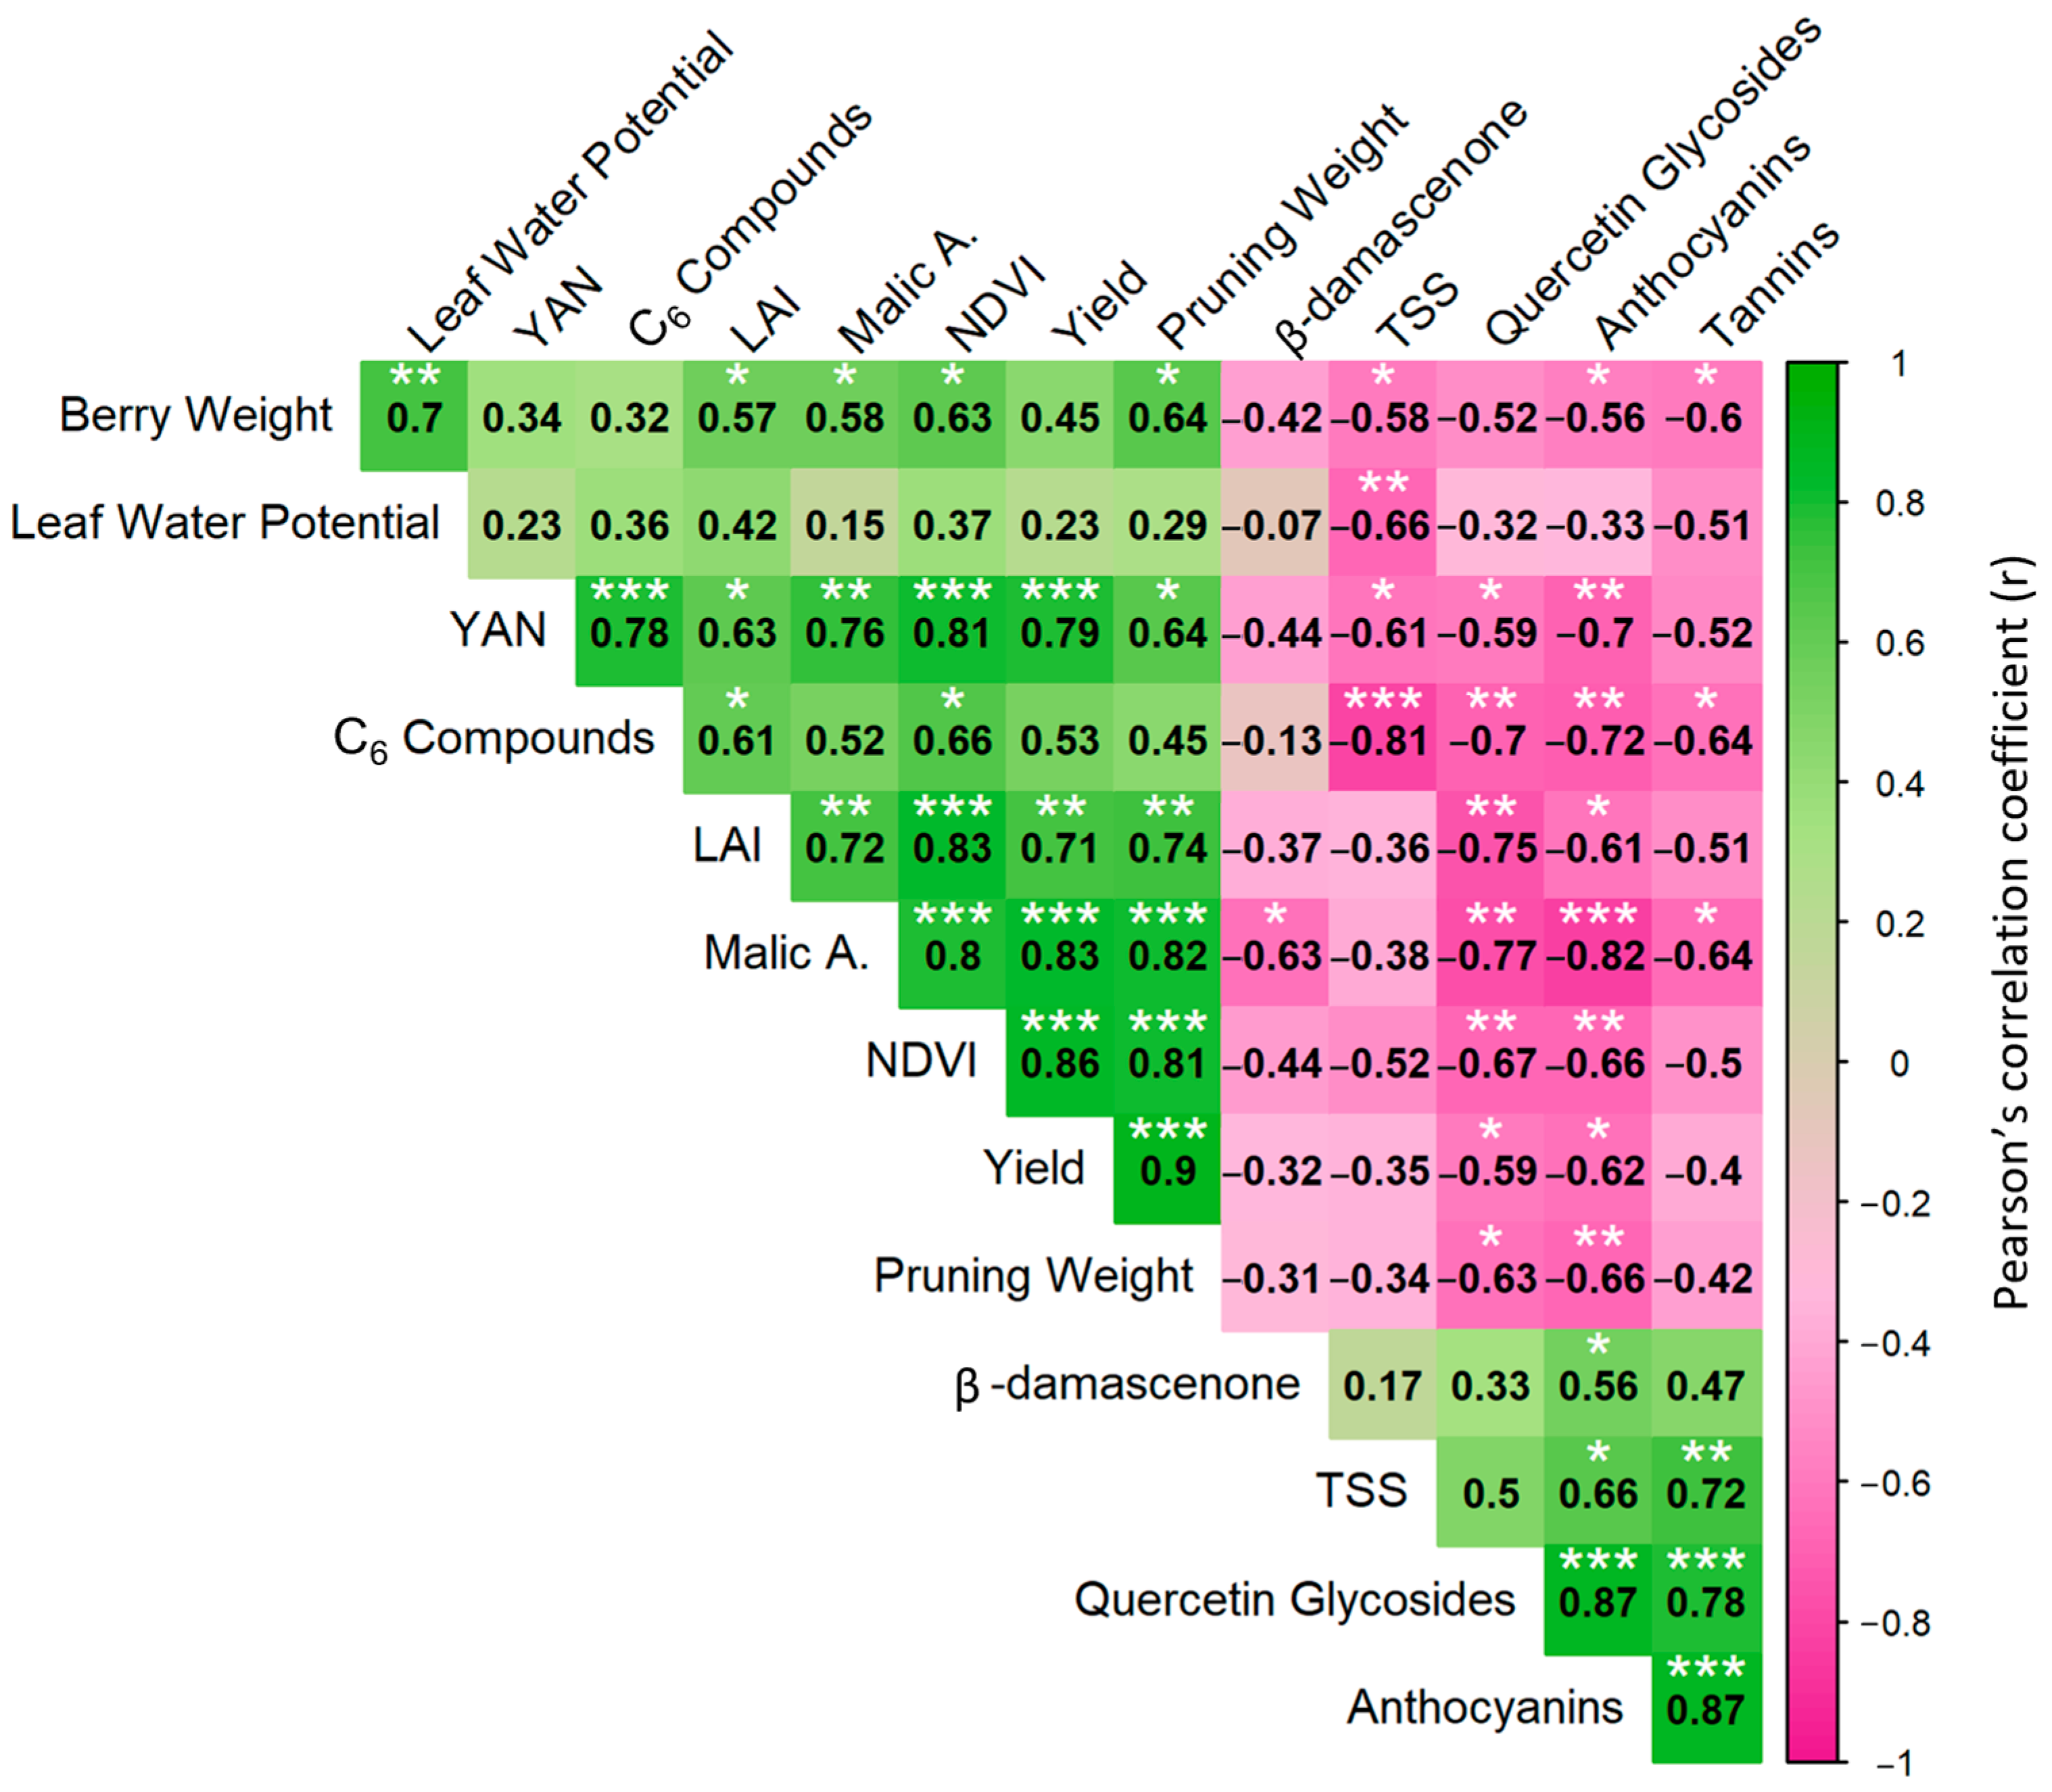
Pearson correlation analysis between NDVI values and all ground measurements confirmed the similarities observed in spatial maps (Figure 2). Strong positive correlations were found among NDVI, yield, pruning weight, and malic acid (r ≥ 0.8; p < 0.001), which also had the highest map resemblance. LAI and YAN also had strong positive correlations with NDVI (r ≥ 0.8; p < 0.001), whereas C6 compounds and berry weight only had moderately significant correlations with NDVI (r = 0.66 and 0.63, respectively; p < 0.05). Leaf water potential showed no correlation but a positive association with NDVI, but correlated significantly with key ripening parameters, such as sugar level and berry weight, in agreement with previous reports [2]. The attributes associated with grape ripening (flavonoids, quercetin glycoside, and anthocyanins) were significantly anti-correlated with NDVI and most of the parameters associated with high vigor (p < 0.05), as previously reported for quercetin levels in berries shown to be influenced by the vine canopy architecture [43].

3.2. Spatial Variability in the Expression of Key Genes Involved in Berry Maturation

The vineyard in this study presented high phenotypic variability in vegetative and berry compositional parameters. The variability observed at harvest was the result of dissimilar developmental and metabolic processes occurring from fruit set to ripening at each block. Berry development is a process divided into two sigmoidal successive growth periods [46], during which berry morphology and composition undergo profound changes orchestrated by the berry maturation transcriptional program [27]. To assess the gene expression evolution in berries from plants at different vigor statuses, microarray analysis was applied at five time points from post-fruit set to harvest (Supplementary Dataset S2).
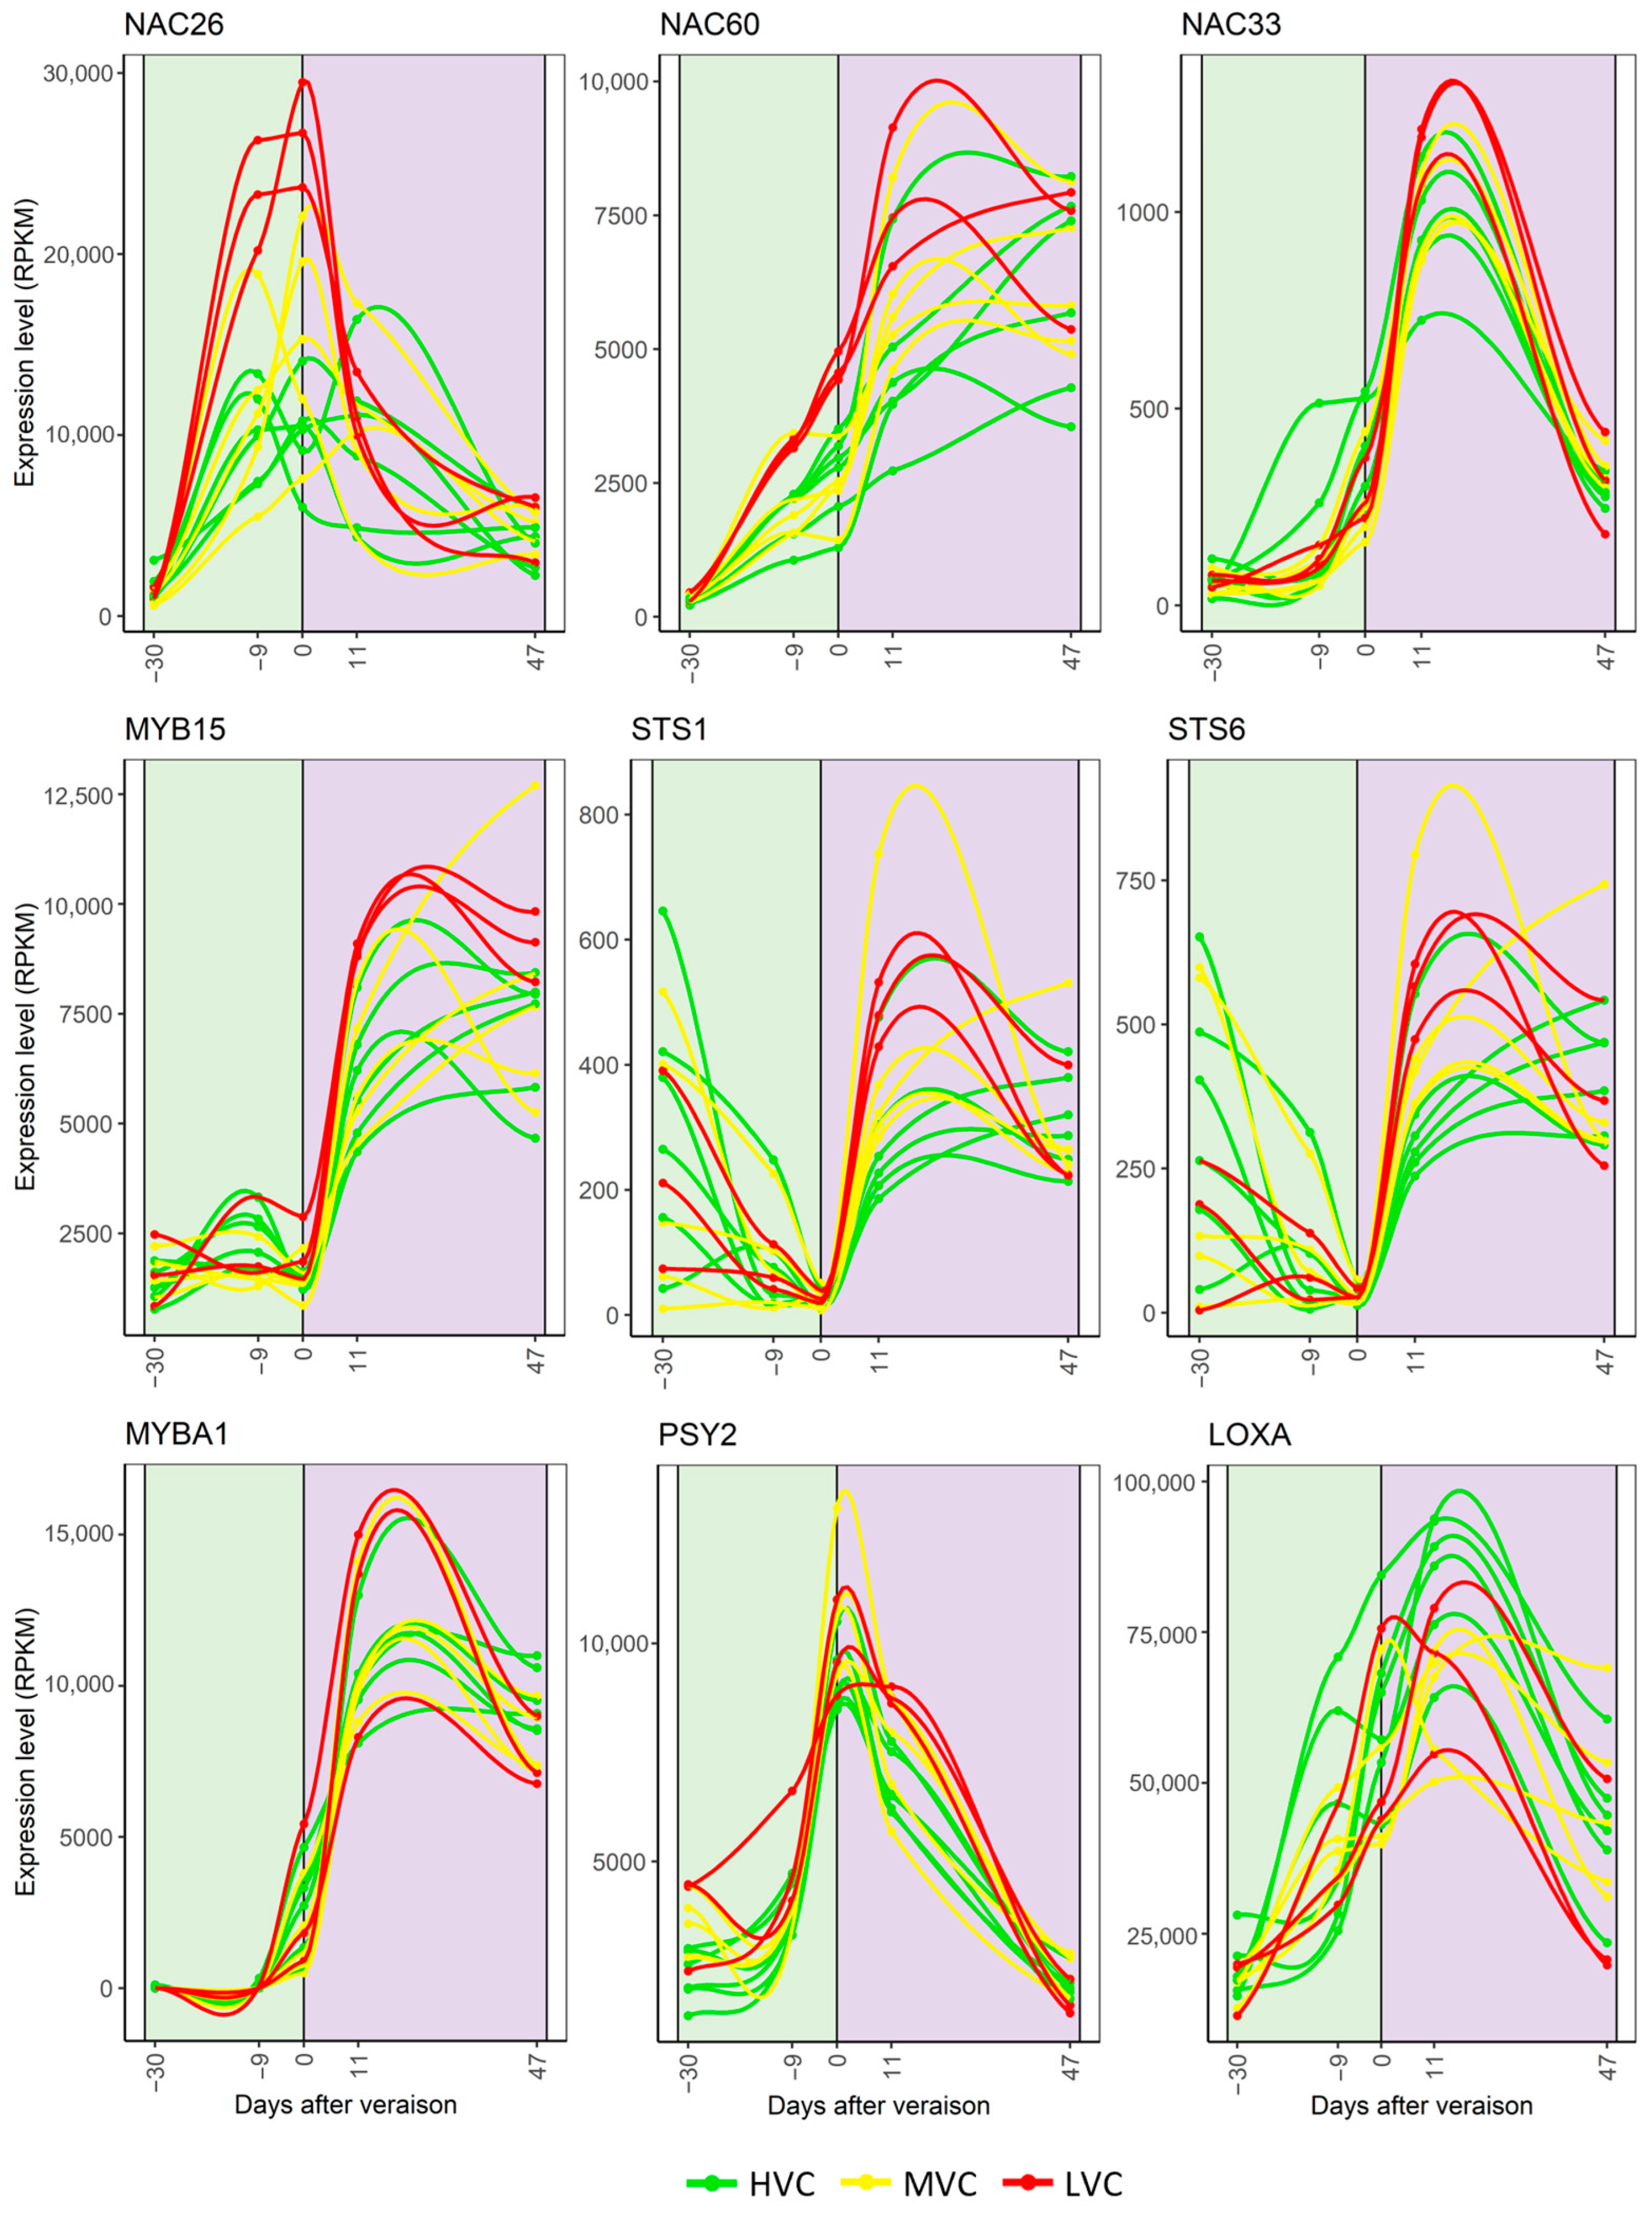
We explored the transcriptomic dataset, looking for genes with key roles in berry ripening that showed distinct expression patterns between blocks classified as HVC, MVC, and LVC. Among these, three members of the NAC transcription factors family were included: VviNAC26 (Vitvi01g01038), VviNAC33 (Vitvi19g01484), and VviNAC60 (Vitvi08g01843) [47], which were previously defined as switch genes, namely master regulators of the berry transition from the vegetative to the mature phase [48]. These genes are characterized by drastic upregulation at or near veraison, which is correlated with the shutdown of primary metabolic pathways active during the vegetative growth of the berry [27]. In our results, the expression peak described for these genes was higher in LVC and likely determined an enhanced effect on the downstream ripening processes they control (Figure 3). VviNAC26 was demonstrated to undergo large expression variations under different abiotic stresses [47]; hence, it is reasonable that its expression level would be affected by vineyard variability. Tello et al. [49] reported associations between a set of VviNAC26 polymorphisms and several berry size parameters. The authors suggested that specific polymorphisms reduce the expression of VviNAC26, resulting in lowered biosynthesis of the ripening phytohormone abscisic acid (ABA), in turn leading to larger berries. Our results support these indications, as low, medium, and high berry weights observed, respectively, under LVC, MVC, and HVC, were inversely related to the expression levels of VviNAC26 throughout berry maturation (Figure 3 and Figure S1). To better visualize the intra-vineyard variability in VviNAC26 expression, a spatial variability map was generated by interpolating the expression data of the 14 blocks at veraison (0 DAV), the time point at which gene expression levels were most variable across the sampling blocks (Figure 4). The map does, indeed, show a generalized inversed gene expression level pattern compared to vine vigor and berry weight maps (Figure 1b,c). VviNAC33 promotes organ de-greening and represses organ growth during the vegetative-to-mature phase transition, whereas VviNAC60 is a regulator of whole plant senescence- and ripening-related processes [50,51]. VviNAC33 and VviNAC60 showed the largest differences by vigor class when their expression peaked at 11 DAV (Figure 3), which was, in fact, the time point used for map generation. The VviNAC60 map mirrored both the vigor class and VviNAC26 maps, whereas the VviNAC33 map did not match as well (Figure 1b and Figure 4). This could be attributed to the fact that the VviNAC33 gene showed less variability in the vineyard, in agreement with previous reports [50].
The transcriptomic analysis revealed other interesting players in key ripening metabolisms, which showed differential expression among different vigor classes. VviMYB15 (Vitvi05g01733) and VviMYBA1 (Vitvi02g01019) belong to the R2R3MYB family of transcription factors and control different branches of the phenylpropanoid pathway during berry ripening: VviMYB15 regulates the biosynthesis of stilbenes by controlling the expression of stilbene synthases (STSs) [52], whereas VviMYBA1 targets anthocyanin-related biosynthetic genes and, therefore, controls the accumulation of these pigments [53]. Our results showed higher expression peaks for the VviMYB15, VviSTS1 (Vitvi10g01595), VviSTS6 (Vitvi10g01599), and VviMYBA1 genes in LVC at 11 DAV, which was consistent with VviNAC60 and VviNAC33 expression patterns (Figure 3). Their spatial expression variability maps at 11 DAV emphasize similarities in their intra-vineyard variation patterns, which match the variation in the vine vigor across the vineyard (Figure 1b and Figure 4). Notably, the spatial variability map generated for VviMYBA1 expression was consistent with the changes in anthocyanin content in the grapes at harvest (Figure 1c), suggesting the causal relation between metabolite content and expression extent of the regulative gene.
The structural gene phytoene synthase (VviPSY2; Vitvi12g00084) regulates a crucial step in the biosynthesis of carotenoids and has been reported to peak around veraison [54]. Consistently, our results showed VviPSY2 peaking at 0 DAV, higher in LVC compared to HVC. However, the highest expression variability between the blocks was observed at −30 DAV when the interpolated VviPSY2 map was similar to the vigor class one (Figure 1b and Figure 4). Moreover, the VviPSY2 gene expression map presented great similarity to the spatialization of β-damascenone content in berries at harvest (Figure 1c). This compound is the product of carotenoid degradation by carotenoid cleavage dioxygenase (VviCCD4b; Vitvi02g01288) [55], whose expression level was much the same across the vineyard (not shown), hinting that high β-damascenone in LVC is the result of greater starting concentration of carotenoids, rather than their enhanced degradation. Regardless, expression of the VviPSY2 gene shows potential as a predictor of intra-vineyard phenotypic variability in ripe berries, already present at very early stages of fruit development. Lipoxygenases are structural genes responsible for the metabolism of the polyunsaturated fatty acids (PUFAs), which is triggered by tissue disruption [56]. VviLOXA (Vitvi06g00158) was identified as a switch gene and suggested to participate in berry cell enlargement, occurring during the maturation phase [57]. Our results showed divergent VviLOXA expression curves across the vineyard blocks. Sharper and higher expression peaks featured HVC at 11 DAV, when the spatial expression variability map of this gene resembled the most to the vigor map, suggesting the enhancement of berry cell expansion in HVC during ripening (Figure 1b and Figure 4). C6 compounds are among the main products of the PUFAs degradation and were, in fact, found to be more concentrated in HVC and spatially distributed in a similar fashion to VviLOXA (Figure 1c).

3.3. Spatial Variability in Berry Ripening Transcriptomic Program

To explore more general differences in the developmental program of berries collected from the different blocks, the whole transcriptomic dataset (14 blocks × 5 time points, 70 samples in total; Supplementary Dataset S2) was investigated by PCA (Figure S2). The first component (Dim1) showed a clear separation in accordance with sampling time points, whereas the second compound (Dim2) mainly described transient changes in gene expression and no clear effect attributable to NDVI. Aiming at unraveling transcriptomic changes related to opposite vigor levels, we reduced the dataset to the grape transcriptomes derived from the six vineyard blocks showing the lowest (2, 3, and 5) and highest (6, 11, and 12) NDVI values, which were defined as low and high vigor status (LVS and HVS, respectively). In the resulting PCA (Figure 5a), Dim1 accounted for 30.6% of the variance and again separated samples according to maturation stages, whereas Dim2 provided a minor contribution to the overall variance (12.6%). Notwithstanding, a distribution along Dim2 by vigor level was observed within the sample group corresponding to 11 DAV. This time point was further examined in an ensuing PCA applied only on 11 DAV samples which results clearly distinguished HVS and LVS samples along Dim1 (Figure 5b). Although at each time point, grape samples were collected the same day across the vineyard, we argue that, in the PCA of samples collected on 11 DAV, Dim1 likely discriminates differences related to berry phenology, which we discussed being affected by variation in vine vigor (Figure S1).
Taking advantage of detailed grapevine fruit transcriptomic data, a molecular phenology scale (MPhS) was recently built [32]. This tool allows mapping the progression of fruit development by molecular instead of classical time- or phenotype-based approaches. Here, we used the MPhS to classify the averaged phenological stage of berries from HVS and LVS at all five collection time points. This approach revealed a clear shift in the developmental stage of these berries. Grapes from LVS showed an advancement in the ripening stage starting from 11 DAV that held true until harvest (47 DAV) in comparison with those from HVS vines (Figure 5c). This result adds value to the choice of focusing much of the analysis on the transcriptomic changes occurring 11 DAV. Regardless, a slight difference was also observed for the molecular phenological classification −30 DAV time point, which overlapped with −9 DAV time point for HVS.
Further characterization of the molecular events on the basis of the differences observed 11 DAV consisted in the identification of the DEGs between HVS and LVS (Supplementary Dataset S2). A total of 2084 DEGs (t-test; p < 0.05) found correspondence in the most recent genome annotation (VITVI V3 code), of which 968 passed the filtering by |FC| ≥ 1.5. DEGs with significantly greater expression in LVS berries (207 genes) were functionally in phenylalanine metabolism and biosynthesis of secondary metabolites (Gene Ontology (GO) enrichment analysis; Figure S3). On the contrary, DEGs with higher expression in HVS berries (761 genes) were involved in photosynthesis mechanisms (Figure S4).
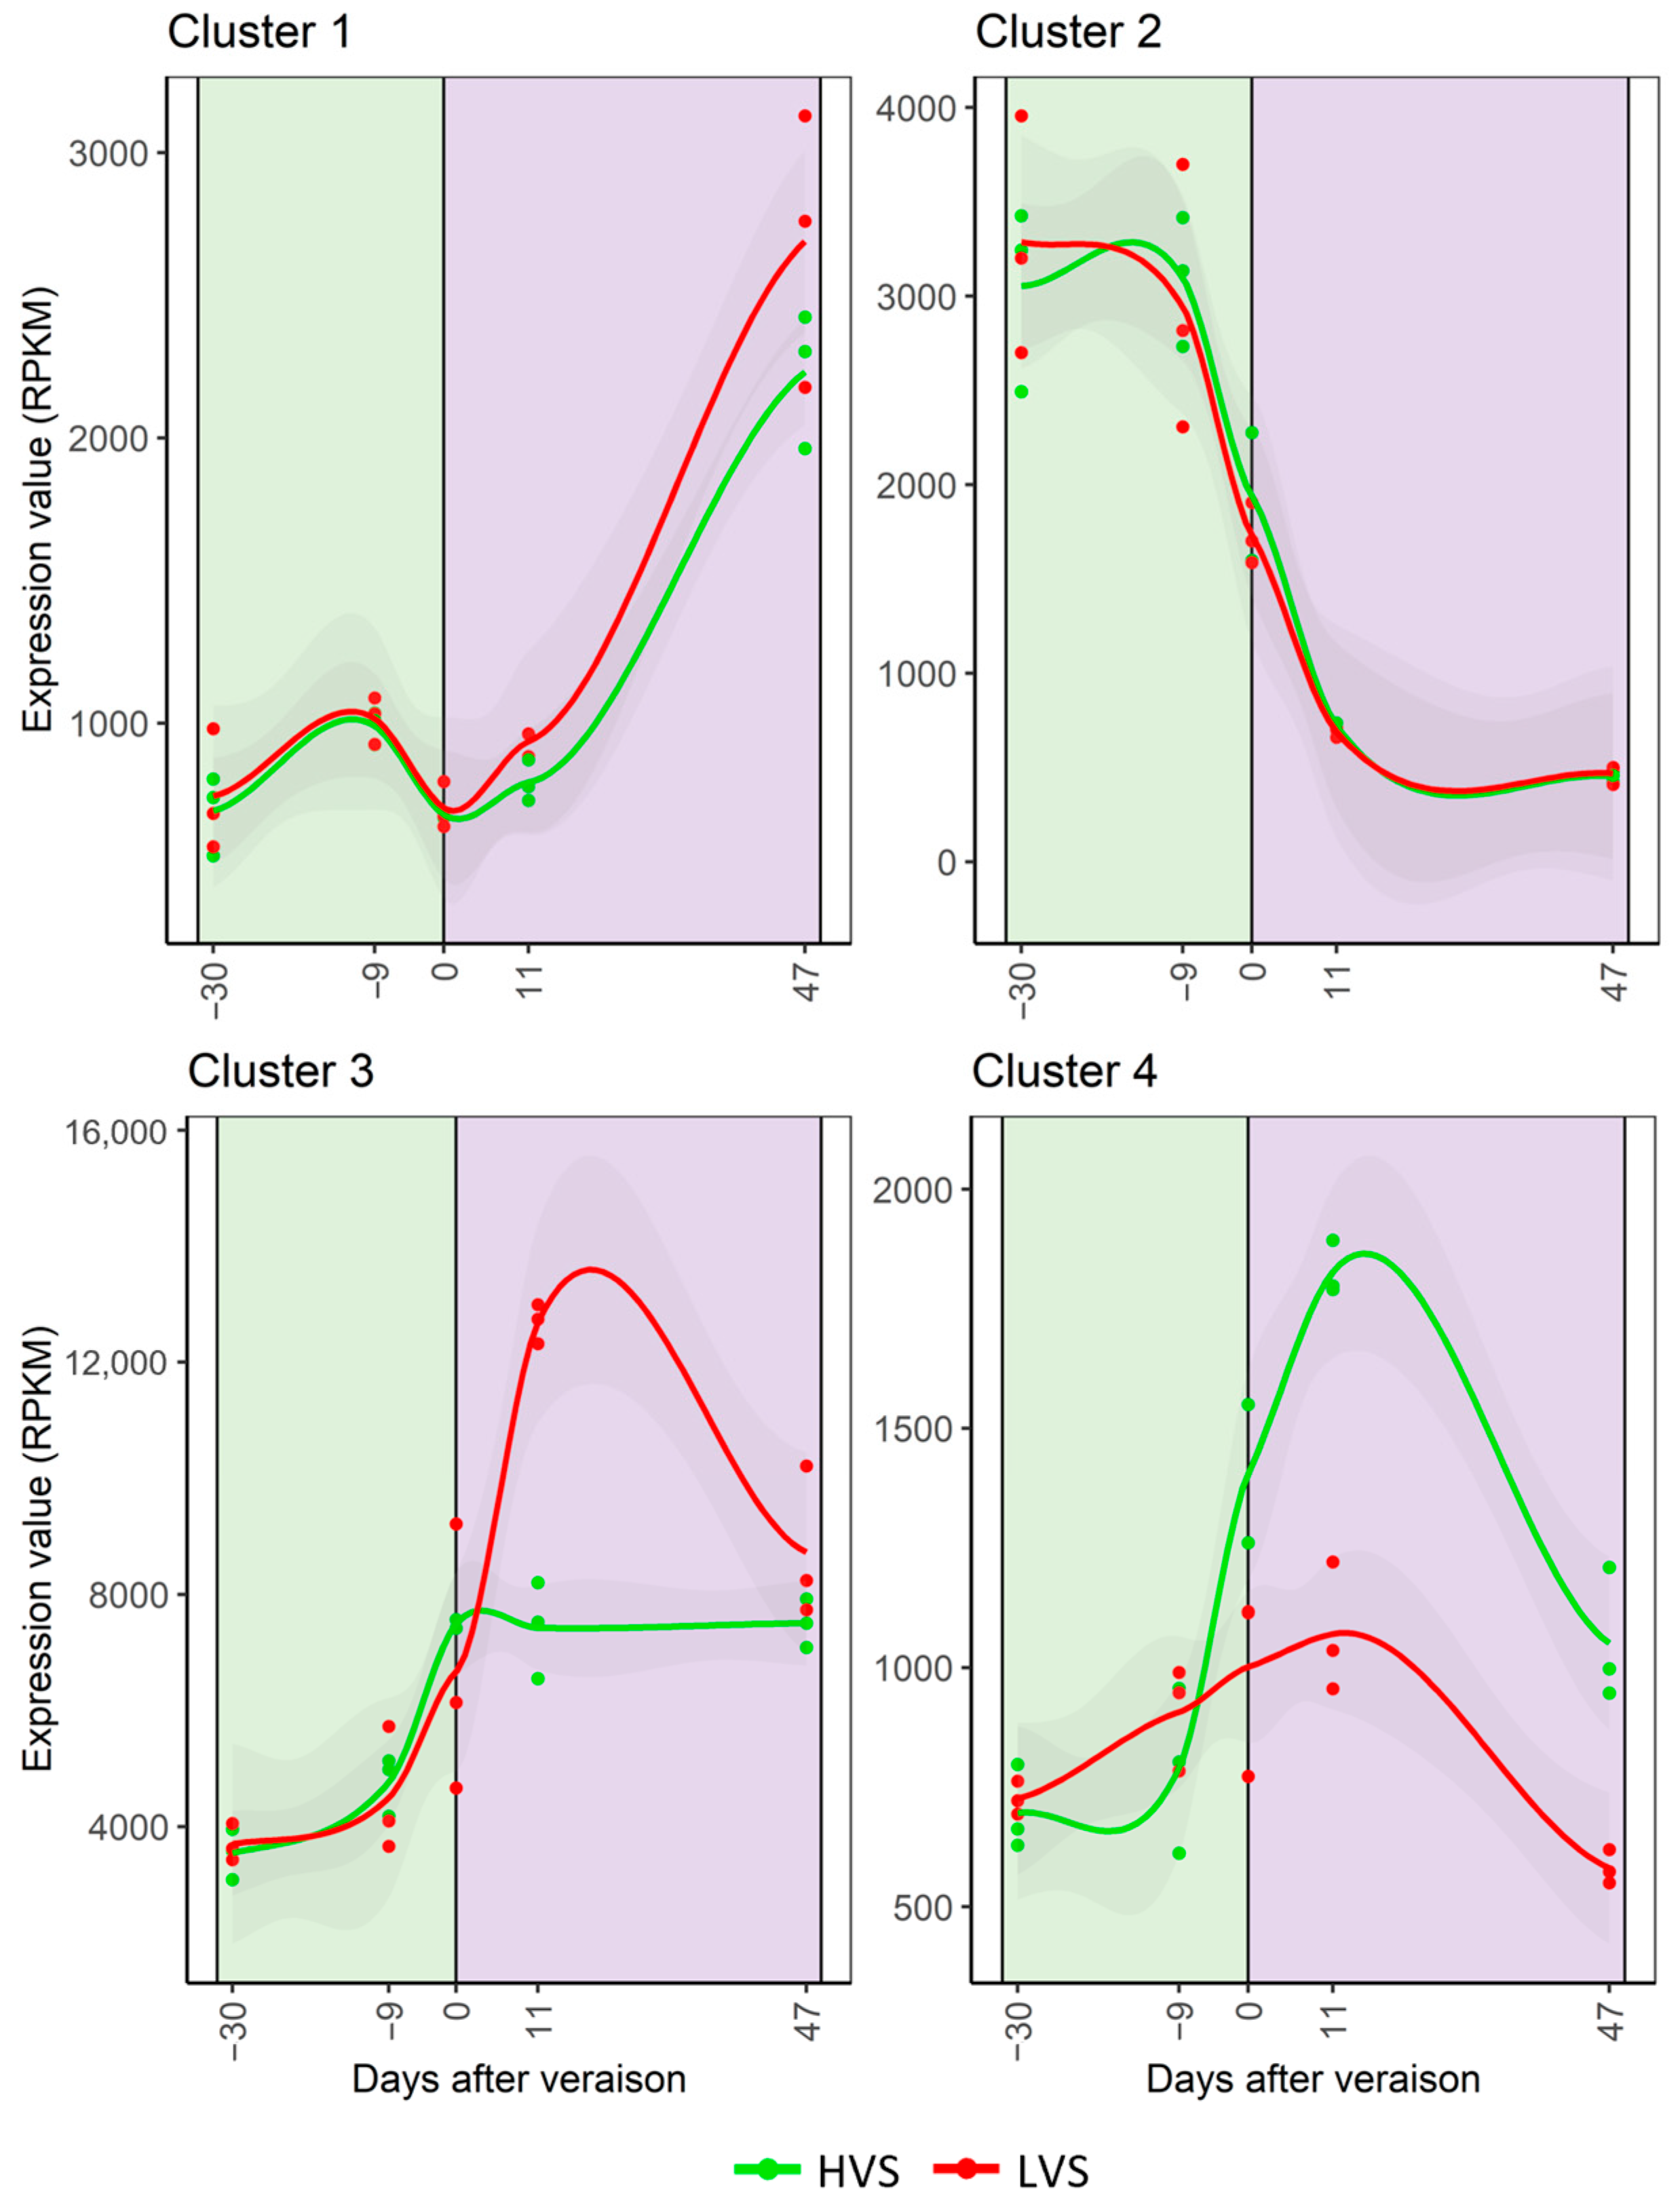
The expression patterns of the 968 DEGs (t-test; p < 0.05; |FC| ≥ 1.5) were represented by four main trends determined by cluster analysis (Figure 6; Supplementary Dataset S3). Clusters 1 and 2 were the most abundant, containing 311 and 406 genes, respectively. Cluster 1 included genes whose expression patterns showed a low peak before veraison followed by an upward trend thereafter in both vigor statuses. Based on their augmented expression from veraison, these genes can be considered among the players of late-ripening stages, in accordance with those similarly categorized in a transcriptomic survey that defined the molecular events marking the onset of grapevine berry ripening [27]. Two TFs were found in Cluster 1, VviLBDla3 (Vitvi15g00735) and VviNAC61 (Vitvi08g01841). VviLBDla3 encodes for a LOB TF already reported to be a molecular marker of the vegetative to mature transition [48], whereas VviNAC61 is a NAC TF, recently proposed as a key regulator of late- and post-ripening related processes [58]. It was demonstrated that VviNAC61 governs stilbenoid metabolism, and, in fact, this gene appeared in Cluster 1 along with a stilbene synthase (VviSTS43; Vitvi16g01480) and two laccases (Vitvi18g03027, Vitvi18g03356) that are also thought to be putatively involved in stilbene oligomerization and recently were assigned to a stilbene-related gene regulatory network [59]. We observed that from veraison onwards, genes belonging to Cluster 1 reached a higher expression level in LVS. This finding is in line with the data shown in Figure 3 and supports the hypothesis that the expression of ripening-related genes is enhanced in LVS. Cluster 2 includes genes strongly expressed at fruit set (−30 DAV) but rapidly downregulated during development. This cluster is the most populated, supporting the claim that transcriptomic rearrangements during ripening require switching off several genes, in chorus with the upregulation of the markers for veraison. The early/pre-veraison gene cluster defined in Fasoli et al. [27] matched 52 genes belonging to Cluster 2, hence corroborating our finding (Supplementary Dataset S3). GO enrichment analysis revealed significant enrichment in genes related to primary (i.e., photosynthetic processes) and secondary metabolism (Figure S4). Unlike Cluster 1, no visible differences by degree of vigor could be observed for Cluster 2. Nevertheless, given the significance of the statistical analysis applied to extract said genes, we cannot rule out that even subtle changes in expression could have contributed to the phenotypic differences found by vine vigor.
Genes belonging to Clusters 3 and 4 displayed an increased expression level in both vigor statuses before veraison, though their trends differed markedly by vigor status from veraison onward. The 101 genes belonging to Cluster 3 had a major expression peak in LVS, 11 DAV, which then dropped, whereas, in HVS, they maintained a constant expression level until maturity. Even though no enriched category was detected by GO enrichment analysis, many TFs and several transcripts involved in transport and signal transduction were noted in Cluster 3. The TFs included two WRKY factors (Vitvi17g00102, VviWRKY52, Vitvi18g00742, VviWRKY54) and the stilbene biosynthesis regulator VviMYB15. VviMYB15 already drew attention as a marker of LVS, along with the two STS genes VviSTS1 and VviSTS6 (Figure 3). Consistently, VviSTS1 and VviSTS6 were also included in Cluster 3, with the addition of a third STS gene (Vitvi10g01391, VviSTS5). On the other hand, cluster 4 included 151 genes highly expressed in HVS from veraison onwards. Moreover, in line with the VviLOXA spatial variability map (Figure 3), three LOXs (Vitvi06g00153, Vitvi06g00155, and Vitvi06g00150) were found in this cluster, supporting the highest C6 compounds concentration detected in HVC berries (Table 1).

4. Conclusions

In this study we investigated the intra-vineyard variability of a commercial Cabernet Sauvignon vineyard combining standard precision–viticulture detection with molecular approaches. This allowed us to highlight correlations among grapevine agronomic, vegetative, reproductive, and fruit quality parameters, as well as to reveal the distinct berry molecular maturation programs associated with the different vigor classes into which the vineyard was divided. Moreover, we demonstrated the feasibility of creating spatial variability maps of the expression level of key berry ripening genes, which showed consistent patterns aligned with the vineyard vigor map. This approach evidenced that berries from different vigor zones present distinct molecular maturation programs, hence showing potential in predicting spatial variability in fruit quality. Considering the drastic reduction in costs of genome-wide expression analyses that have occurred in recent years, coupling transcriptomics with traditional precision viticulture approaches could become cost-effective and feasible in different geographical areas and ecosystems (e.g., in Europe) to obtain useful information that could assist in fine-tuning vineyard management.

Supplementary Materials

The following supporting information can be downloaded at https://www.mdpi.com/article/10.3390/horticulturae10030238/s1. Figure S1: Maturation trends of berries collected from the 14 vineyard blocks; Figure S2: Transcriptome of berries collected from high, medium, and low vigor blocks. Figure S3: Gene ontology (GO) enrichment of differentially expressed genes (t-test; p < 0.05; |FC| ≥ 1.5) between low and high vine vigor status (Supplementary Dataset S2). Figure S4: Gene ontology (GO) enrichment of differentially expressed genes (t-test; p < 0.05; |FC| ≥ 1.5) belonging to Cluster 2 (Supplementary Dataset S3). Supplementary Dataset S1: Berry sugar level and weight data. Supplementary Dataset S2: Transcriptomic dataset. Sheet “Sample label legend” reports the sample legend labels. Sheet “Normalized Dataset” reports transcriptomic data of grape samples collected from post-fruit set to maturity across the vineyard blocks. For each transcript, the Agilent Probe Name, the 12XV1 and VCOST.V3 IDs, the Gene Symbol [26], and the Gene Functional Annotation and Fluorescence values are reported. Sheet “DEGs” reports DEGs among opposite vigor status at time point 6. For each transcript, the VCOST.V3 ID, the Gene Symbol [26], and the Gene Functional Annotation and Fluorescence values are reported. Supplementary Dataset S3: Detail of the cluster analysis of the 968 differential expressed genes (t-test; p < 0.05; |FC| ≥ 1.5) during the ripening process. For each gene, the Probe Name, the VCOST.V3 ID, the Gene Symbol [26], and the Gene Functional Annotation are reported.

Author Contributions

Conceptualization, M.F., G.B.T., N.D. and L.S.; methodology and analysis, M.F., R.S., P.P., A.A., E.G. and M.M.A.; software and statistical analysis, R.S. and A.A.; writing—original draft preparation, R.S. and A.A.; writing—review and editing, G.B.T., M.F., R.S. and A.A.; supervision, M.F. and G.B.T.; funding acquisition, N.D. and L.S. All authors have read and agreed to the published version of the manuscript.

Funding

This research was funded by E. & J. Gallo Winery.

Data Availability Statement

The transcriptomic data presented in this study are openly available at GEO under the accession GSE254304.

Acknowledgments

We thank the staff of the Winegrowing Research Department (E. & J. Gallo Winery) for technical assistance and support; Cella Bioni and Nona Ebisuda for facilitating the grape sample collection and harvest; Randall Mullen for helpful discussions; and Jim O’Donnell for sharing his knowledge on grapevine and soil science.

Conflicts of Interest

Dr. Pietro Previtali, Mrs. Elizabeth Green, Dr. Luis Sanchez, Dr. Maria Mar Alsina and Dr. Nick Dokoozlian were employed by the E. & J. Gallo Winery. The remaining authors declare that the research was conducted in the absence of any commercial or financial relationships that could be construed as a potential conflict of interest.

References

  1. Tardaguila, J.; Baluja, J.; Arpon, L.; Balda, P.; Oliveira, M. Variations of soil properties affect the vegetative growth and yield components of “Tempranillo” grapevines. Precis. Agric. 2011, 12, 762–773. [Google Scholar] [CrossRef]
  2. van Leeuwen, C.; Trégoat, O.; Choné, X.; Bois, B.; Pernet, D.; Gaudillère, J.-P. Vine water status is a key factor in grape ripening and vintage quality for red Bordeaux wine. How can it be assessed for vineyard management purposes? OENO One 2009, 43, 121–134. [Google Scholar] [CrossRef]
  3. Pallas, B.; Christophe, A.; Lecoeur, J. Are the common assimilate pool and trophic relationships appropriate for dealing with the observed plasticity of grapevine development? Ann. Bot. 2009, 105, 233–247. [Google Scholar] [CrossRef]
  4. Andrew, G.R.; Justine, E.V.H. Influence of Grapevine Training Systems on Vine Growth and Fruit Composition: A Review. Am. J. Enol. Vitic. 2009, 60, 251. [Google Scholar] [CrossRef]
  5. Bramley, R.G.V.; Ouzman, J.; Boss, P.K. Variation in vine vigour, grape yield and vineyard soils and topography as indicators of variation in the chemical composition of grapes, wine and wine sensory attributes. Aust. J. Grape Wine Res. 2011, 17, 217–229. [Google Scholar] [CrossRef]
  6. dos Santos Costa, D.; Oliveros Mesa, N.F.; Santos Freire, M.; Pereira Ramos, R.; Teruel Mederos, B.J. Development of predictive models for quality and maturation stage attributes of wine grapes using vis-nir reflectance spectroscopy. Postharvest Biol. Technol. 2019, 150, 166–178. [Google Scholar] [CrossRef]
  7. Sassu, A.; Gambella, F.; Ghiani, L.; Mercenaro, L.; Caria, M.; Pazzona, A.L. Advances in Unmanned Aerial System Remote Sensing for Precision Viticulture. Sensors 2021, 21, 956. [Google Scholar] [CrossRef]
  8. Lyu, H.; Grafton, M.; Ramilan, T.; Irwin, M.; Wei, H.-E.; Sandoval, E. Using Remote and Proximal Sensing Data and Vine Vigor Parameters for Non-Destructive and Rapid Prediction of Grape Quality. Remote Sens. 2023, 15, 5412. [Google Scholar] [CrossRef]
  9. Moral, F.J.; Rebollo, F.J.; Serrano, J. Using a Non-Contact Sensor to Delineate Management Zones in Vineyards and Validation with the Rasch Model. Sensors 2023, 23, 9183. [Google Scholar] [CrossRef]
  10. Gatti, M.; Schippa, M.; Garavani, A.; Squeri, C.; Frioni, T.; Dosso, P.; Poni, S. High potential of variable rate fertilization combined with a controlled released nitrogen form at affecting cv. Barbera vines behavior. Eur. J. Agron. 2020, 112, 125949. [Google Scholar] [CrossRef]
  11. Pereyra, G.; Pellegrino, A.; Gaudin, R.; Ferrer, M. Evaluation of site-specific management to optimise Vitis vinifera L. (cv. Tannat) production in a vineyard with high heterogeneity. OENO One 2022, 56, 397–412. [Google Scholar] [CrossRef]
  12. Bramley, R.G.V.; Ouzman, J.; Thornton, C. Selective harvesting is a feasible and profitable strategy even when grape and wine production is geared towards large fermentation volumes. Aust. J. Grape Wine Res. 2011, 17, 298–305. [Google Scholar] [CrossRef]
  13. Baca-Bocanegra, B.; Hernández-Hierro, J.M.; Nogales-Bueno, J.; Heredia, F.J. Feasibility study on the use of a portable micro near infrared spectroscopy device for the “in vineyard” screening of extractable polyphenols in red grape skins. Talanta 2019, 192, 353–359. [Google Scholar] [CrossRef]
  14. Di Gennaro, S.F.; Matese, A. Evaluation of novel precision viticulture tool for canopy biomass estimation and missing plant detection based on 2.5D and 3D approaches using RGB images acquired by UAV platform. Plant Methods 2020, 16, 91. [Google Scholar] [CrossRef]
  15. Anastasiou, E.; Balafoutis, A.; Darra, N.; Psiroukis, V.; Biniari, A.; Xanthopoulos, G.; Fountas, S. Satellite and Proximal Sensing to Estimate the Yield and Quality of Table Grapes. Agriculture 2018, 8, 94. [Google Scholar] [CrossRef]
  16. Squeri, C.; Poni, S.; Di Gennaro, S.F.; Matese, A.; Gatti, M. Comparison and Ground Truthing of Different Remote and Proximal Sensing Platforms to Characterize Variability in a Hedgerow-Trained Vineyard. Remote Sens. 2021, 13, 2056. [Google Scholar] [CrossRef]
  17. Bramley, R.G.V.; Hamilton, R.P. Understanding variability in winegrape production systems. Aust. J. Grape Wine Res. 2004, 10, 32–45. [Google Scholar] [CrossRef]
  18. Fiorillo, E.; Crisci, A.; De Filippis, T.; Di Gennaro, S.F.; Di Blasi, S.; Matese, A.; Primicerio, J.; Vaccari, F.P.; Genesio, L. Airborne high-resolution images for grape classification: Changes in correlation between technological and late maturity in a Sangiovese vineyard in Central Italy. Aust. J. Grape Wine Res. 2012, 18, 80–90. [Google Scholar] [CrossRef]
  19. Kasimati, A.; Espejo-Garcia, B.; Vali, E.; Malounas, I.; Fountas, S. Investigating a selection of methods for the prediction of total soluble solids among wine grape quality characteristics using normalized difference vegetation index data from proximal and remote sensing. Front. Plant Sci. 2021, 12, 683078. [Google Scholar] [CrossRef]
  20. Lamb, D.W.; Weedon, M.M.; Bramley, R.G.V. Using remote sensing to predict grape phenolics and colour at harvest in a Cabernet Sauvignon vineyard: Timing observations against vine phenology and optimising image resolution. Aust. J. Grape Wine Res. 2004, 10, 46–54. [Google Scholar] [CrossRef]
  21. García-Estévez, I.; Quijada-Morín, N.; Rivas-Gonzalo, J.C.; Martínez-Fernández, J.; Sánchez, N.; Herrero-Jiménez, C.M.; Escribano-Bailón, M.T. Relationship between hyperspectral indices, agronomic parameters and phenolic composition of Vitis vinifera cv Tempranillo grapes. J. Sci. Food Agric. 2017, 97, 4066–4074. [Google Scholar] [CrossRef]
  22. Bonilla, I.; Martinez de Toda, F.; Martínez-Casasnovas, J.A. Vine vigor, yield and grape quality assessment by airborne remote sensing over three years: Analysis of unexpected relationships in cv. Tempranillo. Span. J. Agric. Res. 2015, 13, e0903. [Google Scholar] [CrossRef]
  23. Savoi, S.; Santiago, A.; Orduña, L.; Matus, J.T. Transcriptomic and metabolomic integration as a resource in grapevine to study fruit metabolite quality traits. Front. Plant Sci. 2022, 13, 937927. [Google Scholar] [CrossRef] [PubMed]
  24. Waterhouse, A.L.; Price, S.F.; McCord, J.D. Reversed-phase high-performance liquid chromatography methods for analysis of wine polyphenols. In Methods in Enzymology; Elsevier: Amsterdam, The Netherlands, 1999; Volume 299, pp. 113–121. [Google Scholar]
  25. Previtali, P.; Dokoozlian, N.K.; Pan, B.S.; Wilkinson, K.L.; Ford, C.M. Crop Load and Plant Water Status Influence the Ripening Rate and Aroma Development in Berries of Grapevine (Vitis vinifera L.) cv. Cabernet Sauvignon. J. Agric. Food Chem. 2021, 69, 7709–7724. [Google Scholar] [CrossRef] [PubMed]
  26. Kotseridis, Y.; Baumes, R.L.; Skouroumounis, G.K. Quantitative determination of free and hydrolytically liberated beta-damascenone in red grapes and wines using a stable isotope dilution assay. J. Chromatogr. A 1999, 849, 245–254. [Google Scholar] [CrossRef] [PubMed]
  27. Fasoli, M.; Richter, C.L.; Zenoni, S.; Bertini, E.; Vitulo, N.; Dal Santo, S.; Dokoozlian, N.; Pezzotti, M.; Tornielli, G.B. Timing and Order of the Molecular Events Marking the Onset of Berry Ripening in Grapevine. Plant Physiol. 2018, 178, 1187–1206. [Google Scholar] [CrossRef] [PubMed]
  28. Navarro-Payá, D.; Santiago, A.; Orduña, L.; Zhang, C.; Amato, A.; D’Inca, E.; Fattorini, C.; Pezzotti, M.; Tornielli, G.B.; Zenoni, S.; et al. The Grape Gene Reference Catalogue as a Standard Resource for Gene Selection and Genetic Improvement. Front. Plant Sci. 2022, 12, 803977. [Google Scholar] [CrossRef] [PubMed]
  29. Scrucca, L.; Fraley, C.; Murphy, T.; Raftery, A.E. Model-Based Clustering, Classification, and Density Estimation Using Mclust in R, 1st ed.; Chapman and Hall/CRC: New York, NY, USA, 2023. [Google Scholar]
  30. Ge, S.X.; Jung, D.; Yao, R. ShinyGO: A graphical gene-set enrichment tool for animals and plants. Bioinformatics 2019, 36, 2628–2629. [Google Scholar] [CrossRef] [PubMed]
  31. Kaufman, L.; Rousseeuw, P. Finding Groups in Data: An Introduction to Cluster Analysis; John Wiley & Sons: Hoboken, NJ, USA, 1990. [Google Scholar]
  32. Tornielli, G.B.; Sandri, M.; Fasoli, M.; Amato, A.; Pezzotti, M.; Zuccolotto, P.; Zenoni, S. A molecular phenology scale of grape berry development. Hortic. Res. 2023, 10, uhad048. [Google Scholar] [CrossRef]
  33. Smart, R.E.; Dick, J.K.; Gravett, I.M.; Fisher, B.M. Canopy Management to Improve Grape Yield and Wine Quality—Principles and Practices. S. Afr. J. Enol. Vitic. 2017, 11, 3–17. [Google Scholar] [CrossRef]
  34. Dobrowski, S.Z.; Ustin, S.L.; Wolpert, J.A. Grapevine dormant pruning weight prediction using remotely sensed data. Aust. J. Grape Wine Res. 2003, 9, 177–182. [Google Scholar] [CrossRef]
  35. Conde, C.; Silva, P.; Fontes, N.; Dias, A.C.P.; Tavares, R.M.; Sousa, M.J.; Agasse, A.; Delrot, S.; Gerós, H. Biochemical Changes throughout Grape Berry Development and Fruit and Wine Quality. Food 2007, 1, 1–22. [Google Scholar]
  36. Kalua, C.M.; Boss, P.K. Evolution of Volatile Compounds during the Development of Cabernet Sauvignon Grapes (Vitis vinifera L.). J. Agric. Food Chem. 2009, 57, 3818–3830. [Google Scholar] [CrossRef] [PubMed]
  37. Castellarin, S.D.; Matthews, M.A.; Di Gaspero, G.; Gambetta, G.A. Water deficits accelerate ripening and induce changes in gene expression regulating flavonoid biosynthesis in grape berries. Planta 2007, 227, 101–112. [Google Scholar] [CrossRef] [PubMed]
  38. Rienth, M.; Vigneron, N.; Darriet, P.; Sweetman, C.; Burbidge, C.; Bonghi, C.; Walker, R.P.; Famiani, F.; Castellarin, S.D. Grape Berry Secondary Metabolites and Their Modulation by Abiotic Factors in a Climate Change Scenario—A Review. Front. Plant Sci. 2021, 12, 643258. [Google Scholar] [CrossRef] [PubMed]
  39. Palai, G.; Caruso, G.; Gucci, R.; D’Onofrio, C. Berry flavonoids are differently modulated by timing and intensities of water deficit in Vitis vinifera L. cv. Sangiovese. Front. Plant Sci. 2022, 13, 1040899. [Google Scholar] [CrossRef]
  40. Cortell, J.M.; Halbleib, M.; Gallagher, A.V.; Righetti, T.L.; Kennedy, J.A. Influence of Vine Vigor on Grape (Vitis vinifera L. Cv. Pinot Noir) Anthocyanins. 1. Anthocyanin Concentration and Composition in Fruit. J. Agric. Food Chem. 2007, 55, 6575–6584. [Google Scholar] [CrossRef]
  41. Cortell, J.M.; Halbleib, M.; Gallagher, A.V.; Righetti, T.L.; Kennedy, J.A. Influence of Vine Vigor on Grape (Vitis vinifera L. Cv. Pinot Noir) and Wine Proanthocyanidins. J. Agric. Food Chem. 2005, 53, 5798–5808. [Google Scholar] [CrossRef]
  42. Yu, R.; Brillante, L.; Martínez-Lüscher, J.; Kurtural, S.K. Spatial Variability of Soil and Plant Water Status and Their Cascading Effects on Grapevine Physiology Are Linked to Berry and Wine Chemistry. Front. Plant Sci. 2020, 11, 790. [Google Scholar] [CrossRef]
  43. Martínez-Lüscher, J.; Brillante, L.; Kurtural, S.K. Flavonol Profile Is a Reliable Indicator to Assess Canopy Architecture and the Exposure of Red Wine Grapes to Solar Radiation. Front. Plant Sci. 2019, 10, 10. [Google Scholar] [CrossRef]
  44. Verdenal, T.; Dienes-Nagy, Á.; Spangenberg, J.E.; Zufferey, V.; Spring, J.L.; Viret, O.; Marin-Carbonne, J.; van Leeuwen, C. Understanding and managing nitrogen nutrition in grapevine: A review. OENO One 2021, 55, 1–43. [Google Scholar] [CrossRef]
  45. Sams, B.; Bramley, R.G.V.; Sanchez, L.; Dokoozlian, N.; Ford, C.; Pagay, V. Remote Sensing, Yield, Physical Characteristics, and Fruit Composition Variability in Cabernet Sauvignon Vineyards. Am. J. Enol. Vitic. 2022, 73, 93–105. [Google Scholar] [CrossRef]
  46. Coombe, B.G.; McCarthy, M.G. Dynamics of grape berry growth and physiology of ripening. Aust. J. Grape Wine Res. 2000, 6, 131–135. [Google Scholar] [CrossRef]
  47. Wang, N.; Zheng, Y.; Xin, H.; Fang, L.; Li, S. Comprehensive analysis of NAC domain transcription factor gene family in Vitis vinifera. Plant Cell Rep. 2013, 32, 61–75. [Google Scholar] [CrossRef]
  48. Palumbo, M.C.; Zenoni, S.; Fasoli, M.; Massonnet, M.; Farina, L.; Castiglione, F.; Pezzotti, M.; Paci, P. Integrated network analysis identifies fight-club nodes as a class of hubs encompassing key putative switch genes that induce major transcriptome reprogramming during grapevine development. Plant Cell 2014, 26, 4617–4635. [Google Scholar] [CrossRef] [PubMed]
  49. Tello, J.; Torres-Pérez, R.; Grimplet, J.; Carbonell-Bejerano, P.; Martínez-Zapater, J.M.; Ibáñez, J. Polymorphisms and minihaplotypes in the VvNAC26 gene associate with berry size variation in grapevine. BMC Plant Biol. 2015, 15, 253. [Google Scholar] [CrossRef]
  50. D’Incà, E.; Cazzaniga, S.; Foresti, C.; Vitulo, N.; Bertini, E.; Galli, M.; Gallavotti, A.; Pezzotti, M.; Battista Tornielli, G.; Zenoni, S. VviNAC33 promotes organ de-greening and represses vegetative growth during the vegetative-to-mature phase transition in grapevine. New Phytol. 2021, 231, 726–746. [Google Scholar] [CrossRef] [PubMed]
  51. D’Incà, E.; Foresti, C.; Orduña, L.; Amato, A.; Vandelle, E.; Santiago, A.; Botton, A.; Cazzaniga, S.; Bertini, E.; Pezzotti, M.; et al. The transcription factor VviNAC60 regulates senescence- and ripening-related processes in grapevine. Plant Physiol. 2023, 192, 1928–1946. [Google Scholar] [CrossRef]
  52. Höll, J.; Vannozzi, A.; Czemmel, S.; D’Onofrio, C.; Walker, A.R.; Rausch, T.; Lucchin, M.; Boss, P.K.; Dry, I.B.; Bogs, J. The R2R3-MYB transcription factors MYB14 and MYB15 regulate stilbene biosynthesis in Vitis vinifera. Plant Cell 2013, 25, 4135–4149. [Google Scholar] [CrossRef] [PubMed]
  53. Walker, A.R.; Lee, E.; Bogs, J.; McDavid, D.A.J.; Thomas, M.R.; Robinson, S.P. White grapes arose through the mutation of two similar and adjacent regulatory genes. Plant J. 2007, 49, 772–785. [Google Scholar] [CrossRef] [PubMed]
  54. Young, P.R.; Lashbrooke, J.G.; Alexandersson, E.; Jacobson, D.; Moser, C.; Velasco, R.; Vivier, M.A. The genes and enzymes of the carotenoid metabolic pathway in Vitis vinifera L. BMC Genom. 2012, 13, 243. [Google Scholar] [CrossRef] [PubMed]
  55. Lashbrooke, J.G.; Young, P.R.; Dockrall, S.J.; Vasanth, K.; Vivier, M.A. Functional characterisation of three members of the Vitis vinifera L. carotenoid cleavage dioxygenase gene family. BMC Plant Biol. 2013, 13, 156. [Google Scholar] [CrossRef] [PubMed]
  56. Matsui, K. Green leaf volatiles: Hydroperoxide lyase pathway of oxylipin metabolism. Curr. Opin. Plant Biol. 2006, 9, 274–280. [Google Scholar] [CrossRef] [PubMed]
  57. Podolyan, A.; White, J.; Jordan, B.; Winefield, C. Identification of the lipoxygenase gene family from Vitis vinifera and biochemical characterisation of two 13-lipoxygenases expressed in grape berries of Sauvignon Blanc. Funct. Plant Biol. 2010, 37, 767–784. [Google Scholar] [CrossRef]
  58. Foresti, C.; Orduña, L.; Matus, J.T.; Vandelle, E.; Danzi, D.; Bellon, O.; Tornielli, G.B.; Amato, A.; Zenoni, S. NAC61 regulates late- and post-ripening osmotic, oxidative, and biotic stress responses in grapevine. J. Exp. Bot. 2023, erad507. [Google Scholar] [CrossRef]
  59. Pilati, S.; Malacarne, G.; Navarro-Payá, D.; Tomè, G.; Riscica, L.; Cavecchia, V.; Matus, J.T.; Moser, C.; Blanzieri, E. Vitis OneGenE: A Causality-Based Approach to Generate Gene Networks in Vitis vinifera Sheds Light on the Laccase and Dirigent Gene Families. Biomolecules 2021, 11, 1744. [Google Scholar] [CrossRef]
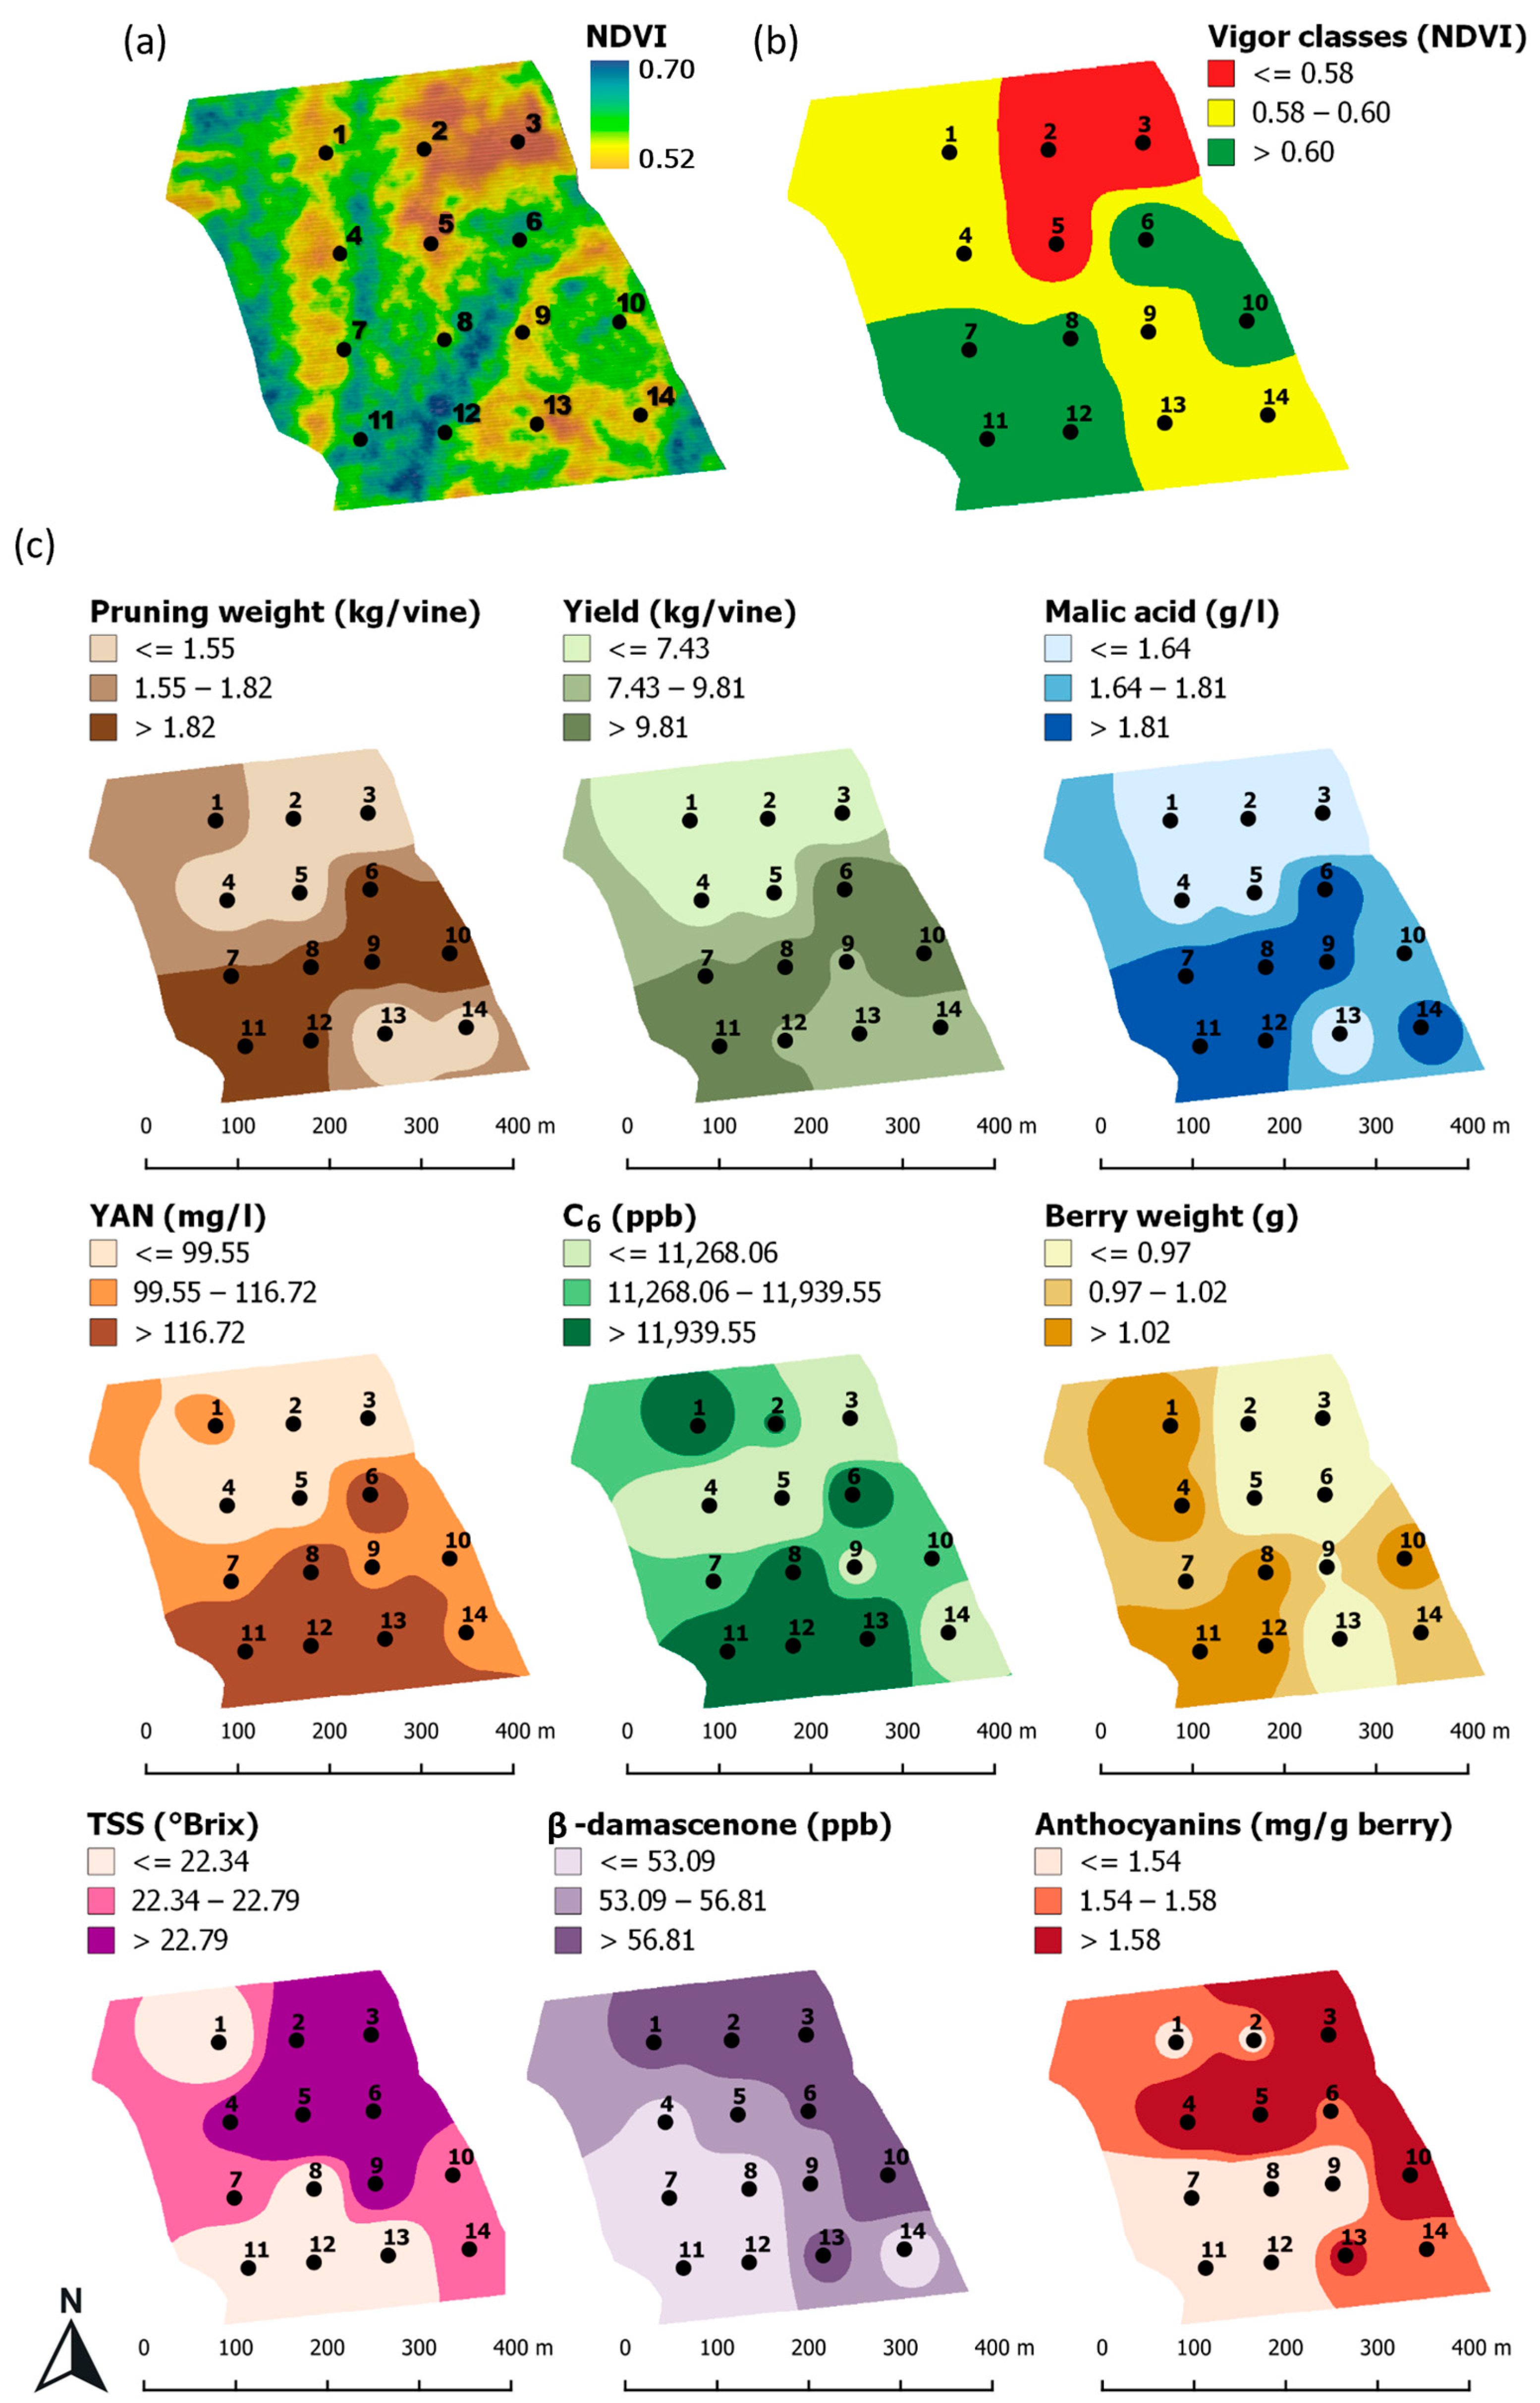
Figure 1. Spatial variability maps. (a) Normalized difference vegetation index (NDVI) map generated from a multispectral image. (b) Vigor class map interpolated from NDVI values extracted for each block (c). Interpolated maps of vine and berry parameters measured at each block. All interpolations followed inverse distance weighting and quantile classification methods. YAN: Yeast assimilable nitrogen. TSS: Total soluble solids. Numbers from 1 to 14 indicate vineyard blocks.
Horticulturae 10 00238 g001
Figure 2. Pearson’s correlation coefficient matrix for parameters measured at each block during the growing seasons. Hierarchical cluster analysis was applied to the measured parameters using the average linkage method. Asterisks represent statistically significant correlations based on t-test (p ≤ 0.05 = *; p ≤ 0.01 = **; p ≤ 0.001 = ***). NDVI: Normalized difference vegetation index. LAI: Leaf area index. TSS: Total soluble solids. YAN: Yeast assimilable nitrogen.
Horticulturae 10 00238 g002
Figure 3. Expression trends of key genes involved in berry maturation. Line graphs were created using data from each block and were plotted by days after veraison (DAV). LVC: low vigor class. MVC: medium vigor class. HVC: high vigor class.
Horticulturae 10 00238 g003
Figure 4. Spatial gene expression variability maps. Gene expression levels (RPKM, reads per kilobase per million mapped reads) measured in berries collected from the vineyard blocks were interpolated at a specific time point, indicated as days after veraison (DAV). Interpolations followed inverse distance weighting and quantile classification methods. Numbers from 1 to 14 indicate the vineyard blocks.
Horticulturae 10 00238 g004
Figure 5. Transcriptome of berries collected from six blocks showing the highest (HVS) and lowest (LVS) vigor status. (a) PCA scatterplot of transcriptomic data of each sampling location (block) at five time points during berry development by days after veraison (DAV). Purple circles indicate a single time point. (b) PCA scatterplot of transcriptomic data of each sampling location (block) at 11 DAV. (c) Schematic showing the mapping of the averaged transcriptomic data from HVS and LVS blocks at the five collection time points onto the MPhS.
Horticulturae 10 00238 g005
Figure 6. Main expression trends of differentially expressed genes between the six blocks showing the highest (HVS) and lowest (LVS) vigor status. Line graphs represent the average expression trends of 311 (Cluster 1), 406 (Cluster 2), 101 (Cluster 3), and 151 (Cluster 4) differentially expressed genes (t-test; p < 0.05; |FC| ≥ 1.5) by HVS and LVS plotted by days after veraison.
Horticulturae 10 00238 g006
Table 1. Parameters measured at the 14 vineyard blocks during the growing seasons.
VigorBlockNDVI LAILeaf Water Potential (mPa)Pruning Weight (kg/Vine)Berry Weight (g)Yield (kg/Vine)TSS (°Brix)Malic Acid (g/L)Anthocyanins (mg/g Berry)Tannins (ppm) YAN (mg/L)C6 Compounds (ppb)Quercetin Glycosides (ppm)β-Damascenone (ppb)
LVC30.5403.2−0.780.830.913.8823.81.002.02388358831515962.49
LVC50.5543.0−1.221.220.855.3625.51.502.00435680704516354.55
LVC20.5673.8−0.851.440.905.7423.11.501.5134798312,09010160.95
Average 0.554 a3.3 a−0.951.16 a0.88 a4.99 a24.13 a1.33 a1.84 a390674 a9150 a141 a59.33
MVC90.5813.7−0.942.030.979.6623.51.881.38345711210,8768554.50
MVC130.5823.1−0.871.030.857.8921.21.411.61362313913,89713059.36
MVC140.5823.8−0.731.421.008.4622.81.881.54309911410,34910050.55
MVC10.5873.8−0.791.631.095.3221.11.621.52320310213,23810158.48
MVC40.5893.4−0.761.271.076.0322.91.541.66363672938511851.52
Average 0.584 b3.6 ab−0.821.48 a1.00 a7.47 a22.30 ab1.67 ab1.54 ab3404108 ab11,549 ab107 ab54.88
HVC80.6033.9−0.761.951.0811.3421.22.181.30307313413,4399649.73
HVC70.6073.6−0.961.830.9910.1222.51.921.37302411411,7479751.58
HVC100.6153.9−0.682.391.0712.4222.41.691.73376311511,33411467.48
HVC60.6284.5−0.972.120.9314.4123.32.021.56359513313,5868657.19
HVC120.6294.5−0.731.851.069.4522.31.861.49341414312,89710344.66
HVC110.6354.3−0.703.081.1316.5821.52.271.20314314712,6799845.27
Average 0.620 c4.1 b−0.802.20 b1.04 b12.38 b22.20 b1.99 b1.44 b3335131 b12,614 b99 b52.65
CV % 4.8012.6317.4534.369.5241.105.3419.4114.9710.6325.4918.2021.9711.92
LVC: low vigor class. MVC: medium vigor class. HVC: high vigor class. CV: coefficient of variation (%). NDVI: normalized difference vegetation index. LAI: Leaf area index. TSS: total soluble solids. YAN: yeast assimilable nitrogen. Lowercase letters indicate significant differences between LVC, MVC, and HVC (Tukey test p < 0.05).
Disclaimer/Publisher’s Note: The statements, opinions and data contained in all publications are solely those of the individual author(s) and contributor(s) and not of MDPI and/or the editor(s). MDPI and/or the editor(s) disclaim responsibility for any injury to people or property resulting from any ideas, methods, instructions or products referred to in the content.