Article

Effects of Light Intensity and Photoperiod on Morphological Development and Photosynthetic Characteristics of Coriander

1
Institute of Urban Agriculture, Chinese Academy of Agricultural Sciences, Chengdu 610213, China
2
School of Life Science and Engineering, Henan University of Urban Construction, Pingdingshan 467044, China
*
Author to whom correspondence should be addressed.
Horticulturae 2024, 10(3), 215; https://doi.org/10.3390/horticulturae10030215
Submission received: 29 January 2024 / Revised: 17 February 2024 / Accepted: 21 February 2024 / Published: 24 February 2024
(This article belongs to the Special Issue Horticultural Production in Controlled Environment)

Abstract

:
Coriander (Coriandrum sativum L.) is prized for its aroma and medicinal properties and is extensively employed in various cuisines. Light intensity and photoperiod greatly impact its phenological development. The application of light-emitting diodes (LEDs) in facility cultivation systems enables precise control of lighting conditions, leading to enhanced energy efficiency in coriander cultivation. This study investigated three levels of light intensity (133, 200, and 400 μmol·m−2·s−1) and three photoperiods (8L/16D, 16L/8D, and 24L) to comprehensively assess their effects on coriander’s morphological development, photosynthetic characteristics, and energy utilization efficiency. The objective was to identify a combination conducive to efficient and energy-saving coriander cultivation in PFALs. Results indicated that high light intensity (400 μmol·m−2·s−1) with continuous lighting (24L) reduces coriander’s photosynthetic capacity, while 24-h of continuous lighting can boost yield at the expense of energy efficiency. An 8-h photoperiod significantly decreases the yield compared to 16 h. Low light intensity inhibits plant development, indicating that 133 μmol·m−2·s−1 is suboptimal. For optimal efficiency and yield, a light intensity of 200 μmol·m−2·s−1 and a 16-h photoperiod are recommended in coriander PFAL cultivation. These findings advocate for the adoption of these specific conditions for the indoor cultivation of coriander within PFAL systems.

1. Introduction

Coriander (Coriandrum sativum L.), also known as cilantro or Chinese parsley, is a widely used herb in global cuisines, valued for its aromatic flavor [1]. Notably, the entire coriander plant, from seeds to foliage, is edible. Beyond its sensory appeal, coriander harbors a plethora of bioactive compounds, including flavonoids, terpenoids, and fatty acids [2,3]. Pharmacological research has illuminated the extensive biological activities of coriander extracts, encompassing antioxidant, anti-inflammatory, and neuroprotective properties [2,4,5]. Moreover, its potent antioxidant and antimicrobial properties make it a natural alternative for food preservation, potentially replacing synthetic antioxidants. As evidenced by its capability to inhibit the generation of polycyclic aromatic hydrocarbons (PAHs) in processed meats, coriander extract spotlights the plant’s potential as a natural means to curtail PAH content [6]. To summarize, coriander presents a multifaceted profile as a functional food ingredient, combining significant medicinal utility with profound economic significance.
While coriander is a globally valued crop, its yield and quality are susceptible to various challenges, including biotic stress, phenotypic variability, weather extremities, agricultural practices, and genetic influences. Notably, adverse weather conditions, especially excessive rainfall and cold temperatures during flowering, can impede coriander growth and promote disease spread, such as flower blight, leading to significant yield losses [7]. Beet curly top virus (BCTV) outbreaks have been reported to cause severe damage to coriander plants in natural settings [8]. The chemical composition of coriander varies due to environmental factors, cultivation practices, and plant characteristics, impacting its quality [9,10,11]. Moreover, the performance traits of the same coriander genotype varied with different agricultural conditions [12]. Further to agronomic concerns, food safety risks associated with fresh coriander consumption, linked to chemical and microbial contaminants, raise significant considerations. For instance, an outbreak of Shigella sonnei in the U.K., resulting from tainted coriander in April 2018, underscored the importance of stringent health and safety protocols in coriander cultivation, distribution, and preparation [13]. Given these intricate environmental and operational factors that influence coriander yield, there is a pressing need for further research to establish the optimal agronomic parameters to ensure the production of clean and safe coriander [14,15].
Rising consumer demand for safe, chemical-free fresh produce has spurred interest in high-quality agricultural goods. Plant factories, leveraging artificial lighting like light-emitting diodes (LEDs), have emerged as a solution to these demands, permitting precision control over growing conditions and mitigating reliance on variable natural environments. Light is fundamental to plant growth and development, influencing morphology, anatomy, physiology, and photosynthetic parameters. Optimal light intensity is essential. Excessive light may impair photosynthetic tissues and cellular membranes, while insufficient light restricts photosynthesis in leaf mesophyll. Additionally, light serves as a critical environmental cue governing plant circadian rhythm. Research indicates that extended photoperiods enhance photosynthesis, promoting growth and bolstering secondary metabolite levels in vegetables, such as proteins, sugars, and phenolics [16,17,18,19]. Therefore, it is essential to balance light intensity and photoperiod to optimize yields in cultivating crops. Within PFALs, LED lighting, with customizable spectral qualities, simulated intensity, minimal heat emissions, and eco-friendliness, has risen as the preferred artificial lighting source for cultivating crops.
Although PFALs provide more controlled growing conditions compared to open-air farming, the high energy costs of using LED lighting for crop production pose a significant challenge in achieving maximum output with minimal resource consumption and environmental impact to promote the production of high-quality, safe crops. The interplay between light intensity, photoperiod, and LED lighting efficiency is closely related, making the optimal combination crucial for maximizing production efficiency when cultivating coriander in PFALs. This study employed three light intensity (133, 200, and 400 μmol·m−2·s−1) and three photoperiods (8L/16D, 16L/8D and 24L) levels to comprehensively analyze the effects of different combinations of light intensity and photoperiod on the morphological development, photosynthetic characteristics, and energy utilization efficiency of coriander, with the aim to identify efficient and energy-saving combinations suitable for coriander cultivation in PFALs.

2. Materials and Methods

2.1. Experimental Materials

The coriander seed ‘Sumai’ was procured from Yunnan Zhongle Agricultural Technology Co., Ltd. in China. These seeds underwent a pre-germination treatment, wrapped in gauze, soaked at 55 °C for 15 min, and then stratified in darkness at 4 °C for seven days to enhance germination. The sprouted seeds were placed in sponges measuring 2.5 cm3 within nursery trays (32.5 cm × 24.5 cm × 4.5 cm) at 0.12 plants/cm2 seeding density. Daily irrigation was maintained using 150 mL of Enshi nutrient solution with a pH of 6.0 ± 0.5 and electrical conductivity (EC) of 2.0 ± 0.1 ds·m−1. Seedlings were cultivated for 18 days under a white light source providing an intensity of 150 μmol·m−2·s−1, using a Li-1500 light meter (Lincoln, NE, USA). Following this phase, seedlings were transplanted to hydroponic tanks at a planting density of 50 plants/m2, where they received 11 L of the same Enshi nutrient solution. Environmental conditions were meticulously regulated throughout the cultivation period at 24 °C and 48% relative humidity, with a CO2; concentration of 400 ppm.

2.2. Experimental Design

The study was conducted within PFALs at the Institute of Urban Agriculture, Chinese Academy of Agricultural Sciences, Chengdu, China (30°39′36″ N, 104°03′48″ E). White LED tubes provided the lighting (120 cm × 3 cm, produced by Guangzhou Chenghui Equipment Agriculture Technology Co., Ltd., Guangzhou, China). Nine experimental treatments were designed to determine the most effective light intensity and photoperiod for coriander growth. These comprised a combination of three photoperiods: 8 h of light followed by 16 h of darkness (8L/16D), 16 h of light followed by 8 h of darkness (16L/8D), and continuous 24-h lighting (24L), and three light intensity levels recorded at 5 cm above the cultivation board with a Li-1500 light meter (Lincoln, Nebraska, USA): 133, 200, and 400 μmol·m−2·s−1. These conditions were cross-applied to create a unique treatment scenario, and each scenario was replicated three times. The coriander plants were harvested after 20 days under variable lighting conditions, and the coriander plants were harvested. Both side and top views of the plants were documented (Figure 1).

2.3. Sample Collection and Measurements

Following a growth period of 20 days exposed to the nine distinct lighting regimens, six plants were chosen for detailed assessment, which included morphological characteristics and fresh/dry weight. Besides, three leaves from each selected plant were harvested for chlorophyll content, photosynthetic capacity, and stomatal parameters analysis. The selected leaves were the terminal leaves from the second branch counted from the bottom of the plant, labeled as L1.

2.3.1. Morphological Characteristics and Yield Measurements

From each treatment group, six plants were randomly selected for morphometric analysis. The parameters measured included plant height, stem diameter, number of branches, and fresh and dry weights of roots, stems, and leaves. Digital images of the plants’ foliage were captured for analysis using ImageJ software version 1.45, facilitating the estimation of total leaf area. The plant samples were subsequently desiccated using a DHG-2200B rotary evaporator (manufactured by Zhengzhou Shengyuan Instrument Co., Ltd., Zhengzhou, China) at a temperature of 70 °C, after which the dry weights were recorded. Additionally, the stem-to-leaf ratio (S/L) was calculated as the quotient of the dry weight of the stem to that of the leaves, following the method outlined in the reference [20].

2.3.2. Photosynthetic Pigment Content

The modified method of Lichtenthaler (1987) was used to determine the chlorophyll and carotenoid content. Fresh coriander leaf samples (0.1 g) were mixed with 10 mL of 95% ethanol at room temperature 24 °C for pigment extraction until the leaves were completely bleached. The absorbance of the separated supernatants (200 μL) was measured at 665 nm, 649 nm, and 470 nm using an enzyme-linked immunosorbent assay reader (Flicker BioTech Co., Ltd., Shanghai, China). The chlorophyll and carotenoid content were calculated using the following Formulas (1):
Chl   a ( mg · g 1 ) = ( 13.95 × A 665 6.88 × A 649 ) / M Chl   b mg · g 1 = ( 24.9 0 × A 649 7.32 × A 665 ) / M Car mg · g 1 = ( 1000 × A 470 2.05 × Chl   a 114.8 × Chl   b ) / 245 M
note: Chl a: chlorophyll a; Chl b: chlorophyll b; Car: carotenoids; M: extraction mass of fresh sample/g; A665: absorbance at 665 nm; A649: absorbance at 649 nm; A470: absorbance at 470 nm.

2.3.3. Chlorophyll Fluorescence

Chlorophyll fluorescence was measured using a portable photosynthesis system (LI-6800XT, LI-COR Biosciences, Lincoln, NE, USA) equipped with a fluorescence leaf chamber (6800-01A, LI-COR Biosciences, Lincoln, NE, USA). The chlorophyll fluorescence analysis was started at 7:00 am and ended at 12:00 am. The temperature and CO2 concentration were set at 24 °C and 400 μmol·mol−1, respectively. L1 leaves from each treatment were used for chlorophyll fluorescence measurements. Before measuring chlorophyll fluorescence parameters, a dark adaptation of 2 h (due to the continuous lighting for 24 h in the study, the dark adaptation time was extended from the usual 30 min to 2 h to ensure sufficient dark adaptation) was performed to measure the minimum fluorescence (Fo), followed by the application of a saturating pulse of 8000 μmol·m−2·s−1 for 1 s to measure the maximum fluorescence (Fm). The steady-state fluorescence yield (Ft) at the L1 leaf of coriander under different light treatments and the maximum fluorescence yield (Fm’) in light-adapted samples were measured. Subsequently, the maximum quantum yield of PSII (Fv/Fm, Fv = Fm/Fo), non-photochemical quenching (NPQ = Fm − Fm’), and photochemical quenching coefficient [qP = (Fm’ − Ft)/(Fm’ − Fo’)] were calculated. Each treatment had six biological replicates.

2.3.4. Photosynthetic Parameters

Photosynthetic indices of coriander L1 leaves were measured using a portable photosynthesis system (LI-6800XT, LI-COR Biosciences, Lincoln, NE, USA) and a red-blue (R-B) light LED chamber (6800-01A, LI-COR Biosciences, Lincoln, NE, USA). The instrument parameters were set as follows: temperature of 24 °C, CO2 concentration of 400 μmol·mol−1, relative humidity of 60%, flow rate of 500 µmol·s−1, leaf-to-air vapor pressure difference of 1.0 ± 0.1 kPa. The R-B light ratio in the chamber was set to 3:1. Net photosynthetic rate (Pn), transpiration rate (Tr), stomatal conductance based on water (Gsw), and intercellular CO2 concentration (Ci) were measured with the light intensity of the treatment. Water use efficiency (WUE) was calculated using the formula WUE = Pn/Tr, where Pn and Tr represent the net photosynthetic rate and transpiration rate, respectively. The gas exchange analyses started at 9:00 am and ended at 11:00 am. Maximum net photosynthetic rate (Pn max), the initial slope of the fraction of light absorbed by photosystem II (α), and dark respiration rate (Rd) were determined based on the leaf chlorophyll fluorescence response model [21].

2.3.5. Stomata

Coriander leaves (L1 leaf from the second topmost branch counting from the bottom) were used for stomatal observations. Transparent nail polish was applied on both sides of the leaves (2 × 2 cm), and after drying (at room temperature, for 10 min), the imprints were carefully peeled off using tweezers. The stomata on the adaxial and abaxial surfaces of the leaves were observed under an optical microscope (Olympus DP71, Olympus Inc., Tokyo, Japan) [22]. Stomatal density was measured at 200× magnification (nine leaf samples per treatment, six plants), and stomatal length and width were measured at 400× magnification (nine leaf samples per treatment, six plants). The length, width, and density of stomata were measured using Image-Pro Express software version 6.0 (Media Cybernetics, Rockville, MD, USA).

2.3.6. Electric Energy Use Efficiency

Electric energy use efficiency (EUE, %) is the ratio of the chemical energy of accumulated dry matter to the consumed electrical energy, as calculated by the following Formula (2).
EUE i = DW i     DW i - 1   ×   f   ×   D i   ×   s   × 100 % P   ×   t  
EUEi represents the energy use efficiency of coriander between the i and i-1 sampling periods. DWi and DWi-1 represent the average dry weight of coriander samples taken during the i and i-1 periods, respectively, in grams per plant. Since the dry weight of coriander seedlings is negligible at transplanting, DW0 is approximately equal to 0. f represents the conversion coefficient between dry matter mass and chemical energy, estimated as 2 × 10⁴ J/g. Di is the planting density before the i sampling, set at 50 plants/m2. t is the accumulated light exposure time between the two sampling periods, given in seconds. P is the power of the light source, measured in watts, using an energy meter (Longben Electrical Co., Ltd., Yongkang, China). s is the cultivation area, which is 0.267 square meters. Daily light integral (DLI) refers to the cumulative amount of light available for photosynthesis to plants in a day, calculated as the product of light intensity and duration over 24 h, with units in mol−1·m−2.

2.3.7. Data Analysis

Data were processed using SPSS 17 (Chicago, IL, USA). One-way analysis of variance (ANOVA) and Duncan’s multiple range test were performed to analyze significant differences among treatments. Differences were considered statistically significant at p < 0.05. Data are presented as mean ± standard deviation (SD). The stomatal parameters were measured six times, while all other parameters were measured three times.

3. Results

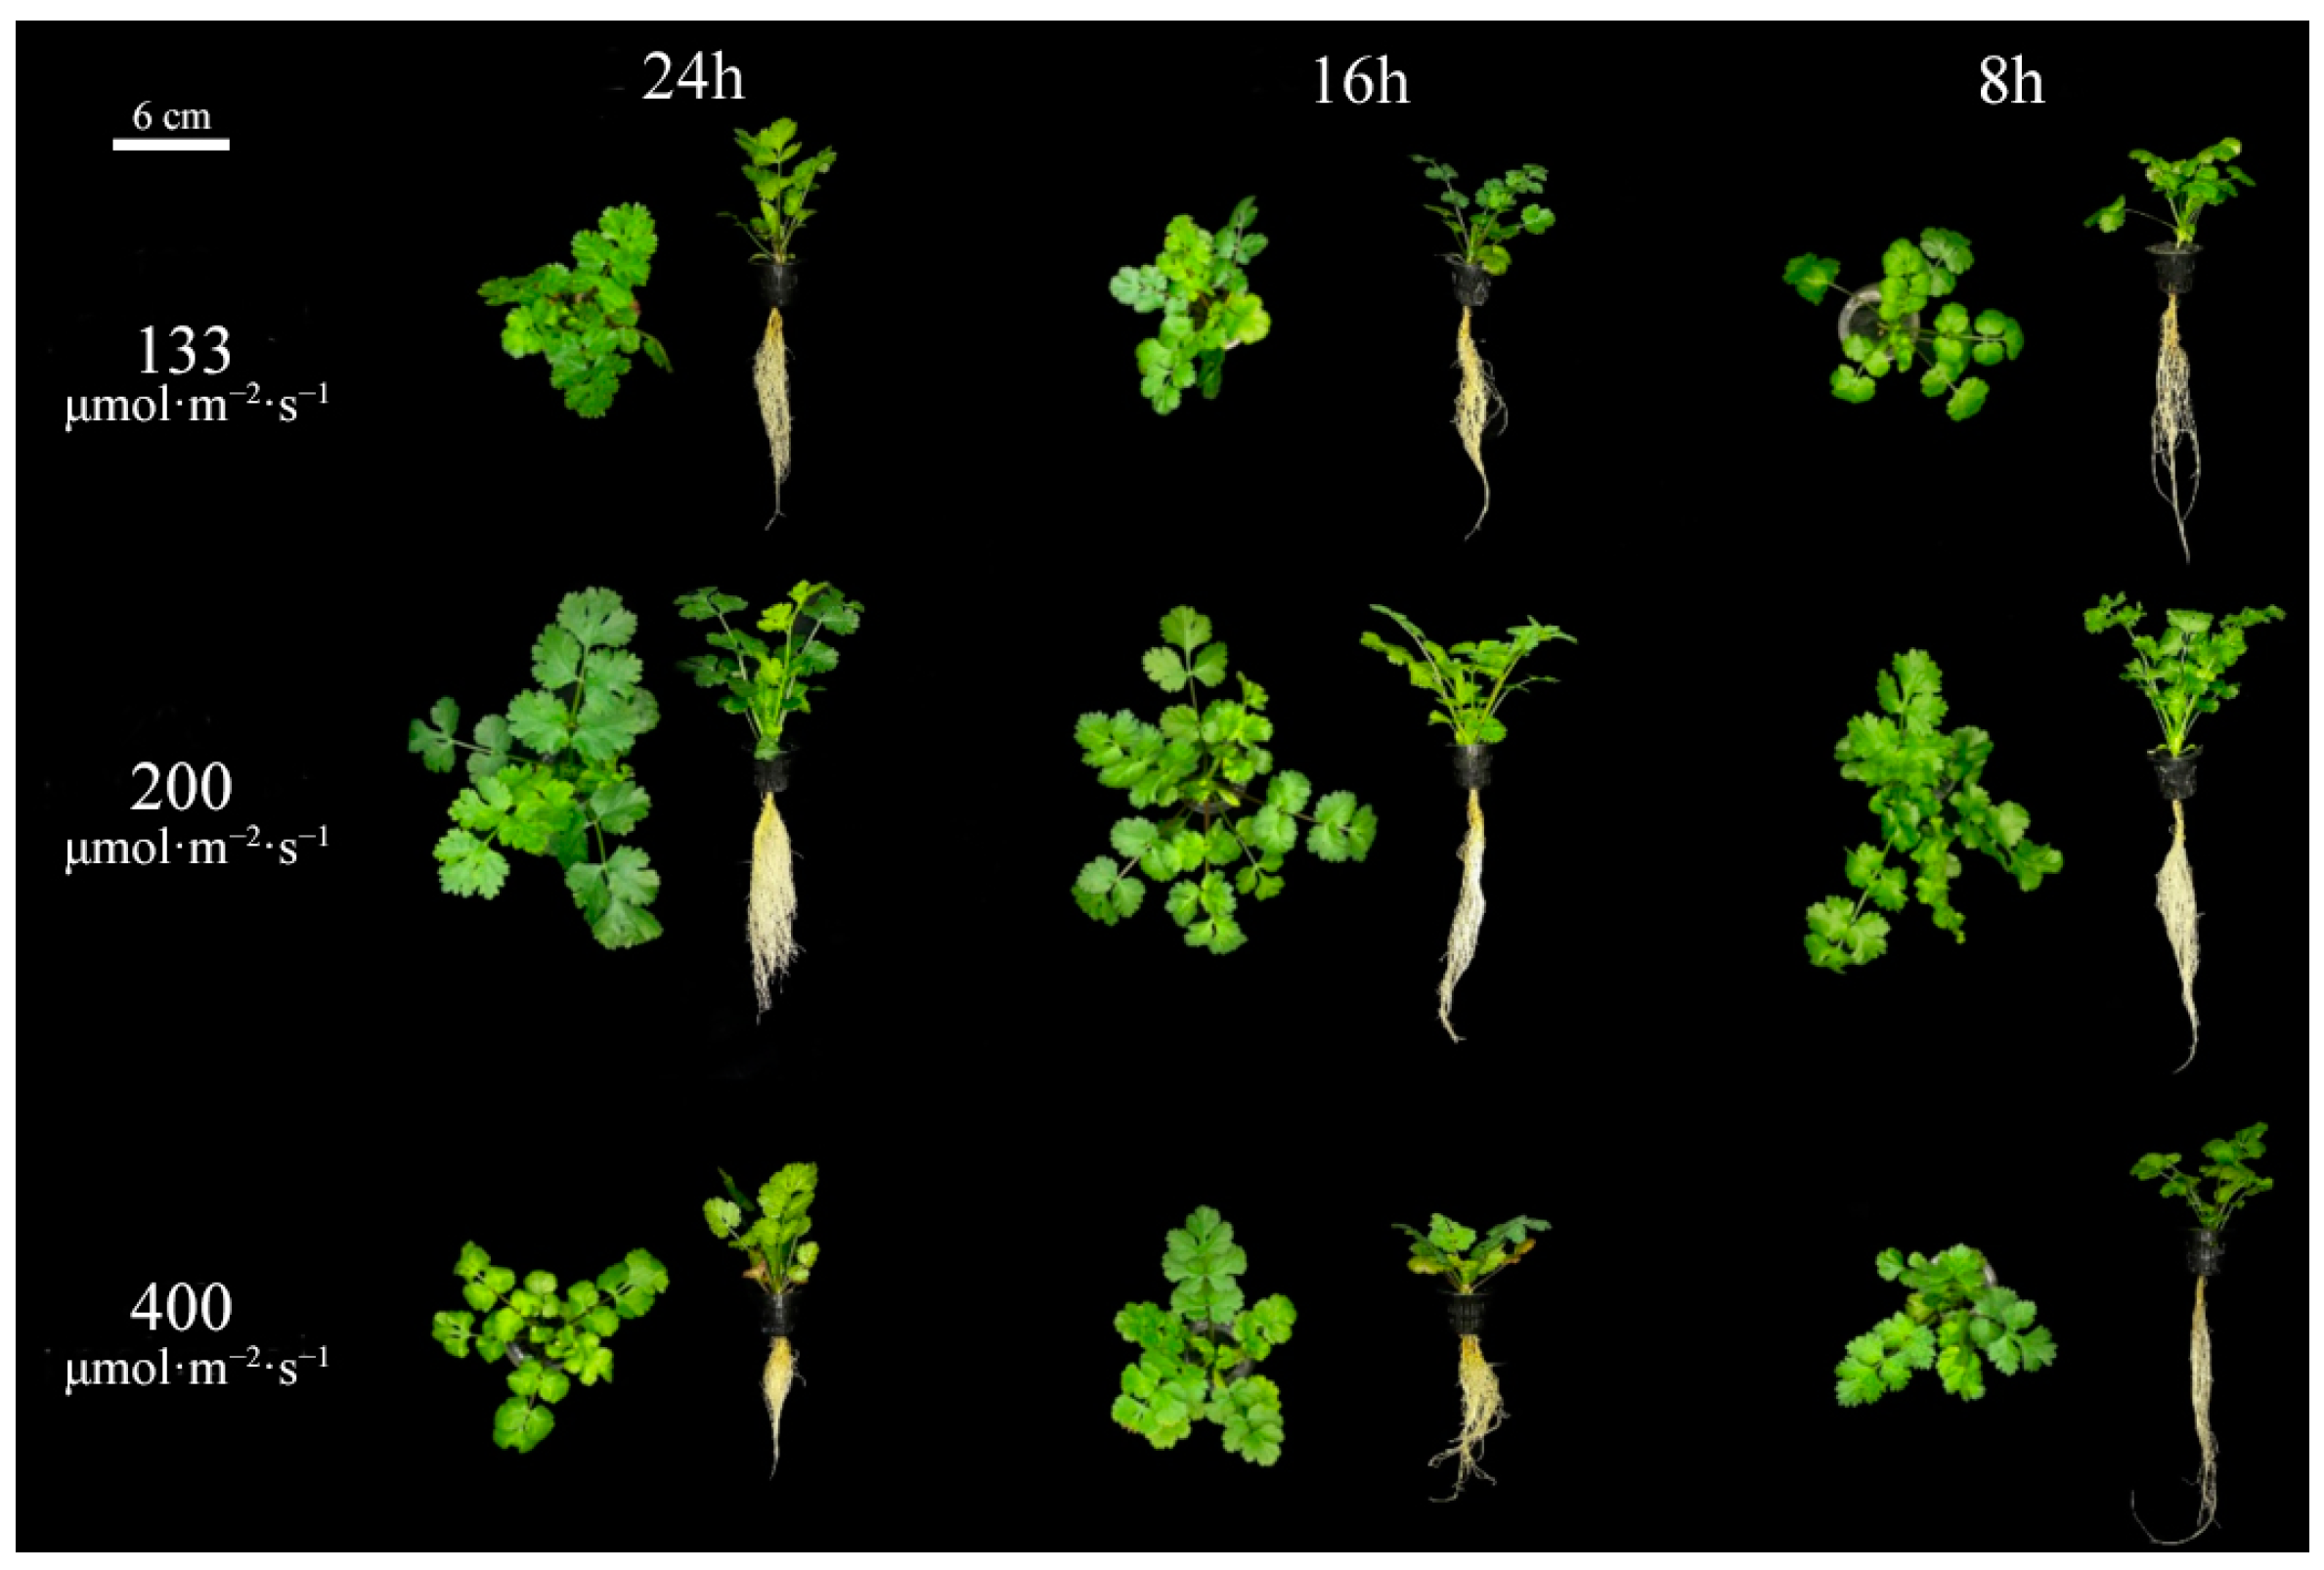
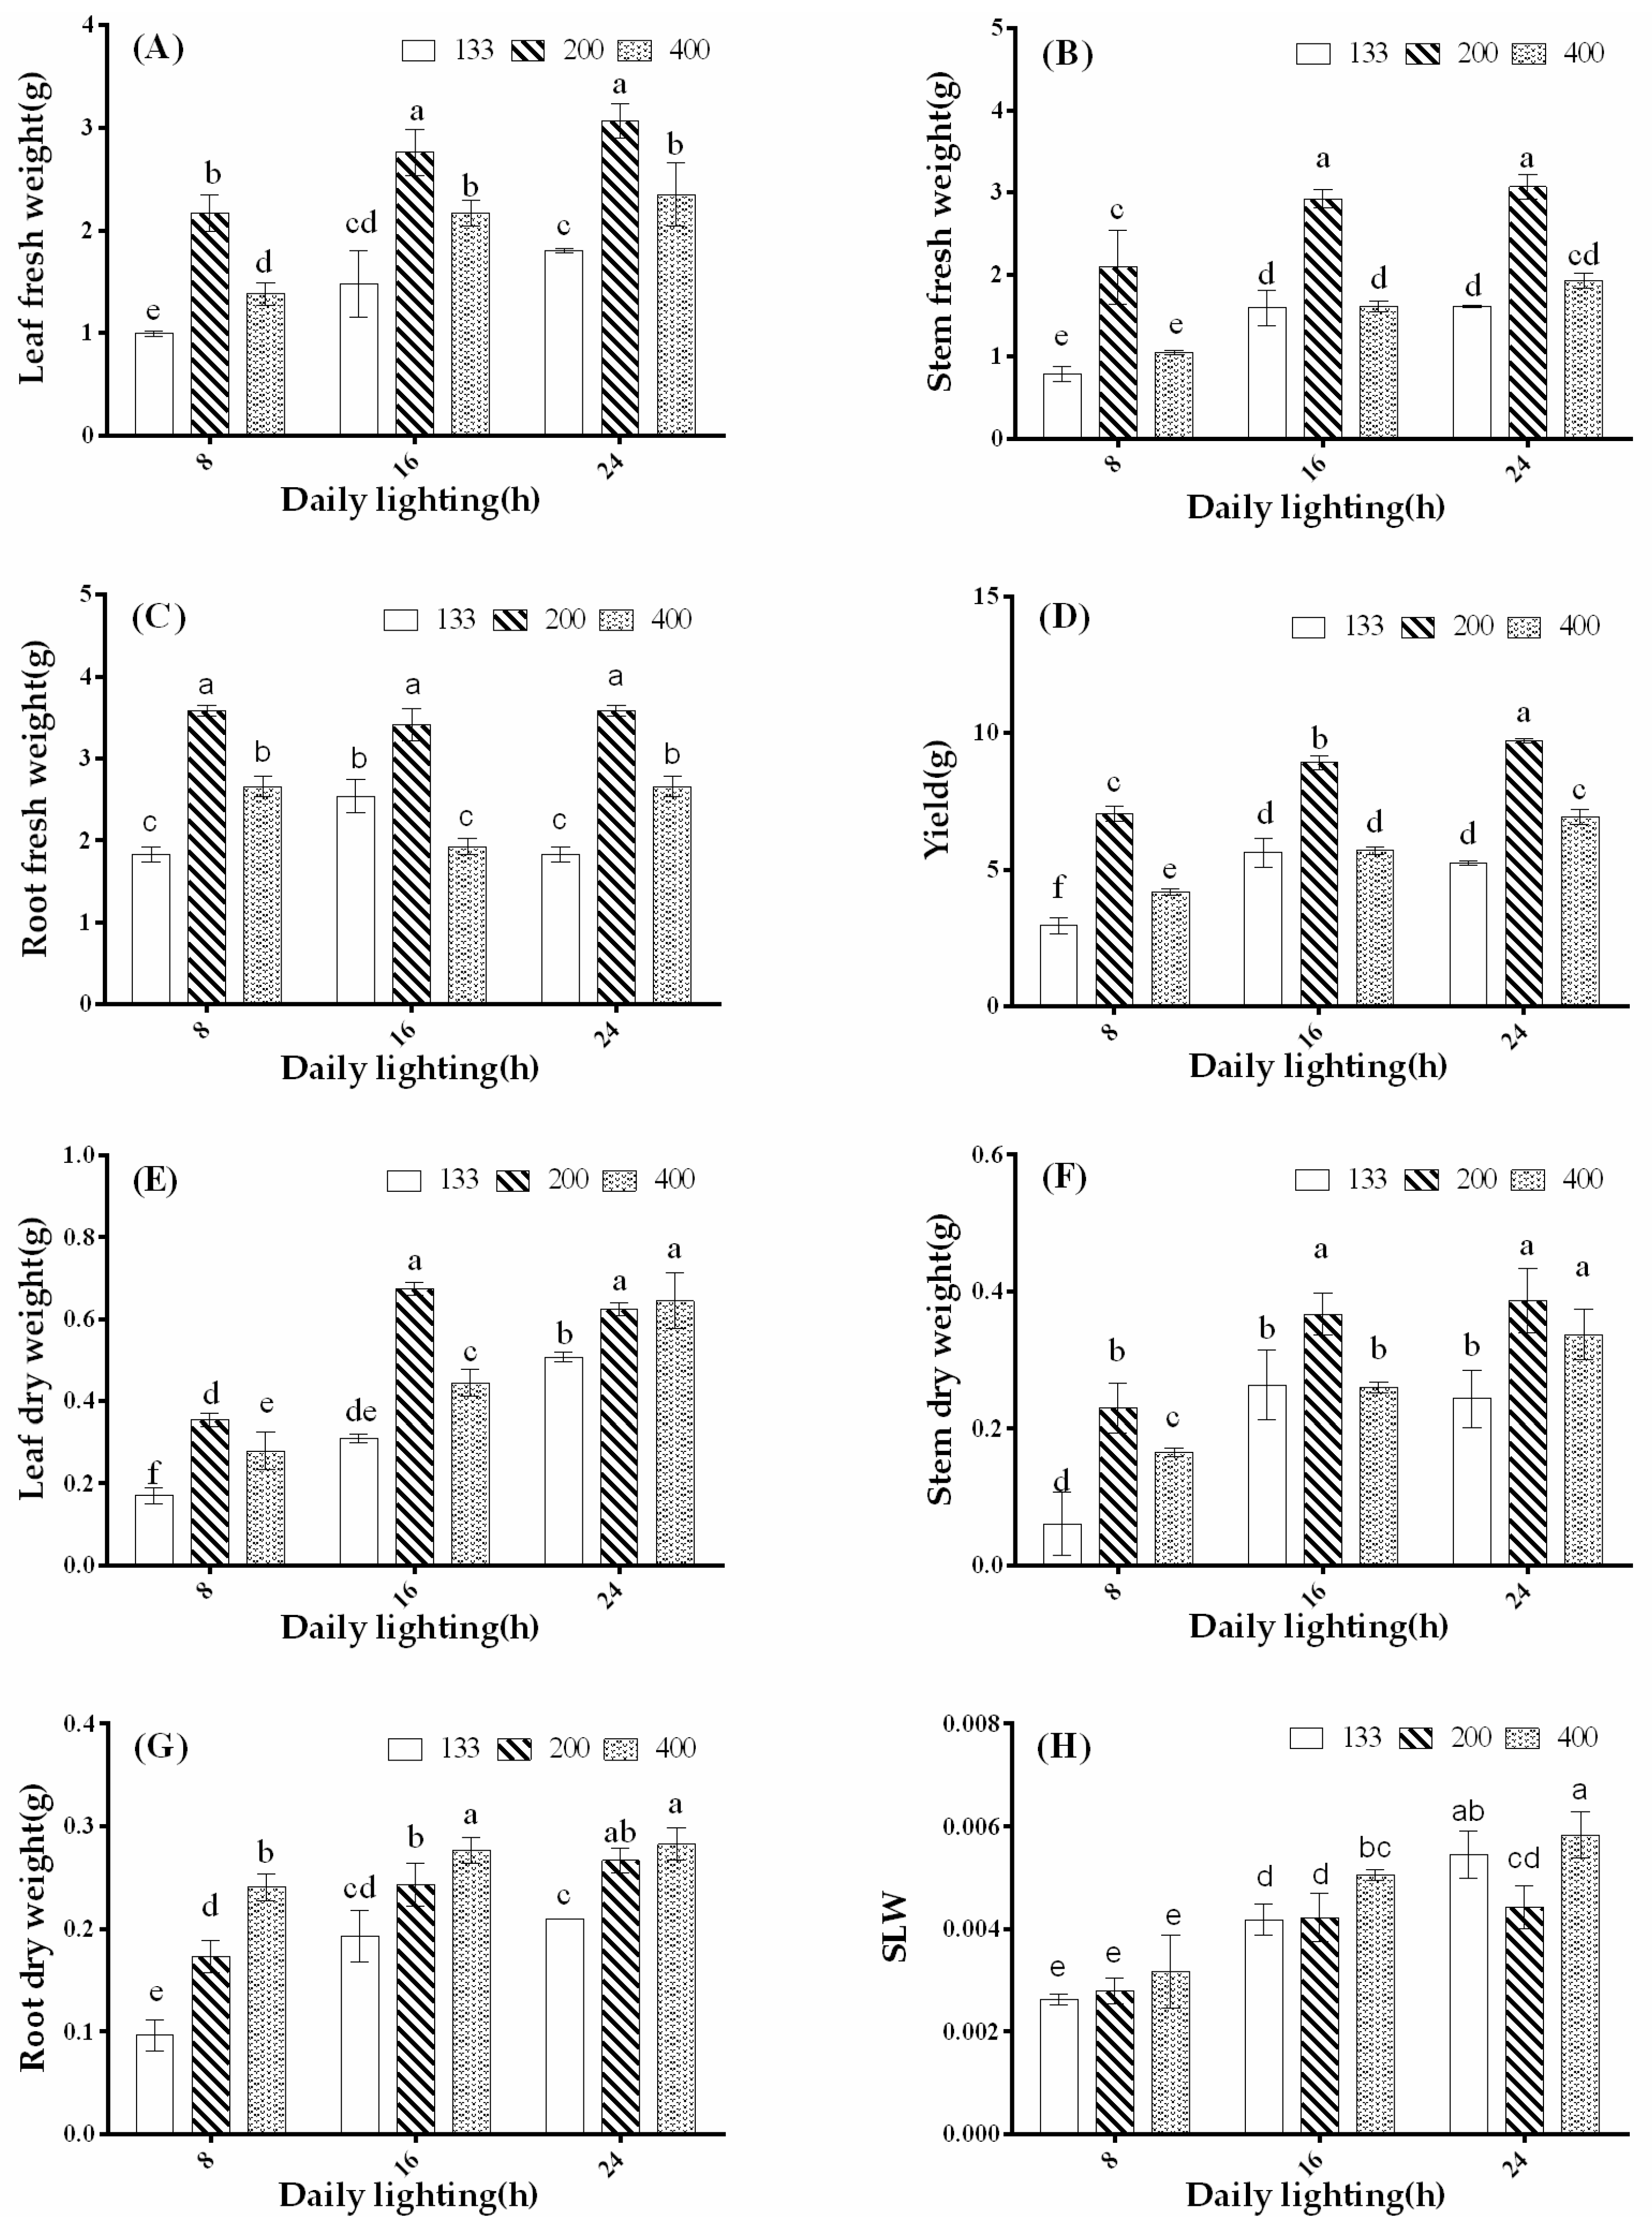
3.1. Effects of Light Intensity and Photoperiod on Plant Morphology and Biomass

Coriander morphology is significantly influenced by light intensity and photoperiod. Under the same photoperiod, coriander plants showed significantly increased plant height, stem diameter, and leaf area when exposed to 200 μmol·m−2·s−1 light intensity compared to 133 and 400 μmol·m−2·s−1 treatments. Additionally, under a 16-h photoperiod, coriander plants had the highest stem diameter and leaf area in the 200 μmol·m−2·s−1 treatment. Besides, the number of branches was highest in the 16-h × 200 μmol·m−2·s−1 treatment and lowest in the 24-h × 133 μmol·m−2·s−1 treatment (Table 1). Both side and top views of the plants were documented in Figure 1.
As shown in Figure 2, under the same photoperiod treatment, a light intensity of 200 μmol·m−2·s−1 significantly promoted fresh weight and yield of coriander shoots, stems, and roots. There was no significant difference in root fresh weight compared to the 8-, 16-, and 24-h treatments, but the aboveground yield increased by 36.06% and 46.50%, respectively. The lowest aboveground yield was observed in the 8-h treatment under a light intensity of 133 μmol·m−2·s−1. In contrast to the trend in fresh weight, the treatment with 24-h exposure to 400 μmol·m−2·s−1 light intensity significantly promoted the accumulation of aboveground dry matter in coriander, with no significant difference compared to the 16- and 24-h treatments under 200 μmol·m−2·s−1 light intensity. Among the treatments with the same photoperiod, root dry weight was increased with increasing light intensity. There was no significant difference in root dry weight between the 16- and 24-h treatments, but it was significantly higher than the 8-h treatment. Except for the treatment with 200 μmol·m−2·s−1 light intensity, the stem-to-leaf ratio of coriander increased with the lengthening of the photoperiod. The treatment with 24-h exposure to 400 μmol·m−2·s−1 light intensity showed the highest stem-to-leaf ratio, with no significant difference compared to the 24-h treatment under 133 μmol·m−2·s−1 light intensity. In summary, coriander plants exhibited slow growth under a light intensity of 133 μmol·m−2·s−1, while they showed robust growth and increased yield under a light intensity of 200 μmol·m−2·s−1. In addition, a photoperiod of 16- or 24-h was favorable for coriander growth based on the light intensity of 200 μmol·m−2·s−1.

3.2. Effects of Light Intensity and Photoperiod on Plant Chlorophyll Content

Different light environments significantly affect the photosynthetic pigment content in crops. Under a light intensity of 133 μmol·m−2·s−1, the photosynthetic pigment content significantly decreased in the 24-h photoperiod treatment compared to the 8- and 16-h treatments. In contrast to the 133 μmol·m−2·s−1 light intensity treatment, under a light intensity of 200 μmol·m−2·s−1, the photosynthetic pigment content significantly decreased in the 16-h treatment compared to the 8-h treatment. It also significantly decreased in the 24-h treatment compared to the 200 μmol·m−2·s−1 light intensity treatment. The 24-h treatment under a light intensity of 400 μmol·m−2·s−1 had the lowest photosynthetic pigment content, and compared to other light intensity treatments, the high light intensity of 400 μmol·m−2·s−1 significantly decreased the photosynthetic pigment content in all photoperiod treatments (Table 2).

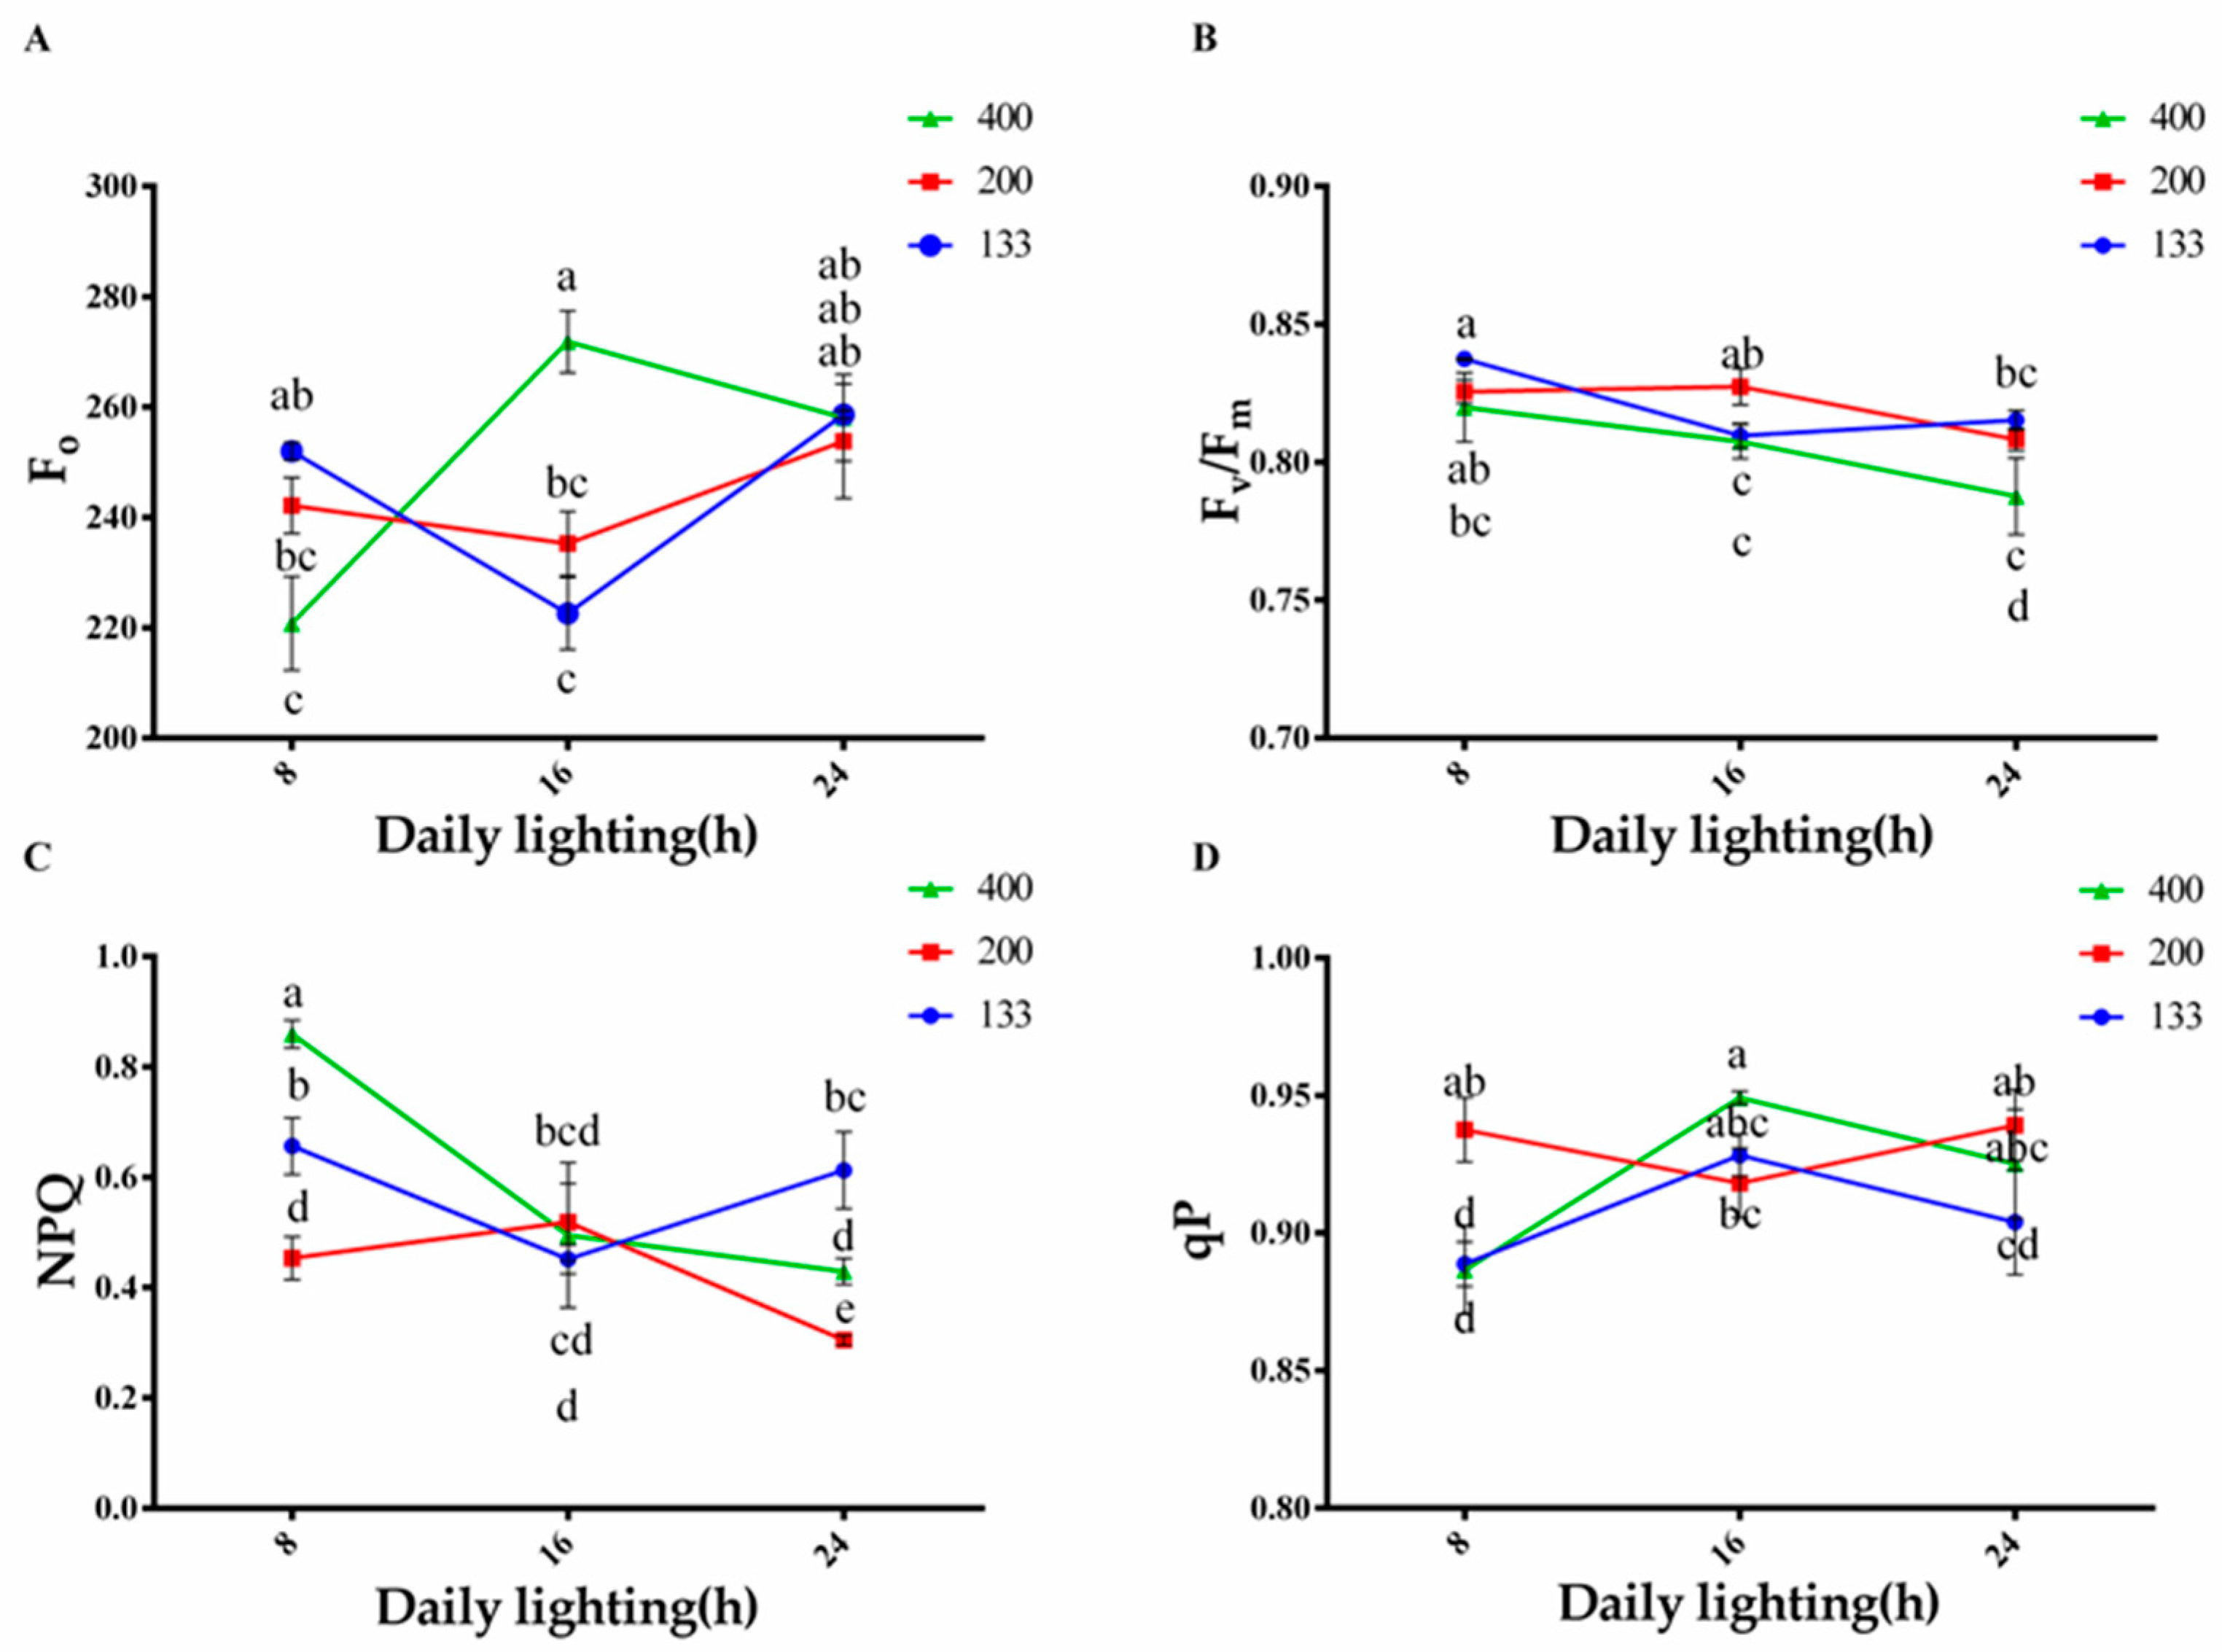
3.3. Effects of Light Intensity and Photoperiod on Chlorophyll Fluorescence Content in Plants

The effects of light intensity and photoperiod on chlorophyll fluorescence content are shown in Figure 3. Under the 16-h treatment with a light intensity of 400 μmol·m−2·s−1, the Fo content was the highest. For the 200 and 400 μmol·m−2·s−1 light intensity treatments, the Fo content increased with the increase in daylight hours. In the 133 μmol·m−2·s−1 light intensity treatment, the 16-h photoperiod significantly decreased the Fo content in coriander plants (Figure 3A). Compared to the 200 and 133 μmol·m−2·s−1 light intensity treatments, the Fv/Fm significantly decreased in the 400 μmol·m−2·s−1 light intensity treatment, and it decreased with the increase in daylight hours. The lowest Fv/Fm was recorded in the 16-h treatment with a light intensity of 400 μmol·m−2·s−1. The 8-h treatment with a light intensity of 133 μmol·m−2·s−1 showed the highest Fv/Fm, and there was no significant difference between the 8-h treatment with a light intensity of 200 μmol·m−2·s−1 and the 16-h treatment with a light intensity of 200 μmol·m−2·s−1 (Figure 3B). The effect of daylight hours on NPQ values was more significant. As shown in Figure 3C, compared to other treatments, the 8-h treatment with a light intensity of 400 μmol·m−2·s−1 significantly increased NPQ, while the 24-h treatment with a light intensity of 400 μmol·m−2·s−1 significantly decreased NPQ. The NPQ values showed no significant difference among different light intensity treatments in the 16-h photoperiod treatment. The 24-h photoperiod treatment with a light intensity of 133 μmol·m−2·s−1 exhibited the highest NPQ. With the increase in daylight hours, the changing trend of the qP values under different light intensity treatments was opposite to that of the NPQ values, and there was no significant difference among treatments. The lowest qP values were observed in the 8-h treatments with a light intensity of 133 and 400 μmol·m−2·s−1 (Figure 3D).

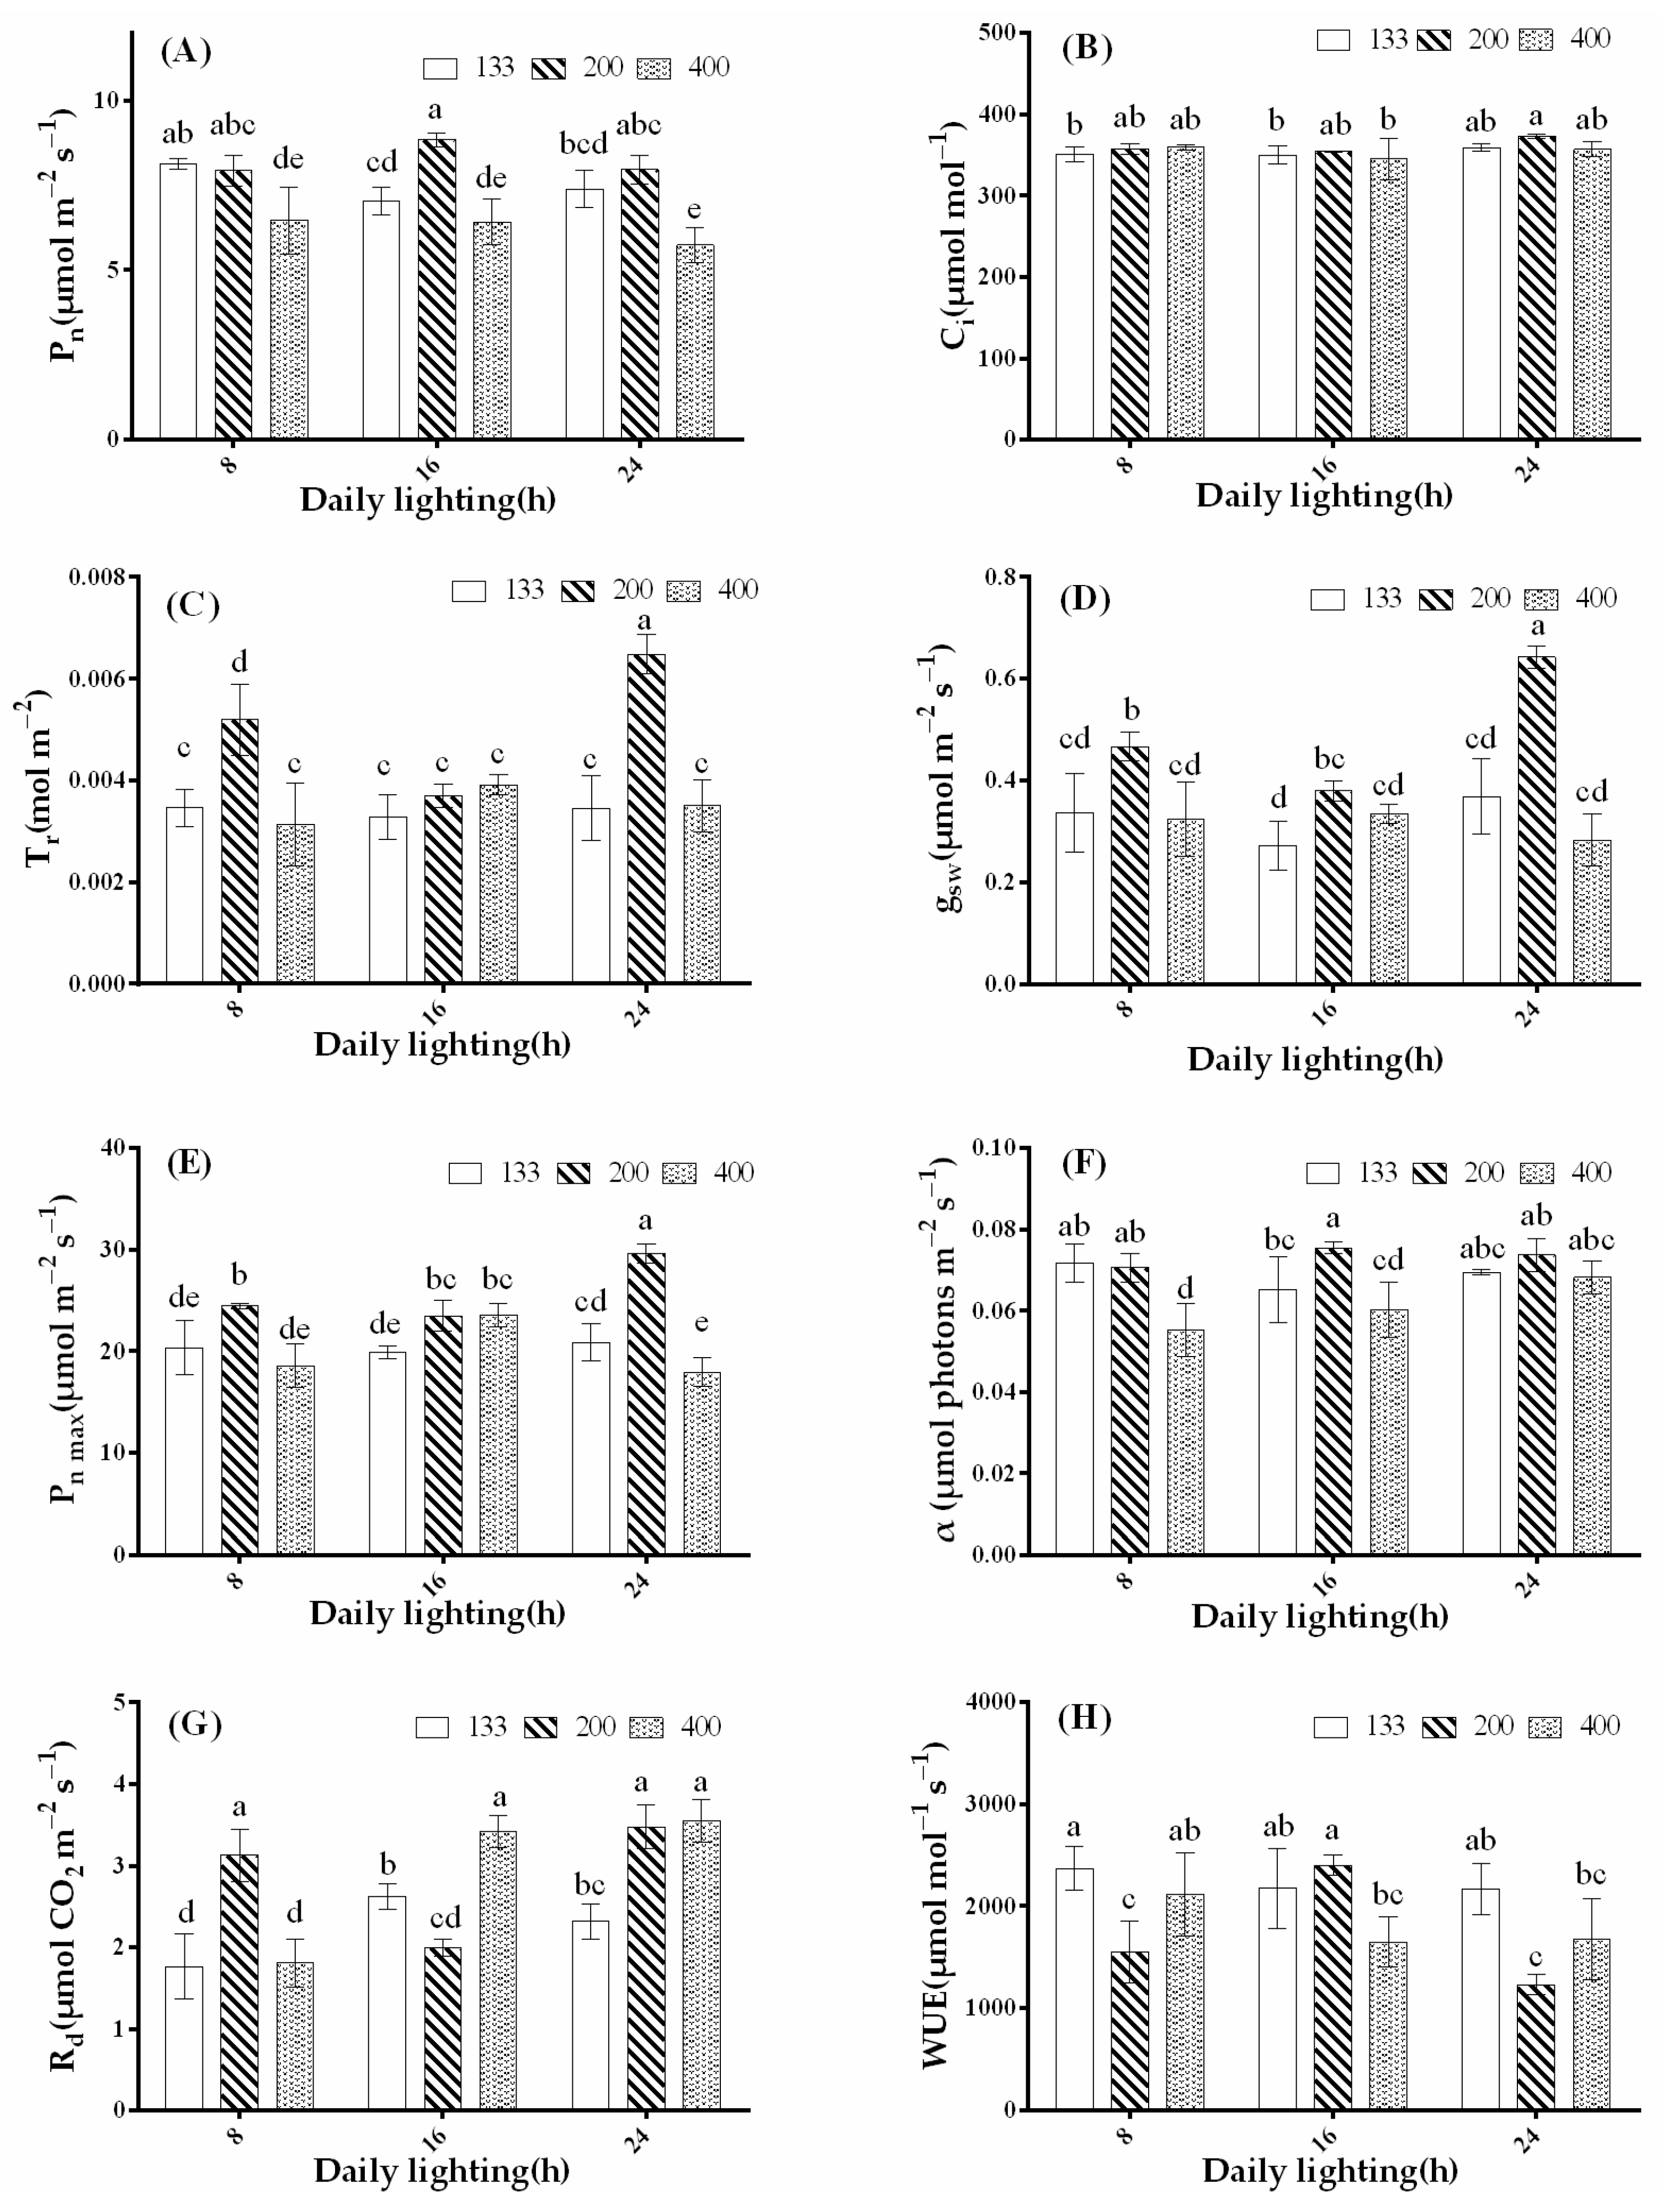
3.4. Effects of Light Intensity and Photoperiod on Plant Photosynthetic Characteristics

As shown in Figure 4, the maximum Pn was observed under the 16-h treatment with a light intensity of 200 μmol·m−2·s−1, while the minimum Pn was recorded in the 24-h treatment with a light intensity of 400 μmol·m−2·s−1. Under the same photoperiod treatment, Pn reached its peak at a light intensity of 200 μmol·m−2·s−1 and significantly decreased at a light intensity of 400 μmol·m−2·s−1. In the 133 μmol·m−2·s−1 light intensity treatment, the 8-h photoperiod significantly promoted Pn (Figure 4A). Ci was highest under the 24-h treatment with a light intensity of 200 μmol·m−2·s−1, and there was no significant difference among the other treatments (Figure 4B). Tr significantly increased in the 24-h treatment with a light intensity of 200 μmol·m−2·s−1. Under the 8-h photoperiod treatment, Tr significantly increased at a light intensity of 200 μmol·m−2·s−1, while there were no significant differences in Tr among the other treatments (Figure 4C). The Gsw, Pn max, and Tr changes were consistent, significantly increasing in the 24-h treatment with a light intensity of 200 μmol·m−2·s−1 (Figure 4D,E). The α was highest under the 16-h treatment with a light intensity of 200 μmol·m−2·s−1 and showed no significant difference compared to other photoperiod treatments at a light intensity of 200 μmol·m−2·s−1. α significantly decreased in the 8-h treatment with a light intensity of 400 μmol·m−2·s−1 (Figure 4F). Rd significantly increased in the 8- and 24-h treatments at a light intensity of 200 μmol·m−2·s−1, as well as in the 16- and 24-h treatments at a light intensity of 400 μmol·m−2·s−1, with no significant difference among these treatments. Rd significantly decreased in the 16-h treatment with a light intensity of 200 μmol·m−2·s−1 (Figure 4G). As shown in Figure 4H, except for the 16-h treatment with a light intensity of 200 μmol·m−2·s−1, WUE significantly increased in all other treatments under a light intensity of 133 μmol·m−2·s−1 compared to other treatments. The 24-h treatment with a light intensity of 200 μmol·m−2·s−1 exhibited lower WUE.

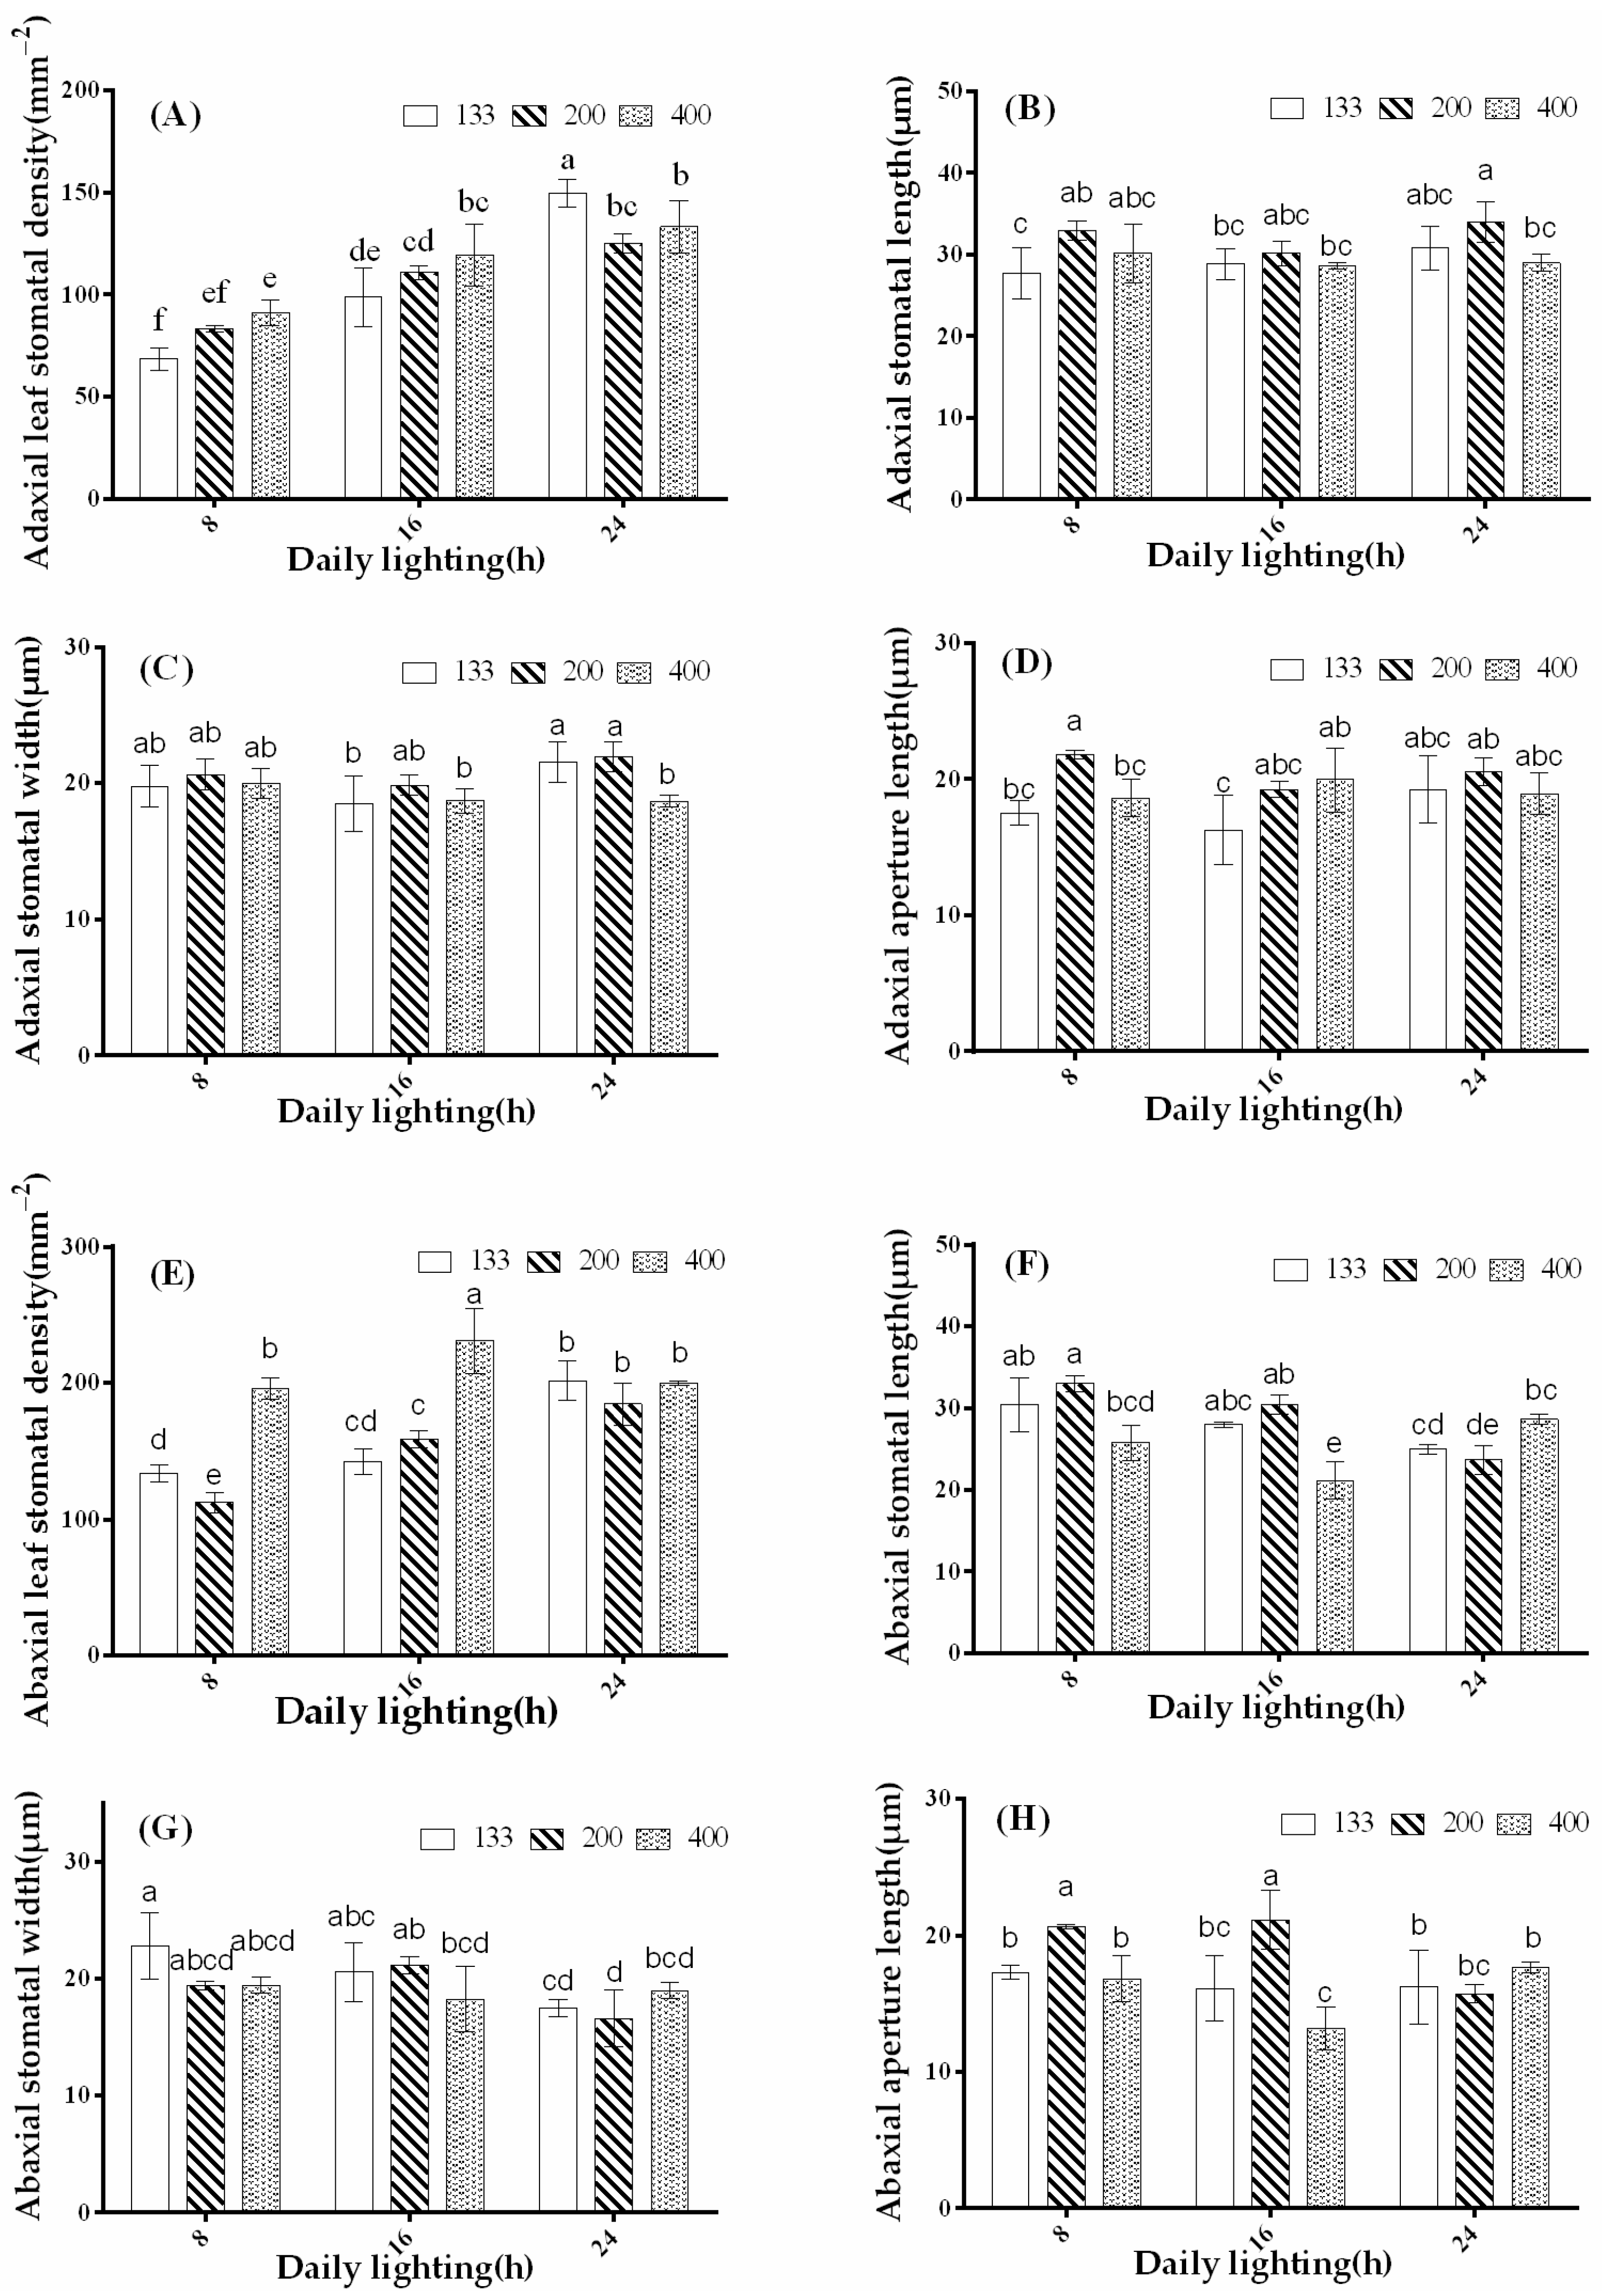
3.5. The Effects of Light Intensity and Photoperiod on Stomatal Development in Coriander Leaves

The stomatal density on the adaxial surface of coriander leaves was highest under the 24-h treatment with a light intensity of 133 μmol·m−2·s−1 and lowest under the 8-h treatment with a light intensity of 133 μmol·m−2·s−1. Under the 8- and 16-h photoperiod treatments, the stomatal density on the adaxial surface of the leaves increased with increasing light intensity, reaching the maximum at a light intensity of 400 μmol·m−2·s−1 and the minimum at a light intensity of 133 μmol·m−2·s−1 (Figure 5A). In all photoperiod treatments, compared to other light-intensity treatments, the 200 μmol·m−2·s−1 treatment significantly promoted the length of adaxial stomata. For the 400 μmol·m−2·s−1 light intensity treatment, the length of adaxial stomata decreased as the photoperiod (daylight hours) increased, while for the 133 μmol·m−2·s−1 light intensity treatment, the length of adaxial stomata increased with increasing photoperiod (Figure 5B). As shown in Figure 5C, except for the 400 μmol·m−2·s−1 light intensity treatment, there was no significant difference in the width of adaxial stomata among the different treatments. For the 400 μmol·m−2·s−1 light intensity treatment, the width of adaxial stomata decreased with increasing photoperiod. The length of adaxial stomatal apertures significantly increased with increasing photoperiod under the 133 μmol·m−2·s−1 light intensity treatment. There was no significant difference in the length of adaxial stomatal apertures between the 200 and 400 μmol·m−2·s−1 light intensity treatments (Figure 5D).
Similarly, high light-intensity treatments also promoted stomatal density on the abaxial surface of coriander leaves. Under the same photoperiod, compared to the 133 and 200 μmol·m−2·s−1 light intensity treatments, the 400 μmol·m−2·s−1 light intensity treatment significantly increased the stomatal density on the abaxial surface. Notably, under the 16-h treatment with a light intensity of 400 μmol·m−2·s−1, the stomatal density on the abaxial surface significantly increased, while under the 8-h treatment with a light intensity of 200 μmol·m−2·s−1, the stomatal density on the abaxial surface significantly decreased. Under the 24-h photoperiod treatment, different light intensities did not show a significant difference in the stomatal density on the abaxial surface (Figure 5E). Unlike the trend in adaxial stomatal length, except for the 400 μmol·m−2·s−1 light intensity treatment, the length of abaxial stomata decreased with increasing photoperiod in the 133 and 200 μmol·m−2·s−1 light intensity treatments, with the most extended length observed under the 8-h photoperiod treatment and the shortest under the 24-h photoperiod treatment (Figure 5F). Under the 133 and 400 μmol·m−2·s−1 light intensity treatments, the width of the abaxial stomata decreased with increasing photoperiod. The width initially increased and decreased for the 200 μmol·m−2·s−1 light intensity treatment. All light-intensity treatments exhibited the lowest width of abaxial stomata under the 24-h photoperiod treatment (Figure 5G). The length of abaxial stomatal apertures was highest under the 8-h treatment with a light intensity of 200 μmol·m−2·s−1, and the other treatments showed no significant difference (Figure 5H). In summary, photoperiod significantly affects the development of adaxial and abaxial stomata in coriander leaves, and there are differences in the response of stomata on the adaxial and abaxial surfaces to different light environments.

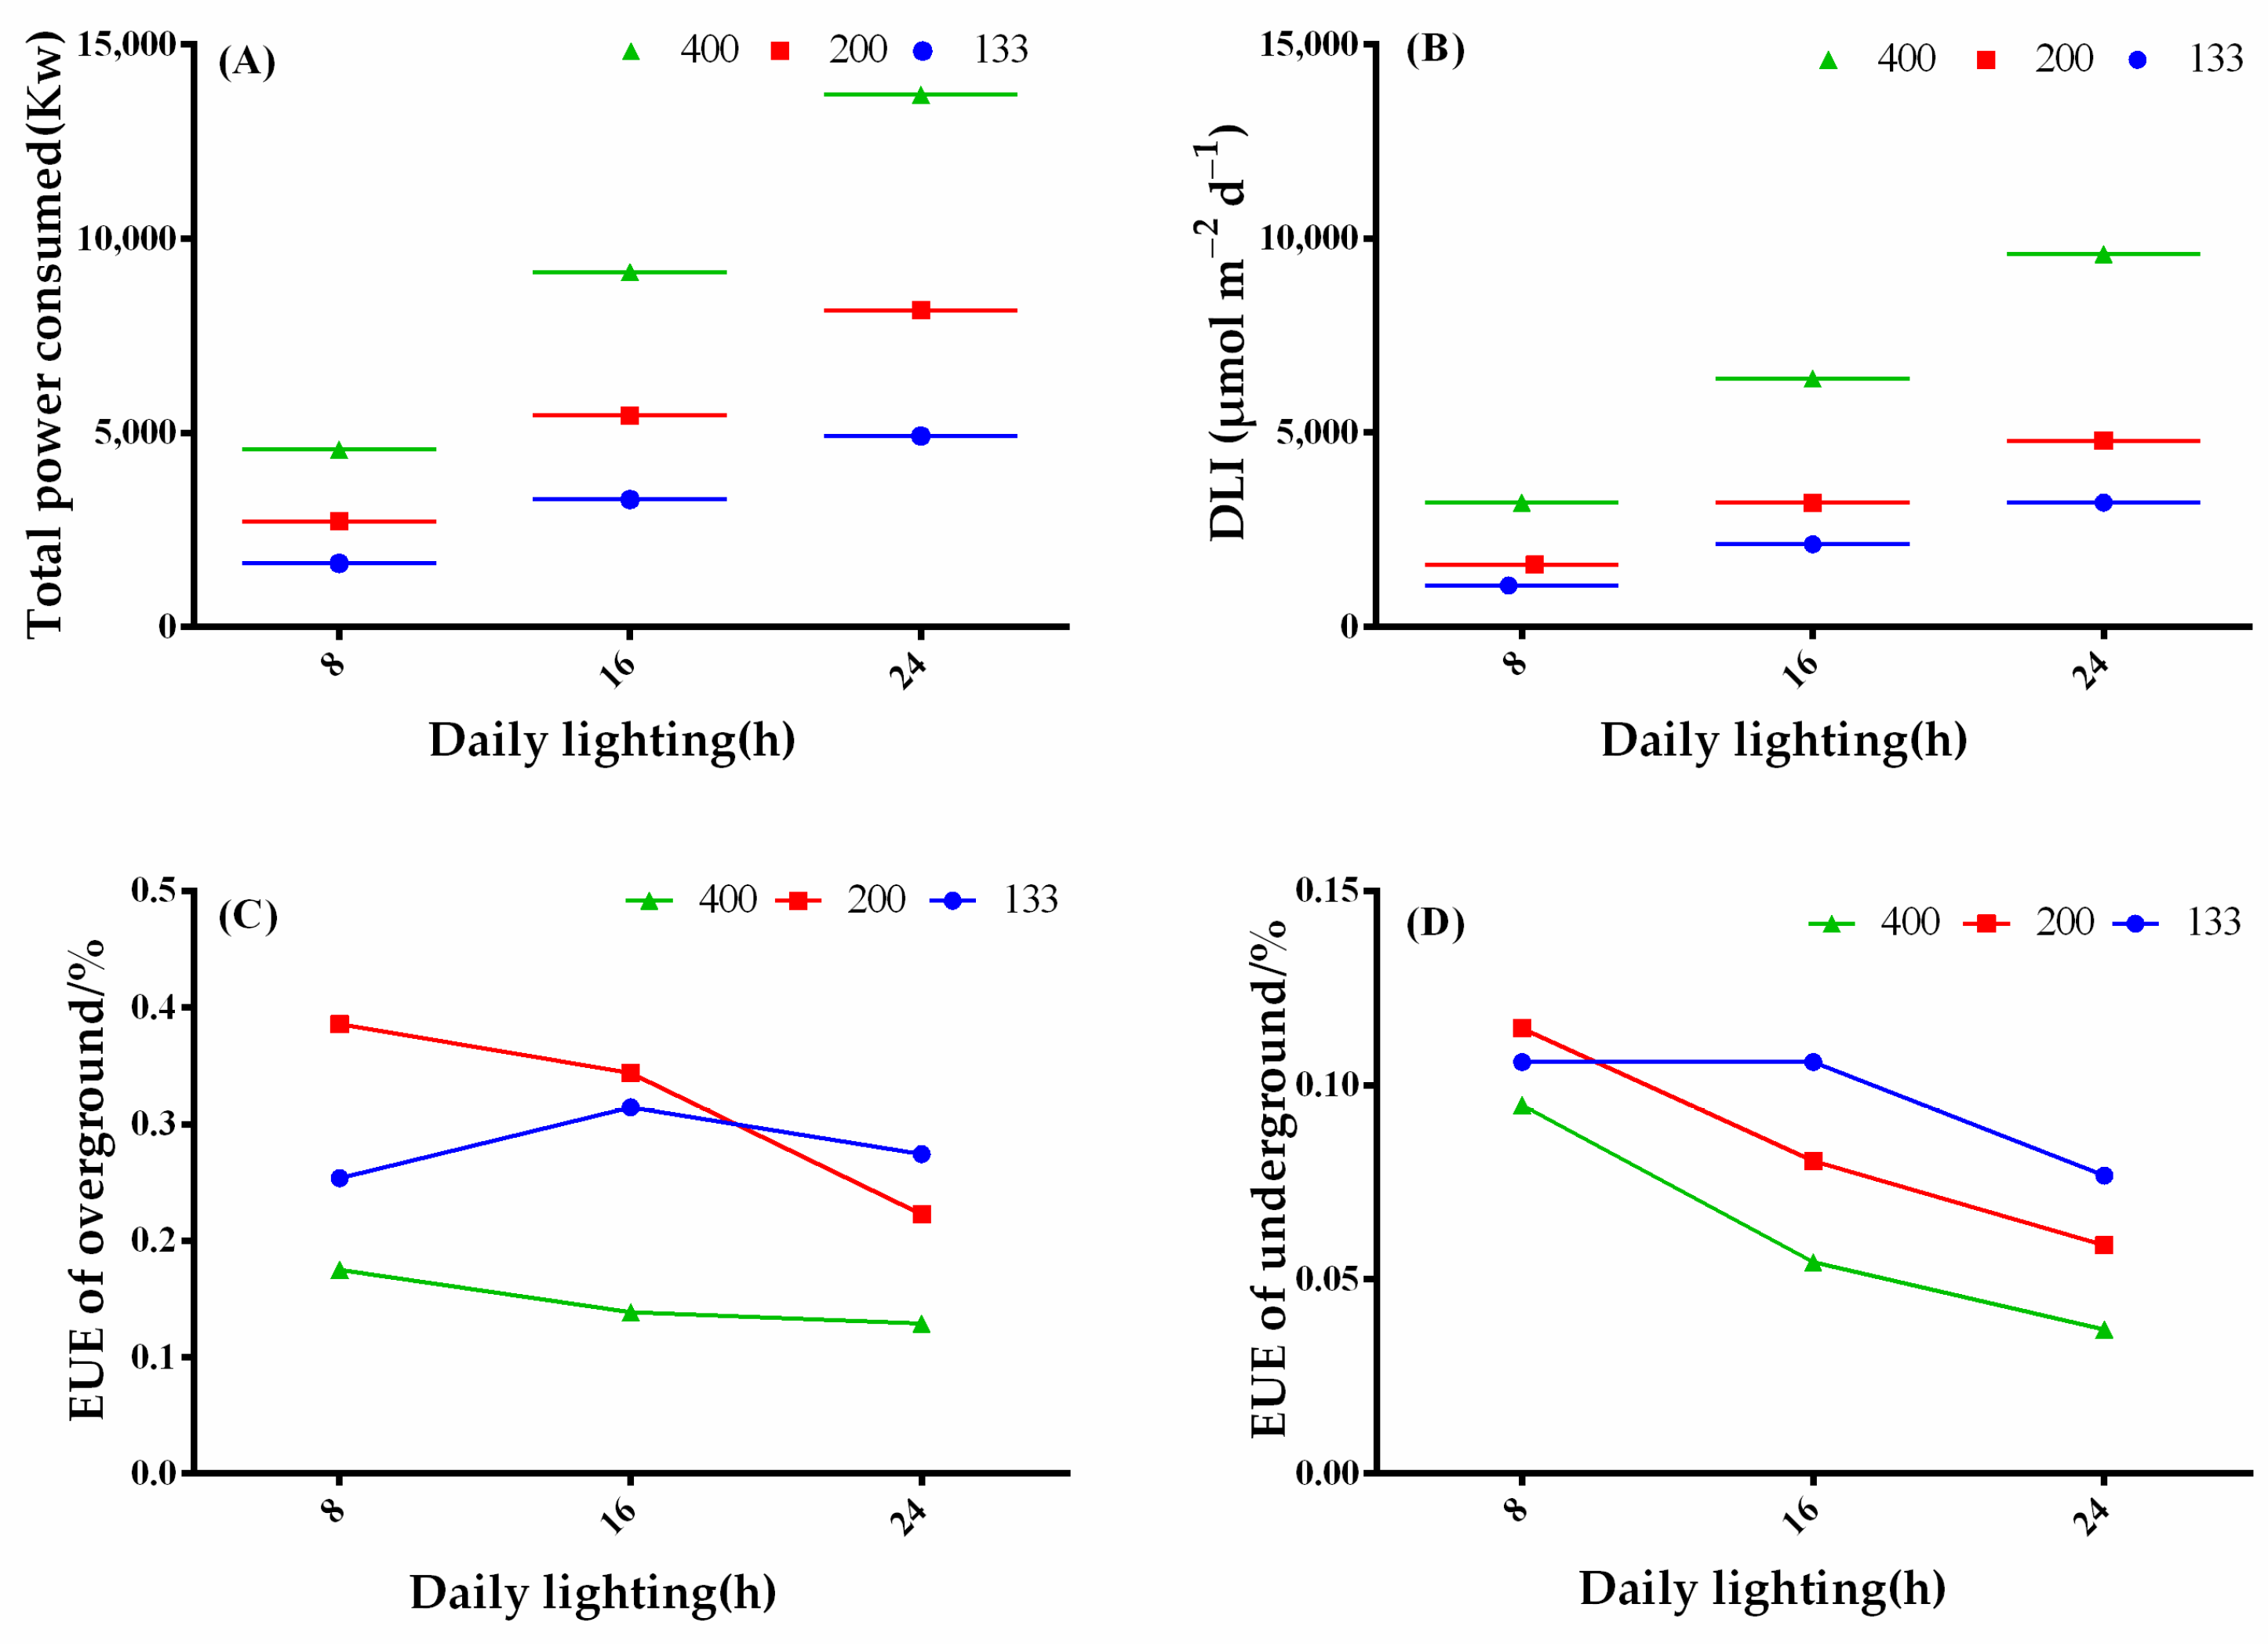
3.6. The Influence of Light Intensity and Photoperiod on Plant Energy Utilization Efficiency

The total power consumption increased with increasing photoperiod and light intensity. Among them, under the 24-h treatment with a light intensity of 400 μmol·m−2·s−1, the total power consumption was the highest, which was 5.04, 2.52, and 1.68 times that of the 8-, 16-, and 24-h treatments with a light intensity of 200 μmol·m−2·s−1, respectively (Figure 6A). The DLI was consistent between the 24-h treatment with a light intensity of 133 μmol·m−2·s−1, the 16-h treatment with a light intensity of 200 μmol·m−2·s−1, and the 8-h treatment with a light intensity of 400 μmol·m−2·s−1, but inconsistent with the total power consumption (Figure 6A,B). The aboveground electrical energy utilization efficiency was highest under the 8-h and 16-h treatments with a light intensity of 200 μmol·m−2·s−1 and lowest under the 24-h treatments with a light intensity of 400 μmol·m−2·s−1. Under the 24-h treatment, compared to a light intensity of 200 μmol·m−2·s−1, a light intensity of 133 μmol·m−2·s−1 showed a higher aboveground electrical energy utilization efficiency (Figure 6C). The underground electrical energy utilization efficiency showed a more noticeable decrease with increasing photoperiod, and under the 133 μmol·m−2·s−1 light intensity treatment, both the 8- and 16-h treatments promoted the underground electrical energy utilization efficiency of coriander (Figure 6D). Therefore, the 8- and 16-h treatments with a light intensity of 200 μmol·m−2·s−1 exhibited higher energy utilization efficiency, making them suitable for cultivating coriander for fresh leaf production.

4. Discussion

Plants regulate their developmental processes by perceiving their light environment. The growth and quality of plants are directly influenced by light. Studies have shown that the light morphology of seedlings responds earliest during the dark-to-light transition when the cotyledons emerge from the soil. Newly emerged seedlings exhibit shorter hypocotyls and expand green cotyledons, enhancing their photosynthetic absorption and conversion capacity [16]. Plants reshape their morphology and alter physiological processes to enhance photosynthetic capacity and adapt to different light conditions [23]. In this study, compared to moderate light intensity of 200 μmol·m−2·s−1, coriander plants under the high light treatment of 400 μmol·m−2·s−1 showed a significant decrease in plant height and leaf area. In contrast, stem thickness showed no significant difference. The morphological parameters under the same light intensity did not differ significantly under different photoperiod treatments (Table 1). This is similar to the findings of Tang et al. [24]. Under low light-intensity treatment, the activation of PIF expression increased the auxin level in this tissue, which was subsequently transported to the stem, inducing stem elongation [25]. To increase light absorption by the leaves, photosynthetic products are preferentially allocated to promote stem elongation rather than increasing stem thickness under lower light intensity. In this study, the light intensity treatment of 133 μmol·m−2·s−1 inhibited the growth of coriander (Figure 2D), consistent with previous research findings. Compared to the high light treatment of 400 μmol·m−2·s−1, there was no significant difference in plant height under the weak light treatment of 133 μmol·m−2·s−1, while stem thickness showed a significant decrease (Table 1). Therefore, under the light intensity treatment of 200 μmol·m−2·s−1, the larger leaf area eliminates the limitations of weak light on photosynthesis. In comparison, the lower leaf area under the light intensity treatment of 133 μmol·m−2·s−1 may affect light interception [26]. Additionally, the significant decrease in leaf area under the high light treatment of 400 μmol·m−2·s−1 also protects the internal photosynthetic structures of the leaves. In conclusion, the moderate light intensity of 200 μmol·m−2·s−1 promoted the morphological development of coriander.
Consistent with the morphological changes, this study found that a light intensity of 200 μmol·m−2·s−1 significantly promoted both the aboveground and belowground fresh weight of coriander. As the duration of light exposure increased, the dry and fresh weights significantly increased for all light-intensity treatments, with the high light intensity of 400 μmol·m−2·s−1 significantly promoting an increase in root dry weight. Similar results regarding the promotion of root dry weight accumulation under high light intensity and continuous light exposure have been reported [19,24,27]. On one hand, this may be due to more sugars being transported to the roots to promote their growth and development [28,29]. On the other hand, intense light induces cytokinin synthesis in tender leaves, which are transported to the roots through polar transport, promoting lateral root development [30,31]. In this study, 24 h of continuous light exposure promoted the growth of coriander, which is consistent with the results of studies on lettuce, watercress, and the medicinal plant Paeonia lactiflora [3,32,33]. Continuous light exposure may induce chloroplasts to exhibit adaptive ultrastructure, biochemical reactions, and specific arrangements of photosynthetic pigments in thylakoids, thereby increasing photosynthetic quantum efficiency and enhancing crop yield and leaf dry weight [34]. In contrast, a study found that higher light intensity and shorter photoperiod treatments promoted the growth of Amaranthus tricolor. Therefore, the effectiveness of increasing light exposure on crop growth is influenced by factors such as plant species and lighting strategies [33,35].
Chlorophyll is the central pigment in the photosynthetic system of green plants, and its content directly affects crop photosynthetic capacity and yield [36]. The weak light treatment reduced the chlorophyll content in various varieties of Xinjiang melon, and similar results were also found in cucumber seedlings [37]. This is contrary to the results of this study, where low light intensity treatment may reduce the damaging effect on chlorophyll and promote chlorophyll synthesis. The results of this study showed a significant decrease in chlorophyll a, chlorophyll b, and total chlorophyll content under the high light intensity treatment of 400 μmol·m−2·s−1, which is consistent with the findings of previous research. Weak light promotes the capture of light energy by the antenna complexes in chloroplasts, and plants adapt to low light stress by altering chlorophyll content. On the other hand, high light intensity effectively protects the photosynthetic machinery by reducing chlorophyll content, reducing light absorption and conversion, increasing heat dissipation, and avoiding damage to the photosystems caused by excess light energy. The eggplant seedlings under continuous light treatment had low levels of chlorophyll content and even severe wilting and necrosis. This is consistent with the results of this study, where apart from the light intensity treatment of 200 μmol·m−2·s−1, both the light intensity treatments of 133 and 400 μmol·m−2·s−1 showed lower chlorophyll content compared to other photoperiod treatments. This may be because the continuous light treatment alters the formation and conversion of light-harvesting antenna complexes responsible for collecting light and transferring energy to the photosystems. These changes may be related to lower expression of the CAB-13 gene compared to plants tolerant to continuous light exposure.
Chlorophyll fluorescence signals are byproducts of plant photosynthesis and consist of red and far-red emissions released from chloroplasts, emitted from both sides of the leaf. Chlorophyll fluorescence is widely used to assess photosynthetic functionality [38,39,40,41]. An increase in Fo indicates a compromised energy capture efficiency of the PSII reaction center [42]. In this study, Fo increased significantly under continuous light exposure for 24 h, and under the illumination of 400 μmol·m−2·s−1 for 16 h, Fo also increased significantly. This suggests that intense and continuous lighting can cause photodamage to coriander [43]. Both high and low light intensities cause the electron transfer rate in the photosynthetic system to decline, which is consistent with the changes in Fv/Fm observed under different light intensity treatments after 16 h of lighting in this study. Under the 200 μmol·m−2·s−1 light intensity, the highest Fv/Fm was observed, while treatments with 400 and 133 μmol·m−2·s−1 both resulted in reduced Fv/Fm; furthermore, under continuous lighting for 24 h, a lower Fv/Fm was observed, which is contrary to the results of the study by Velez-Ramirez et al. Generally, a reduction in Fv/Fm is associated with an inhibition of the photosynthetic system, as under stress conditions, protective mechanisms are overwhelmed by water loss, leading to membrane-related damage [44]. When the function and structure of PSII are compromised, Fv/Fm is reduced, indicating that coriander is not tolerant to continuous lighting and can suffer functional and structural damage to PSII under such conditions [45]. The light energy absorbed by chlorophyll molecules can be dissipated through photochemistry, heat dissipation, and fluorescence. A substantial part of the absorbed light, referred to as qP, is used to drive photosynthesis. At the same time, NPQ is harmless, i.e., the dissipating of excess excitation energy of chlorophyll in the PSII complexes as heat [43]. In this study, continuous lighting reduced NPQ under all light intensity treatments, suggesting that plants do not suffer adverse effects on photosynthesis due to NPQ under continuous lighting; on the contrary, a reduction in qP under 400 and 133 μmol·m−2·s−1 after 8 h of light exposure could negatively affect photosynthesis.
Photosynthesis is when green plants convert solar energy into chemical energy [46]. By measuring the stomatal development and photosynthetic rate of coriander, the study examined the photosynthetic response and gas exchange of coriander to different light intensities and photoperiods. The results showed that treatment with a light intensity of 200 μmol·m−2·s−1 promoted an increase in Pn; Pn decreased under high light treatment at 400 μmol·m−2·s−1; and there was a downward trend in Pn with increased illumination time, similar to the trend in Fv/Fm, suggesting that the negative impact of continuous lighting on photosynthetic capacity may be related to damage to the photosynthetic system [44]; the negative impact of high light intensity at 400 μmol·m−2·s−1 on Pn might be associated with lower chlorophyll content. Previous research indicated that vigorous photosynthesis causes a decrease in intercellular CO2 concentration, thereby inducing stomatal opening [47]. This study attained similar results: in the treatment with 200 μmol·m−2·s−1 light intensity, the length and width of stomata on the adaxial (upper) surface of the leaf, as well as the pore length, all significantly increased, in the absence of significant differences in Ci. Coriander has amphistomatous leaves, with stomata on both the adaxial (upper epidermis) and abaxial (lower epidermis) surfaces responding differently to light [48]. The adaxial stomata are exposed to more direct radiation, while the abaxial stomata are shaded by the leaf itself, receiving light transmitted through the leaf mesophyll [49]. The study also found that with increased light intensity and illumination time, the length and width of the stomata on the abaxial surface showed a downward trend, which might be related to the plant’s adaptive changes under high light intensity exposure, maintaining a constant Ci [49]. Environmental conditions greatly influence stomatal density. High light intensity and continuous lighting can raise leaf temperature, prompting the plant to develop more stomata to cool the leaf environment, preventing damage to the photosynthetic apparatus [50]. In this study, low light improved the WUE of coriander, suggesting that coriander can accumulate carbon with less water loss [51].

5. Conclusions

This study examined how different light environments affect the morphological development and photosynthetic characteristics of coriander in PFALs under various combinations of light intensity and photoperiod. Results indicated that both a light intensity of 400 μmol·m2·s1 and continuous lighting for 24 h reduced coriander’s photosynthetic capability. Although continuous lighting for 24 h at a light intensity of 200 μmol·m2·s1 could increase coriander yield, it came with low electrical energy utilization efficiency. An 8-h photoperiod significantly affected coriander yield, showing a decrease of 26.51% to 42.04% compared to a 16-h photoperiod. Low light intensity hampered the development of plant height, stem thickness, leaf area, and aboveground yield, indicating that a light intensity of 133 μmol·m2·s1 was unsuitable for coriander growth. Therefore, to optimize electrical energy utilization efficiency, yield, and morphological development, it was recommended to maintain a light intensity of 200 μmol·m2·s1 with a 16-h photoperiod in coriander PFALs cultivation.

Author Contributions

Conceptualization, S.W.; formal analysis, F.W. and Q.G.; investigation, F.W. and Q.G.; writing—original draft preparation, F.W. and Q.G.; writing—review and editing, G.J., J.W. and Y.D.; funding acquisition, F.W. All authors have read and agreed to the published version of the manuscript.

Funding

This research was funded by the Sichuan Science and Technology Program, grant number 2022JDRC0108; Agricultural Science and Technology Innovation Program of Shijiazhuang, grant number 23008; the Key Research and Development Program of Chengdu, grant number 2022-YF05-000617-SN, and the Agricultural Science and Technology Innovation Program of CAAS, grant number ASTIP-34-IUA-01.

Data Availability Statement

The original contributions presented in the study are included in the article, further inquiries can be directed to the corresponding author.

Conflicts of Interest

The authors declare no conflicts of interest.

References

  1. Mandal, S.; Mandal, M. Coriander (Coriandrum sativum L.) essential oil: Chemistry and biological activity. Asian Pac. J. Trop. Biomed. 2015, 5, 421–428. [Google Scholar] [CrossRef]
  2. Laribi, B.; Kouki, K.; M'Hamdi, M.; Bettaieb, T. Coriander (Coriandrum sativum L.) and its bioactive constituents. Fitoterapia 2015, 103, 9–26. [Google Scholar] [CrossRef]
  3. Nadeem, M.; Muhammad Anjum, F.; Issa Khan, M.; Tehseen, S.; El-Ghorab, A.; Iqbal Sultan, J. Nutritional and medicinal aspects of coriander (Coriandrum sativum L.) A review. Br. Food J. 2013, 115, 743–755. [Google Scholar] [CrossRef]
  4. Al-Snafi, A.E. A review on chemical constituents and pharmacological activities of Coriandrum sativum. IOSR J. Pharm. 2016, 6, 17–42. [Google Scholar] [CrossRef]
  5. Duarte, A.; Luís, Â.; Oleastro, M.; Domingues, F.C. Antioxidant properties of coriander essential oil and linalool and their potential to control Campylobacter spp. Food Control 2016, 61, 115–122. [Google Scholar] [CrossRef]
  6. Prachayasittikul, V.; Prachayasittikul, S.; Ruchirawat, S.; Prachayasittikul, V. Coriander (Coriandrum sativum): A promising functional food toward the well-being. Food Res. Int. 2018, 105, 305–323. [Google Scholar] [CrossRef]
  7. Khare, M.; Tiwari, S.; Sharma, Y. Disease problems in the cultivation of coriander (Coriandrum sativum L.) and their management leading to production of high quality pathogen free seed. Int. J. Seed Spices 2017, 7, 1–7. [Google Scholar]
  8. Swisher Grimm, K.; Crosslin, J.; Cooper, W.; Frost, K.; du Toit, L.J.; Wohleb, C.H. First report of curly top of Coriandrum sativum caused by Beet curly top virus in the Columbia Basin of Washington State. Plant Dis. 2021, 105, 3313. [Google Scholar] [CrossRef]
  9. Masada, K.; Hosni, K.; Taarit, M.B.; Hammami, M.; Marzouk, B. Effects of crop season and maturity stages on the yield and composition of essential oil of coriander (Coriandrum sativum L.) fruit. Med. Aromat. Plant Sci. Biotechnol. 2012, 6, 115–122. [Google Scholar]
  10. Msaada, K.; Hosni, K.; Taarit, M.B.; Hammami, M.; Marzouk, B. Effects of growing region and maturity stages on oil yield and fatty acid composition of coriander (Coriandrum sativum L.) fruit. Sci. Hortic. 2009, 120, 525–531. [Google Scholar] [CrossRef]
  11. Zheljazkov, V.D.; Pickett, K.M.; Caldwell, C.D.; Pincock, J.A.; Roberts, J.C.; Mapplebeck, L. Cultivar and sowing date effects on seed yield and oil composition of coriander in Atlantic Canada. Ind. Crops Prod. 2008, 28, 88–94. [Google Scholar] [CrossRef]
  12. Khodadadi, M.; Dehghani, H.; Javaran, M.J.; Christopher, J.T. Fruit yield, fatty and essential oils content genetics in coriander. Ind. Crops Prod. 2016, 94, 72–81. [Google Scholar] [CrossRef]
  13. Mikhail, A.F.; Pereboom, M.; Utsi, L.; Hawker, J.; Lighthill, J.; Aird, H.; Swindlehurst, M.; Greig, D.R.; Jenkins, C.; Godbole, G. Utility of whole-genome sequencing during an investigation of multiple foodborne outbreaks of Shigella sonnei. Epidemiol. Infect. 2021, 149, e71. [Google Scholar] [CrossRef]
  14. Mishra, B.K.; Dubey, P.; Aishwath, O.; Kant, K.; Sharma, Y.; Vishal, M. Effect of plant growth promoting rhizobacteria on coriander (Coriandrum sativum) growth and yield under semi-arid condition of India. Indian J. Agric. Sci 2017, 87, 607–612. [Google Scholar] [CrossRef]
  15. Szempliński, W.; Nowak, J.; Jankowski, K.J. Coriander (Coriandrum sativum L.) response to different levels of agronomic factors in Poland. Ind. Crops Prod. 2018, 122, 456–464. [Google Scholar] [CrossRef]
  16. Li, X.; Liang, T.; Liu, H. How plants coordinate their development in response to light and temperature signals. Plant Cell 2022, 34, 955–966. [Google Scholar] [CrossRef]
  17. Sharkey, T.D.; Raschke, K. Effect of light quality on stomatal opening in leaves of Xanthium strumarium L. Plant Physiol. 1981, 68, 1170–1174. [Google Scholar] [CrossRef]
  18. Shibaeva, T.G.; Sherudilo, E.G.; Rubaeva, A.A.; Titov, A.F. Continuous LED lighting enhances yield and nutritional value of four genotypes of Brassicaceae microgreens. Plants 2022, 11, 176. [Google Scholar] [CrossRef]
  19. Zhang, X.; He, D.; Niu, G.; Yan, Z.; Song, J. Effects of environment lighting on the growth, photosynthesis, and quality of hydroponic lettuce in a plant factory. Int. J. Agric. Biol. Eng. 2018, 11, 33–40. [Google Scholar] [CrossRef]
  20. Dolezal, J.; Jandova, V.; Macek, M.; Liancourt, P. Contrasting biomass allocation responses across ontogeny and stress gradients reveal plant adaptations to drought and cold. Funct. Ecol. 2021, 35, 32–42. [Google Scholar] [CrossRef]
  21. Ye, Z.P.; Suggett, D.J.; Robakowski, P.; Kang, H.J. A mechanistic model for the photosynthesis–light response based on the photosynthetic electron transport of photosystem II in C3 and C4 species. New Phytol. 2013, 199, 110–120. [Google Scholar] [CrossRef]
  22. Savvides, A.; Fanourakis, D.; van Ieperen, W. Co-ordination of hydraulic and stomatal conductances across light qualities in cucumber leaves. J. Exp. Bot. 2012, 63, 1135–1143. [Google Scholar] [CrossRef] [PubMed]
  23. Pan, T.; Ding, J.; Qin, G.; Wang, Y.; Xi, L.; Yang, J.; Li, J.; Zhang, J.; Zou, Z. Interaction of supplementary light and CO2 enrichment improves growth, photosynthesis, yield, and quality of tomato in autumn through spring greenhouse production. HortScience 2019, 54, 246–252. [Google Scholar] [CrossRef]
  24. Tang, W.; Guo, H.; Baskin, C.C.; Xiong, W.; Yang, C.; Li, Z.; Song, H.; Wang, T.; Yin, J.; Wu, X. Effect of light intensity on morphology, photosynthesis and carbon metabolism of alfalfa (Medicago sativa) seedlings. Plants 2022, 11, 1688. [Google Scholar] [CrossRef]
  25. Bellstaedt, J.; Trenner, J.; Lippmann, R.; Poeschl, Y.; Zhang, X.; Friml, J.; Quint, M.; Delker, C. A mobile auxin signal connects temperature sensing in cotyledons with growth responses in hypocotyls. Plant Physiol. 2019, 180, 757–766. [Google Scholar] [CrossRef]
  26. Jeon, K.S.; Song, K.S.; Choi, K.S.; Kim, C.H.; Park, Y.B.; Kim, J.J. Growth and photosynthetic characteristics of Atractylodes japonica by light controls and leaf mold treatment in forest farming. Korean J. Med. Crop Sci. 2015, 23, 161–167. [Google Scholar] [CrossRef]
  27. Pan, T.; Wang, Y.; Wang, L.; Ding, J.; Cao, Y.; Qin, G.; Yan, L.; Xi, L.; Zhang, J.; Zou, Z. Increased CO2 and light intensity regulate growth and leaf gas exchange in tomato. Physiol. Plant. 2020, 168, 694–708. [Google Scholar] [CrossRef]
  28. Kircher, S.; Schopfer, P. Photosynthetic sucrose acts as cotyledon-derived long-distance signal to control root growth during early seedling development in Arabidopsis. Proc. Natl. Acad. Sci. USA 2012, 109, 11217–11221. [Google Scholar] [CrossRef]
  29. Zheng, J.; Ji, F.; He, D.; Niu, G. Effect of light intensity on rooting and growth of hydroponic strawberry runner plants in a LED plant factory. Agronomy 2019, 9, 875. [Google Scholar] [CrossRef]
  30. Costigan, S.E.; Warnasooriya, S.N.; Humphries, B.A.; Montgomery, B.L. Root-localized phytochrome chromophore synthesis is required for photoregulation of root elongation and impacts root sensitivity to jasmonic acid in Arabidopsis. Plant Physiol. 2011, 157, 1138–1150. [Google Scholar] [CrossRef]
  31. Swarup, K.; Benková, E.; Swarup, R.; Casimiro, I.; Péret, B.; Yang, Y.; Parry, G.; Nielsen, E.; De Smet, I.; Vanneste, S. The auxin influx carrier LAX3 promotes lateral root emergence. Nat. Cell Biol. 2008, 10, 946–954. [Google Scholar] [CrossRef]
  32. Zha, L.; Zhang, Y.; Liu, W. Dynamic responses of ascorbate pool and metabolism in lettuce to long-term continuous light provided by red and blue LEDs. Environ. Exp. Bot. 2019, 163, 15–23. [Google Scholar] [CrossRef]
  33. Shao, M.; Liu, W.; Zhou, C.; Wang, Q.; Li, B. Alternation of temporally overlapped red and blue light under continuous irradiation affected yield, antioxidant capacity and nutritional quality of purple-leaf lettuce. Sci. Hortic. 2022, 295, 110864. [Google Scholar] [CrossRef]
  34. Lichtenthaler, H.K.; Ač, A.; Marek, M.V.; Kalina, J.; Urban, O. Differences in pigment composition, photosynthetic rates and chlorophyll fluorescence images of sun and shade leaves of four tree species. Plant Physiol. Biochem. 2007, 45, 577–588. [Google Scholar] [CrossRef] [PubMed]
  35. Pham, D.M.; Chun, C. Growth and leaf injury in tomato plants under continuous light at different settings of constant and diurnally varied photosynthetic photon flux densities. Sci. Hortic. 2020, 269, 109347. [Google Scholar] [CrossRef]
  36. Gitelson, A.A.; Gritz, Y.; Merzlyak, M.N. Relationships between leaf chlorophyll content and spectral reflectance and algorithms for non-destructive chlorophyll assessment in higher plant leaves. J. Plant Physiol. 2003, 160, 271–282. [Google Scholar] [CrossRef] [PubMed]
  37. Ma, D.; Pang, J.; Huo, Z. Effect of low light on photosynthesis and membrane-lipid peroxidation of Cucumis sativus seedling. Acta Agric. Univ. Henanensis 1998, 32, 68–72. [Google Scholar]
  38. Baker, N.R. Chlorophyll fluorescence: A probe of photosynthesis in vivo. Annu. Rev. Plant Biol. 2008, 59, 89–113. [Google Scholar] [CrossRef] [PubMed]
  39. Campbell, P.K.; Huemmrich, K.F.; Middleton, E.M.; Ward, L.A.; Julitta, T.; Daughtry, C.S.; Burkart, A.; Russ, A.L.; Kustas, W.P. Diurnal and seasonal variations in chlorophyll fluorescence associated with photosynthesis at leaf and canopy scales. Remote Sens. 2019, 11, 488. [Google Scholar] [CrossRef]
  40. Murchie, E.H.; Lawson, T. Chlorophyll fluorescence analysis: A guide to good practice and understanding some new applications. J. Exp. Bot. 2013, 64, 3983–3998. [Google Scholar] [CrossRef]
  41. Van Wittenberghe, S.; Alonso, L.; Verrelst, J.; Moreno, J.; Samson, R. Bidirectional sun-induced chlorophyll fluorescence emission is influenced by leaf structure and light scattering properties—A bottom-up approach. Remote Sens. Environ. 2015, 158, 169–179. [Google Scholar] [CrossRef]
  42. Paunov, M.; Koleva, L.; Vassilev, A.; Vangronsveld, J.; Goltsev, V. Effects of different metals on photosynthesis: Cadmium and zinc affect chlorophyll fluorescence in durum wheat. Int. J. Mol. Sci. 2018, 19, 787. [Google Scholar] [CrossRef] [PubMed]
  43. Fu, W.; Li, P.; Wu, Y. Effects of different light intensities on chlorophyll fluorescence characteristics and yield in lettuce. Sci. Hortic. 2012, 135, 45–51. [Google Scholar] [CrossRef]
  44. Souza, R.; Machado, E.; Silva, J.; Lagôa, A.; Silveira, J. Photosynthetic gas exchange, chlorophyll fluorescence and some associated metabolic changes in cowpea (Vigna unguiculata) during water stress and recovery. Environ. Exp. Bot. 2004, 51, 45–56. [Google Scholar] [CrossRef]
  45. Maxwell, K.; Johnson, G.N. Chlorophyll fluorescence—A practical guide. J. Exp. Bot. 2000, 51, 659–668. [Google Scholar] [CrossRef] [PubMed]
  46. Magney, T.S.; Barnes, M.L.; Yang, X. On the covariation of chlorophyll fluorescence and photosynthesis across scales. Geophys. Res. Lett. 2020, 47, e2020GL091098. [Google Scholar] [CrossRef]
  47. Roelfsema, M.R.G.; Hanstein, S.; Felle, H.H.; Hedrich, R. CO2 provides an intermediate link in the red light response of guard cells. Plant J. 2002, 32, 65–75. [Google Scholar] [CrossRef] [PubMed]
  48. Soares, A.S.; Driscoll, S.P.; Olmos, E.; Harbinson, J.; Arrabaça, M.C.; Foyer, C.H. Adaxial/abaxial specification in the regulation of photosynthesis and stomatal opening with respect to light orientation and growth with CO2 enrichment in the C4 species Paspalum dilatatum. New Phytol. 2008, 177, 186–198. [Google Scholar] [CrossRef]
  49. Wang, Y.; Noguchi, K.; Terashima, I. Photosynthesis-dependent and-independent responses of stomata to blue, red and green monochromatic light: Differences between the normally oriented and inverted leaves of sunflower. Plant Cell Physiol. 2011, 52, 479–489. [Google Scholar] [CrossRef]
  50. Urban, J.; Ingwers, M.W.; McGuire, M.A.; Teskey, R.O. Increase in leaf temperature opens stomata and decouples net photosynthesis from stomatal conductance in Pinus taeda and Populus deltoides x nigra. J. Exp. Bot. 2017, 68, 1757–1767. [Google Scholar] [CrossRef]
  51. Hanba, Y.; Kogami, H.; Terashima, I. The effect of growth irradiance on leaf anatomy and photosynthesis in Acer species differing in light demand. Plant Cell Environ. 2002, 25, 1021–1030. [Google Scholar] [CrossRef]
Figure 1. Top and side views of coriander plants after 20 days of growth under nine different light intensities and photoperiod coupling treatments (38 days after sowing).
Horticulturae 10 00215 g001
Figure 2. Fresh weight of different plant parts (AC), yield (sum of stem and leaf fresh weight) (D), dry weight of plant parts (EG), and the stem-to-leaf ratio of coriander plants (H) under different light intensities and photoperiod treatments (p < 0.05, n = 6). The x-axis represents different photoperiod treatments: 8: 8 h of light and 16 h of darkness, 16: 16 h of light and 8 h of darkness, and 24: 24 h of continuous light. Different letters indicate statistically significant differences among treatments.
Horticulturae 10 00215 g002
Figure 3. Changes in Fo: initial fluorescence (A), Fv/Fm: photosystem II quantum efficiency (B), NPQ: non-photochemical quenching (C), and qP: photochemical quenching coefficient (D) under different light treatments . The bars represent the mean values ± standard deviation (p < 0.05, n = 6). The x-axis represents different photoperiod treatments: 8: 8 h of light and 16 h of darkness, 16: 16 h of light and 8 h of darkness, and 24: 24 h of continuous light. Light intensity is measured in μmol·m−2·s−1. Different letters indicate statistically significant differences among treatments.
Horticulturae 10 00215 g003
Figure 4. Effects of different light treatments on Pn (net photosynthetic rate) (A), Ci (intercellular carbon dioxide concentration) (B), Tr (transpiration rate) (C), gsw (stomatal conductance) (D), α (light-harvesting efficiency) (E), Rd (dark respiration rate) (F), Pn max (maximum net photosynthetic rate) (G), and WUE (water use efficiency) (H) in coriander. The bars represent the mean values ± standard deviation (p < 0.05, n = 6). The x-axis represents different photoperiod treatments: 8: 8 h of light and 16 h of darkness, 16: 16 h of light and 8 h of darkness, and 24: 24 h of continuous light. Different letters indicate statistically significant differences among treatments.
Horticulturae 10 00215 g004
Figure 5. Effects of different light treatments on the stomatal density (A,E), length (B,F), width (C,G), and aperture length (D,H) of the adaxial and abaxial surfaces of coriander leaves. The bars represent the mean values ± standard deviation (p < 0.05, n = 6). The x-axis represents different photoperiod treatments: 8: 8 h of light and 16 h of darkness, 16: 16 h of light and 8 h of darkness, and 24: 24 h of continuous light. Different letters indicate statistically significant differences among treatments.
Horticulturae 10 00215 g005
Figure 6. Illustrates the changes in total power consumption (A), daily light integral (DLI) (B), aboveground energy utilization efficiency (C), and underground energy utilization efficiency (D) under different light treatments. The bars represent the mean values ± standard deviation (p < 0.05, n = 6). The x-axis represents different photoperiod treatments: 8: 8 h of light and 16 h of darkness, 16: 16 h of light and 8 h of darkness, and 24: 24 h of continuous light.
Horticulturae 10 00215 g006
Table 1. Effects of light intensity and photoperiod coupling on coriander plant height, stem diameter, leaf area, and number of branches.
Photoperiod × Light IntensityPlant Height
/cm
Stem Diameter/mmLeaf Area
/cm2
Branching Number
h × μmol·m−2·s−1
8 × 1335.80 ± 0.38 d4.64 ± 0.43 e70.19 ± 7.14 de9.10 ± 1.14 cd
16 × 1338.24 ± 0.31 c5.95 ± 0.76 d74.51 ± 7.99 e8.60 ± 055 d
24 × 1338.30 ± 0.27 c5.67 ± 0.30 d93.17 ± 5.54 cde8.4 ± 0.55 d
8 × 20012.20 ± 0.45 a7.83 ± 0.57 c140.36 ± 8.47 ab11.60 ± 0.55 b
16 × 20011.00 ± 1.0 b9.31 ± 0.52 a160.63 ± 16.82 a14.00 ± 0.71 a
24 × 20012.68 ± 1.01 a8.26 ± 0.09 bc156.74 ± 10.63 a10.40 ± 0.89 bc
8 × 4005.50 ± 0.35 d5.46 ± 0.31 d111.00 ± 14.73 bcd10.80 ± 0.84 b
16 × 4008.50 ± 0.87 c8.84 ± 0.90 ab87.93 ± 5.99 cde10.40 ± 0.55 bc
24 × 4008.50 ± 0.35 c6.20 ± 0.56 d120.25 ± 18.35 bc10.9 ± 0.65 b
Different letters indicate statistically significant differences among treatments.
Table 2. Effects of light intensity and photoperiod coupling on the content of chlorophyll a, chlorophyll b, carotenoids, and total chlorophyll in coriander.
Photoperiod × Light IntensityChlorophyll a
/mg·g−1
Chlorophyll b
/mg·g−1
Carotenoid
/mg·g−1
Total Chlorophyll
/mg·g−1
/h × μmol·m−2·s−1
8 × 1330.89 ± 0.07 ab0.24 ± 0.01 ab0.19 ± 0.01 abc1.14 ± 0.09 ab
16 × 1330.94 ± 0.10 a0.22 ± 0.03 bc0.21 ± 0.02 a1.16 ± 0.13 ab
24 × 1330.77 ± 0.07 bcd0.19 ± 0.01 de0.18 ± 0.02 bc0.96 ± 0.08 c
8 × 2000.95 ± 0.15 a0.24 ± 0.04 ab0.20 ± 0.03 ab1.19 ± 0.19 a
16 × 2000.80 ± 0.11 bc0.21 ± 0.03 cd0.17 ± 0.02 a1.01 ± 0.15 bc
24 × 2000.97 ± 0.06 a0.26 ± 0.02 a0.21 ± 0.02 a1.23 ± 0.08 a
8 × 4000.74 ± 0.07 cd0.17 ± 0.01 e0.17 ± 0.02 bc0.91 ± 0.09 cd
16 × 4000.78 ± 0.05 bcd0.18 ± 0.01 de0.19 ± 0.02 ab0.96 ± 0.05 c
24 × 4000.65 ± 0.12 d0.14 ± 0.02 f0.16 ± 0.02 c0.79 ± 0.14 d
Different letters indicate statistically significant differences among treatments (p < 0.05).
Disclaimer/Publisher’s Note: The statements, opinions and data contained in all publications are solely those of the individual author(s) and contributor(s) and not of MDPI and/or the editor(s). MDPI and/or the editor(s) disclaim responsibility for any injury to people or property resulting from any ideas, methods, instructions or products referred to in the content.

