Article

Comparison of Citrus Leaf Water Content Estimations Based on the Continuous Wavelet Transform and Fractional Derivative Methods

1
College of Geomatics and Geoinformation, Guilin University of Technology, Guilin 541006, China
2
Guangxi Academy of Specialty Crops, Guilin 541004, China
3
College of Mechanical and Control Engineering, Guilin University of Technology, Guilin 541006, China
*
Author to whom correspondence should be addressed.
Horticulturae 2024, 10(2), 177; https://doi.org/10.3390/horticulturae10020177
Submission received: 22 January 2024 / Revised: 10 February 2024 / Accepted: 14 February 2024 / Published: 16 February 2024

Abstract

:
Citrus tangerines are famous fruits worldwide, and monitoring the water content of citrus leaves is highly important for citrus production. However, there are still challenges in quantitatively estimating the water content of citrus leaves using hyperspectral technology, and the random noise generated during spectral acquisition and the overlapping peaks in the sensitive band of the citrus leaf water content will affect estimation accuracy. To solve these problems and further explore the roles of the continuous wavelet transform (CWT) and fractional-order derivative (FOD) in the estimation of citrus leaf water content, this study intends to use of CWT and FOD to decompose the original spectrum, and then compare the correlation between the original spectrum and leaf water content to explore whether the decomposition treatment has improved the correlation between spectrum and leaf moisture content. Then, the successive projections algorithm (SPA) was used to select feature bands and combine spectral vegetation indices. Partial least squares regression (PLSR) was used to construct water-content inversion models for citrus leaves, and the inversion accuracies of two commonly used spectral preprocessing methods were compared. The results indicate that (1) the CWT can improve the sensitivity of the spectrum to the citrus leaf water content to a certain extent, and the inversion accuracy of the CWT is approximately 5% greater than that of the FOD. (2) On the basis of the CWT and FOD methods, the inversion accuracy of the citrus leaf water content based on SPA screening increased by 9.61% and 9.29%, respectively, compared with the original spectrum. (3) Under CWT decomposition, Scale4 of the Gaus1 wavelet was screened by the SPA, and the inversion model of citrus leaf water content was constructed by combining the spectral vegetation index NDVI with the best results. The R-squared ( R 2 ) and root mean square error (RMSE) values were 0.7491 and 0.0284, respectively, which were both 0.0138 greater than those of the best inversion model for the FOD R 2 . In conclusion, the CWT-SPA combined with the spectral vegetation index can improve the sensitivity of the spectrum to the citrus leaf water content, eliminate a large amount of redundant data, and enhance the prediction ability and stability of the citrus leaf water content.

1. Introduction

Citrus tangerines are famous fruits that are highly valued in domestic and foreign markets. China is the largest producer of citrus fruits, accounting for 72.08% of the world’s citrus planting area and 83.19% of the world’s production. The Guangxi Zhuang Autonomous Region is one of the most important citrus-producing areas in China; it had a citrus planting area of 9.48 million mu and a production of 18.68 million tons in 2022, the highest in the country for eight consecutive years, accounting for 22.21% of the country’s total planting area and making significant contributions to the development of China’s citrus industry. As one of the important indicators for evaluating the growth and development of crops, leaf water content can reflect the growth and disease resistance of crops [1]. A lack of leaf water can affect leaf activity, leading to hindered material transport and reduced chlorophyll content, thereby inhibiting photosynthesis [2], which plays a key role in the growth and yield of citrus tangerines. In recent years, hyperspectral technology has been widely used for the quantitative estimation of various crop growth indicators, such as chlorophyll content, leaf area index, and water content [1,3,4,5,6], due to its advantages of multiple bands and excellent accuracy [7]. Therefore, further exploration of the use of hyperspectral technology for predicting leaf water content information during citrus growth is highly important for assisting in monitoring citrus growth.
Currently, the use of portable geophysical spectrometers (ASDs) is the main way to acquire high-precision hyperspectral data. However, when obtaining hyperspectral data from crop leaves, internal factors in the instrument’s system can cause random noise [8] which overlaps with the effective information about the citrus leaf water content in the frequency band [1]; moreover, the spectral curves are affected by the viscosity of the substance, the particle size, and other special states, as well as the experimentally relevant conditions [9]; therefore, it is very important to adopt suitable preprocessing methods for hyperspectral data. Commonly used spectral preprocessing methods currently include SG smoothing, the second-order derivative (SD), multivariate scattering correction (MSC), and a combination of several preprocessing methods [10] which are conventional methods that can improve the signal-to-noise ratios of spectral intensities but cannot effectively eliminate the effect of spectral overlap. In contrast, the continuous wavelet transform (CWT) and fractional-order derivative (FOD) methods are currently more effective for resolving spectral overlapping features and redundant background signals by refining spectral information in image analysis and analytical chemistry, respectively [6,11,12,13]. Among them, the CWT, with its rich wavelet basis functions and multiresolution analysis advantages, can decompose leaf reflectance spectra into many scale components and model the relationship between the wavelet coefficients of each component and the leaf water content, thus attenuating, to a certain extent, the negative impact of optical noise on hyperspectral data [14], and it is able to improve the correlation between the spectra and crop growth information. The CWT has been used to improve the accuracy of model inversion for soil moisture content [15], winter wheat chlorophyll content [13], and winter wheat canopy leaf water content [6]. Unlike the first and second derivatives, the FOD can reduce the overlap between effective information and noise, achieving the interpolation of various extreme points within the original spectral curve of the blade. This enables the development of more effective information on leaf water content to be obtained from spectral curves [16], and, by changing the spectral absorption band and overlapping peak shape, the impact on the original spectral data curve of the leaves is reduced [17]. The FOD has been used to achieve better results in estimating citrus leaf chlorophyll content [18] and the simultaneous estimation of multiple soil properties [19], thereby improving estimation accuracy. In previous studies, few researchers considered extending the CWT and FOD transformation methods to the estimate citrus leaf water content, and further investigations and analyses are needed to compare and contrast how well these two methods work in the estimation of citrus leaf water content.
Due to the wide band range of hyperspectral data, determining how to extract characteristic bands applicable to a citrus leaf water content estimation from a large amount of hyperspectral data is the key to effectively leveraging the advantages of hyperspectral data. Recursive feature elimination (RFE), the successive projections algorithm (SPA), the competitive adaptive reweighted (CARS) method and other methods are commonly used for spectral feature optimisation [2,20,21,22]. Among them, the SPA can eliminate redundant data and screen feature bands to improve model efficiency by minimising the influence of collinearity effects in calibration datasets [23], and some scholars have used it to accurately and quickly predict seed vitality [24].
The spectral vegetation index is, to some extent, related to plant growth information [1] which can more mathematically reflect vegetation characteristics [25] and play an important role in monitoring changes in leaf water content and leaf area index values [26]. To further improve inversion accuracy, many scholars have used different spectral preprocessing methods combined with spectral vegetation indices to invert the growth information of crops such as winter wheat and maize; these methods have achieved better results [26,27,28]. There has been no relevant research on the combination of vegetation indices with the CWT or FOD feature bands for the inversion of citrus leaf water content.
Considering the important impact of leaf water content on citrus yield, to fill the research gap mentioned above, this study used the Citrus Cooperative Practice Base in Yanshan District, Guilin City, as its study area. The water content of citrus leaves and corresponding hyperspectral data were collected, the raw spectral data of the citrus leaves were decomposed using the CWT and FOD methods, and the characteristic bands were screened using the SPA algorithm. Finally, partial least squares regression (PLSR) was used to construct a water-content inversion model for citrus leaves by combining spectral vegetation indices. The research objectives of this study were as follows:
(1)
Use the CWT and FOD methods to process the raw spectral data of citrus leaves to explore and compare the roles of the CWT and FOD in the inversion accuracy of citrus leaf water content.
(2)
Use the SPA to explore sensitive band regions for inverting citrus leaf water content and then combine spectral vegetation indices to explore whether the ability to predict citrus leaf water content information can be enhanced.
(3)
Based on the SPA combined with the spectral vegetation index, compare the CWT and FOD inversion models to determine the best model for inverting the water content of citrus leaves.

2. Data and Methods

2.1. Overview of the Study Area

The exact location of Guilin, the city with the highest production and sales of citrus in Guangxi Province, is shown in Figure 1a. Located in the subtropical zone, the weather is warm and humid, with four distinct seasons. The average temperature throughout the year is above 18 °C, with more than 1000 mm of precipitation, abundant rainfall, a wide range of soil types, and abundant organic matter, potassium, calcium, and other elements. Due to the fact that citrus tangerines require an average annual sunshine duration of 1660 h, abundant sunshine and long sunshine duration are very important. Therefore, these favourable climatic conditions are conducive to ensuring that citrus tangerine trees are in the best growth situation. This study took the Citrus Cooperative Practice Base in Yanshan District, Guilin City, as a research area (25°3′1″ N, 110°17′11″ E) and two-year-old citrus tangerine trees as the objects of this experiment. Figure 1b shows the growth of the fruit trees, and Figure 1c shows the location of leaf collection.

2.2. Data and Spectral Collection

2.2.1. Sample Collection

The data for this experiment were collected in the morning of 8 April 2023 in the citrus study area, and a total of 57 citrus tangerine trees were selected as sample fruit trees. The sample trees were divided into east, south, west, and north directions to collect 5 leaves, which were packed into 4 sealed bags after collection according to the number. Afterward, the bags were immediately placed in a constant-temperature box for subsequent experiments to measure the fresh weight, dry weight, spectrum, chlorophyll value, leaf area, and so on. A total of 1140 leaves in 228 bags were collected from the 57 fruit trees.

2.2.2. Spectral Acquisition

A portable ground spectrometer (ASD) was used to acquire hyperspectral data from the 1140 collected leaves. The equipment parameters are shown in Figure 1d. Before using the ASD for leaf spectral measurements, it is necessary to preheat the ASD instrument with power for more than 15 min, after which the instrument is calibrated using a calibration white board on the bottom of the handheld leaf holder. The collected citrus tangerines leaves were placed in a handheld leaf holder so that the front side of each leaf was aligned with the light source of the handheld leaf holder, and then the leaf was clamped to ensure that it was impervious to light, as shown in Figure 1e. After the spectral curve on the mobile computer stabilised, 10 spectral curves were saved, each of which was obtained by averaging the 10 spectra, as shown in Figure 1f. Then, by averaging the 10 saved spectral curves, the final spectral curve of the leaf was obtained. During the measurement process, it was necessary to ensure that the instrument was calibrated once every 20 leaves, which can stabilise and realise the acquired spectral curve. Due to the effect of optical noise, the optoelectronic transmission and processing of spectral data generate more noise in the (350~400 nm) and (2401~2500 nm) spectral reflectance ranges [29]. Therefore, the spectral reflectances of the above two ranges were removed, as shown in Figure 1g.

2.2.3. Water Content Measurement

In order to reduce the impact of natural water loss on citrus tangerine spectra, especially in the visible light band, this article adopted the drying method [30]. This study used the drying method to determine the water content of the citrus leaves. The collected citrus leaves were separated and used to determine the fresh weight (fresh weight, FW) of the leaves via precision electronic weighing. Then, all the leaves were placed in an oven, blanched at 105 °C for 30 min, and dried to a constant weight at 80 °C, after which the dry weights of the leaves were determined (dry weight, DW). The water content values of the citrus leaves (relative water content, RWC) were calculated based on the fresh weight and the dry weight values of each citrus leaf according to Equation (1):
R W C = F W D W F W × 100 %
The data from the leaves were divided into a training set (182) and a test set (46) at a ratio of 4:1. After measurement, the water content distribution range in the citrus leaves ranged from 48.51% to 77.87%, with an average of 61.55% and a variance of 0.22%.

2.3. Research Methods

2.3.1. CWT

The CWT is a data analysis method that represents a signal as a set of wavelet functions of different scales and frequencies, thus allowing us to better understand the local features of the signal and to reconstruct and transform the signal while maintaining the reversibility and integrity of the original information [1]. Therefore, it performs well in spectral signal scale decomposition, noise reduction, and feature wavelength selection [31].
The CWT has different wavelet functions which need to be selected for different spectral processing purposes in practical applications. Among them, the Gaussian wavelet does not exhibit significant oscillations or abrupt changes compared to other wavelet functions, increasing the stability of signal processing and analysis. In addition, it can better preserve the local features of the signal and analyse short-term and local features better. Therefore, this study used Gaussian wavelets in the CWT to decompose the spectra of citrus leaves.
The mathematical formulation of the CWT is shown in Equation (2):
W a , b = 1 a + x ( t ) Ψ * ( t b a ) d t
where x ( t ) is the input signal, Ψ * ( t ) is the conjugate of the wavelet function, a and b represent the scale and translation, respectively, and W a , b represents the corresponding wavelet coefficients. The leaf spectral reflectance was transformed into two-dimensional wavelet coefficients using the CWT [15] with Equations (3) and (4):
W f a , b = + f ( λ ) Ψ a , b ( λ ) d λ
Ψ a , b = 1 a Ψ ( λ b a )
where W f a , b is the wavelet coefficient, f ( λ ) is the leaf spectral reflectance, λ is the spectral band in the range of 401~2400 nm, and Ψ a , b ( λ ) is the Gaussian wavelet function transformed by the scaling factor a and scaling factor b.
The decomposition scale of the CWT plays an important role in improving prediction accuracy [32]. Therefore, in this study, the spectra of citrus leaves were decomposed into 20 scales to determine the optimal scale for estimating the water content of citrus leaves.

2.3.2. FOD

The FOD method involves comparisons with first-, second-, and third-order derivatives, which obtains derivatives of different fractional orders, thereby discovering subtle differences between different fractional orders and achieving continuous interpolation [33]. Many mathematical definitions of the FOD have been developed, such as the Riemann–Liouville, Caputo, and Grunwald–Letnikov methods [34]. Among these methods, the Grunwald–Letnikov method performs well in inversion and evaluation [35]. Therefore, this study used the Grunwald–Letnikov differential form to process the leaf hyperspectral data. The differential formula is shown in Equation (5):
d t n f t = lim n 0 1 h n j = 1 [ ( t t 0 ) / h ] ( 1 ) j ( n j ) f ( t j h )
where n denotes the order of the derivative, h is the step size, t and t 0 denote the upper and lower limits of the difference, respectively, and [ ( t t 0 ) / h ] denotes the integer part of ( t t 0 ) / h .
To reduce the problem of spectral information overlap, this study decomposed the original data into twentieth-order derivatives using the FOD which are represented by (0, 0.1, 0.2, …, 2), with a step size of 0.1, where 0, 1, and 2 represent the original spectrum and the first and second derivatives, respectively.

2.3.3. SPA

The SPA is a variable selection algorithm that can help improve the accuracy of various multiple linear regression analyses by minimising the effects of covariance effects in the calibration dataset [36]. Redundant data are eliminated from the original spectral matrix by extracting several characteristic wavelengths from the spectral data, and this algorithm is commonly used to screen spectral data for characteristic wavelengths.

2.4. Spectral Vegetation Indices

Spectral vegetation indices are related to crop growth information to some extent because they are susceptible to the geographical conditions under which crops are grown [1]. The NDVI can reflect indicators such as crop water content changes and leaf area index [26], and the near-infrared (NIR) and shortwave-infrared (SWIR) bands are closely related to water absorption bands; these bands can respond to changes in vegetation leaf water content within a certain range by combining reference bands and corresponding characteristic bands [3]. Therefore, ten spectral vegetation indices were selected, as shown in Table 1, and their Pearson correlation coefficients with water content were calculated separately.

2.5. Regression Model and Accuracy Evaluation

After preprocessing the hyperspectral data of citrus leaves with the CWT and FOD, we used the continuous projection method to screen the characteristic bands and then combined the results with the single vegetation index to construct an inverse model of citrus leaf water content using PLSR. This study evaluated the accuracy of the inversion results for the citrus leaf water content through the R-squared ( R 2 ) and root mean square error (RMSE). The higher the R 2 and the smaller the RMSE are, the better and more stable the accuracy of the model is, which indicates the best inversion model. The corresponding formulas are shown in (6) and (7):
R 2 = 1 i = 1 n ( y i y i ^ ) 2 i = 1 n ( y i y i ¯ ) 2
R M S E = i = 1 n ( y i ^ y i ) 2 n
where n is the number of data points, y i is the measured value of the citrus leaf water content, y i ^ is the predicted value of the citrus leaf water content, and y i ¯ is the mean value of the leaf water content.

3. Results and Analyses

3.1. Comparison of Inversion Accuracy between CWT and FOD Spectral Preprocessing of Citrus Leaves

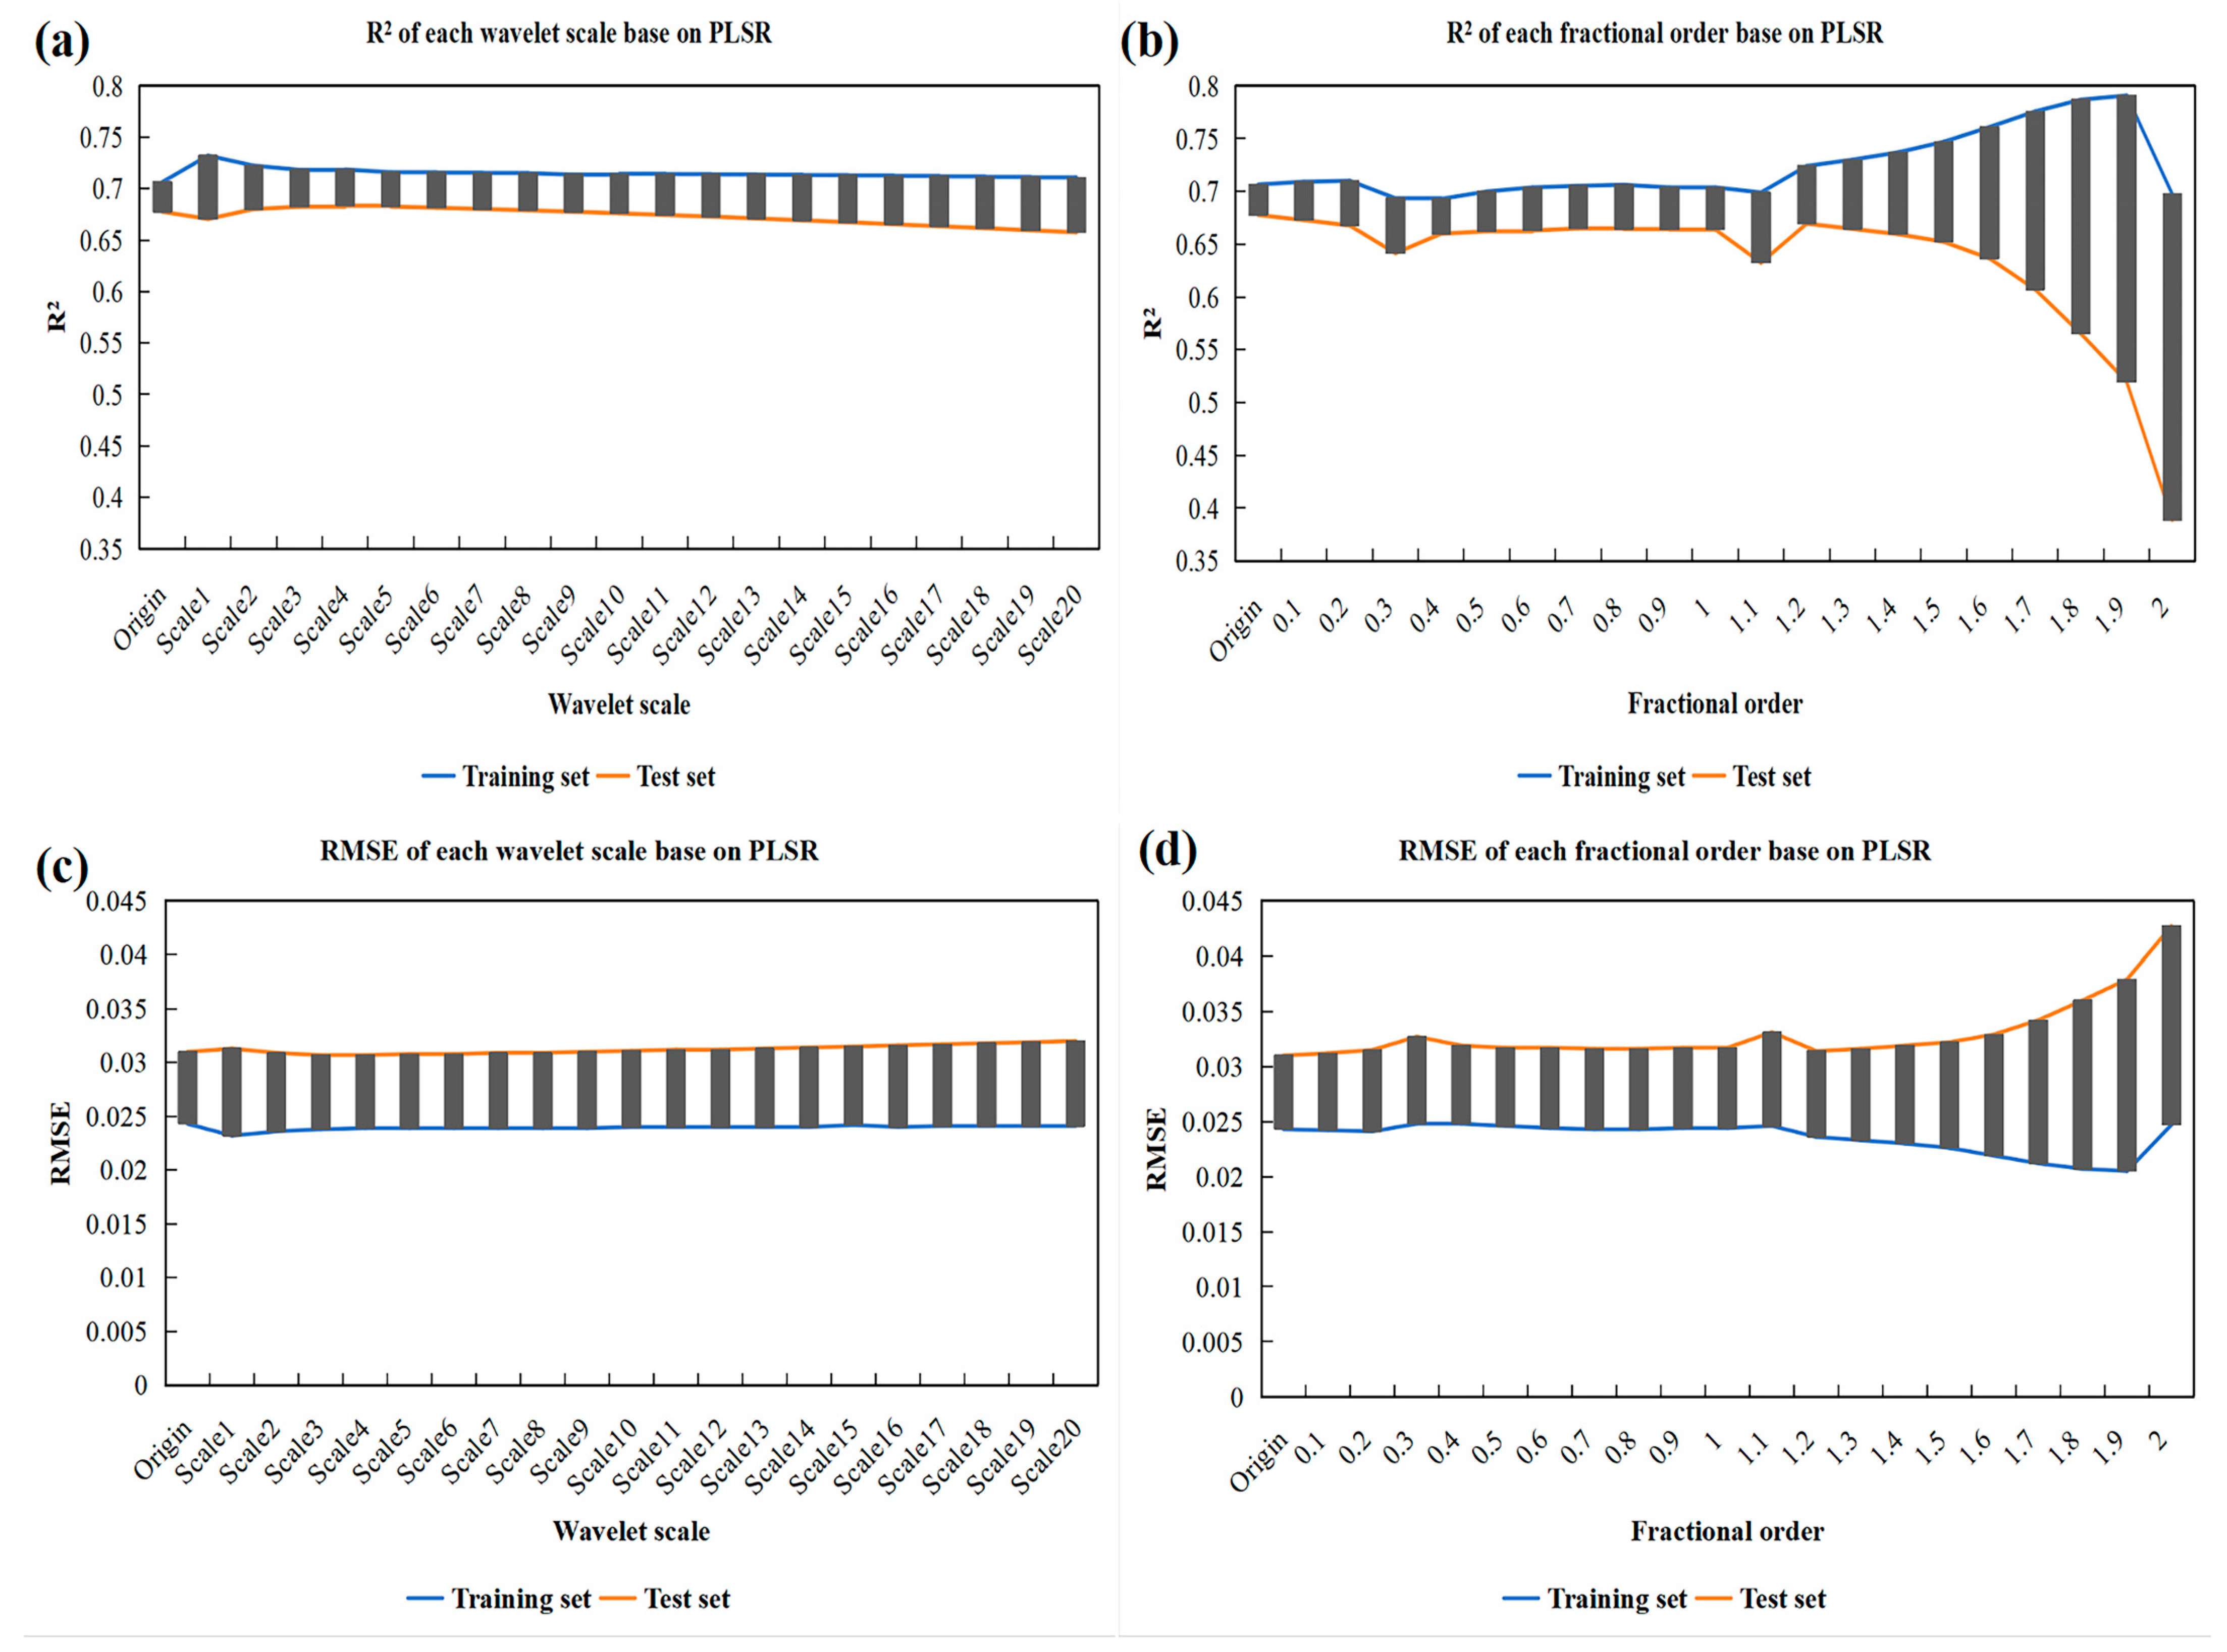
To investigate whether comparing CWT and FOD results can improve the inversion accuracy and degree of influence on the water content of citrus leaves, this study decomposed the spectral data of the 228 citrus leaf samples into 20 scales using the CWT, represented by Scale1, Scale2, Scale3, …, Scale20. The derivatives were decomposed into twentieth-order derivatives using the FOD which are represented by (0, 0.1, 0.2, …, 2) with a step size of 0.1, where 0, 1, and 2 represent the original spectrum and the first and second derivatives, respectively. The transformed data were subsequently used to construct an inverse model of citrus leaf water content via PLSR, after which the results were validated. The results are shown in Figure 2. Figure 2a,b show the R 2 values for different wavelet scales with different fractional-order derivatives, and Figure 2c,d show the RMSE values for different wavelet scales with different fractional-order derivatives.
As seen in Figure 2, after the CWT permutation decomposition, in which the prediction accuracy of Scale4~20 showed a decreasing trend and the difference between the training set and the test set became bigger and bigger, mainly because the effective information about the citrus leaf water content and the high-frequency noise of the spectra had a certain degree of overlap on the waveband, the CWT then led to a redistribution of the effective information and the high-frequency noise with more high-frequency noise, thus leading to a decrease in prediction accuracy [1]. However, the accuracy of most spectral data was improved compared to that of the original spectral data, which indicates that the CWT can improve the inversion accuracy of the relevant indices to a certain extent [1,6,8,15]. After the FOD decomposition, the inversion effect of the 0.1-order derivative was better than that of the other derivatives, but the prediction accuracy of each fractional order was lower than that of the original spectral data. As the fractional order increased, the spectral noise was further amplified, which led to a decreasing trend in prediction accuracy [37]. This indicates that the application of fractional derivatives for improving the inversion accuracy of citrus leaf water content is less effective.
A comparison of the R 2 and RMSE values of the citrus leaf water content inversion models of the CWT and FOD showed that the difference in R 2 between the CWT training set and the test set was approximately 5%, which is a smaller and more stable difference than that between the FOD training set and the test set and did not cause overfitting; moreover, the RMSE values of the CWT training set and the test set were smoother than those of the FOD set. The Scale4 prediction accuracy in the CWT was the best, with an R 2 of 0.6834 and an RMSE of 0.0307, and the 0.1-order derivative prediction accuracy in the FOD was the best, with an R 2 of 0.6728 and an RMSE of 0.0312, which indicated that the CWT was more effective and less accurate than the FOD at improving the inversion accuracy of the citrus leaf water content values. This indicates that the CWT is better and more accurate than the FOD for improving the inversion accuracy of the citrus leaf water content.

3.2. SPA-Based Analysis of Water Content-Sensitive Bands in Citrus Leaves

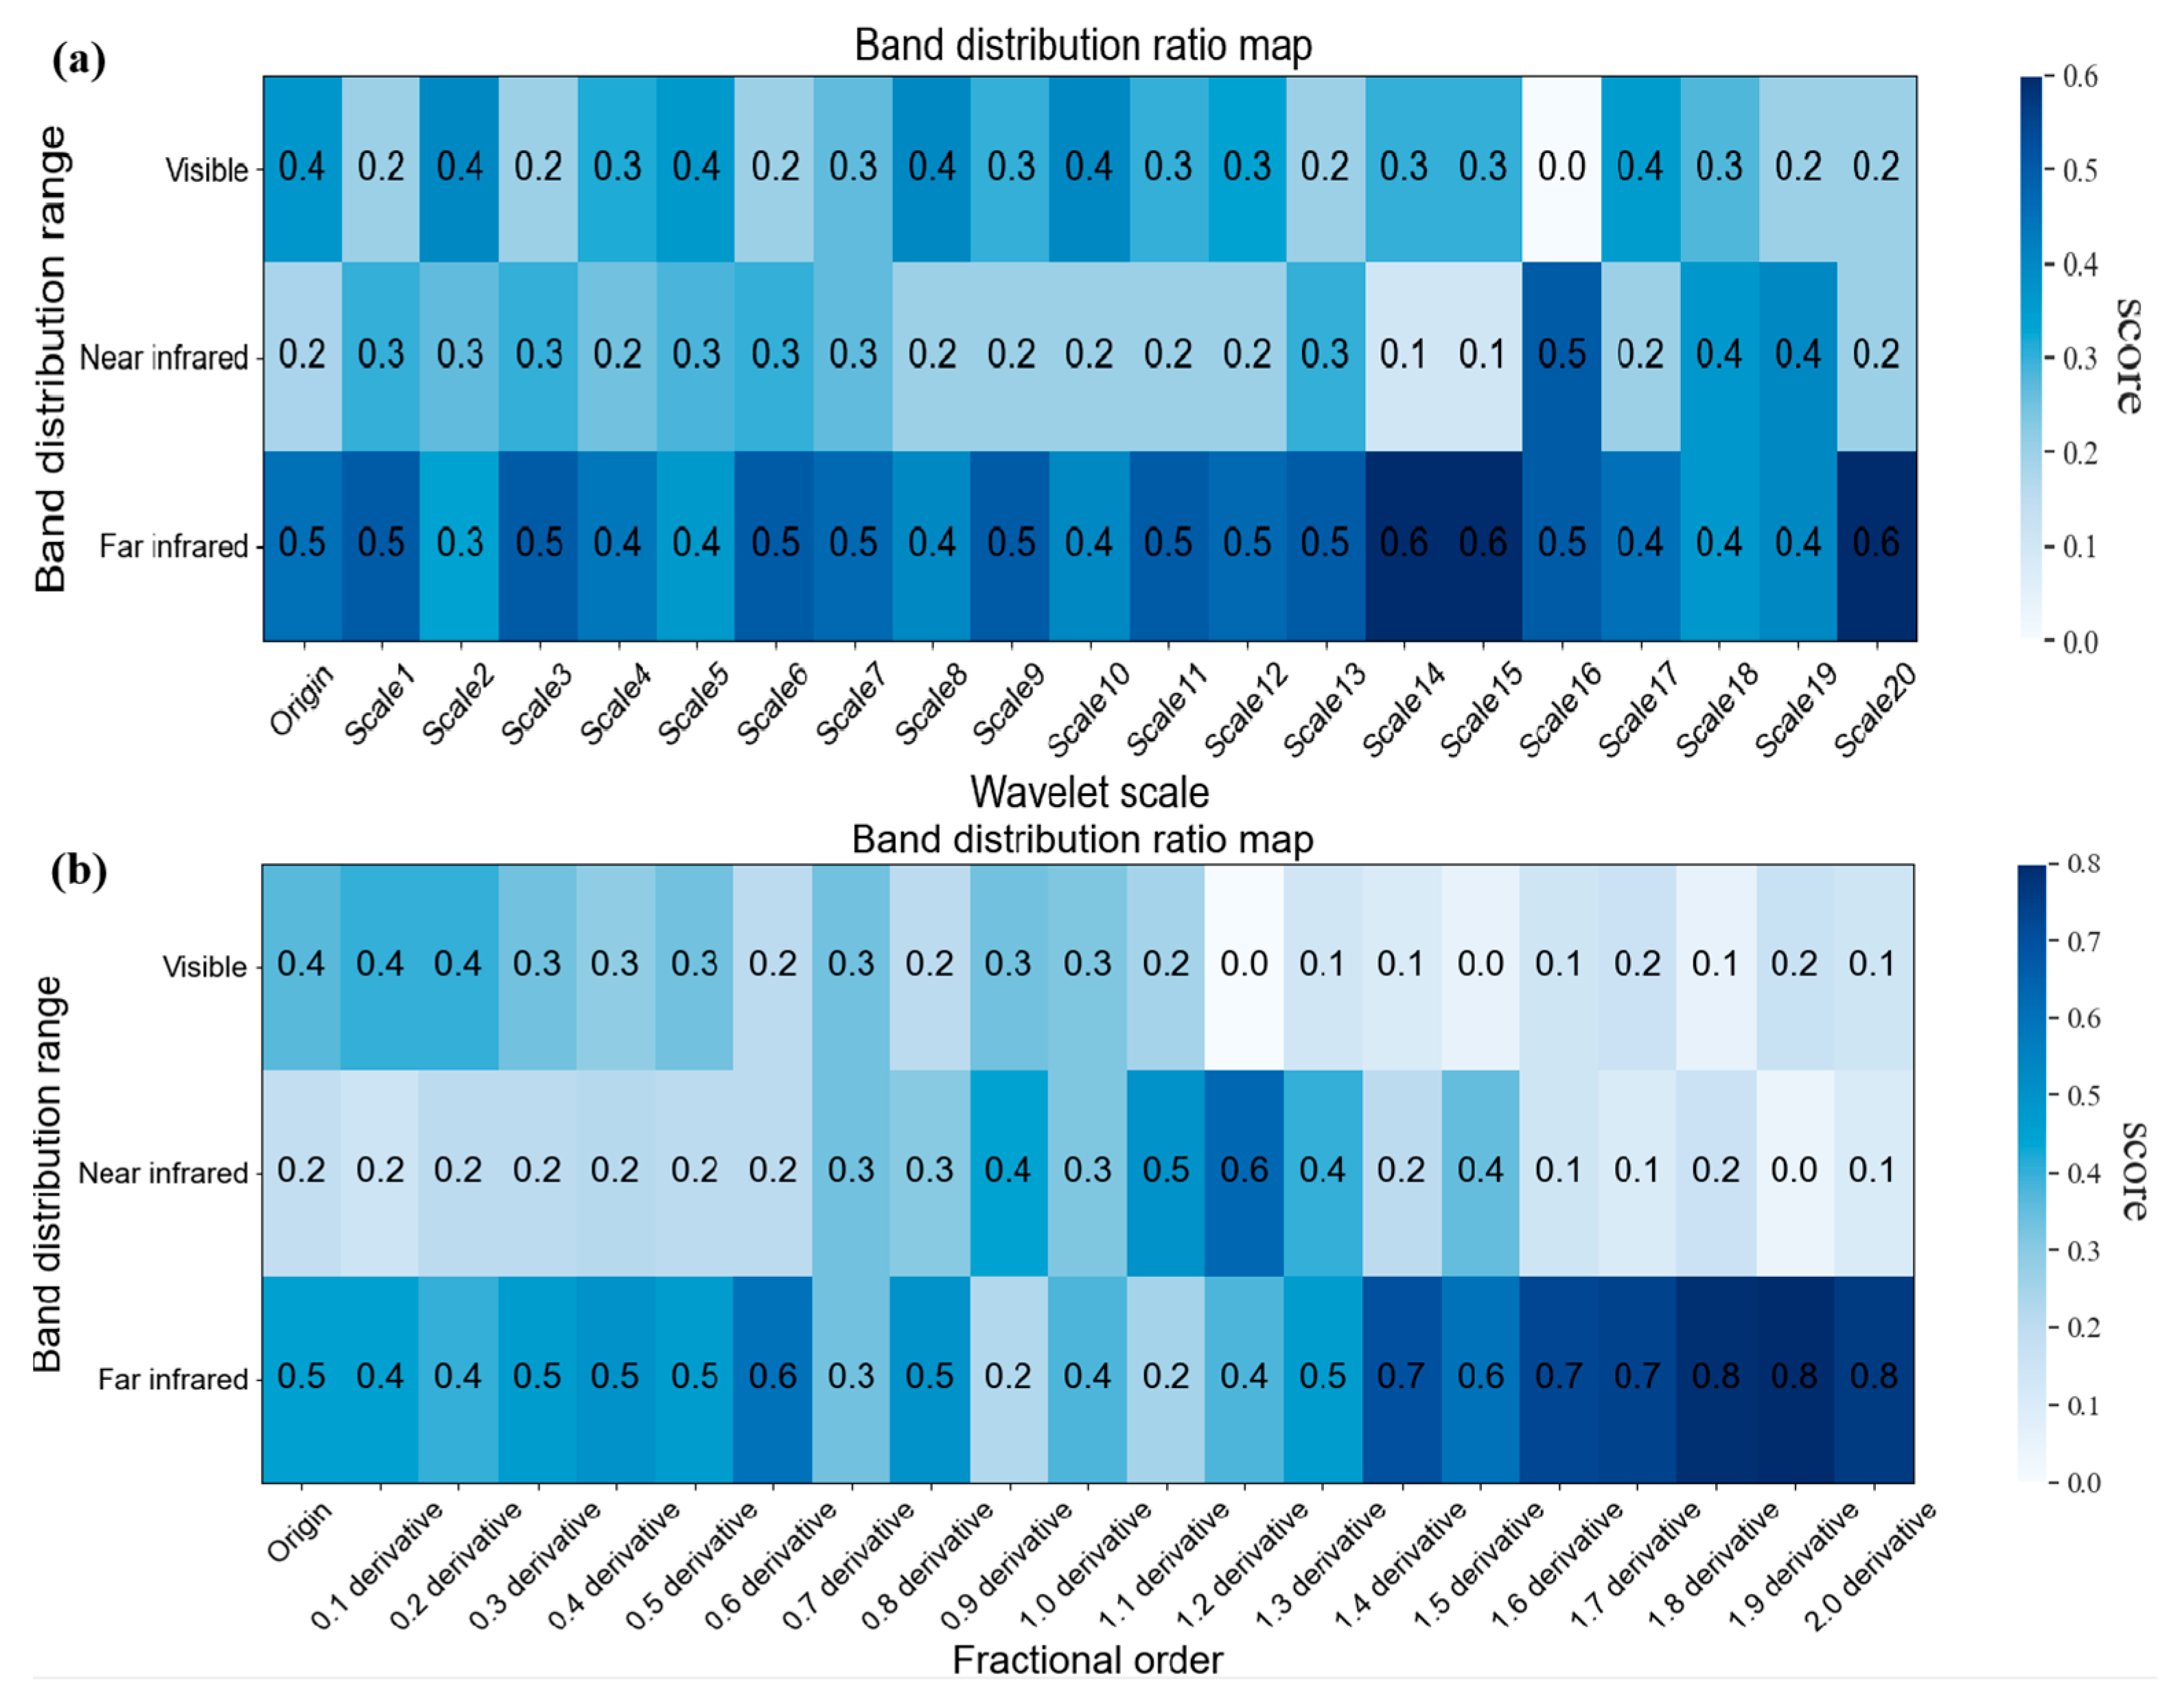
On the basis of the CWT and FOD methods, the SPA was used to screen the characteristic bands in the spectral data of citrus leaves that were strongly correlated with the water content indices to further improve the inversion accuracy. The feature bands selected by the SPA ensured high R 2 coefficient values, while the RMSE values were also within the error range. As shown in Figure 3, Figure 3a shows the ratios of the different wavelet scale bands, and Figure 3b shows the ratios of the different FOD bands. The distribution characteristics of the feature bands screened by the SPA for the CWT and FOD were similar, with a small portion of the bands distributed in the visible region, accounting for up to 40% of the total bands, and the majority of them distributed in the NIR and the SWIR, among which those distributed in the SWIR had the largest ratios, accounting for up to 60% of the total bands; thus, it can be seen that the feature bands distributed in the NIR and SWIR spectra were more sensitive to the inversion of the citrus leaf water content. This shows that the characteristic bands distributed in the NIR and SWIR regions are more sensitive to the inversion of the water content of citrus leaves.
On the basis of the CWT and FOD methods, the SPA was used to screen the characteristic bands in the spectral data of citrus leaves that were strongly correlated with the water content indices to further improve the inversion accuracy. The feature bands selected by the SPA ensure a high R 2 coefficient value, while the RMSE value was also within the error range. As shown in Figure 4, Figure 4a,b show the number of bands screened based on the SPA with different wavelet scales with different fractional-order derivatives, and Figure 4c,d show the R 2 values based on the PLSR with different wavelet scales with different fractional-order derivatives on top of the SPA. As shown in Figure 4, under the inversion of the PLSR, the R 2 values of the test set improved in all the feature bands based on the SPA screening compared to those of the full band, while the RMSEs were also reduced. The number of feature bands screened by the CWT at most wavelet scales was less than the number of fractional-order derivatives of the FOD, and a smaller number of bands indicates a simpler model. Moreover, the inversion accuracy of the CWT was better than that of the FOD and it was more stable; the best inversion results were achieved by the CWT in the Scale 4 screening of 16 feature bands.
In the CWT method, the inversion effects of Scale2~4 were better than that of Scale3, and Scale4 had the best inversion effect ( R 2 = 0.7256). In the FOD method, the test set R 2 values for derivatives of 0.8, 1.0~1.2, and 1.4~1.5 orders improved compared to that of the original spectrum, with R 2 values all above 0.71. Among them, the effect of 0.8-order derivatives was the best ( R 2 = 0.7192); there was no overfitting or underfitting, and the model accuracy was relatively stable. After preprocessing based on the FOD method, the prediction accuracy value of each fractional order was lower than that of the original spectral data. However, after the SPA was used to filter feature bands, the prediction accuracy values of the majority of the fractional derivatives were greater than that of the original spectral data. This indicates that the SPA can remove redundant data from the entire band, select feature band combinations strongly correlated with water content indicators from the entire band, and improve the inversion accuracy of the model while reducing the band size. Moreover, it has been proven that the CWT-SPA model can more effectively improve the citrus leaf water content inversion accuracy.

3.3. Inversion Results of Citrus Leaf Water Content Using the Joint Spectral Vegetation Index

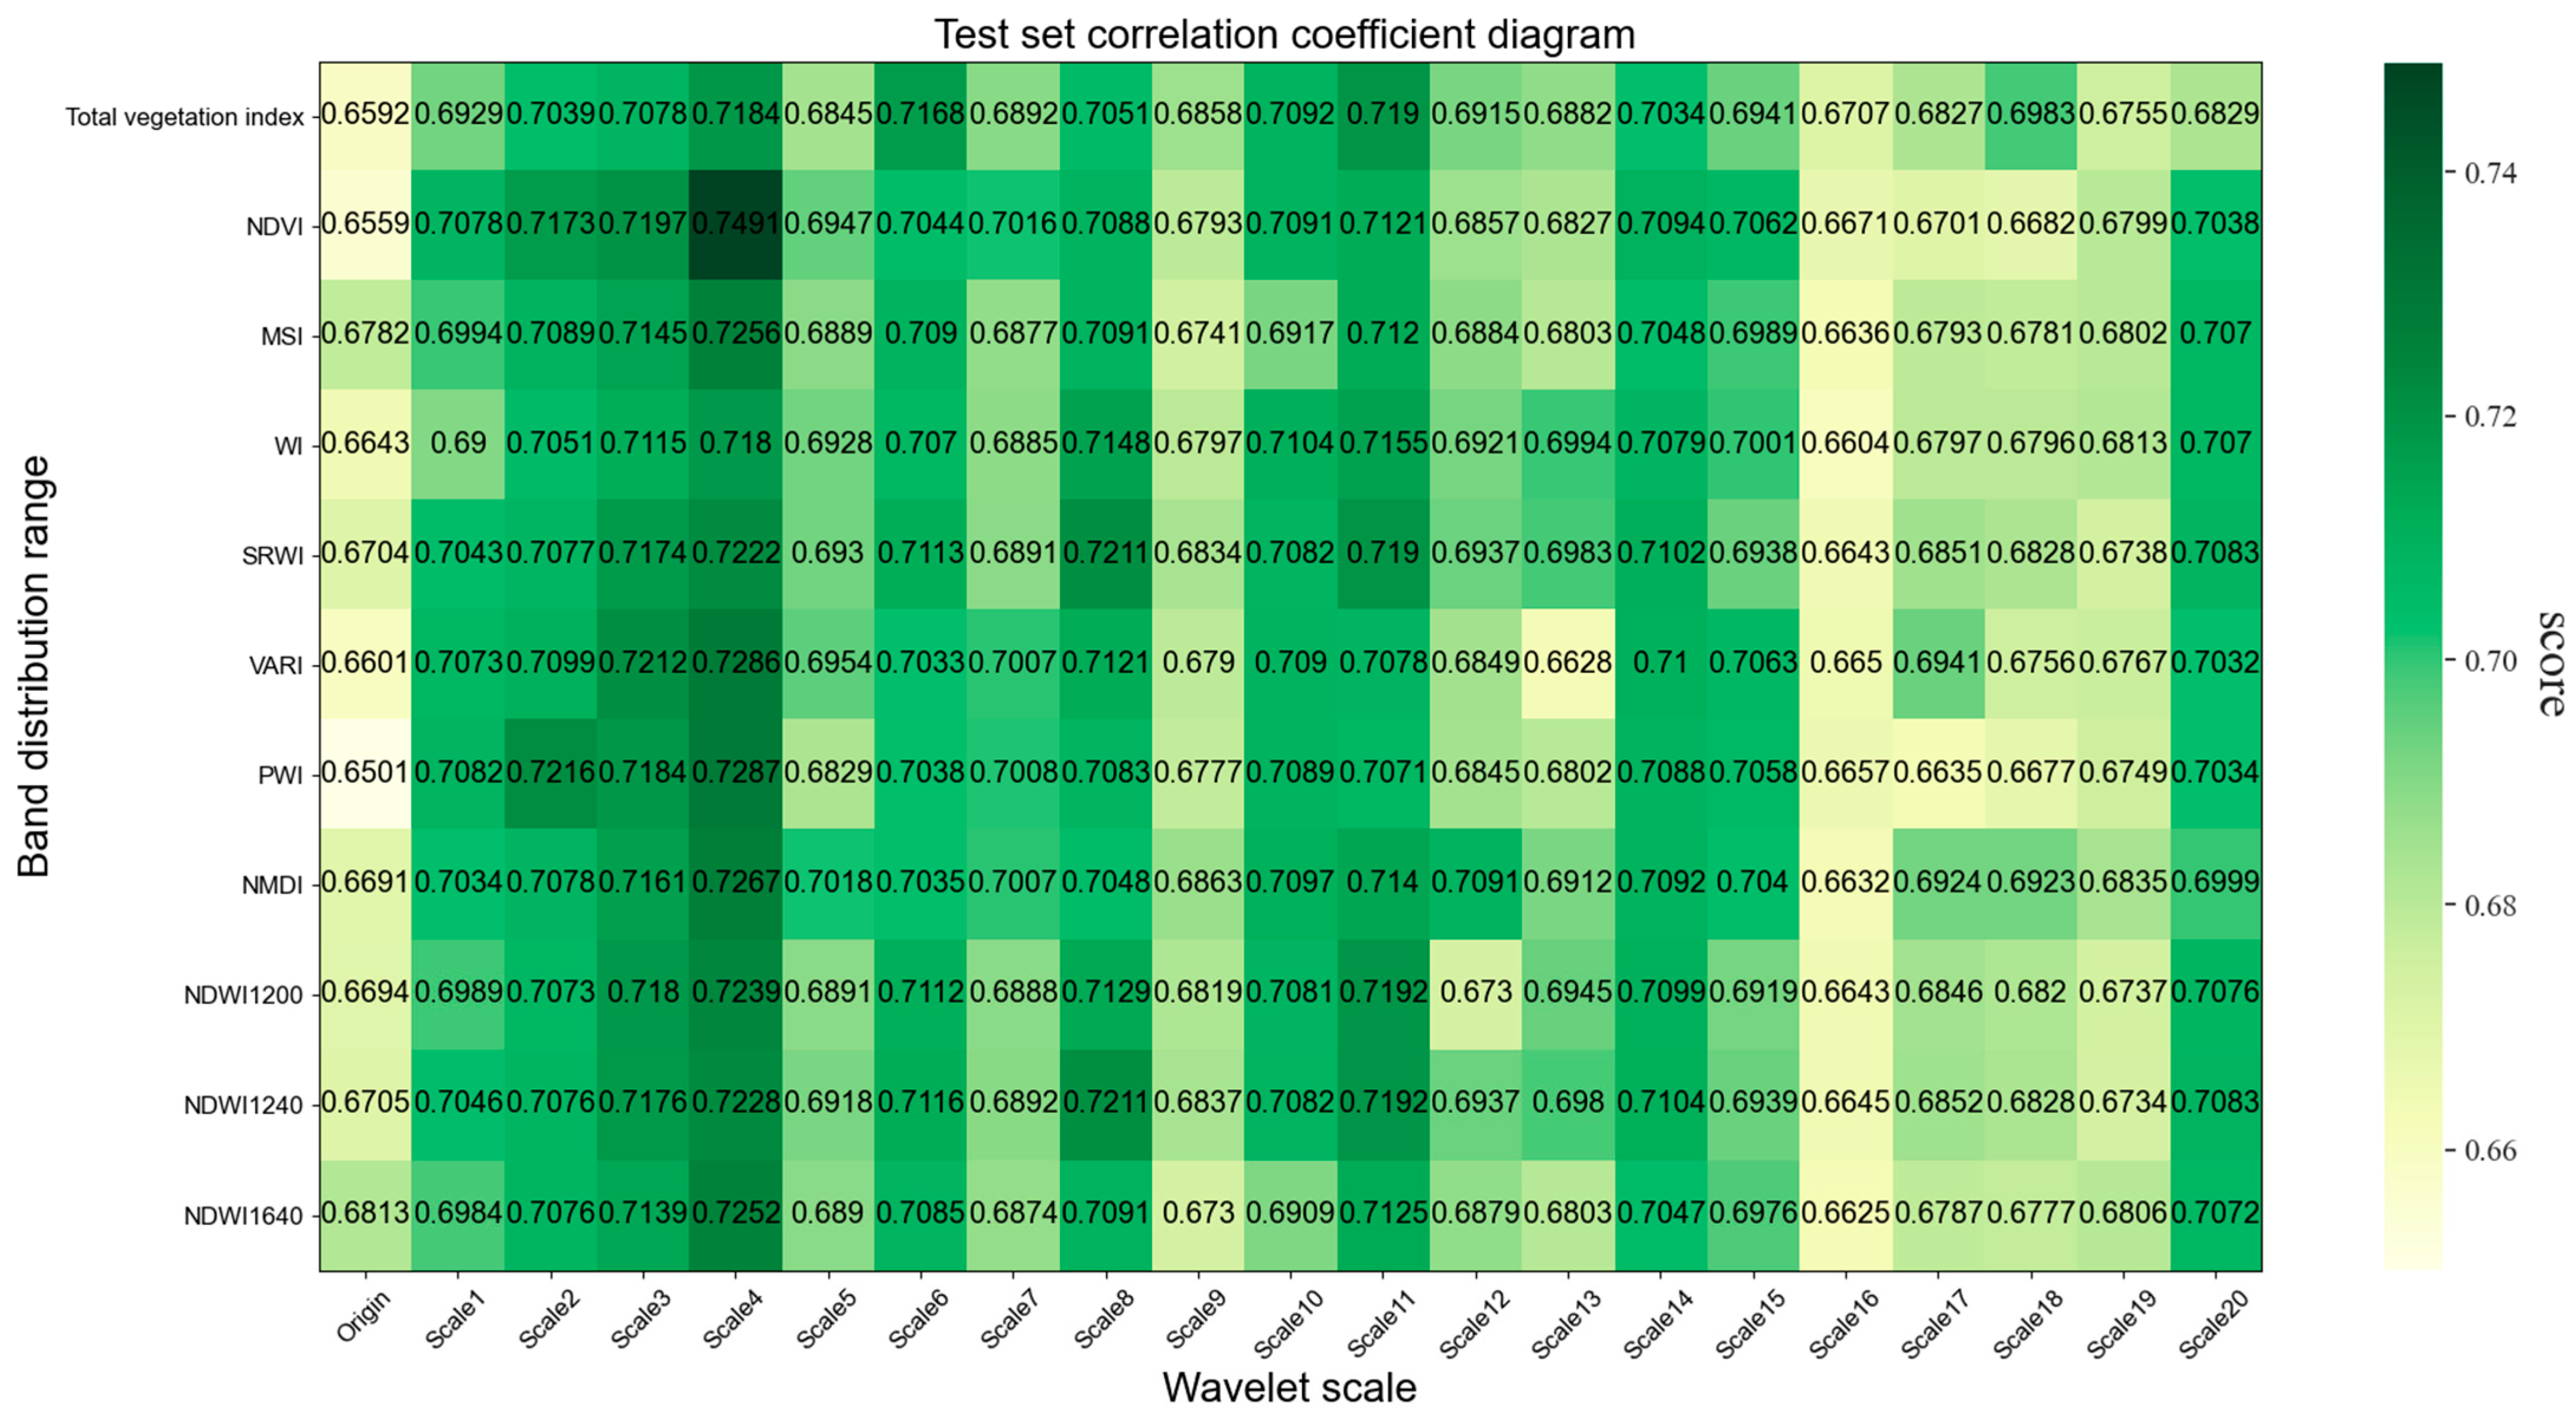
To further improve the inversion accuracy of the model, a PLSR inversion model was constructed using the 20 wavelet scales of the data after the SPA screening of the characteristic bands with the ten spectral vegetation indices. As shown in Figure 5, the inversion accuracies improved after the joint spectral vegetation index was applied, and the R 2 values of the vast majority of the test sets exceeded 0.7, among which the Scale4 joint NDVI spectral vegetation index achieved the highest accuracy value ( R 2 = 0.7491). Moreover, among the 16 feature bands selected by the SPA, most are close to the reference and feature bands of the NDVI spectral vegetation index. This indicates that adding spectral vegetation indices associated with characteristic bands can improve the accuracy of the model, further proving that joint spectral vegetation indices have a good effect on improving the accuracy of citrus leaf water retrieval.
The water content values of the citrus leaves were inverted by combining each FOD with ten spectral vegetation indices after screening the characteristic bands via the SPA, and the 0.8th-order derivative combined with the spectral vegetation index (SRWI) was the best inversion with an R 2 value of 0.7353, which was subsequently compared with the best result of the CWT-SPA. As shown in Figure 6, the left panel (a) shows the PLSR plot of the NDVI spectral vegetation index with the best inversion accuracy of the CWT-SPA combined, and the right panel (b) shows the PLSR plot of the SRWI spectral vegetation index with the best inversion accuracy of the FOD-SPA combined.

4. Discussion

To reduce noise, eliminate background signals and resolve overlapping spectral features in acquired hyperspectral data, the CWT and FOD processing methods can effectively improve the accuracy of estimating the water content of citrus leaves. This study used the CWT and FOD methods to decompose the hyperspectral data of citrus leaves and estimated their water content by combining spectral vegetation indices based on the SPA screening of characteristic bands. The results indicate that the prediction accuracy values of Scale1 through Scale4 combined with the spectral vegetation index were the best, mainly because the wavelet coefficients of Scale1 through Scale4 can better characterise and preserve the detailed features of the spectrum and the wavelength position of the characteristic band corresponding to the wavelet curve features, which is consistent with existing research results [38]. The estimation accuracy values show a decreasing trend with an increasing scale, which was mainly because there was more high-frequency noise after the redistribution of effective information and high-frequency noise, which led to a decrease in the prediction accuracy and thus affected the estimation accuracy of the water content; this finding is the same as that of existing research [1].
The prediction accuracy values of the combined spectral vegetation indices with derivatives of 0.8, 1.0~1.2, and 1.4~1.5 were the best, but as the fractional order increased, the prediction accuracy decreased due to the increase in light noise [37]. As shown in Figure 4d, the effect of the first and second derivatives is poor, but the inversion effect of the first derivative is better than that of the second derivative, which provided the same results as existing research [39]. The spectra processed by the CWT exhibit specific spectral features superior to those of the leaf water content inversion [6], which was related to the good localisation characteristics of the CWT [13], further indicating that the CWT had a good effect on reducing spectral noise and extracting effective information.
There are differences in the spectral responses at different water availability levels [40], and water’s absorption of radiation has a significant impact on visible and NIR wavelengths [41]. Changes in crop water conditions may affect spectral reflectance, indicating that water availability is an important factor affecting absorption and reflection characteristics in the NIR region. Due to the high correlation between different adjacent bands and high information redundancy, the SPA was used in this study to extract characteristic wavelengths to eliminate redundant data from the original spectral matrix. When the SPA was used to screen the characteristic bands, it was found that the bands located in the NIR and SWIR regions were more sensitive to the water content of the citrus leaves. In addition, in a large number of scholarly studies, it was found that the bands located in the NIR and SWIR regions were more sensitive to the inversion of the leaf water contents of different plants. When the water content of winter wheat leaves was quantitatively inverted, several scholars found that most of the characteristic bands were located in the NIR region and that fewer were located in the visible region [1]; moreover, the sensitive bands screened by CARS for estimating the water content of winter wheat canopies were located in the NIR and SWIR regions [6], and there have been similar findings in a variety of tree species, such as grapevine and the dragon’s blood tree [42]. In addition, similar conclusions were reached for various tree species, such as grapevine and Loblolly [28]. The existing studies mentioned above all used sensitive bands to analyse and invert relevant indicators of crops and achieved good results. Therefore, using the sensitive bands of citrus leaves can improve the accuracy of determining the citrus leaf water content.
Joint spectral vegetation indices can further improve the inversion accuracy of the citrus leaf water content. As shown in Figure 5, after the application of the joint spectral vegetation index, the inversion accuracies improved at most of the wavelet scales, and the accuracy of the joint single-spectrum vegetation index improved compared with that of the full-spectrum vegetation index. Among these indices, the NDVI estimation of the leaf water content exhibited a better inversion effect than did the other spectral vegetation indices, with its reference band and corresponding characteristic bands located in the NIR and SWIR regions. This finding is consistent with existing research findings [43,44].
Considering the intrinsic correlation and spectral typicality of vegetation indices, multiple spectral vegetation indices may not necessarily achieve the best results [45]. Therefore, combining spectral vegetation indices significantly correlated with citrus leaf water content can improve the accuracy of citrus leaf water retrieval.

5. Conclusions

In this study, the collected hyperspectral data were preprocessed using the CWT and FOD methods, and the SPA was applied to eliminate redundant data in the decomposed spectrum. Then, combined with the spectral vegetation index, the inversion accuracy of the model was further improved to determine the best inversion model for estimating the citrus leaf water content. The final conclusions are as follows:
(1)
Compared with the original spectral inversion of the citrus leaf water content, the inversion accuracy of the CWT improved at most scales, while that of the fractional-order derivatives of the FOD method decreased, and the inversion accuracy of the CWT was approximately 5% greater than that of the FOD method, which indicates that the CWT was able to improve the inversion accuracy of the water content of the citrus leaves and outperformed the FOD method.
(2)
The feature bands selected by the SPA were mostly located in the infrared region, indicating that the feature bands in the infrared region were more sensitive to inverting the water content of the citrus leaves. After the application of the joint spectral vegetation index, compared to those of the original spectra, the inversion accuracies of the CWT and FOD methods for citrus leaf water content increased by 9.61% and 9.29%, respectively. This indicates that the SPA joint spectral vegetation index can improve the ability to predict citrus leaf water information.
(3)
By comparing the best models for the FOD and CWT, it was ultimately found that the CWT method is superior to the FOD method, with the Gaus1 wavelet function having the best inversion effect. The use of the spectral vegetation index can provide a new prediction method for citrus leaf water content prediction.

Author Contributions

Conceptualisation, S.D. and W.Z.; methodology, S.D. and W.Z.; software, W.Z., J.Y. and Z.M.; formal analysis, S.D. and W.Z.; validation, J.Y. and Z.M.; funding acquisition, S.D.; investigation, Y.D., C.Z. and M.L.; resources, W.Z. and S.D.; data curation, Y.D., C.Z. and M.L.; writing—original draft preparation, S.D. and W.Z.; writing—review and editing, S.D. and W.Z.; visualisation, S.D.; supervision, S.D., J.Y. and Z.M.; project administration, S.D. All authors have read and agreed to the published version of the manuscript.

Funding

This study was supported by the National Natural Science Foundation of China (no. 42061059), the Natural Science Foundation of Guangxi (no. 2023JJA150097), the Guilin Science and Technology Bureau Development Program (no. 2020010701, 20210226-2), and the “BaGui Scholars” program of the provincial government of Guangxi, the Guilin University of Technology Foundation (no. GUTQDJJ2019046).

Data Availability Statement

The data presented in this study are available on request from the corresponding author. The data are not publicly available due to privacy.

Conflicts of Interest

The authors declare no conflicts of interest.

References

  1. Wang, Y.C.; Zhang, X.Y.; Jin, Y.T.; Gu, X.H.; Feng, H.; Wang, C. Quantitative Retrieval of Water Content in Winter Wheat Leaves Based on Continuous Wavelet Transform. J. Triticeae Crops 2020, 40, 503–509. [Google Scholar]
  2. Dai, Q.F.; Liao, C.L.; Li, Z.; Song, S.R.; Xue, X.Y.; Xiong, S.L. Hyperspectral Visualization of Citrus Leaf Moisture Content Based on CARS-CNN. Spectrosc. Spectr. Anal. 2022, 42, 2848–2854. [Google Scholar]
  3. Zhang, H.W.; Zhang, F.; Zhang, X.L.; Li, Z.; Ghulam, A.; Song, J. Inversion of Vegetation Leaf Water Content Based on Spectral Index. Spectrosc. Spectr. Anal. 2018, 38, 1540–1546. [Google Scholar] [CrossRef]
  4. Yan, Z.Y.; Wang, F.D.; Guo, X.; Ding, J. Comparison of Pre-processing Methods and Models for Estimating SPAD of Rice Leaves by Hyperspectrum. Acta Agric. Univ. Jiangxiensis 2020, 42, 1130–1138. [Google Scholar]
  5. Sun, J.J.; Yang, W.D.; Zhang, M.J.; Feng, M.C.; Xiao, L.J.; Ding, G.W. Estimation of water content in corn leaves using hyperspectral data based on fractional order Savitzky-Golay derivation coupled with wavelength selection. Comput. Electron. Agric. 2021, 182, 105989. [Google Scholar] [CrossRef]
  6. Li, K.; Chang, Q.R.; Chen, Q.; Chen, X.K.; Mo, H.Y.; Zhang, Y.D.; Zheng, Z.K. Estimation of Water Content in Canopy Leaf of Winter Wheat Based on Continuous Wavelet Transform Coupled CARS Algorithm. J. Triticeae Crops 2023, 43, 251–258. [Google Scholar]
  7. Wu, J.F. Rapid non-destructive detection of water content in winter wheat leaves based on CARS-PLSR. J. Chifeng Univ. (Nat. Sci. Ed.) 2021, 37, 22–26. [Google Scholar]
  8. Zhao, R.M.; An, L.L.; Tang, W.J.; Gao, D.H.; Qiao, L.; Li, M.Z.; Sun, H.; Qiao, J.B. Deep learning assisted continuous wavelet transform-based spectrogram for the detection of chlorophyll content in potato leaves. Comput. Electron. Agric. 2022, 195, 106802. [Google Scholar] [CrossRef]
  9. Kong, Y.X.; Liu, Y.P.; Geng, J.H.; Huang, Z.C. Pixel-Level Assessment Model of Contamination Conditions of Composite Insulators Based on Hyperspectral Imaging T echnology and a Semi-Supervised Ladder Network. IEEE Trans. Dielectr. Electr. Insul. 2022, 30, 326–335. [Google Scholar] [CrossRef]
  10. An, C.Q.; Yan, X.; Lu, C.; Zhu, X.H. Effect of spectral pretreatment on qualitative identification of adulterated bovine colostrum by near-infrared spectroscopy. Infrared Phys. Technol. 2021, 118, 103869. [Google Scholar] [CrossRef]
  11. Kaewpijit, S.; Le Moigne, J.; El-Ghazawi, T. Automatic Reduction of Hyperspectral Imagery Using Wavelet Spectral Analysis. IEEE Trans. Geosci. Remote Sens. 2003, 41, 863–871. [Google Scholar] [CrossRef]
  12. Cui, S.C.; Zhou, K.F.; Ding, R.F.; Cheng, Y.Y.; Jiang, C. Estimation of soil copper content based on fractional-order derivative spectroscopy and spectral characteristic band selection. Spectrochim. Acta Part A Mol. Biomol. Spectrosc. 2022, 275, 121190. [Google Scholar] [CrossRef]
  13. Li, C.C.; Shi, M.M.; Ma, C.Y.; Cui, Y.Q.; Wang, Y.L.; Li, Y.C. Estimation of Chlorophyll Content in Winter Wheat Based on Wavelet Transform and Fractional Differential. Trans. Agric. Mach. 2021, 52, 172–182. [Google Scholar]
  14. Wang, Z.L.; Chen, J.X.; Fan, Y.F.; Cheng, Y.J.; Wu, X.L.; Zhang, J.W.; Wang, B.B.; Wang, X.C.; Yong, T.W.; Liu, W.G.; et al. Evaluating photosynthetic pigment contents of maize using UVE-PLS based on continuous wavelet transform. Comput. Electron. Agric. 2020, 169, 105160. [Google Scholar] [CrossRef]
  15. Cai, L.H.; Ding, J.L. Wavelet transformation coupled with CARS algorithm improving prediction accuracy of soil moisture content based on hyperspectral reflectance. Trans. Chin. Soc. Agric. Eng. 2017, 33, 144–151. [Google Scholar]
  16. Jiang, G.; Zhou, K.F.; Wang, J.L.; Sun, G.Q.; Cui, S.C.; Chen, T.; Zhou, S.G.; Bai, Y.; Chen, X. Estimation of rock copper content based on Fractional-order derivative and visible Near-infrared–Shortwave infrared spectroscopy. Ore Geol. Rev. 2022, 150, 105092. [Google Scholar] [CrossRef]
  17. Wang, X.P.; Zhang, F.; Kung, H.-T.; Johnson, V.C. New methods for improving the remote sensing estimation of soil organic matter content (SOMC) in the Ebinur Lake Wetland National Nature Reserve (ELWNNR) in northwest China. Remote Sens. Environ. 2018, 218, 104–111. [Google Scholar] [CrossRef]
  18. Xiao, B.; Li, S.Z.; Dou, S.Q.; He, H.C.; Fu, B.L.; Zhang, T.X.; Sun, W.W.; Yang, Y.L.; Xiong, Y.K.; Shi, J.K.; et al. Comparison of leaf chlorophyll content retrieval performance of citrus using FOD and CWT methods with field-based full-spectrum hyperspectral reflectance data. Comput. Electron. Agric. 2024, 217, 108559. [Google Scholar] [CrossRef]
  19. Liu, Y.; Lu, Y.Y.; Chen, D.Y.; Zheng, W.; Ma, Y.X.; Pan, X.Z. Simultaneous estimation of multiple soil properties under moist conditions using fractional-order derivative of vis-NIR spectra and deep learning. Geoderma 2023, 438, 116653. [Google Scholar] [CrossRef]
  20. Sun, Q.; Gu, X.H.; Chen, L.P.; Qu, X.Z.; Zhang, S.; Zhou, J.P.; Pan, Y.C. Hyperspectral estimation of maize (Zea mays L.) yield loss under lodging stress. Field Crops Res. 2023, 302, 109042. [Google Scholar] [CrossRef]
  21. Ma, Z.Y.; Li, W.; Warner, T.A.; He, C.; Wang, X.; Zhang, Y.; Guo, C.L.; Cheng, T.; Zhu, Y.; Cao, W.X.; et al. A framework combined stacking ensemble algorithm to classify crop in complex agricultural landscape of high altitude regions with Gaofen-6 imagery and elevation data. Int. J. Appl. Earth Obs. Geoinf. 2023, 122, 103386. [Google Scholar] [CrossRef]
  22. Chen, F.F.; Chen, C.; Li, W.R.; Xiao, M.; Yang, B.; Yan, Z.W.; Rui, G.; Zhang, S.L.; Han, H.J.; Chen, C.; et al. Rapid detection of seven indexes in sheep serum based on Raman spectroscopy combined with DOSC-SPA-PLSR-DS model. Spectrochim. Acta Part A Mol. Biomol. Spectrosc. 2021, 248, 119260. [Google Scholar] [CrossRef]
  23. Krepper, G.; Romeo, F.; de Sousa Fernandes, D.D.; Diniz, P.H.G.D.; de Araújo, M.C.U.; Di Nezio, M.S.; Pistonesi, M.F.; Centurión, M.E. Determination of fat content in chicken hamburgers using NIR spectroscopy and the Successive Projections Algorithm for interval selection in PLS regression (iSPA-PLS). Spectrochim. Acta Part A Mol. Biomol. Spectrosc. 2018, 189, 300–306. [Google Scholar] [CrossRef]
  24. Pang, L.; Wang, L.M.; Yuan, P.; Yan, L.; Xiao, J. Rapid seed viability prediction of Sophora japonica by improved successive projection algorithm and hyperspectral imaging. Infrared Phys. Technol. 2022, 123, 104143. [Google Scholar] [CrossRef]
  25. Ma, Y.R.; Lv, X.; Yi, X.; Ma, L.L.; Qi, Y.Q.; Hou, T.Y.; Zhang, Z. Monitoring of cotton leaf area index using machine learning. Trans. Agric. Eng. 2021, 37, 152–162. [Google Scholar]
  26. Wei, Q.; Zhang, B.Z.; Wei, Z.; Peng, Z.G.; Han, N.N. Inversion of Water Content of Winter Wheat Plants by Multi-spectral Remote Sensing of UAV. Water Sav. Irrig. 2019, 10, 11–14+19. [Google Scholar]
  27. Zhang, Z.T.; Tan, C.X.; Xu, C.H.; Chen, S.B.; Han, W.T.; Li, Y. Retrieving Soil Moisture Content in Field Maize Root Zone Based on UAV Multispectral Remote Sensing. Trans. Agric. Mach. 2019, 50, 246–257. [Google Scholar]
  28. Zhang, T.; Jin, X.; Rao, Y.; Luo, Q.; Li, S.W.; Wang, L.L.; Zhang, Y.D. Inversing photosynthesis quantum yield of the soybean flag leaf using a UAV-carrying multispectral camera. Trans. Agric. Eng. 2022, 38, 150–157. [Google Scholar]
  29. Zhang, Z.P.; Ding, J.L.; Wang, J.Z.; Ge, X.Y. Prediction of soil organic matter in northwestern China using fractional-order derivative spectroscopy and modified normalized difference indices. CATENA 2020, 185, 104257. [Google Scholar] [CrossRef]
  30. Li, Y.M.; Wang, H.; Zhao, Y.; Zhang, L.G. Hyperspectral estimation of leaf water content of Lycium barbarum based on continuum-removed method. Acta Agric. Zhejiangensis 2022, 34, 781–789. [Google Scholar]
  31. Lin, D.; Li, G.Z.; Zhu, Y.D.; Liu, H.T.; Li, L.T.; Fahad, S.; Zhang, X.Y.; Wei, C.; Jiao, Q.J. Predicting copper content in chicory leaves using hyperspectral data with continuous wavelet transforms and partial least squares. Comput. Electron. Agric. 2021, 187, 106293. [Google Scholar] [CrossRef]
  32. Hong, Y.S.; Munnaf, M.A.; Guerrero, A.; Chen, S.C.; Liu, Y.L.; Shi, Z.; Mouazen, A.M. Fusion of visible-to-near-infrared and mid-infrared spectroscopy to estimate soil organic carbon. Soil Tillage Res. 2022, 217, 105284. [Google Scholar] [CrossRef]
  33. Hong, Y.S.; Liu, Y.L.; Chen, Y.Y.; Liu, Y.F.; Yu, L.; Liu, Y.; Cheng, H. Application of fractional-order derivative in the quantitative estimation of soil organic matter content through visible and near-infrared spectroscopy. Geoderma 2019, 337, 758–776. [Google Scholar] [CrossRef]
  34. Liu, F. Research on the Application of Fractional Order Differential Algorithm in Denoising Medical Ultrasonic Elastic Images; Kunming University of Science and Technology: Kunming, China, 2018. [Google Scholar]
  35. Hu, W.F.; Tang, R.N.; Li, C.; Zhou, T.; Chen, J.; Chen, K. Fractional order modeling and recognition of nitrogen content level of rubber tree foliage. J. Near Infrared Spectrosc. 2021, 29, 42–52. [Google Scholar] [CrossRef]
  36. Canova, L.D.S.; Vallese, F.D.; Pistonesi, M.F.; de Araújo Gomes, A. An improved successive projections algorithm version to variable selection in multiple linear regression. Anal. Chim. Acta 2023, 1274, 341560. [Google Scholar] [CrossRef]
  37. Hong, Y.S.; Guo, L.; Chen, S.C.; Linderman, M.; Mouazen, A.M.; Yu, L.; Chen, Y.L.; Liu, Y.L.; Liu, Y.F.; Cheng, H.; et al. Exploring the potential of airborne hyperspectral image for estimating topsoil organic carbon: Effects of fractional-order derivative and optimal band combination algorithm. Geoderma 2020, 365, 11422. [Google Scholar] [CrossRef]
  38. Zhao, X.H.; Zhang, J.C.; Pu, R.L.; Shu, Z.F.; He, W.Z.; Wu, K.H. The continuous wavelet projections algorithm: A practical spectral-feature-mining approach for crop detection. Crop J. 2022, 10, 1264–1273. [Google Scholar] [CrossRef]
  39. Khosravi, V.; Ardejani, F.D.; Yousef, S.; Aryafar, A. Monitoring soil lead and zinc contents via combination of spectroscopy with extreme learning machine and other data mining methods. Geoderma 2018, 318, 29–41. [Google Scholar] [CrossRef]
  40. Falcioni, R.; Moriwaki, T.; Pattaro, M.; Furlanetto, R.H.; Nanni, M.R.; Antunes, W.C. High resolution leaf spectral signature as a tool for foliar pigment estimation displaying potential for species differentiation. J. Plant Physiol. 2020, 249, 15316. [Google Scholar] [CrossRef]
  41. El-Hendawy, S.E.; Al-Suhaibani, N.A.; Elsayed, S.; Hassan, W.M.; Dewir, Y.H.; Refay, Y.; Abdella, K.A. Potential of the existing and novel spectral reflectance indices for estimating the leaf water status and grain yield of spring wheat exposed to different irrigation rates. Agric. Water Manag. 2019, 217, 356–373. [Google Scholar] [CrossRef]
  42. Zhang, Y.; Wu, J.B.; Wang, A.Z. Comparison of various approaches for estimating leaf water content and stomatal conductance in different plant species using hyperspectral data. Ecol. Indic. 2022, 142, 109278. [Google Scholar] [CrossRef]
  43. Chen, X.P.; Wang, S.D.; Zhang, L.F.; Jiang, H.L. Accuracy and Sensitivity of Retrieving Vegetation Leaf Water Content. Remote Sens. Inf. 2016, 31, 48–57. [Google Scholar]
  44. Zhao, J.Y.; Zhang, X.X.; Yang, W. Leaf equivalent water thickness estimation based on spectral moisture indexes in broadleaf species. J. Zhejiang A F Univ. 2019, 36, 868–876. [Google Scholar]
  45. Li, Y.M.; Zhang, X.J. Remote sensing monitoring of water content in Lycium barbarum leaves based on spectral index. Geogr. Geo-Inf. Sci. 2019, 35, 16–21. [Google Scholar]
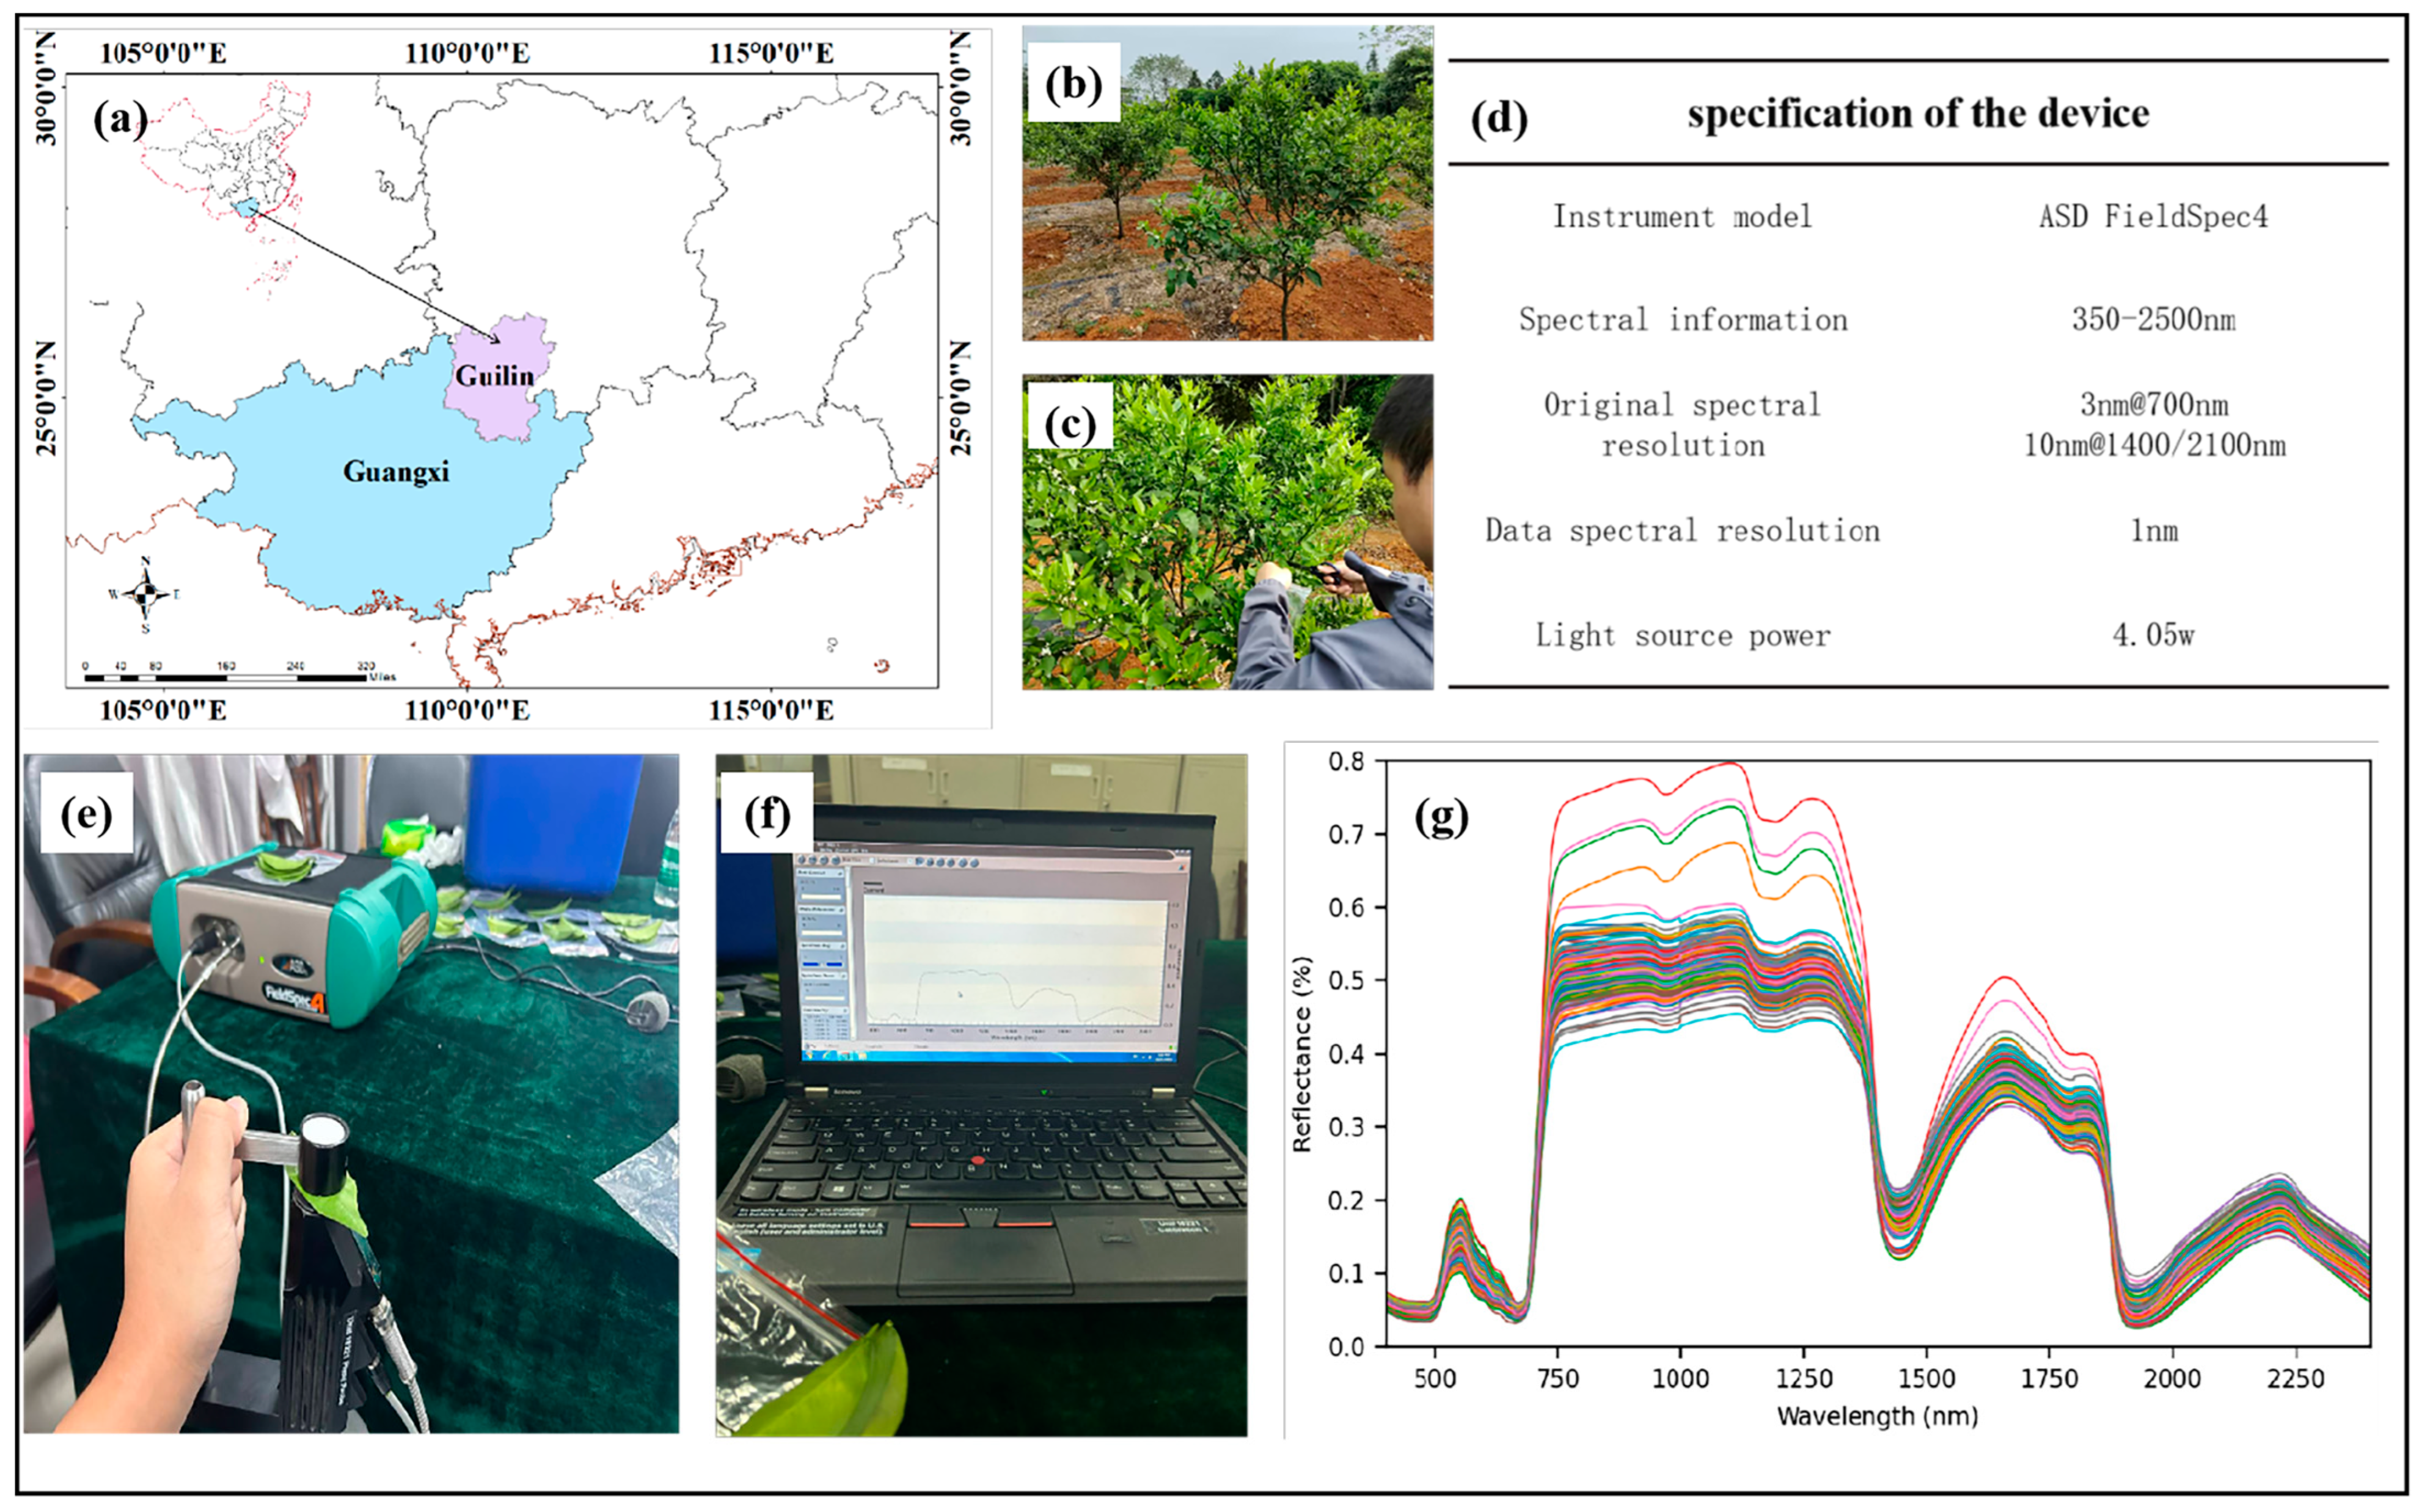
Figure 1. Overview of the study area: (a) the specific location of Guilin; (b) growth of fruit trees; (c) collection location of leaf blades; (d) specification of the device; (e) placement of leaf blades; (f) in situ hyperspectral curves of leaf blades; (g) spectral reflectance of leaf blades at 401~2400 nm.
Horticulturae 10 00177 g001
Figure 2. PLSR inversion model results: (a) R 2 at different wavelet scales; (b) R 2 for different fractional derivatives; (c) RMSE values of different wavelet scales; (d) RMSE values of different fractional derivatives.
Horticulturae 10 00177 g002
Figure 3. The proportions of bands in different spectral ranges: (a) the proportions of different wavelet scale bands; (b) the proportions of different fractional derivative bands.
Horticulturae 10 00177 g003
Figure 4. The screening results of the SPA and the results of the PLSR inversion model: (a) the number of bands selected at different wavelet scales; (b) the number of bands screened for different fractional derivatives; (c) R 2 values at different wavelet scales; (d) R 2 values for different fractional derivatives.
Horticulturae 10 00177 g004
Figure 5. Test set determination coefficients R 2 of the LWC and vegetation indexes at different wavelet scales using the PLSR model.
Horticulturae 10 00177 g005
Figure 6. Regression curves of the inversion model: (a) PLSR plot of CWT-SPA combined with the NDVI; (b) PLSR plot of FOD-SPA combined with the SRWI.
Horticulturae 10 00177 g006
Table 1. Formulae for calculating spectral vegetation indices.
Spectral Vegetation IndexComputational FormulaPearson Correlation
NDVI ( R 800 R 680 ) / ( R 800 + R 680 ) 0.4739
MSI R 1600 / R 820 −0.4787
NMDI ( R 860 ( R 1640 R 2130 ) ) / ( R 860 + ( R 1640 R 2130 ) )0.4125
PWI ( R 900 / R 970 ) / [ ( R 800 R 680 ) / ( R 800 + R 680 ) ] −0.3547
N D W I 1200 ( R 860 R 1200 ) / ( R 860 + R 1200 ) 0.6063
N D W I 1240 ( R 860 R 1240 ) / ( R 860 + R 1240 ) 0.6305
N D W I 1640 ( R 860 R 1640 ) / ( R 860 + R 1640 ) 0.4923
WI R 900 / R 970 0.6716
VARI ( R 555 R 645 ) / ( R 555 + R 645 R 450 ) 0.5641
SRWI R 860 / R 1240 0.6367
Disclaimer/Publisher’s Note: The statements, opinions and data contained in all publications are solely those of the individual author(s) and contributor(s) and not of MDPI and/or the editor(s). MDPI and/or the editor(s) disclaim responsibility for any injury to people or property resulting from any ideas, methods, instructions or products referred to in the content.