Article

Characterization and Comprehensive Evaluation of Phenotypic and Yield Traits in Salt-Stress-Tolerant Peanut Germplasm for Conservation and Breeding

1
College of Agriculture, Shenyang Agricultural University, Shenyang 110161, China
2
School of Agriculture and Horticulture, Liaoning Agriculture Vocational and Technical College, Yingkou 115009, China
*
Authors to whom correspondence should be addressed.
Horticulturae 2024, 10(2), 147; https://doi.org/10.3390/horticulturae10020147
Submission received: 10 January 2024 / Revised: 26 January 2024 / Accepted: 27 January 2024 / Published: 4 February 2024

Abstract

:
Salt stress is a limiting factor affecting the growth, development, and yield of peanuts. Breeding improvement is a possible solution to overcome salt stress. The salt tolerance of 57 peanut cultivars in Northeast China was identified using indoor simulation at the germination stage, the seedling stage, and field natural identification. At the germination stage, 75 mM NaCl was the most suitable screening concentration, and the seed vitality index of 57 cultivars was analyzed using the membership function and cluster analysis. Among these cultivars, 11 were identified as salt-tolerant and 19 were salt-sensitive during germination. In the seedling stage, six salt tolerance coefficients (STCs) showed significant correlation. A gray relational analysis was used in combination with evaluation grading, resulting in the identification of 14 salt-tolerant cultivars and 12 salt-sensitive cultivars. In the field screening, a comprehensive analysis was conducted using a principal component analysis of nine indices, including agronomic characteristics, yield characteristics, and SPAD. This analysis led to the determination of three comprehensive indices. The weighted membership function was used for comprehensive evaluation. Finally, three salt-tolerant cultivars and four salt-sensitive cultivars suitable for planting in Northeast China were screened out to provide an excellent germplasm for researching the salt-tolerant mechanism of peanuts.

1. Introduction

Peanuts (Arachis hypogaea L.) are an important source of high-quality plant protein and vegetable oils. They is mainly distributed in tropical, subtropical, and warm temperate regions [1]. As one of the four major peanut-producing areas, Northeast China has seen significant developments in planting area and yield. Because the pollution risk of aflatoxin is significantly lower than that in other producing areas, Northeast China has become a recognized high-quality peanut production base [2]. However, the growth and development of peanuts are often limited by abiotic stresses, such as extreme temperatures, droughts, soil salinization, and heavy metal pollution [3,4]. The salinization of soils is considered to be one of the most significant environmental problems in the world [5]. Salinity affects one billion hectares of cultivated agricultural ground worldwide and 33% of irrigated agricultural land. The extent of cultivated land affected by salt stress and the magnitude of its impact have consistently shown an upward trend over the years [6]. Most of China’s salinized land is scattered across the northeast, north, and northwest [7]. Salt stress is one of the major factors limiting land use and food production. Peanuts, a crop moderately sensitive to salt, have been cultivated primarily on infertile lands in arid and salinized areas because of the lack of arable land [8].
Genetic improvement in salt tolerance is an effective measure to alleviate salt stress [9]. Developing salt-tolerant cultivars and expanding arable land are crucial for the advancement of sustainable and industrialized green agriculture [10,11]. Using the quantitative trait locus (QTL) to understand superior traits is an effective strategy for cultivar improvement and can quicken the development of tolerant/resistant cultivars that are able to withstand abiotic stresses [12]. QTL mapping has been widely used to study abiotic stress tolerance in crops [13,14]. The salt tolerance of plants is a polygenic trait that is controlled by several QTLs [15,16]. Wang et al. [17] argued that the QTL qSNC11 plays a vital role in the salt tolerance of rice and can be used to enhance the salt tolerance of rice varieties through marker-assisted selection (MAS). Using biotechnological and genetic techniques, such as transgenic and gene engineering, can improve cultivation methods and enhance the salt tolerance of tamarisk [18], cotton [19], and poplar [20]. Certainly, there are many applications in oilseed crops. Hamwieh and Xu [21] showed that a major salt-tolerant QTL with a large dominant effect accounted for 68.7% of the total variance in the STR scale for soybean. Li et al. [22] used 490 accessions of sesame (Sesamum indicum) to conduct a genome-wide analysis of salt stress tolerance. There were 132 significant single-nucleotide polymorphisms (SNPs), which were further found to be associated with nine QTLs under salt stress. A total of 18 unique QTLs controlling two to four traits were detected by Zhang et al. [23] using a meta-analysis. Six novel and unique QTLs were detected for salt-alkali tolerance and yield-related traits. Based on a comparison with QTLs previously identified for yield-related traits, seven co-localized regions on A09 and A10 were identified.
The breeding of salt-tolerant cultivars forms the basis for genetic improvement in salt tolerance [24]. Appropriate evaluation methods and identification indices are the key to rapid and accurate screening of salt-tolerant cultivars. In order to select new cultivars, it is important to have an effective selection criterion [25]. There are many different criteria and indicators that can be utilized to evaluate the salt tolerance of crops. Hussain et al. [26] set three salinity levels; determined seven indices, such as plant height, number of branches per plant, number of panicles per plant, and panicle length; and identified the salt tolerance of six contrasting quinoa cultivars using static environmental variance (S2) and dynamic Wricke’s ecovalence (W2). Alam et al. [27] screened salt tolerance at the seedling stage under 200 mM NaCl. They divided 27 tomato genotypes into 5 key clusters using a principal component analysis and clustering with a percentage reduction in growth parameters. Saniora was the most salt-tolerant genotype, and P.Guyu was the most sensitive. To evaluate 20 diverse alfalfa cultivars at the seedling stage, principal components, membership functions, and cluster and stepwise regression analyses were used with the salt tolerance coefficients of 14 traits [28]. The shoot fresh weight, the ratio of the shoot fresh weight to the root fresh weight, the shoot dry weight, and the ratio of K+ to Na+ in the shoot were used as indicators of salt tolerance in alfalfa seedlings grown under a 150 mM NaCl treatment.
Various cultivars exhibit varying degrees of sensitivity to environmental conditions, making the selection or enhancement of local cultivars more appropriate for natural cultivation conditions in a given area than introducing foreign cultivars [29]. This can fundamentally solve the problem of saline–alkali soil and improve crop yield and quality [30]. Moreover, crops phenotypes are always critical to consider in domestication and breeding [31]. Salt-tolerant cultivars may be used as a genetic resource for crop breeding to ensure yield stability in the future [32,33]. Previous studies have primarily concentrated on a single research evaluation index, which has been criticized for its lack of objective evaluation. Moreover, previously, identification was based on a single growth period in the field or an entire growth period in the field. In recent years, the detrimental effects of salt stress on peanut production in Northeast China have become increasingly severe. Our objective was to identify salt-tolerant peanut cultivars that are suitable for this region to provide an excellent germplasm for the research of the salt-tolerant mechanism of peanuts through the assessment of the germination index, seedling morphological index, agronomic characteristics in the field, and yield characteristics. To achieve this, a total of 57 peanut cultivars, predominantly cultivated in Northeast China, were utilized as the experimental materials in this research. Multivariate statistical methods such as correlation analysis, cluster analysis, gray relation analysis, membership function analysis, and principal component analysis were used to evaluate salt tolerance at the germination stage, seedling stage, and field growth stage.

2. Materials and Methods

2.1. Plant Material

A total of 57 peanut cultivars mainly planted in Northeast China were collected for salt tolerance identification (Table S1). SN1, SN3, SN5, SN8, SN16, and SN40 were used to screen the NaCl concentration during germination. All the seeds were provided by the Peanut Research Institute of Shenyang Agricultural University. The methodological framework is shown in Figure S1.

2.2. Experimental Design

2.2.1. Screening of Salt Tolerance of Peanuts during Germination

The seed germination test was conducted in a biochemical incubator (SHP-150, Shanghai Sumsung Laboratory Instrument Co., Ltd., Shanghai, China). Sodium hypochlorite (NaClO) solution (1%) was used to sterilize the surface of full seeds of uniform size for 10 min after soaking in 50 mM, 75 mM, and 100 mM NaCl solutions for 10 h. Distilled water was used as the control (0 mM). The seeds were placed neatly in a Petri dish covered with double-layer of wet filter paper. The seeds were covered with wet gauze and cultured in the dark, during which time the concentration was verified using the weighing method at 28 °C for 10 days. Each treatment was set to repeat 3 times, each with 30 seeds.

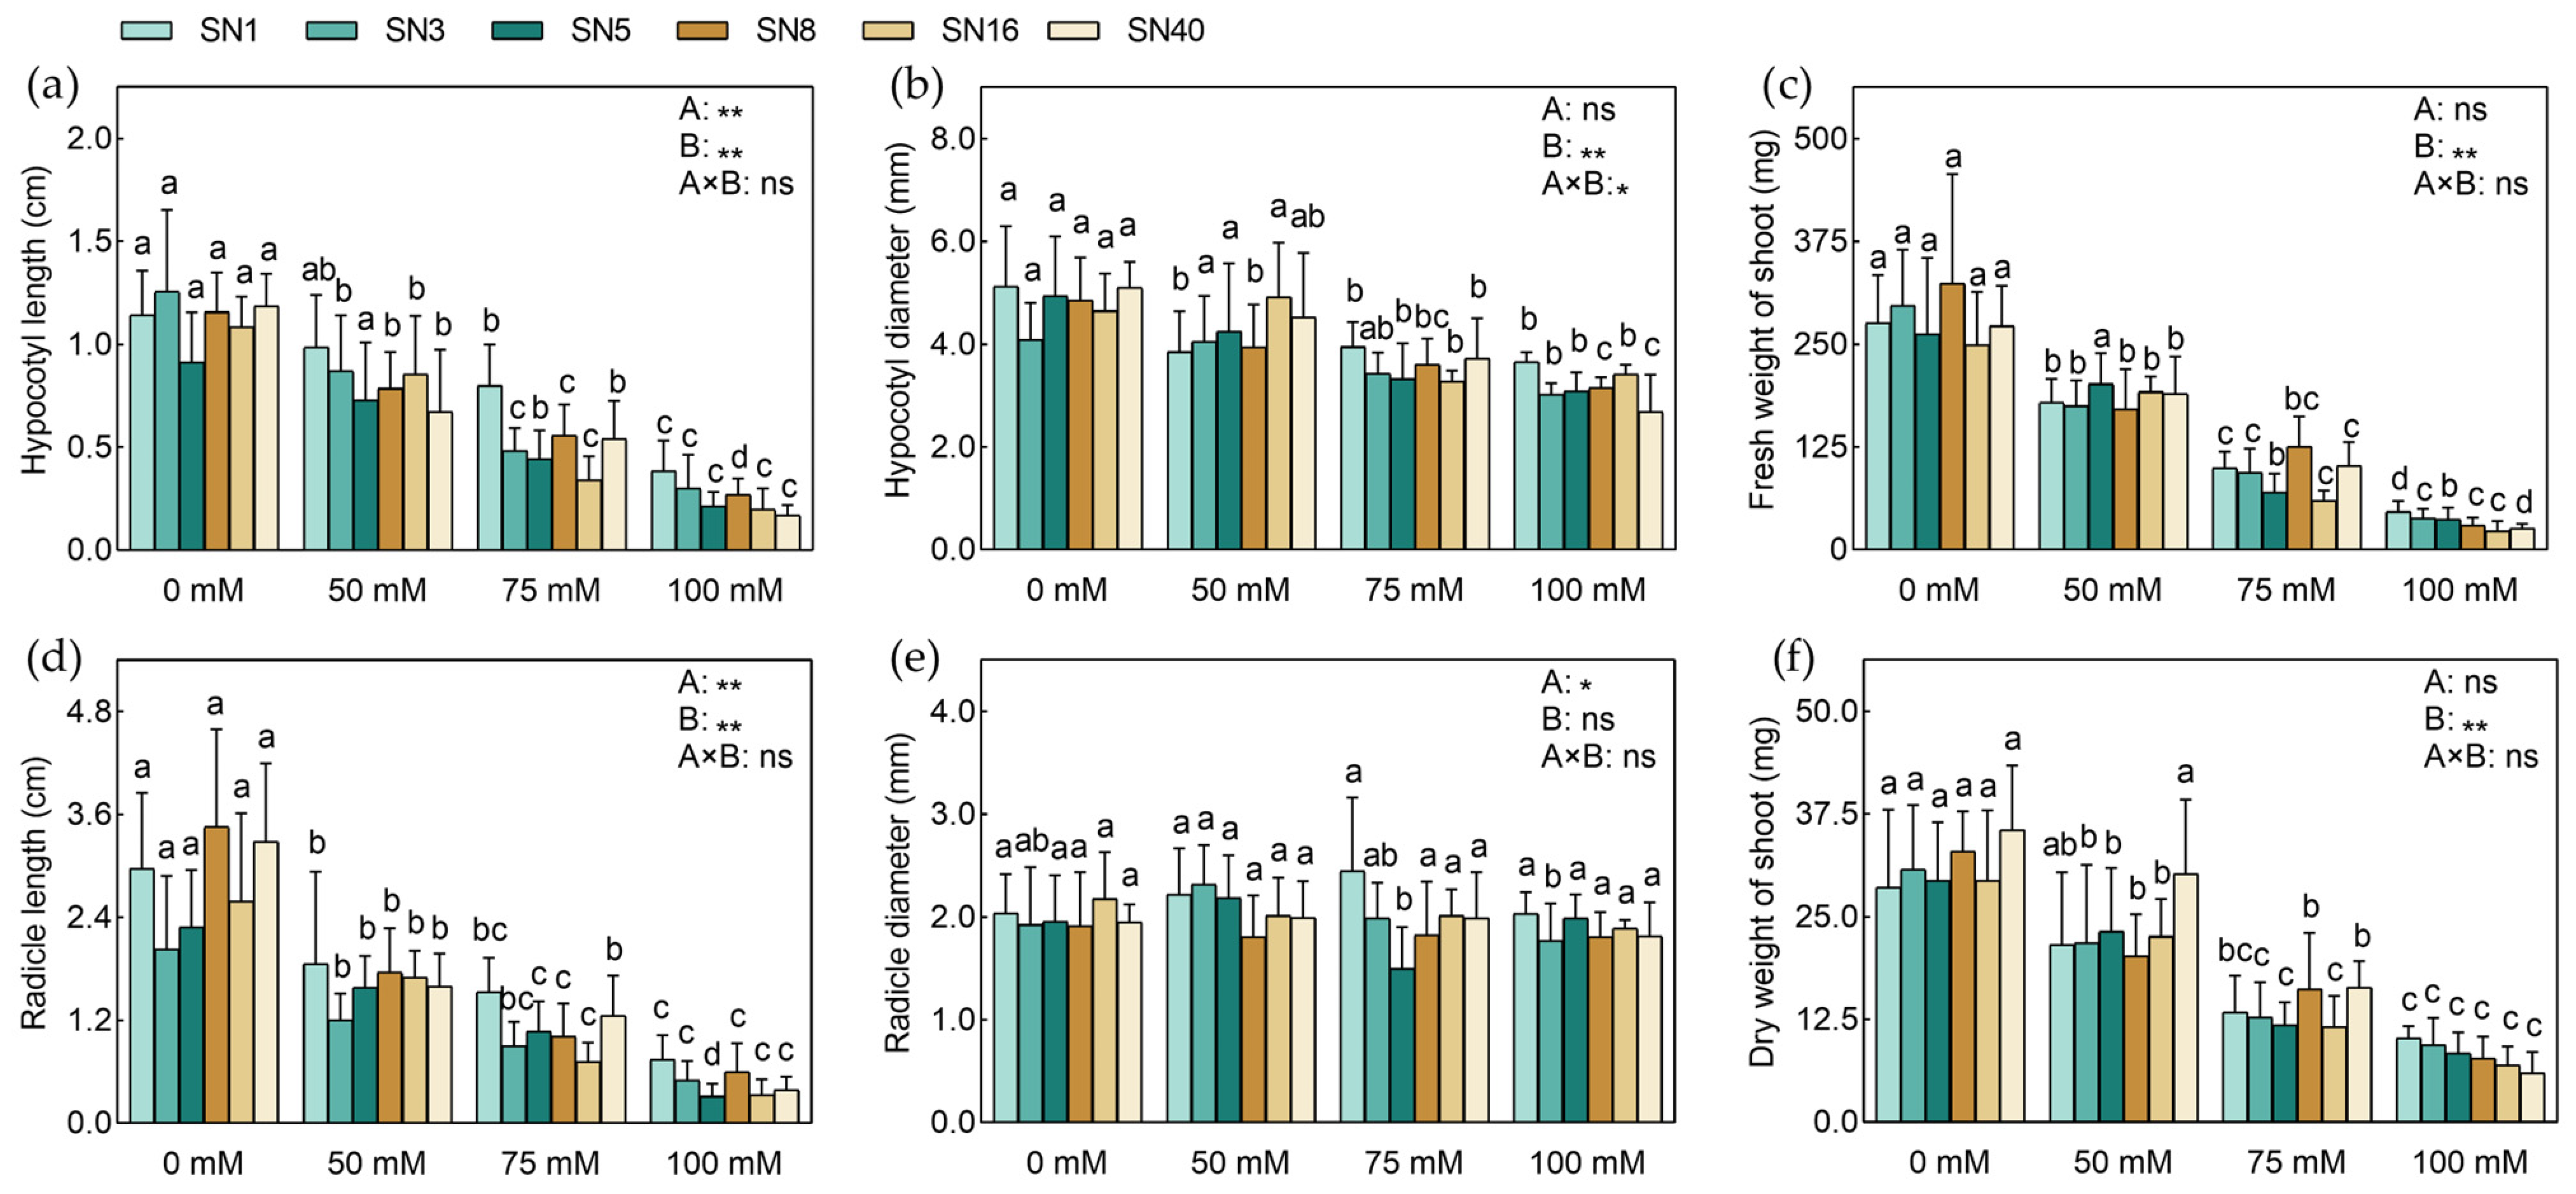
2.2.2. Screening of Salt Tolerance of Peanuts at the Seedling Stage

The experiment took place in a solar greenhouse at the experimental base of Shenyang Agricultural University (41°50′ N; 123°34′ E), Liaoning Province, China. NaClO (1%) was used to sterilize the surface of the full seeds of uniform size for 10 min. The seeds which germinated neatly were sown in vermiculite pots after soaking in distilled water solutions for 10 h. After removing the cotyledons, the seedlings with the same growth were carefully removed and transferred into hydroponic boxes containing 1/2 Hoagland solution (PH0424, Phygene, Fuzhou, China). The new nutrient solution was replaced every 3 days, while reductions in volume were supplemented daily with distilled water. We separated the seedlings into two groups when the peanut seedlings grew to the three-leaf and one-heart stage. One group was hydroponically grown in 1/2 Hoagland solution supplemented with 200 mM NaCl. The other group was grown in 1/2 Hoagland solution supplemented without NaCl. Each treatment was set to repeat 3 times.

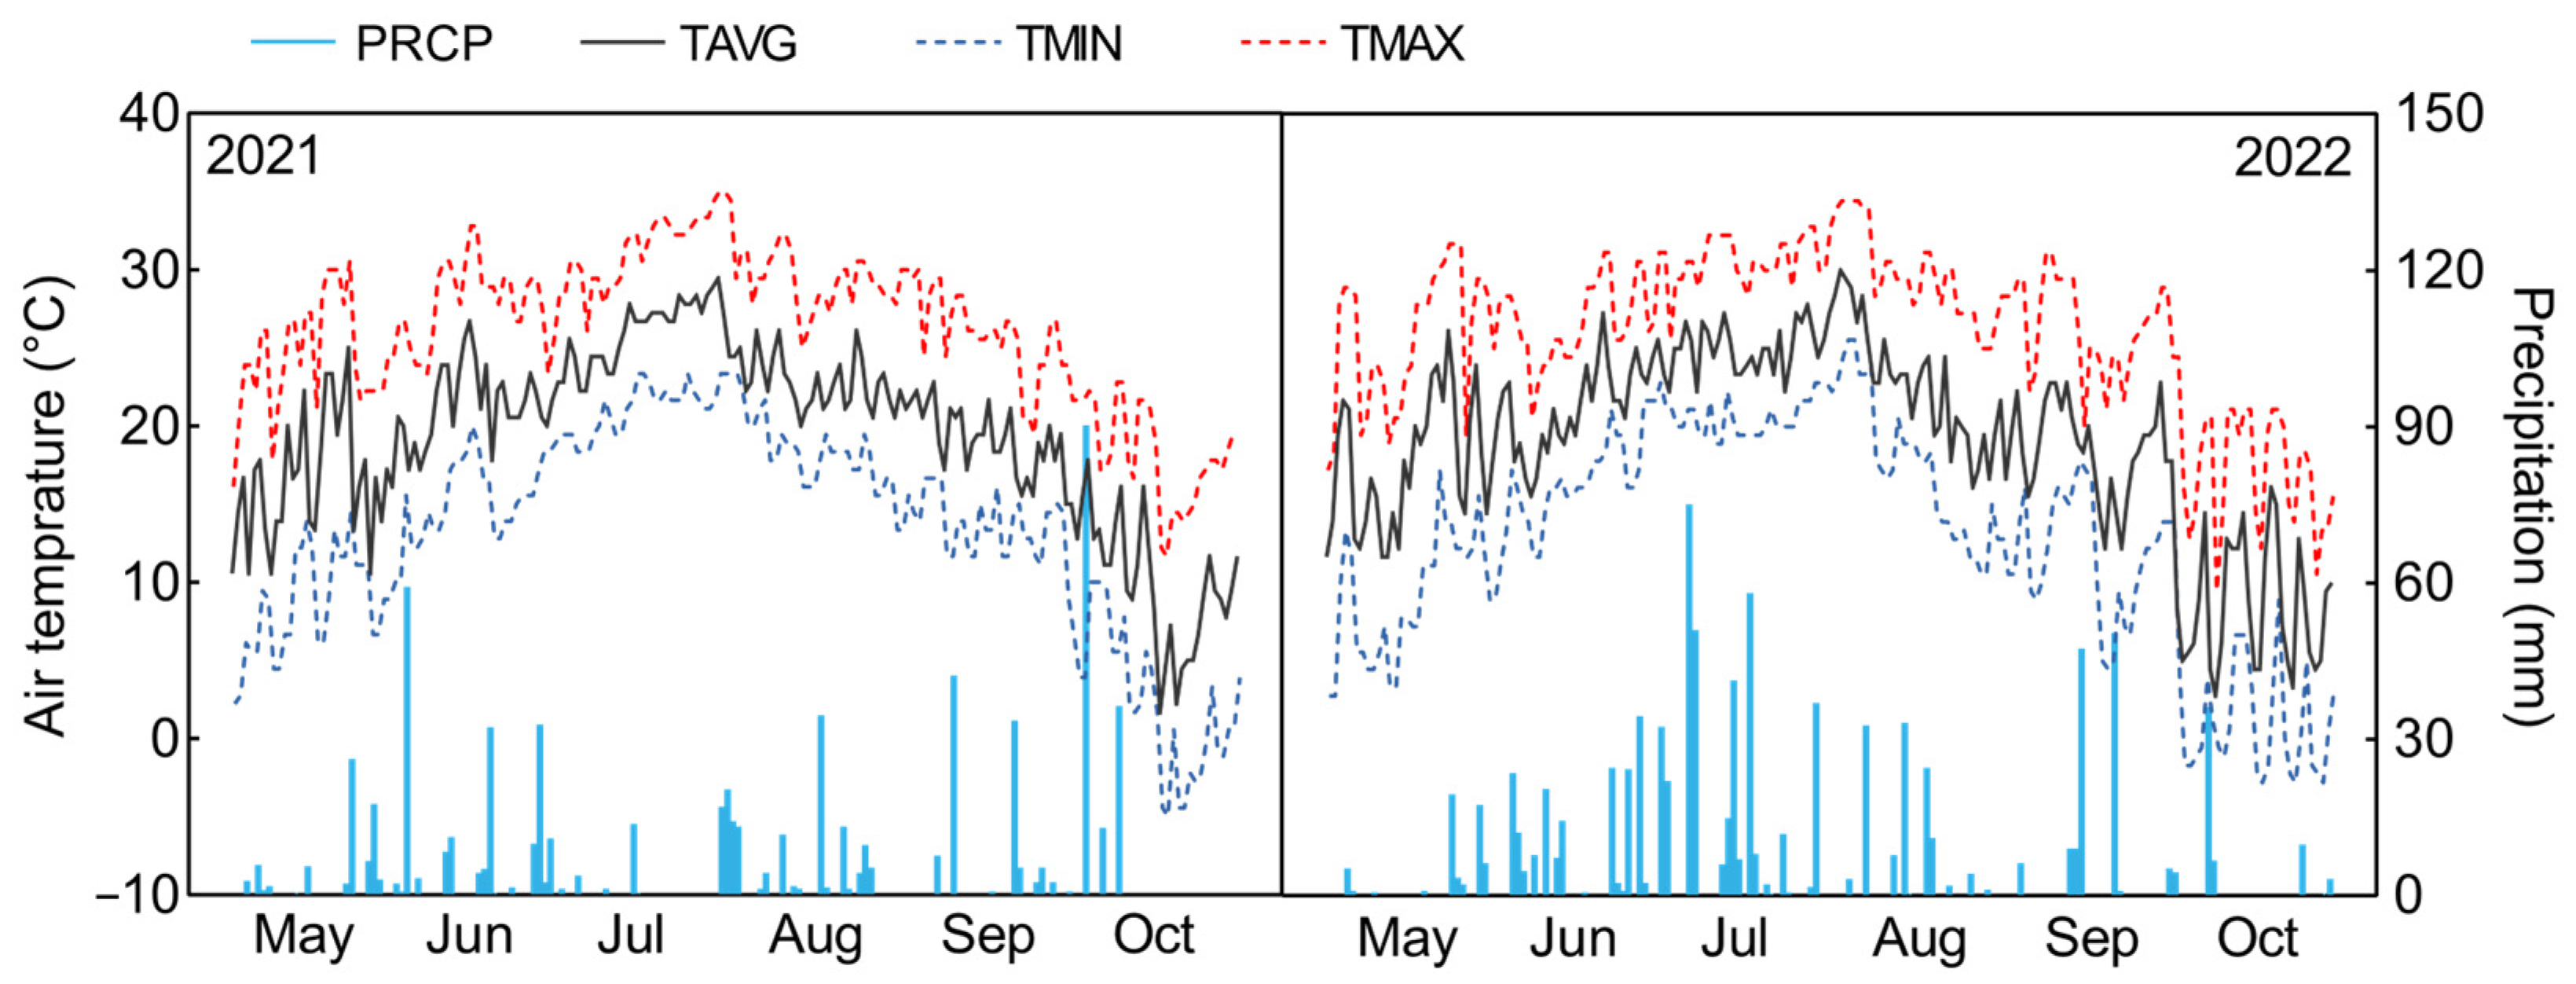
2.2.3. Screening of Salt Tolerance of Peanuts in the Field

The experiment was carried out at the experimental field of Shenyang Agricultural University (41°82′ N; 123°56′ E), Liaoning Province, China during 2021–2022. Seed sowing was carried out on 20 May 2021 and 18 May 2022, and harvesting was carried out on 28 September 2021 and 25 September 2022. The region has a temperate semi-humid continental climate, with the annual mean temperature ranging between 6.2 and 9.7 °C and rainfall ranging between 600 and 800 mm (Figure 1). The soil type was brown loam. The basic physicochemical properties of the soil were as follows: soil organic matter, 15.4 g kg−1; available phosphorus, 27.50 mg kg−1; available potassium, 117.9 mg kg−1; alkaline hydrolysable nitrogen, 96.7 mg kg−1; and soil pH, 6.5. Before sowing, the soil salinity concentration was adjusted to 2.5 g kg−1 NaCl with a partition to simulate the 0.25% NaCl (moderately salinized) soil level in the field [8]. The cultivation layer of the experimental field was calculated to be 20 cm. The fertilization level used was the conventional fertilization level (75 kg N ha−1, 120 kg P2O5 ha−1, 170 kg K2O ha−1) with traditional field management. Each plot was 1 m in length, with 0.6 m row spacing and 10 cm between the plants in each row. Using a randomized block design, each treatment was set to repeat 3 times. The field experiment utilized the average values of 2021 and 2022.

2.3. Index and Method

2.3.1. Determination of Seed Vitality Index

Based on the method of Ahn et al. [34], the seeds were recorded daily as they germinated. The length of the radicle was measured with a ruler. The germination potential, germination rate, germination index, and vigor index were measured.
G e r m i n a t i o   n p o t e n t i a l   % = n u m b e r   o f   t o t a l   g e r m i n a t i o n   s e e d s   a f t e r   3   d n u m b e r   o f   s e e d s × 100
G e r m i n a t i o n   r a t e   % = t o t a l   g e r m i n a t i o n   a f t e r   7   d n u m b e r   o f   s e e d s × 100
G e r m i n a t i o n   i n d e x   % = G t / D t
V i g o r   i n d e x   =   S   ×   g e r m i n a t i o n   r a t e
Within Equation (3), Gt represents the germination numbers on day t, and Dt represents the corresponding germination days. Within Equation (4), S represents the average radicle length of each germinated seed.

2.3.2. Determination of Seed Morphological Index

The peanut seedlings were removed from the trays after eight days of cultivation. All the seedlings were washed with tap water and blotted dry on filter paper. The hypocotyl length and radicle length were measured using a ruler. The diameter of the hypocotyl and radicle were measured with a vernier caliper. The weight of the fresh material was recorded, and then the material was oven-dried at 80 °C to a constant weight, and the dry weight was recorded.

2.3.3. Determination of Seedling Morphological Index

The growth state of the peanut seedlings was observed and scored according to the salt tolerance morphological grade of peanut seedlings (Table 1). Plant height was measured with a ruler. Calculation of leaf area was carried out using the method of specific leaf weight. The fresh weights of shoot and root were recorded, and then the material was oven-dried at 80 °C to a constant weight, and the dry weight was recorded.

2.3.4. Investigation of Agronomic Characteristics in the Field

The seedling emergence counts were recorded daily and used to calculate the total emergence percentage and relative emergence percentage. Five young leaves were collected from three randomly selected plants per cultivar in the flower and needle stage to measure soil and plant analyzer development (SPAD) values using a SPAD-502Plus chlorophyll meter (Konika Minolta, Tokyo, Japan). Then, the lateral branch length, plant height, and stem dry weight were measured.

2.3.5. Determination of Yield Characteristics

At maturity, the yield traits were investigated for three randomly selected plants. The yield per plant, hundred-pod weight, hundred-grain weight, and full-pod number per plant were investigated and averaged.

2.4. Data Analysis and Statistics

The data were collated and analyzed using Microsoft Excel 2016. A correlation analysis, cluster analysis, and principal component analysis of the resulting data were performed using GraphPad Prism 8.0.2 and R v3.4.4. The calculation formula is as follows:
S T C s = X N a C l X c o n t r o l
C I = j = 1 n [ B i × p r i n ( m ) j ] j = 1,2 , 3 , , n
where XNaCl and Xcontrol are the values of the traits for different peanut cultivars evaluated under NaCl and water. STCs are the salt tolerance coefficients, CI is the comprehensive index value, Bi is the standardized value of the STCs for each index, and prin(m)j is the coefficient of the CI value.
The STCs of 57 peanut cultivars were evaluated using a membership function analysis:
μ X j = X j X m i n X m a x X m i n j = 1,2 , 3 , , n
where μ(Xj) is the membership function value of the j index, Xj is the STC of the jth index, Xmax is the maximum value of Xj, and Xmin is the minimum value of Xj.
Based on principal component analysis, the field index of 57 cultivars was calculated according to Formula (9), and the comprehensive evaluation value of the peanut field was calculated according to Formula (10). Wj is the ratio of the jth comprehensive indicator’s contribution to the total contribution of all comprehensive indicators, and Pj is the contribution of the jth comprehensive indicator. The formula of the comprehensive evaluation method is as follows:
μ C I = C I j C I m i n C I m a x C I m i n j = 1,2 , 3 , , n
W j = P j j = 1 n P j j = 1,2 , 3 , , n
D = j = 1 n [ μ ( C I ) × W j ] j = 1,2 , 3 , , n

3. Results

3.1. Evaluation of Stress Tolerance during Peanut Germination

3.1.1. Determination of NaCl Stress Concentration during Germination

The hypocotyl length, hypocotyl diameter, radicle length, fresh weight of shoot, and dry weight of shoot all decreased with the increases in concentration under the stress of 0 mM, 50 mM, 75 mM, and 100 mM NaCl. The hypocotyl diameter was not significantly different at 50 mM (−5.77–24.80%), but it significantly decreased under 75 mM (16.08–32.73%) and 100 mM (25.90–47.32%). The hypocotyl length, hypocotyl diameter, fresh weight, and dry weight of the shoots all decreased at 50 mM, but the difference was only significant at 75 mM NaCl. Therefore, 75 mM NaCl was selected as the screening concentration during germination (Figure 2).

3.1.2. STCs of Germination Characteristics under 75 mM NaCl

The germination characteristics of 57 peanut cultivars showed a decreasing trend under NaCl stress. Differences were observed among the different peanut cultivars. The relative germination rate ranged from 0.710 to 1.000. The change ranges of the relative germination potential, relative germination index, and relative vigor index were 0.449–1.000, 0.445–0.883, and 0.122–0.876, respectively. Some distinct variations were observed between the cultivars, and the variation coefficient ranged between 6.701% and 37.797% (Table 2). These results show that there was wide genetic diversity among the tested materials. The tested indices were sensitive to NaCl treatment, but the salt tolerance of the different peanut cultivars under NaCl treatment differed; therefore, it was evaluated comprehensively.

3.1.3. Analysis of Membership Function during Germination

The germination characteristics of the different peanut cultivars were affected by 75 mM NaCl stress. To better assess the effect of the different indices on the peanut germination period, a membership function analysis was performed to comprehensively evaluate the salt tolerance of the peanut germplasms at the germination stage. The membership function values of each index at the germination stage are shown in the bar chart (Figure 3). The cultivars exhibiting the greatest salt tolerance, as determined by their D value, were positioned at the highest rank. The D value of SN55 was the largest (0.844), followed by that of SN1 (0.837). The salt-sensitive cultivars ranked lower, with the D value of SN11 ranking as the lowest (0.188), followed by that of SN44 (0.206).
The germination characteristic membership function analysis and cluster analysis of the heatmap data indicated that the 57 peanut cultivars could be grouped into three categories (Figure 3), with SN38, SN35, SN44, SN49, SN33, SN56, SN54 SN46, SN11, SN40, and SN39 forming one group. These are salt-sensitive cultivars with a weak relative germination potential, a low relative germination rate, a small relative germination index, a poor relative vigor index, and a position at the bottom of the overall ranking. SN28, SN15, SN52, SN42, SN22, SN26, SN9, SN43, SN30, SN2, SN6, SN34, SN18, SN19, SN51 SN17, SN55, SN1, and SN5 can be divided into another group, with a strong relative germination potential, a high relative germination rate, and a high relative germination index. The comprehensive ranking of this group is high, and they are salt-tolerant cultivars.

3.2. Evaluation of Stress Tolerance at the Seedling Stage

3.2.1. Grade Salt Damage to Peanut Leaves under NaCl Stress at the Seedling Stage

In the screening stage of the seedling development, the salt-tolerance levels were determined by assessing the shape of the seedlings. The height of the lollipop column indicates the evaluation grade (Figure 4). A higher score indicates a greater impact on peanut seedlings of a particular cultivar under NaCl stress, resulting in more severe damage. That is to say, the response to NaCl is sensitive, which is represented by blue lollipop circles, represented by SN27, SN38, and SN50. Similarly, the smaller the value, the less the cultivar is affected by NaCl. These cultivars are represented by the red lollipop circles and are salt-tolerant. Among them, SN1, SN17, and SN29 demonstrated the strongest resistance. The morphological characteristics of the different cultivars of peanuts with salt tolerance were readily observable.

3.2.2. STCs of Peanuts under NaCl Stress at the Seedling Stage

Only when considering the grade of appearance may one-sidedness occur. Thus, in this research, the 6 morphological indices of 57 cultivars in the seedling stage were measured, and the STCs were calculated (Table S2). A histogram is used to show the frequency distribution of six STCs among the cultivars (Figure 5). The distribution ranges of the relative plant height and relative shoot dry weight ranged from 50% to 105% and 20% to 100%, respectively, in 70–90% and 55–70% of the cultivars. The relative fresh weight of the shoots and roots was distributed between 20% and 120% in 60–90% and 40–70% of the cultivars, while the relative leaf area and relative dry weight of root had distribution ranges of 40–70% and 40–80%. Using a Pearson correlation analysis, we examined the correlations between the different indicators. All the indices were significantly correlated with each other. The correlation coefficient between the relative root fresh weight and relative root dry weight was as high as 0.94 (Figure 5). Then, we nondimensionalized the above data using the initial value method. The difference sequence value was calculated, and the gray correlation coefficient was obtained. The GCD (gray correlation degree) was calculated and sorted. The top 15 cultivars were classified as salt-tolerant, and the bottom 15 were determined to be salt-sensitive cultivars (Table 3). Finally, we utilized a combination of these two methods to obtain the ultimate salt tolerance classification. There were 14 salt-tolerant cultivars at the seedling stage, SN1, SN3, SN4, SN5, SN7, SN 8, SN 9, SN11, SN17, SN21, SN22, SN23, SN26, and SN29, and 12 salt-sensitive cultivars: SN13, SN15, SN27, SN30, SN33, SN38, SN39, SN42, SN49, SN50, SN51, and SN53 (Table S3).

3.3. Evaluation of Stress Tolerance of Peanuts in the Field

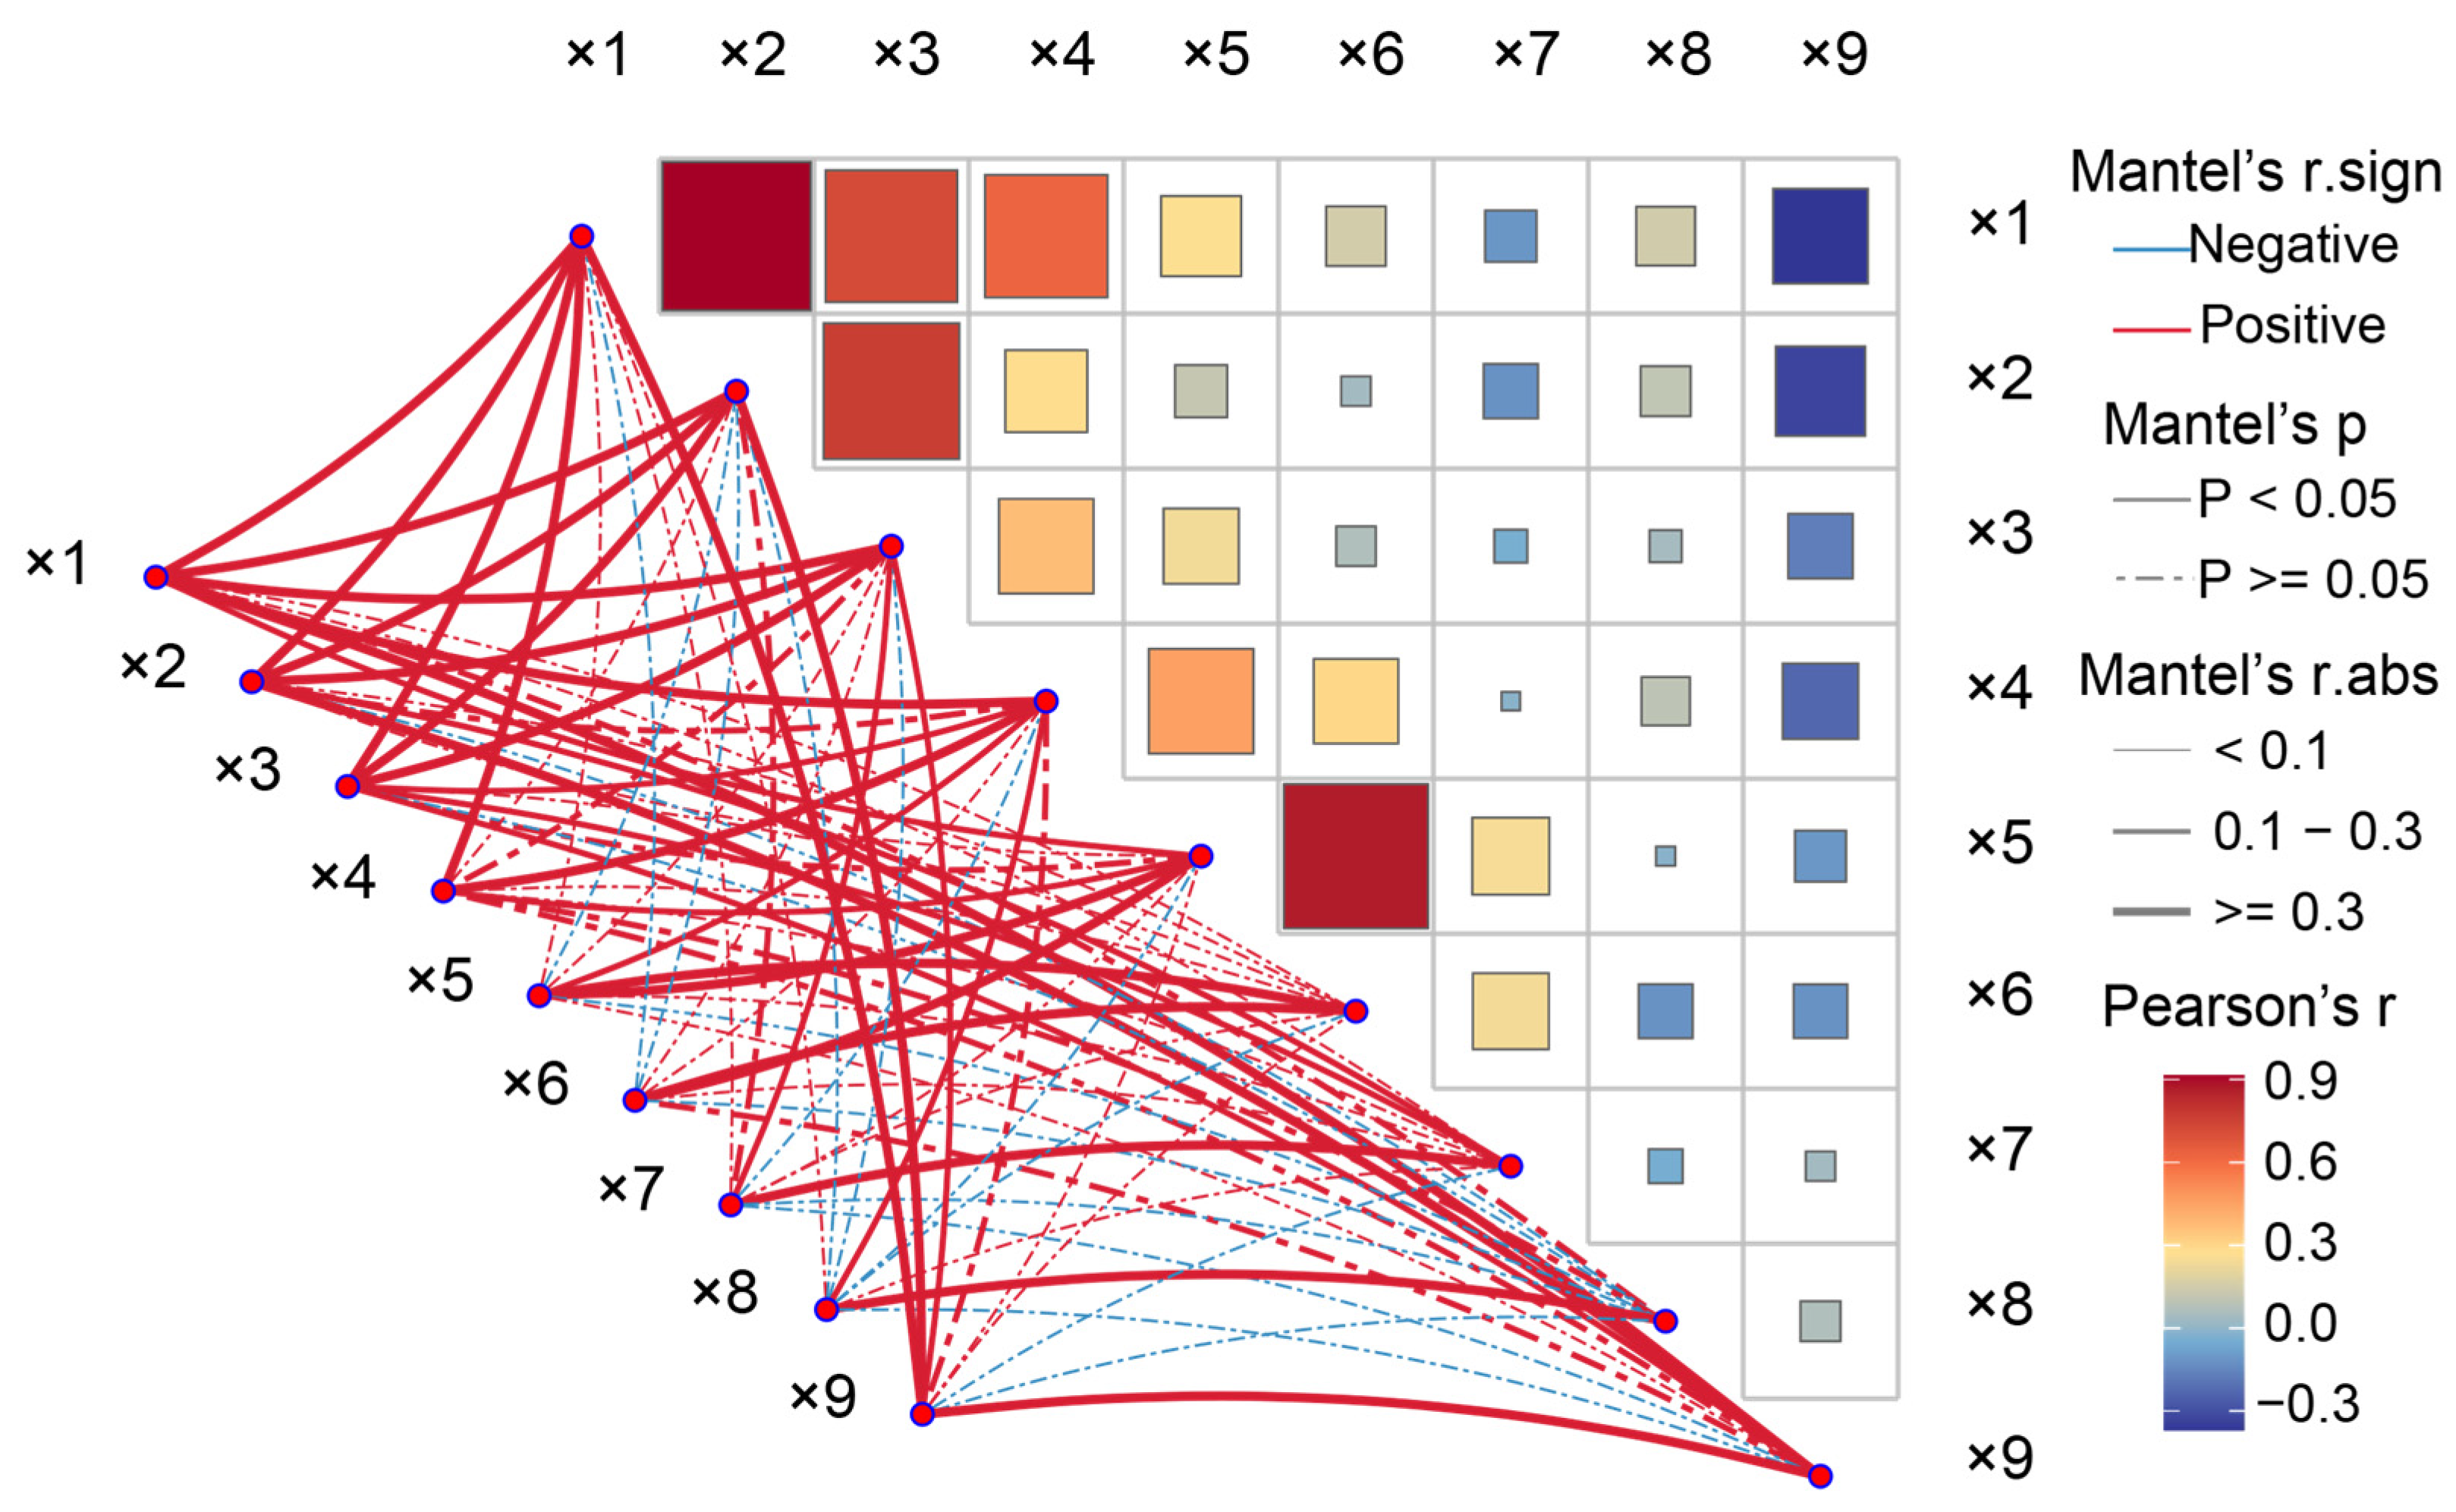
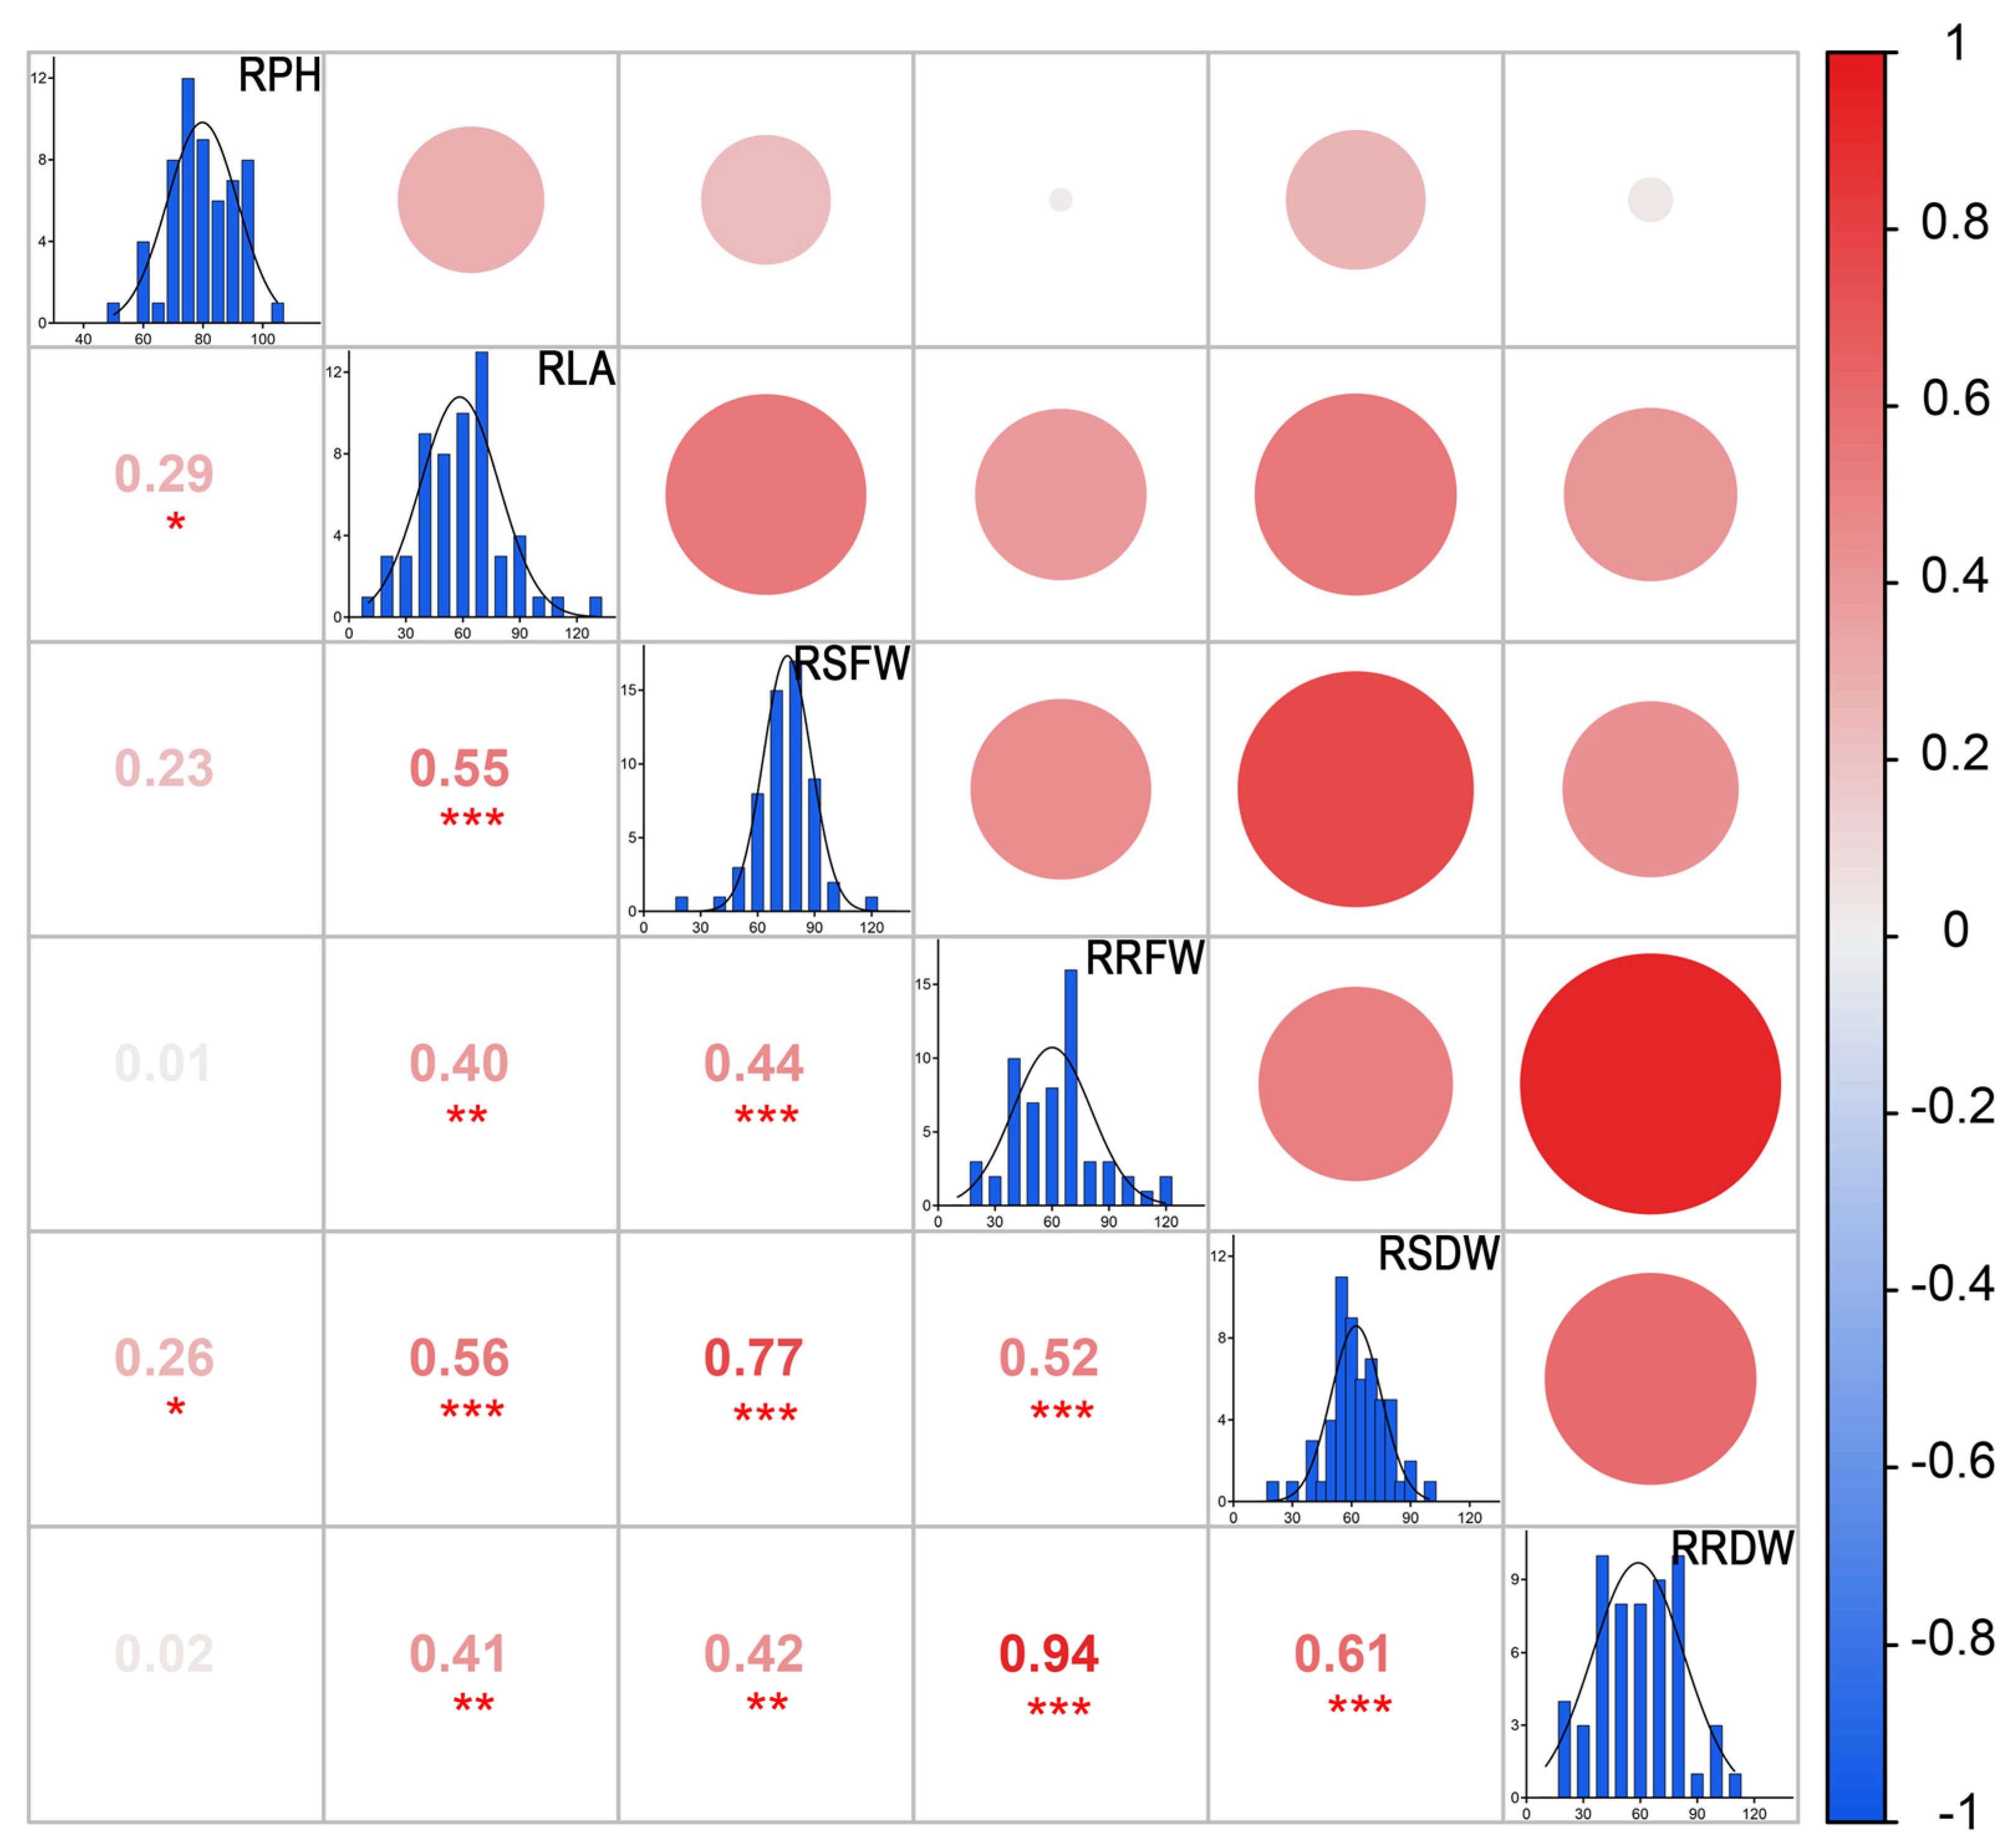
3.3.1. Correlation Analysis of Nine Indicators of STCs of Peanut Cultivars under NaCl Stress in the Field

In the field screening part of this study, the agronomic characteristics in the field, the field characteristics of each cultivar were determined, and the STCs were calculated. The agronomic characteristics in the field and yield characteristics of the 57 peanut cultivars were inhibited under NaCl stress. Some distinct variations were observed between the cultivars, and the variation coefficient ranged between 6.042% and 36.605% (Table 4).
To better understand the characteristics of the tolerance coefficient, a correlation analysis was subsequently conducted. The results show that there were different degrees of correlation among the nine STCs (Figure 6). There was a very significant positive correlation between the relative yield per plant and the measured indices, except for the relative emergence rate and relative SPAD value. The correlation between the relative yield per plant and relative 100-pod weight was the strongest, being as high as 0.915 (p < 0.01). Except for the relative emergence rate and relative stem dry weight, the relative SPAD value was significantly negatively correlated with the measured biological indices and had the greatest correlation with the relative yield per plant (r = −0.373).

3.3.2. Eigenvectors, Contribution Rate, and Weight of Principal Components of Peanut Cultivars under NaCl Stress in the Field

A principal component analysis was performed to make up for the deficiencies of a single-index evaluation. The characteristic values of the three principal components were greater than 1, and the cumulative contribution rate was 69.323%. As a result, the original nine characteristics could be transformed into three new independent comprehensive indices to evaluate and judge the field salt tolerance of the peanut cultivars. These three principal components represent most of the information contained in the original characteristics. The first principal component had the highest contribution rate of 36.612%, including the relative yield per plant, relative hundred-pod weight, relative hundred-grain weight, and relative full-pod number per plant. The contribution rate of the second principal component was 21.020%, including the relative lateral branch length, relative plant height, and relative seedling emergence rate. The contribution rate of the third principal component was 11.690%, including the relative stem dry weight and relative SPAD (Table 5).

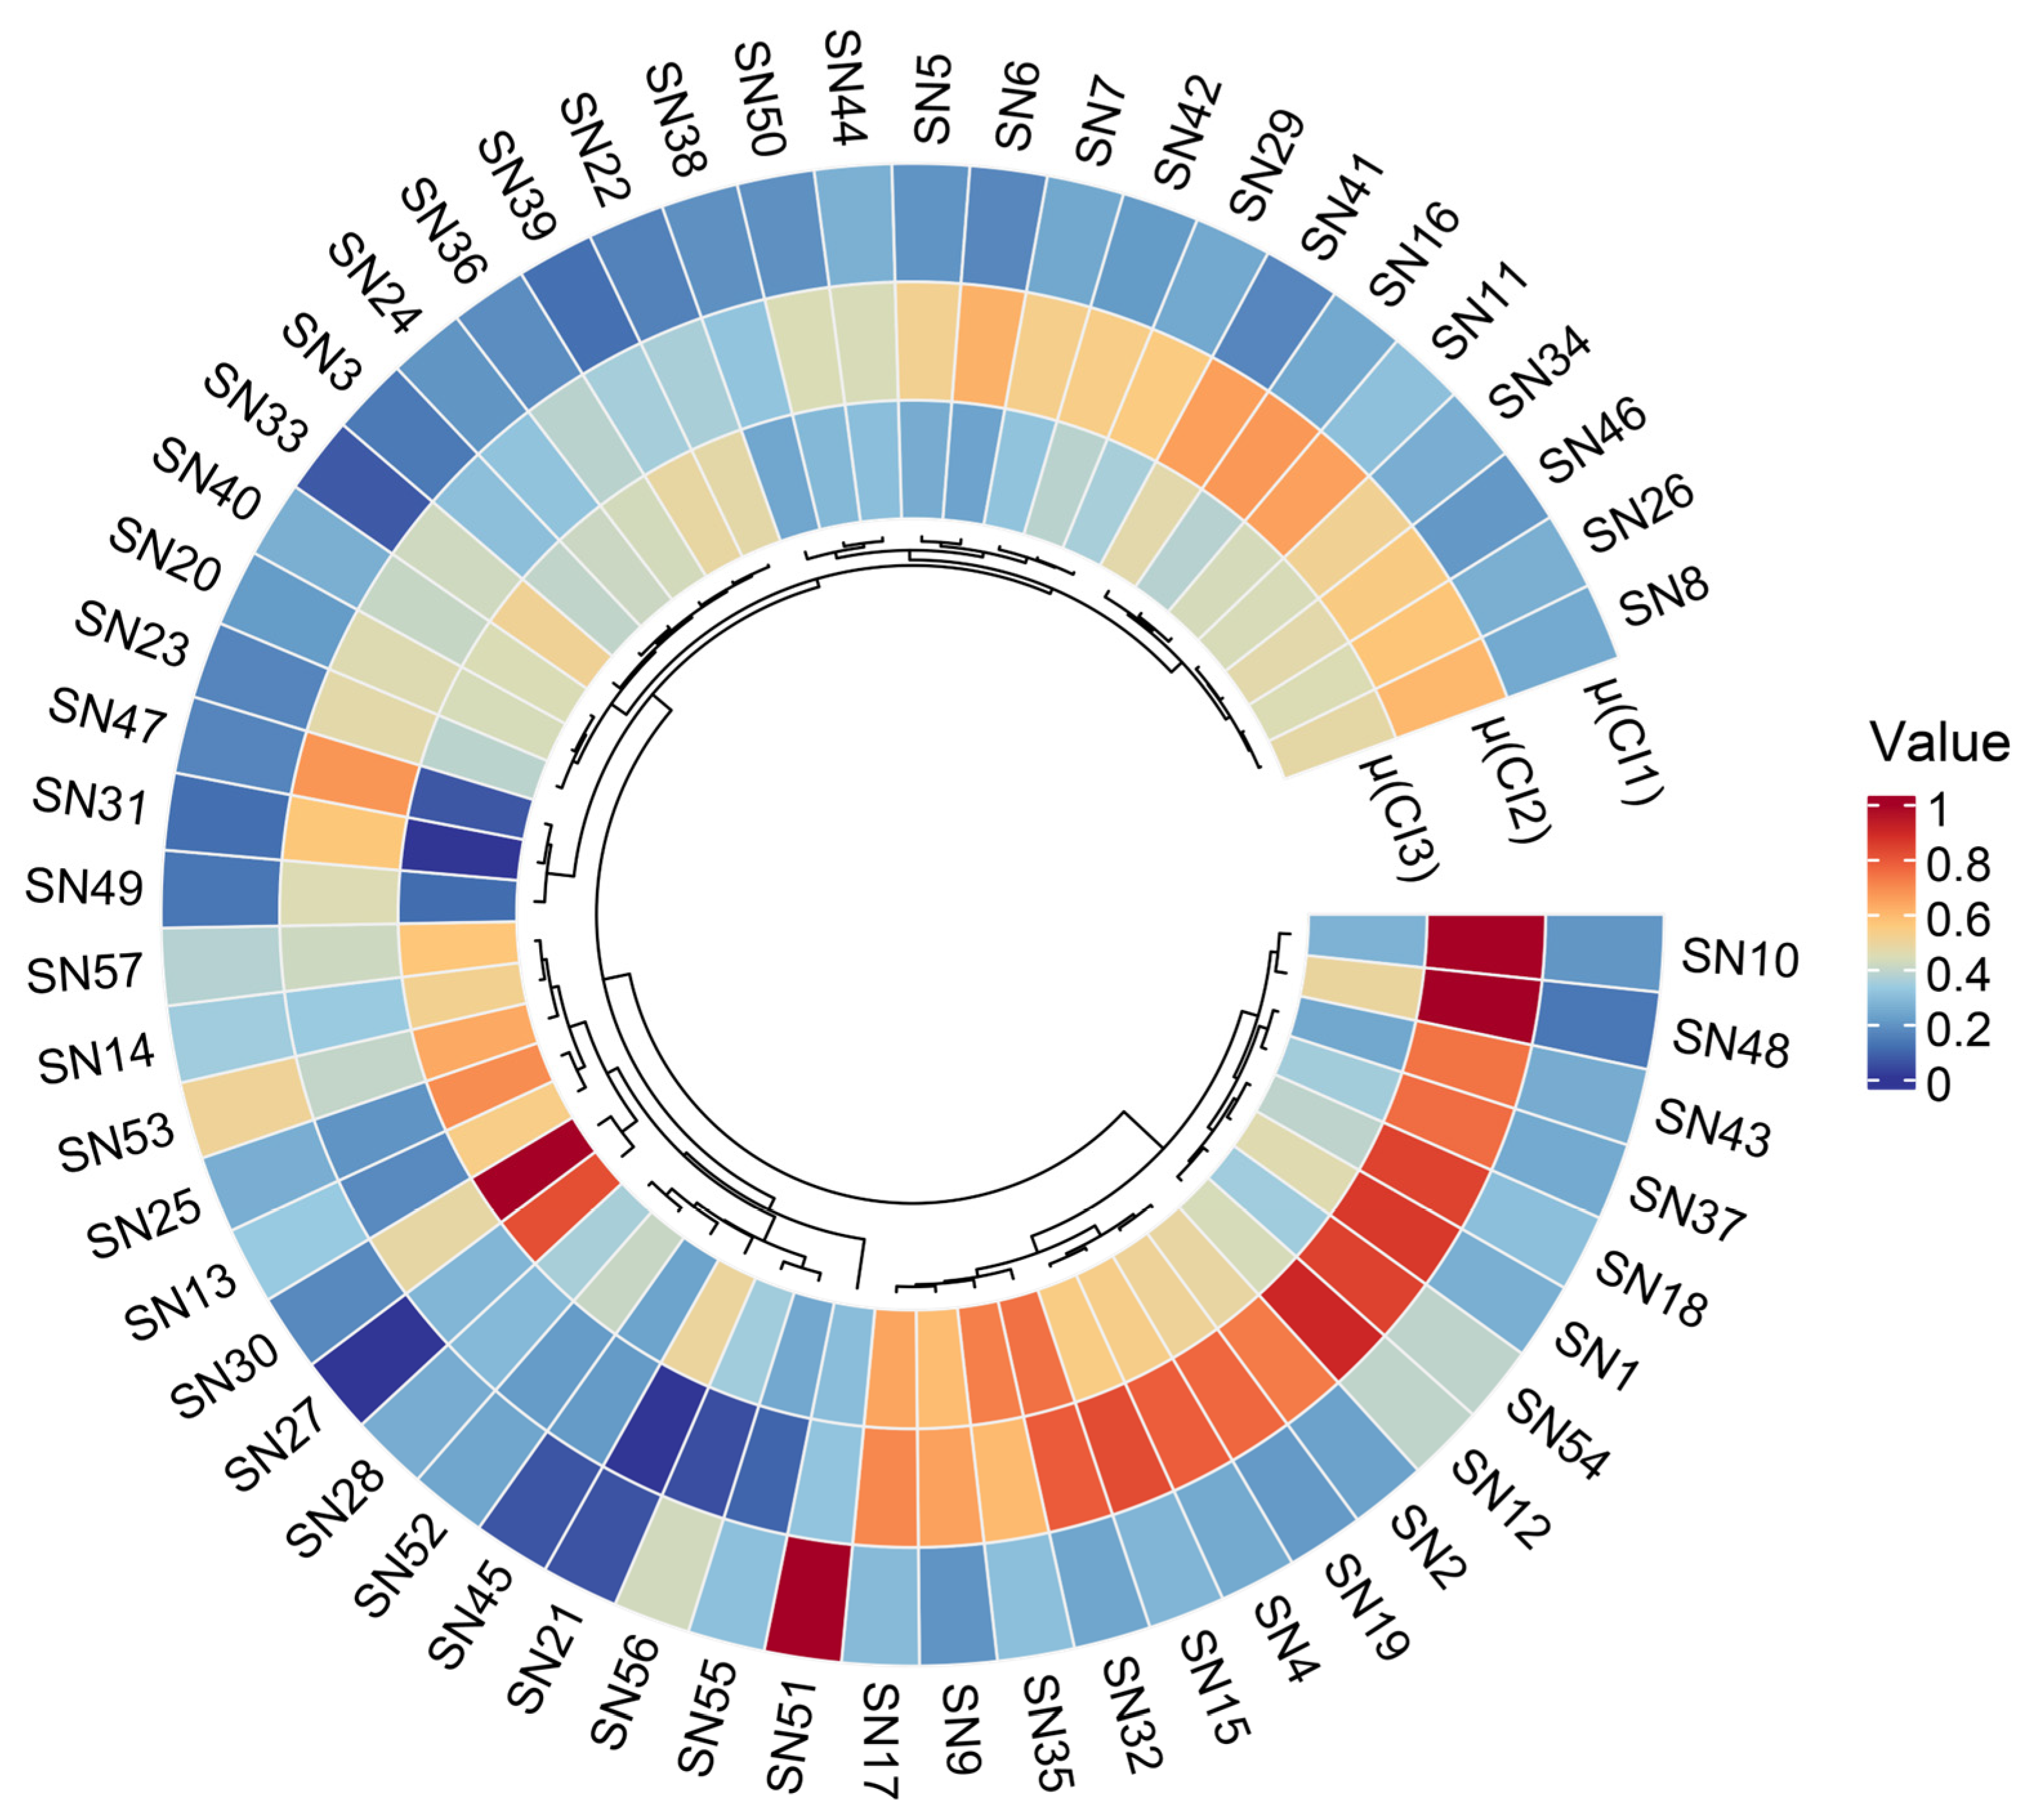
3.3.3. Comprehensive Evaluation of Peanut Cultivars under NaCl Stress in the Field

The membership function values of these three principal components were calculated according to a formula. The heatmap was plotted, and a cluster analysis was then performed. The membership function values of the same comprehensive index varied from 0.000 to 1.000. The closer the value was to 0 (tending to blue), the worse the comprehensive salt tolerance under the NaCl conditions. The closer the value was to 1 (tending to red), the higher the comprehensive salt tolerance under the NaCl conditions. For example, for SN21, the membership function value μ(CI2) of the second comprehensive index was 0.000, indicating that SN21 had the worst salt tolerance according to the second comprehensive index (Figure 7).
The comprehensive D value of each cultivar was calculated according to the weight ratio. The comprehensive salt tolerance evaluation of the 57 peanut cultivars in the field was clustered. The first group included 16 cultivars, SN1, SN2, SN4, SN9, SN10, SN12, SN15, SN17, SN18, SN19, SN32, SN35, SN37, SN43, SN48, and SN54, which were salt-tolerant cultivars, and the second group included 27 cultivars, SN3, SN5, SN6, SN7, SN8, SN11, SN16, SN20, SN22, SN23, SN24, SN26, SN29, SN31, SN33, SN34, SN36, SN38, SN39, SN40, SN41, SN42, SN44, SN46, SN47, SN49, and SN50 which were salt-sensitive cultivars. The other 14 belonged to the third category.

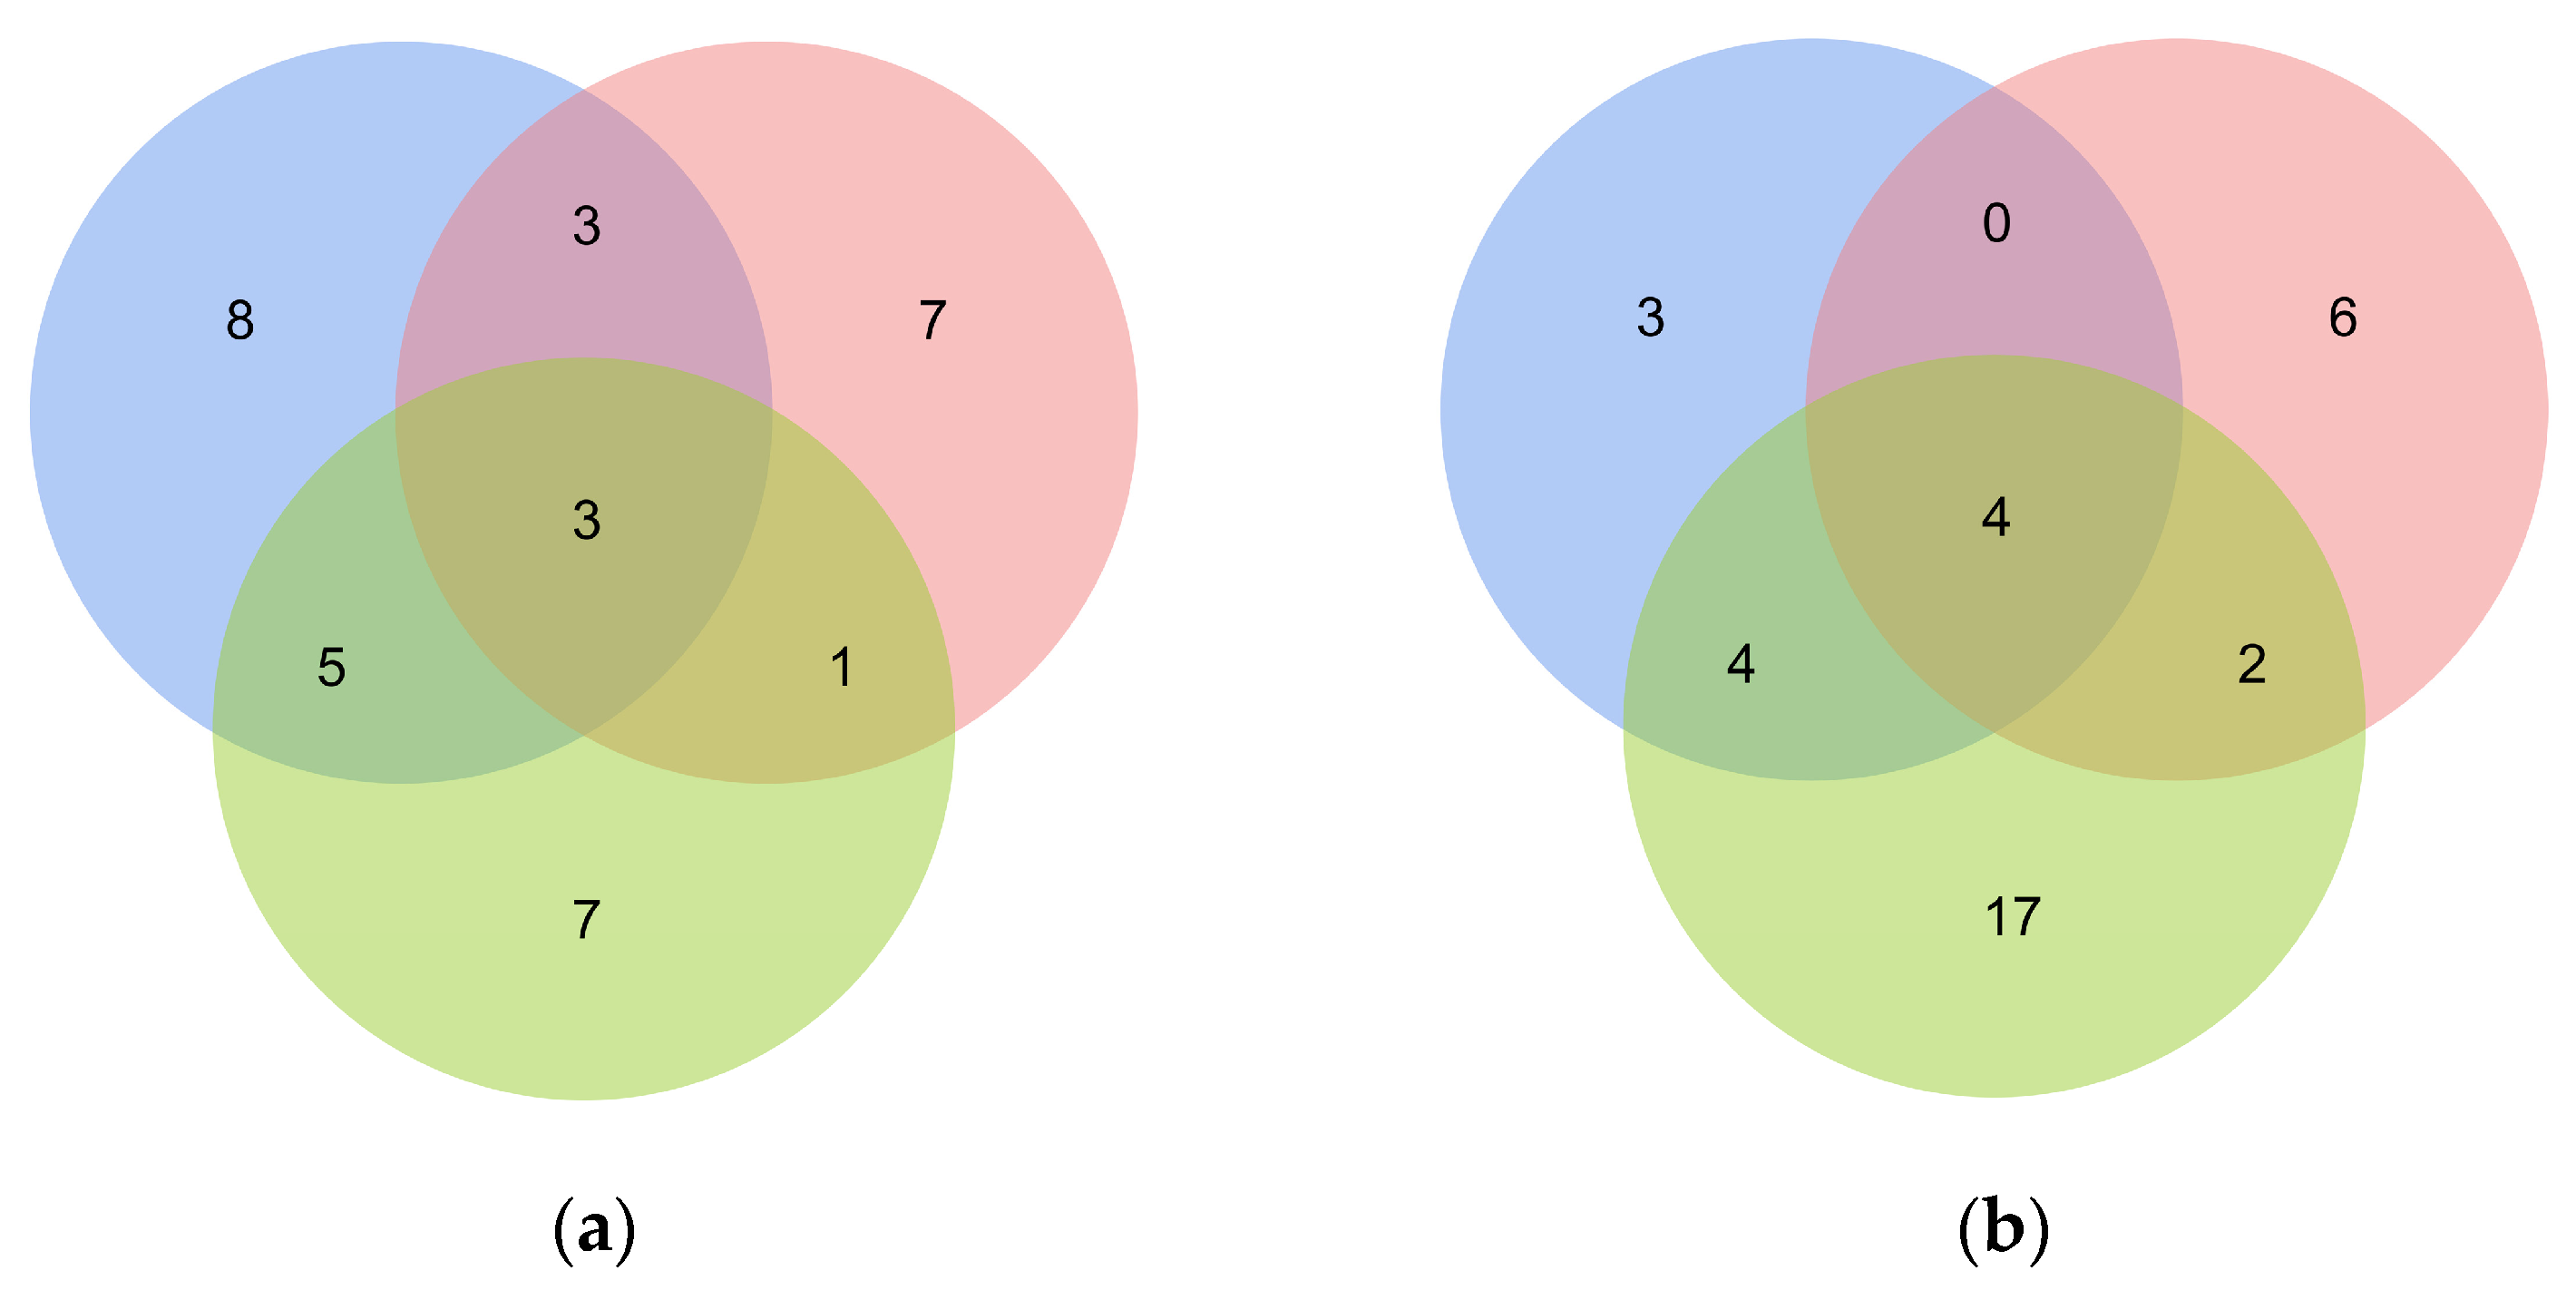
3.4. Evaluation and Comparison of Salt Tolerance of Different Peanut Cultivars at the Germination and Seedling Stages and in the Field

A Venn diagram was drawn using indoor simulation at the seedling stage, the germination stage, and natural identification in the field (Figure 8). The cultivars with the same resistance were counted. Three peanut cultivars were salt-tolerant, SN1, SN9, and SN17, in the germination stage, seedling stage, and in the field. There were four salt-sensitive peanut cultivars: SN33, SN38, SN39, and SN49. Eight peanut cultivars showed strong salt tolerance in the germination stage only, SN6, SN28, SN30, SN34, SN42, SN51, SN52, and SN55, which did not show tolerance in the seedling stage or in the field. SN5, SN22, and SN26 showed strong salt tolerance at the germination and seedling stages but did not show the same results in the field. There were 17 peanut cultivars that were salt-sensitive in the field only. There were only three and six cultivars that were salt-sensitive in the germination stage and seedling stage alone, respectively.

4. Discussion

4.1. Screening of Peanut Salt Tolerance

Seed germination, an important aspect in crop growth and development and a crucial factor in determining productivity, is severely affected by salt stress [35]. Strong salt tolerance in the germination stage lays a good foundation for later growth and development [36]. This study demonstrated a decreasing trend in the length and diameter of the hypocotyls, radicles, and dry and fresh weights of the shoots with increasing salt concentrations. At the salinity level of 50 mM NaCl, the relative shoot fresh weight was 52.807–77.047%, while at 100 mM NaCl, it ranged from 9.130% to 14.035%. These negative effects of salinity on the seed germination of legume seeds may be due to the reduction in water potential due to salinity, which in turn leads to changes in crop hormones and enzyme activities [37,38]. Previous research has shown that the inhibition of seed germination is due to an increase in seed water potential, which hinders the further absorption of water from the environment with a lower water potential [39]. This was also observed in our study. The screening of salt-tolerant cultivars during germination is particularly important. Liu et al. [40] showed that the germination characteristics of all varieties/lines were inhibited under 0.5% and 0.75% NaCl stress. In this research, as the salt concentration increased, a decreasing trend in the germination characteristics in all the cultivars was observed. The difference was significant at a 75 mM NaCl concentration. We selected this concentration as the screening concentration during the germination period. This was also the same as the concentration of NaCl used in previous studies on germination [41].
Salt stress is more severe at the germination stage, emergence stage, and seedling stage [42]. Liu et al. [40] believe that 0.5% NaCl stress leads to a more significant difference in salt tolerance among peanut cultivars at the germination stage. Ding et al. [43] took the membership function values of five traits as a comprehensive index during the germination stage under 200 mM NaCl stress to screen 23 highly salt-tolerant and 38 salt-tolerant cultivars. Moreover, the germination index showed the highest correlation with salt tolerance. Choudhary et al. [44] screened 314 wheat lines under lab conditions to evaluate their salt tolerance, determining that the root length, shoot length, fresh weight, and dry weight were the main indicators of salt tolerance at 150 and 200 mM NaCl concentrations. Du et al. [45] combined 15 phenotypic indices, a diversity analysis, a correlation analysis, a principal component analysis, and a cluster analysis to comprehensively evaluate 110 peanut landraces. There were some differences in the salt tolerance and screening concentration among the different peanut cultivars. Previous research focusing on a single evaluation index lacked objective evaluation, while others considered a single period or the whole growth period in the field. He et al. [46] combined the pot experiment with the field experiment to explore the response of 50 rapeseed varieties with different genetic backgrounds to nitrogen. The results showed two different growth patterns that developed in response to high nitrogen and low nitrogen. In other words, in the evaluation of tolerance, a single planting mode should not be chosen. This research was carried out using a combination of indoor simulation and field natural identification. The salt tolerance of peanuts was evaluated comprehensively using multivariate statistical methods. The screening results require follow-up experiments.

4.2. Evaluation Index of Peanut Salt Tolerance

Different character indices can reflect crop salt tolerance; therefore, there are many indices used to evaluate and screen crop salt tolerance. Liu et al. [40] used the germination potential, germination rate, and germination index as indices to screen the salt tolerance of peanuts during germination. The differences in the germination rate and vigor index indicated different tolerances during germination [47]. In order to eliminate differences among the basic characteristics of different cultivars, the relative germination potential, relative germination rate, relative germination index, and relative vigor index were used as screening indices to identify salt tolerance during germination. Zhang et al. [19] hypothesized that plant fresh weight, plant height, and main stem height were the best indicators of the salt tolerance of peanuts. There was no significant difference in the plant height between salt-tolerant peanuts and salt-sensitive peanuts, but the dry matter mass decreased by 37.3% and 41.6%, respectively [8]. Under salt stress, crops with large dry matter accumulation have stronger salt tolerance [48]. Salt treatment led to a significant decrease in peanut yield, and the performance of peanut cultivars with different tolerances was different. The number of pods of TG37A (salt-sensitive peanuts) and GG2 (salt-tolerant peanuts) decreased by 13% and 6%, respectively. Additionally, the 100-pod weight was 73% and 94% of that of the control, respectively, indicating that the salt-tolerant cultivars could maintain a higher yield. At the same time, the SPAD decreased significantly and the TG37A decreased more significantly after stress exposure [49]. It has been reported that the leaf gas exchange parameters and SPAD value were significantly decreased by salt stress, and the decrease was different in different cultivars [50]. This may be due to the decrease in intercellular carbon dioxide concentration (Ci) or chlorophyll degradation or enzyme activity due to partial stomatal closure [51]. In this research, nine important indices related to the salt tolerance of peanuts were determined in a field experiment. The results showed that different indices had different sensitivities to NaCl stress. Additionally, there was a significant correlation among the nine indices. An analysis of the principal components based on fewer integrated indicators can maximize the retention of information derived from more original variables, which is helpful in evaluating the salt tolerance grade more objectively and accurately [52]. In this research, the nine indices were transformed into three independent comprehensive indices via a principal component analysis, which could explain 69.32% of the phenotypic variation.

4.3. Evaluation of Peanut Salt Tolerance and Grouping of Cultivars

The evaluation of crop salt tolerance is mainly carried out to study crops’ response to salt stress in terms of their morphological, physiological, and biochemical characteristics, which means that a single index can only reflect a certain aspect. To evaluate a crop’s salt tolerance more comprehensively and accurately, a multivariate statistical analysis can be used to evaluate each evaluation method. Sivakumar et al. [53] used a principal component analysis to evaluate 13 indices of 6 tomato germplasm sources for salt tolerance. It was confirmed that the dry weight contributes more to the distinction between salt-tolerant and salt-sensitive germplasm via a principal component analysis. In recent years, the methods of correlation analysis, membership function analysis, principal component analysis, and cluster analysis have been widely used in the evaluation of the salt tolerance of rice [54], sunflowers [55], alfalfa [28], and peas [37]. In this study, there was wide genetic diversity among the tested materials, with some distinct variations observed between the cultivars. The 75 mM NaCl concentration was used as the screening concentration during the germination period, and then the relative germination rate, relative germination potential, relative germination index, and relative vigor index were calculated. The salt tolerance of the different peanut cultivars under NaCl treatment was different, so it was evaluated comprehensively. The value of the membership function was calculated and accompanied by a cluster analysis to identify salt tolerance in the germination period. According to the membership function analysis and cluster analysis of the heatmap data of the germination characteristics, the 57 peanut cultivars could be grouped into three categories. A cluster analysis is more reliable than traditional methods [56]. The salt tolerance coefficient, relative plant height, relative leaf area, relative shoot fresh and dry weight, relative root fresh and dry weight, and grade score could be used as simple and intuitive identification indices. There was a significant correlation between the grade score and the salt tolerance coefficient, which is consistent with the results of previous studies [57]. It was shown that the screening results are reliable. Then, a gray relational analysis was carried out to nondimensionalize all the salt-tolerance coefficients (STCs), and the correlation degree was calculated in order to quantify the salt tolerance of the peanut seedlings. The results of the two analysis methods were summarized to determine the cultivars that showed salt tolerance and salt sensitivity at the seedling stage.
In the field screening part of this research, the yield per plant, hundred-pod weight, hundred-grain weight, full-pod number per plant, lateral branch length, plant height, seedling emergence rate, stem dry weight, and SPAD value of each cultivar were determined, and the STCs were calculated. There were different degrees of correlation among the nine STCs. Correlations among indicators lead to an overlap of information provided by the evaluation indicators [28]. It was necessary to use multivariate statistical algorithms to further analyze the salt tolerance. Nine field characteristics were transformed into three new independent comprehensive indices to evaluate and determine the field salt tolerance of the peanut cultivars. The principal component membership function value and the comprehensive D value were calculated, which consider not only the importance of each index but also the interaction between them and thus can more accurately evaluate the salt tolerance of peanuts in the field.

5. Conclusions

It was determined that 75 mM NaCl was the most appropriate concentration for screening during peanut germination. The 57 peanut cultivars were divided into three categories based on a membership function analysis and cluster analysis. There were 11 cultivars with salt tolerance and 19 cultivars with salt sensitivity during germination. According to the salt tolerance morphological score at the seedling stage, the top 15 cultivars were determined according to those that demonstrated the highest salt tolerance at the seedling stage. A gray relational analysis was used to comprehensively evaluate the salt tolerance coefficient, and there was a significant correlation between the results and the scoring results. Finally, 14 salt-tolerant cultivars and 12 salt-sensitive cultivars were determined at the seedling stage. Additionally, three principal components were identified during the field identification process. By employing a principal component-weighted membership function and cluster analysis, a total of 16 salt-tolerant cultivars and 27 salt-sensitive cultivars were identified. Furthermore, based on the results obtained at the germination stage, seedling stage, and field identification, three peanut cultivars exhibiting salt tolerance (Nonghua 5 (SN1), Nonghua 18 (SN9), Huayu 25 (SN17)) were identified, while four peanut cultivars (Fuhua 10 (SN33), Fuhua 23 (SN38), Fuhua 24 (SN39) and Shitouqi (SN49)) were identified as salt-sensitive. The identification of these cultivars can serve as a valuable reference for breeding and improving the germplasm of salt-tolerant peanuts in Northeast China. In our next study, these selected cultivars will be utilized to investigate the underlying mechanisms involved in the response to salt stress.

Supplementary Materials

The following supporting information can be downloaded at: https://www.mdpi.com/article/10.3390/horticulturae10020147/s1, Table S1: Information on the tested peanut materials; Table S2: Relative salt tolerance coefficient of the 57 peanut cultivars at seedling stage; Table S3 Results of salt tolerance screening using two screening methods at the seedling stage. Figure S1: The methodological framework.

Author Contributions

Conceptualization, H.Y. and T.Z.; software, N.Z., Z.L. and P.G.; validation, N.Z., J.R. and B.B.; resources, H.Y.; data curation, N.Z.; writing—original draft preparation, N.Z.; writing—review and editing, H.Z., J.R., N.Z. and Z.L.; visualization, S.K. and N.Z.; supervision, H.Y.; project administration, X.Z.; funding acquisition, H.Y. All authors have read and agreed to the published version of the manuscript.

Funding

This research was supported by the earmarked fund for CARS-13.

Data Availability Statement

Data are contained within the article and supplementary materials.

Conflicts of Interest

The authors declare no conflict of interest.

References

  1. Bonku, R.; Yu, J. Health aspects of peanuts as an outcome of its chemical composition. Food Sci. Hum. Wellness 2020, 9, 21–30. [Google Scholar] [CrossRef]
  2. Zhang, C.; Selvaraj, J.N.; Yang, Q.; Liu, Y. A Survey of Aflatoxin-Producing Aspergillus sp. from Peanut Field Soils in Four Agroecological Zones of China. Toxins 2017, 9, 40. [Google Scholar] [CrossRef]
  3. Huang, R.; Xiao, D.; Wang, X.; Zhan, J.; Wang, A.; He, L. Genome-wide identification, evolutionary and expression analyses of LEA gene family in peanut (Arachis hypogaea L.). BMC Plant Biol. 2022, 22, 155. [Google Scholar] [CrossRef] [PubMed]
  4. Patel, J.; Khandwal, D.; Choudhary, B.; Ardeshana, D.; Jha, R.K.; Tanna, B.; Yadav, S.; Mishra, A.; Varshney, R.K.; Siddique, K.H.M. Differential Physio-Biochemical and Metabolic Responses of Peanut (Arachis hypogaea L.) under Multiple Abiotic Stress Conditions. Int. J. Mol. Sci. 2022, 23, 660. [Google Scholar] [CrossRef] [PubMed]
  5. Liang, S.; Wang, S.; Zhou, L.; Sun, S.; Zhang, J.; Zhuang, L. Combination of Biochar and Functional Bacteria Drives the Ecological Improvement of Saline-Alkali Soil. Plants 2023, 12, 284. [Google Scholar] [CrossRef] [PubMed]
  6. Zhao, S.; Zhang, Q.; Liu, M.; Zhou, H.; Ma, C.; Wang, P. Regulation of Plant Responses to Salt Stress. Int. J. Mol. Sci. 2021, 22, 4609. [Google Scholar] [CrossRef] [PubMed]
  7. Zhang, X.; Yang, F.; Ma, H.; Li, J. Evaluation of the Saline-Alkaline Tolerance of Rice (Oryza sativa L.) Mutants Induced by Heavy-Ion Beam Mutagenesis. Biology 2022, 11, 126. [Google Scholar] [CrossRef] [PubMed]
  8. Shi, X.; Zhao, X.; Ren, J.; Dong, J.; Zhang, H.; Dong, Q.; Jiang, C.; Zhong, C.; Zhou, Y.; Yu, H. Influence of Peanut, Sorghum, and Soil Salinity on Microbial Community Composition in Interspecific Interaction Zone. Front. Microbiol. 2021, 12, 678250. [Google Scholar] [CrossRef] [PubMed]
  9. Zeeshan, M.; Lu, M.; Naz, S.; Sehar, S.; Cao, F.; Wu, F. Resemblance and Difference of Seedling Metabolic and Transporter Gene Expression in High Tolerance Wheat and Barley Cultivars in Response to Salinity Stress. Plants 2020, 9, 519. [Google Scholar] [CrossRef] [PubMed]
  10. Razzaq, A.; Saleem, F.; Wani, S.H.; Abdelmohsen, S.A.M.; Alyousef, H.A.; Abdelbacki, A.M.M.; Alkallas, F.H.; Tamam, N.; Elansary, H.O. De-novo Domestication for Improving Salt Tolerance in Crops. Front. Plant Sci. 2021, 12, 681367. [Google Scholar] [CrossRef] [PubMed]
  11. Liang, X.; Li, J.; Yang, Y.; Jiang, C.; Guo, Y. Designing salt stress-resilient crops: Current progress and future challenges. J. Integr. Plant Biol. 2023. Online ahead of print. [Google Scholar] [CrossRef] [PubMed]
  12. Chugh, V.; Kaur, D.; Purwar, S.; Kaushik, P.; Sharma, V.; Kumar, H.; Rai, A.; Singh, C.M.; Kamaluddin; Dubey, R.B. Applications of Molecular Markers for Developing Abiotic-Stress-Resilient Oilseed Crops. Life 2022, 13, 88. [Google Scholar] [CrossRef]
  13. Ertiro, B.T.; Olsen, M.; Das, B.; Gowda, M.; Labuschagne, M. Genetic Dissection of Grain Yield and Agronomic Traits in Maize under Optimum and Low-Nitrogen Stressed Environments. Int. J. Mol. Sci. 2020, 21, 543. [Google Scholar] [CrossRef] [PubMed]
  14. Lu, Q.; Yu, X.; Wang, H.; Yu, Z.; Zhang, X.; Zhao, Y. Quantitative trait locus mapping for important yield traits of a sorghum-sudangrass hybrid using a high-density single nucleotide polymorphism map. Front. Plant Sci. 2022, 13, 1098605. [Google Scholar] [CrossRef] [PubMed]
  15. Chinnusamy, V.; Jagendorf, A.; Zhu, J. Understanding and Improving Salt Tolerance in Plants. Crop Sci. 2005, 45, 437–448. [Google Scholar] [CrossRef]
  16. Quan, R.; Wang, J.; Hui, J.; Bai, H.; Lyu, X.; Zhu, Y.; Zhang, H.; Zhang, Z.; Li, S.; Huang, R. Improvement of Salt Tolerance Using Wild Rice Genes. Front. Plant Sci. 2018, 8, 2269. [Google Scholar] [CrossRef] [PubMed]
  17. Wang, Z.; Chen, Z.; Cheng, J.; Lai, Y.; Wang, J.; Bao, Y.; Huang, J.; Zhang, H. QTL analysis of Na+ and K+ concentrations in roots and shoots under different levels of NaCl stress in rice (Oryza sativa L.). PLoS ONE 2012, 7, e51202. [Google Scholar] [CrossRef] [PubMed]
  18. Duan, Q.; Zhu, Z.; Wang, B.; Chen, M. Recent Progress on the Salt Tolerance Mechanisms and Application of Tamarisk. Int. J. Mol. Sci. 2022, 23, 3325. [Google Scholar] [CrossRef]
  19. Lu, P.; Magwanga, R.O.; Kirungu, J.N.; Hu, Y.; Dong, Q.; Cai, X.; Zhou, Z.; Wang, X.; Zhang, Z.; Hou, Y.; et al. Overexpression of Cotton a DTX/MATE Gene Enhances Drought, Salt, and Cold Stress Tolerance in Transgenic Arabidopsis. Front. Plant Sci. 2019, 10, 299. [Google Scholar] [CrossRef]
  20. Zhang, X.; Cheng, Z.; Yao, W.; Gao, Y.; Fan, G.; Guo, Q.; Zhou, B.; Jiang, T. Overexpression of PagERF072 from Poplar Improves Salt Tolerance. Int. J. Mol. Sci. 2022, 23, 10707. [Google Scholar] [CrossRef]
  21. Hamwieh, A.; Xu, D. Conserved salt tolerance quantitative trait locus (QTL) in wild and cultivated soybeans. Breed. Sci. 2008, 58, 355–359. [Google Scholar] [CrossRef]
  22. Li, D.; Dossa, K.; Zhang, Y.; Wei, X.; Wang, L.; Zhang, Y.; Liu, A.; Zhou, R.; Zhang, X. GWAS Uncovers Differential Genetic Bases for Drought and Salt Tolerances in Sesame at the Germination Stage. Genes 2018, 9, 87. [Google Scholar] [CrossRef] [PubMed]
  23. Zhang, Y.; Zhang, Q.; Wang, H.; Tao, S.; Cao, H.; Shi, Y.; Bakirov, A.; Xu, A.; Huang, Z. Discovery of common loci and candidate genes for controlling salt-alkali tolerance and yield-related traits in Brassica napus L. Plant Cell Rep. 2023, 42, 1039–1057. [Google Scholar] [CrossRef] [PubMed]
  24. Liu, P.; Zhu, Y.; Liu, H.; Liang, Z.; Zhang, M.; Zou, C.; Yuan, G.; Gao, S.; Pan, G.; Shen, Y.; et al. A Combination of a Genome-Wide Association Study and a Transcriptome Analysis Reveals circRNAs as New Regulators Involved in the Response to Salt Stress in Maize. Int. J. Mol. Sci. 2022, 23, 9755. [Google Scholar] [CrossRef] [PubMed]
  25. Tsiupka, V.; Tsiupka, S.; Plugatar, Y.; Bulavin, I.; Komar-Tyomnaya, L. Assessment of the Drought-Tolerance Criteria for Screening Peach Cultivars. Horticulturae 2023, 9, 1045. [Google Scholar] [CrossRef]
  26. Hussain, M.I.; Muscolo, A.; Ahmed, M.; Asghar, M.A.; Al-Dakheel8, A.J. Agro-Morphological, Yield and Quality Traits and Interrelationship with Yield Stability in Quinoa (Chenopodium quinoa Willd.) Genotypes under Saline Marginal Environment. Plants 2020, 9, 1763. [Google Scholar] [CrossRef] [PubMed]
  27. Alam, M.S.; Tester, M.; Fiene, G.; Mousa, M.A.A. Early Growth Stage Characterization and the Biochemical Responses for Salinity Stress in Tomato. Plants 2021, 10, 712. [Google Scholar] [CrossRef] [PubMed]
  28. Yu, R.; Wang, G.; Yu, X.; Li, L.; Li, C.; Song, Y.; Xu, Z.; Zhang, J.; Guan, C. Assessing alfalfa (Medicago sativa L.) tolerance to salinity at seedling stage and screening of the salinity tolerance traits. Plant Biol. Stuttg. 2021, 23, 664–674. [Google Scholar] [CrossRef]
  29. Fu, B.; Liang, J.; Zhang, M.; Zhao, M.; Ji, X.; Wang, J. Influence of Genotypic and Environmental Factors on Tobacco Leaves Based on Metabolomics. Life 2022, 12, 590. [Google Scholar] [CrossRef]
  30. Xu, T.; Meng, S.; Zhu, X.; Di, J.; Zhu, Y.; Yang, X.; Yan, W. Integrated GWAS and transcriptomic analysis reveal the candidate salt-responding genes regulating Na+/K+ balance in barley (Hordeum vulgare L.). Front. Plant Sci. 2022, 13, 1004477. [Google Scholar] [CrossRef]
  31. Gustafsson, C.; Willforss, J.; Lopes-Pinto, F.; Ortiz, R.; Geleta, M. Identification of genes regulating traits targeted for domestication of field cress (Lepidium campestre) as a biennial and perennial oilseed crop. BMC Genom. 2018, 19, 36. [Google Scholar] [CrossRef] [PubMed]
  32. Laksana, C.; Sophiphun, O.; Chanprame, S. In vitro and in vivo screening for the identification of salt-tolerant sugarcane (Saccharum officinarum L.) clones: Molecular, biochemical, and physiological responses to salt stress. Saudi J. Biol. Sci. 2023, 30, 103655. [Google Scholar] [CrossRef] [PubMed]
  33. Hussain, N.; Ghaffar, A.; Zafar, Z.U.; Javed, M.; Shah, K.H.; Noreen, S.; Manzoor, H.; Iqbal, M.; Hassan, I.F.Z.; Bano, H.; et al. Identification of novel source of salt tolerance in local bread wheat germplasm using morpho-physiological and biochemical attributes. Sci. Rep. 2021, 11, 10854. [Google Scholar] [CrossRef] [PubMed]
  34. Ahn, J.; Oh, S.; Kang, Y.J.; Kim, K.; Moon, S.-K.; Moon, B.; Myung, S.; Kim, M.-S.; Lee, Y.K.; Ko, K. Effect of Oak Tree Sawdust Fermentation Period on Peanut Seed Germination, Seedling Biomass, and Morphology. Horticulturae 2021, 7, 182. [Google Scholar] [CrossRef]
  35. Wang, H.; Li, Z.; Ren, H.; Zhang, C.; Xiao, D.; Li, Y.; Hou, X.; Liu, T. Regulatory interaction of BcWRKY33A and BcHSFA4A promotes salt tolerance in non-heading Chinese cabbage [Brassica campestris (syn. Brassica rapa) ssp. chinensis]. Hort. Res. 2022, 9, uhac113. [Google Scholar] [CrossRef] [PubMed]
  36. Trejo-Téllez, L.I. Salinity Stress Tolerance in Plants. Plants 2023, 12, 3520. [Google Scholar] [CrossRef] [PubMed]
  37. Grozeva, S.; Kalapchieva, S.; Tringovska, I. In Vitro Screening for Salinity Tolerance in Garden Pea (Pisum sativum L.). Horticulturae 2023, 9, 338. [Google Scholar] [CrossRef]
  38. Khosravi, Z.; Pourmohammad, A.; Aliloo, A.-A.; Shahabivand, S.; Hassanpouraghdam, M.B.; Topcu, H. In vitro salinity stress mediates grass pea genotypes’ (Lathyrus sativus L.) responses. Turk. J. Agric. For. 2022, 46, 340–351. [Google Scholar] [CrossRef]
  39. Tokarz, B.; Wójtowicz, T.; Makowski, W.; Jędrzejczyk, R.J.; Tokarz, K.M. What is the Difference between the Response of Grass Pea (Lathyrus sativus L.) to Salinity and Drought Stress?—A Physiological Study. Agronomy 2020, 10, 833. [Google Scholar] [CrossRef]
  40. Liu, Y.; Shen, Y.; Chen, Z.; Wang, Z.; Yan, W. Identification of salt tolerance in peanut varieties/lines at the germination stage. Chin. J. Oil Crop Sci. 2012, 34, 168–173. [Google Scholar]
  41. Hoai, P.T.T.; Qiu, J.; Groszmann, M.; Rosa, A.D.; Tyerman, S.D.; Byrt, C.S. Arabidopsis plasma membrane intrinsic protein (AtPIP2;1) is implicated in a salinity conditional influence on seed germination. Funct. Plant Biol. 2023, 50, 633–648. [Google Scholar] [CrossRef] [PubMed]
  42. He, Y.; Yang, B.; He, Y.; Zhan, C.; Cheng, Y.; Zhang, J.; Zhang, H.; Cheng, J.; Wang, Z. A quantitative trait locus, qSE3, promotes seed germination and seedling establishment under salinity stress in rice. Plant J. 2019, 97, 1089–1104. [Google Scholar] [CrossRef] [PubMed]
  43. Ding, T.; Yang, Z.; Wei, X.; Yuan, F.; Yin, S.; Wang, B. Evaluation of salt-tolerant germplasm and screening of the salt-tolerance traits of sweet sorghum in the germination stage. Funct. Plant Biol. 2018, 45, 1073–1081. [Google Scholar] [CrossRef] [PubMed]
  44. Choudhary, A.; Kaur, N.; Sharma, A.; Kumar, A. Evaluation and screening of elite wheat germplasm for salinity stress at the seedling phase. Physiol. Plant 2021, 173, 2207–2215. [Google Scholar] [CrossRef] [PubMed]
  45. Puxuan, D.; Jun, L.; Ronghua, C.; Rouxian, W.; Chenggen, F.; Dandan, G.; Qing, L. Systematic Collection, Identification and Evaluation of Peanut Germplasm Resources in Guangdong Province. Plant Genet. Resour. 2023, 24, 671–679. [Google Scholar] [CrossRef]
  46. He, H.; Chen, B.; Yang, R.; Li, Y.; Ma, A.; Cao, L.; Wu, X.; Tian, H.; Gao, Y. Genotypic Variation in Nitrogen Utilization Efficiency of Oilseed Rape (Brassica napus) Under Contrasting N Supply in Pot and Field Experiments. Front. Plant Sci. 2017, 8, 1825. [Google Scholar] [CrossRef] [PubMed]
  47. Kunene, S.; Odindo, A.O.; Gerrano, A.S.; Mandizvo, T. Screening Bambara Groundnut (Vigna subterranea L. Verdc) Genotypes for Drought Tolerance at the Germination Stage under Simulated Drought Conditions. Plants 2022, 11, 3562. [Google Scholar] [CrossRef] [PubMed]
  48. Wang, C.; Han, G.; Qiao, Z.; Li, Y.; Yang, Z.; Wang, B. Root Na+ Content Negatively Correlated to Salt Tolerance Determines the Salt Tolerance of Brassica napus L. Inbred Seedlings. Plants 2022, 11, 906. [Google Scholar] [CrossRef]
  49. Chakraborty, K.; Bhaduri, D.; Meena, H.N.; Kalariya, K. External potassium K+ application improves salinity tolerance by promoting Na+-exclusion, K+-accumulation and osmotic adjustment in contrasting peanut cultivars. Plant Physiol. Biochem. 2016, 103, 143–153. [Google Scholar] [CrossRef]
  50. Kumar, A.; Sheoran, P.; Mann, A.; Yadav, D.; Kumar, A.; Devi, S.; Kumar, N.; Dhansu, P.; Sharma, D.K. Deciphering trait associated morpho-physiological responses in pearlmillet hybrids and inbred lines under salt stress. Front. Plant Sci. 2023, 14, 1121805. [Google Scholar] [CrossRef]
  51. Kumar, A.; Sharma, C.L.; Kumar, P.; Devi, R.; Singh, K.; SL, K.; Kulshreshtha, N.; Yadav, R.K.; Sharma, S.K. Salinity and drought induced changes in gas exchange attributes and chlorophyll fluorescence characteristics of rice (Oryza sativa) varieties. Indian J. Agric. Sci. 2016, 86, 718–726. [Google Scholar] [CrossRef]
  52. Gu, H.; Huan, C.; Yang, F. Spatiotemporal Dynamics of Ecological Vulnerability and Its Influencing Factors in Shenyang City of China: Based on SRP Model. Int. J. Environ. Res. Public Health 2023, 20, 1525. [Google Scholar] [CrossRef] [PubMed]
  53. Sivakumar, J.; Prashanth, J.E.P.; Rajesh, N.; Reddy, S.M.; Pinjari, O.B. Principal component analysis approach for comprehensive screening of salt stress-tolerant tomato germplasm at the seedling stage. J. Biosci. 2020, 45, 141. [Google Scholar] [CrossRef] [PubMed]
  54. Chunthaburee, S.; Dongsansuk, A.; Sanitchon, J.; Pattanagul, W.; Theerakulpisut, P. Physiological and biochemical parameters for evaluation and clustering of rice cultivars differing in salt tolerance at seedling stage. Saudi J. Biol. Sci. 2016, 23, 467–477. [Google Scholar] [CrossRef] [PubMed]
  55. Li, W.; Zhang, H.; Zeng, Y.; Xiang, L.; Lei, Z.; Huang, Q.; Li, T.; Shen, F.; Cheng, Q. A Salt Tolerance Evaluation Method for Sunflower (Helianthus annuus L.) at the Seed Germination Stage. Sci. Rep. 2020, 10, 10626. [Google Scholar] [CrossRef] [PubMed]
  56. Han, B.; Ma, X.; Cui, D.; Wang, Y.; Geng, L.; Cao, G.; Zhang, H.; Han, L. Comprehensive Evaluation and Analysis of the Mechanism of Cold Tolerance Based on the Transcriptome of Weedy Rice Seedlings. Rice 2020, 13, 12. [Google Scholar] [CrossRef] [PubMed]
  57. Wang, W.; Zhao, Y.; Wang, W.; Xu, K.; Niu, L.; Yu, L.; Zou, J.W.; Wang, Z.; Zhang, Y.J.; Wang, F.; et al. Evaluation of Salt Tolerance Mechanism and Study on Salt Tolerance Relationship of Different Salt-Tolerant Wheat Varieties. Comput. Intell. Neurosci. 2022, 2022, 2395568. [Google Scholar] [CrossRef]
Figure 1. Air temperature and precipitation in the growing season of intercropping in 2021 and 2022. PRCP, precipitation; TAVG, average temperature of hourly values; TMIN, minimum temperature; TMAX, maximum temperature.
Horticulturae 10 00147 g001
Figure 2. Morphological indices of peanut germination at different NaCl concentrations. (a) Hypocotyl length; (b) hypocotyl diameter; (c) free weight of shoot; (d) radicle length; (e) radicle diameter; (f) dry weight of shoot. Different lowercase letters indicate significant (p < 0.05) differences among the four treatment concentrations for the same cultivar. The different colored columns represent different cultivars chosen at random. A, cultivar; B, concentration. ns indicates no significant difference. * and ** indicate significant differences at p = 0.05 and 0.01, respectively.
Horticulturae 10 00147 g002
Figure 3. Clustering heat map and membership function of germination characteristics. μ is the membership function value of a single index, ×1 is the relative germination potential, ×2 is the relative germination rate, ×3 is the relative germination index, and ×4 is the relative vigor index. The column chart on the right represents the average membership function value (D value).
Horticulturae 10 00147 g003
Figure 4. Lollipop chart of salt tolerance grade under NaCl stress of 57 peanut cultivars at the seedling stage and their morphological characteristics.
Horticulturae 10 00147 g004
Figure 5. Correlation analysis and frequency distribution histogram at the seedling stage for phenotypes of 57 peanut cultivars under NaCl stress. RPH, relative plant height; RLA, relative leaf area; RSFW, relative shoot fresh weight; RRFW, relative root fresh weight; RSDW, relative shoot dry weight; RRDW, relative root dry weight. The diagonal graphs are histograms of the frequency distribution. The abscissa represents the relative value, the ordinate represents the frequency of each group, and the black solid line in the figure represents the normal distribution curve. *, **, and *** indicate significant differences at the p = 0.05, 0.01, and 0.001 levels, respectively.
Horticulturae 10 00147 g005
Figure 6. Correlation analysis of field traits of 57 peanut cultivars under NaCl stress. ×1, relative yield per plant; ×2, relative hundred-pod weight; ×3, relative hundred-grain weight; ×4, relative full-pod number per plant; ×5, relative lateral branch length; ×6, relative plant height; ×7, relative seedling emergence rate; ×8, relative stem dry weight; ×9, relative SPAD. Red line indicates a positive correlation, blue line indicates a negative correlation; solid line indicates p < 0.05; dashed lines indicate p >= 0.05.
Horticulturae 10 00147 g006
Figure 7. Clustering heat map of membership function of the field index of 57 peanut cultivars. μ is the membership function value.
Horticulturae 10 00147 g007
Figure 8. Venn diagram of salt tolerance screening results at different growth stages. (a) Salt tolerance; (b) salt sensitivity. Different colors represent different growth stages: blue, germination stage; pink, seedling stage; green, in the field.
Horticulturae 10 00147 g008
Table 1. Criteria for determining morphological grade of salt-tolerant peanut seedlings.
LevelPlant Morphological Description
1Seedlings grew normally and had no symptoms of salt injury
2Seedling growth was normal; only one leaf showed slight chlorosis
3Seedling growth was slightly inhibited, with 10% chlorosis of seedling leaves
430% chlorosis of seedling leaves
560% chlorosis of seedling leaves
6The leaf tips of seedlings were withered and yellow
7Seedlings leaves were completely withered or curled
8Whole plant was dead or near death
Table 2. Germination characteristics of 57 peanut cultivars under NaCl stress.
IndicatorRelative Germination RateRelative Germination PotentialRelative Germination IndexRelative Vigor Index
Max1.0001.0000.8830.876
Min0.7100.4490.4450.122
Mean0.9420.8380.7460.360
CV (%)6.70115.66111.82637.797
Table 3. GCD of STCs of 57 peanut cultivars under NaCl stress.
CultivarGCDOrderCultivarGCDOrderCultivarGCDOrder
SN10.50774SN200.407625SN390.385053
SN20.401134SN210.48886SN400.409824
SN30.436313SN220.50755SN410.412321
SN40.46958SN230.53613SN420.385451
SN50.433314SN240.402930SN430.430116
SN60.410223SN250.406726SN440.392342
SN70.442012SN260.44969SN450.395441
SN80.48137SN270.385850SN460.412620
SN90.432215SN280.420017SN470.383055
SN100.404729SN290.64711SN480.402532
SN110.447810SN300.385052SN490.381957
SN120.390144SN310.396739SN500.382456
SN130.388747SN320.395540SN510.389345
SN140.411622SN330.389146SN520.398437
SN150.383254SN340.447211SN530.386248
SN160.399436SN350.397638SN540.400735
SN170.60832SN360.401733SN550.386049
SN180.405927SN370.405628SN560.417019
SN190.402731SN380.390943SN570.418218
Table 4. Agronomic characteristics and yield characteristics of 57 peanut cultivars under NaCl stress 1.
Indicator×1×2×3×4×5×6×7×8×9
Max0.9520.9880.9700.9721.0781.1761.0341.2311.060
Min0.1110.3980.4130.2390.4760.4620.3000.3210.757
Mean0.4800.6520.6520.7130.7650.7750.7480.7760.924
CV (%)36.60518.12317.67426.44419.44620.00323.76324.7326.042
1 ×1, relative yield per plant; ×2, relative hundred-pod weight; ×3, relative hundred-grain weight; ×4, relative full-pod number per plant; ×5, relative lateral branch length; ×6, relative plant height; ×7, relative seedling emergence rate; ×8, relative stem dry weight; ×9, relative SPAD.
Table 5. Eigenvectors, contribution rates, and weights of principal components of field traits 2.
Principle Factor CI1CI2CI3
Eigenvalue 3.2951.8921.052
Contribution ratio (%) 36.61221.02011.690
Cumulative contribution ratio (%) 36.61257.63269.323
Eigenvector×10.9580.1320.056
×20.931−0.079−0.015
×30.8330.0490.023
×40.5390.4890.142
×50.1810.9320.033
×60.0400.920−0.105
×7−0.1960.327−0.226
×80.127−0.0410.861
×9−0.460−0.0600.498
2 ×1, relative yield per plant; ×2, relative hundred-pod weight; ×3, relative hundred-grain weight; ×4, relative full-pod number per plant; ×5, relative lateral branch length; ×6, relative plant height; ×7, relative seedling emergence rate; ×8, relative stem dry weight; ×9, relative SPAD.
Disclaimer/Publisher’s Note: The statements, opinions and data contained in all publications are solely those of the individual author(s) and contributor(s) and not of MDPI and/or the editor(s). MDPI and/or the editor(s) disclaim responsibility for any injury to people or property resulting from any ideas, methods, instructions or products referred to in the content.

