Article

Development and Evaluation of a New Spectral Index to Detect Peanut Southern Blight Disease Using Canopy Hyperspectral Reflectance

1
College of Information and Management Science, Henan Agricultural University, Zhengzhou 450046, China
2
Peanut Research Institute, Henan Academy of Agricultural Sciences, Zhengzhou 450002, China
3
School of Mathematical Sciences, East China Normal University, Shanghai 200241, China
*
Authors to whom correspondence should be addressed.
Horticulturae 2024, 10(2), 128; https://doi.org/10.3390/horticulturae10020128
Submission received: 18 December 2023 / Revised: 24 January 2024 / Accepted: 25 January 2024 / Published: 30 January 2024

Abstract

:
Peanut southern blight is a soil-borne fungal disease caused by Agroathelia rolfsii (syn. Sclerotium rolfsii) Sacc, which seriously affects peanut yield. The disease mainly affects the stem, pod, and root of the plant, and it is difficult to detect the disease by visual interpretation. Detecting peanut southern blight using existing technology is an urgent problem that needs to be solved. To address this issue, field experiments were conducted in September 2022 to determine whether hyperspectral techniques could be used to assess the severity of peanut southern blight. In this study, we obtained 610 canopy-scale spectral data through field experiments. Firstly, 18 traditional spectral features were calculated. Then, wavelengths of 544 nm, 678 nm, and 769 nm were selected as sensitive by the Relief-F algorithm, and the NDSISB and NSISB were constructed using normalization and ratio calculation methods. Finally, Support Vector Machine (SVM), Light Gradient Boosting Machine (LightGBM), Categorical Boosting (CatBoost), and ANN were used to evaluate the diagnostic ability of all spectral features to assess disease severity levels. The results showed that the NSISB had the highest association with peanut southern blight (R2 = 0.817), exceeding the other spectral features. Compared to the other three models, CatBoost demonstrated superior accuracy, with an overall accuracy (OA) and Kappa coefficient of 84.18% and 78.31%, respectively. The findings of this study can serve as a reference for estimating the severity levels of peanut southern blight using ground-based hyperspectral data.

1. Introduction

Peanut (Arachis hypogaea L.) is an essential economic and oilseed crop worldwide [1], and China is the largest peanut producer [2]. Peanut soil-borne fungal diseases are one of the disastrous factors limiting peanut yield, which seriously threatens the quality of peanuts and the safety of agricultural products [3]. Peanut southern blight is a soil-borne fungal disease caused by Agroathelia rolfsii Sacc [4], substantially affecting peanut yields and prevalent in the major peanut-growing regions of China. This disease significantly impacts both the yield and quality of peanuts. After infection, peanut southern blight generally results in a reduction of yield in the range of 10% to 25% in most areas. However, in severely affected regions, it may exceed 80%. In certain circumstances, crops may fail to produce any harvest at all [5,6].
At present, few peanut varieties and germplasms are resistant to Agroathelia rolfsii Sacc, and breeding for disease-resistant peanuts usually takes a long time. In contrast, chemical control has the characteristics of fast action and convenient operation and is the main means for the management of peanut southern blight [7]. However, the indiscriminate spraying of fungicides can lead to unnecessary resource wastage and environmental pollution. Traditional methods of crop disease survey not only consume time and manpower but may also result in mechanical damage to crops [8,9,10]. Consequently, the real-time and efficacious surveillance and mitigation of peanut southern blight have attained escalating significance.
In recent years, hyperspectral remote sensing technology has been utilized for detecting various crop diseases, including potato late blight disease [11], verticillium wilt [12], and wheat powdery mildew [13]. At present, hyperspectral (narrowband) reflectance has been proven to be crucial for providing additional information, and spectroscopy has been proven to be an effective means of detecting nutrient, water, and disease stress [14,15,16]. The reflection and absorption characteristics of narrowbands are related to specific crop characteristics, such as plant chemistry [17], leaf structure, water content [18], and plant ecological and physical states [19]. The narrowband can measure the exact characteristic absorption peaks of plant pigments, providing better information related to plant health [20]. However, hyperspectral data contain hundreds of narrowband data points, but adjacent wavelength information is often highly correlated, so the use of full band information only increases the complexity of data collection and calculation [21]. Usually, the most effective information is only contained in certain specific frequency bands, while the rest is redundant information [22].
A vegetation index is an effective method commonly used in the field of optical remote sensing to reflect changes in plant physiological and biochemical parameters [23]. This indicator is a simple and effective spectral data processing method that combines some characteristic bands in a certain mathematical form. This method greatly eliminates the redundancy of hyperspectral data; requires less computation; and is widely used to estimate changes in crop yield [10], pigment content [24], canopy structure [25], and water status [26]. Several previous studies have constructed spectral indices for identifying and detecting crop diseases for disease detection using sensitive bands for a particular disease. Some examples include wheat leaf rust [27], wheat yellow rust [28], wheat powdery mildew [29], and maize dwarf mosaic virus [30]. The first-order differential processing technique is an effective means to eliminate or attenuate the influence of soil and atmosphere on the target spectrum. It has been applied to the study of spectral features of different crops, for example, corn canopy blight disease [31] and rice sheath blight [32].
These research results indicate that spectral indices calculated through spectral reflectance at special wavelength positions have high potential for application in the field of crop diseases and pests. Hence, we hope to develop a more comprehensive spectral index to achieve the severity detection of peanut southern blight. Therefore, this study was conducted using the ASD Field Spec3 feature spectrometer to collect canopy spectral data at various disease severity levels of peanut southern blight. The main objectives of this study were as follows: (1) analyzing the spectral response characteristics of different disease severity levels, (2) using the Relief-F algorithm to select the most suitable feature wavelength for recognizing peanut southern blight, and (3) constructing a new spectral index NSISB and comparing it with traditional spectral indices to evaluate the accuracy of the NSISB.

2. Materials and Methods

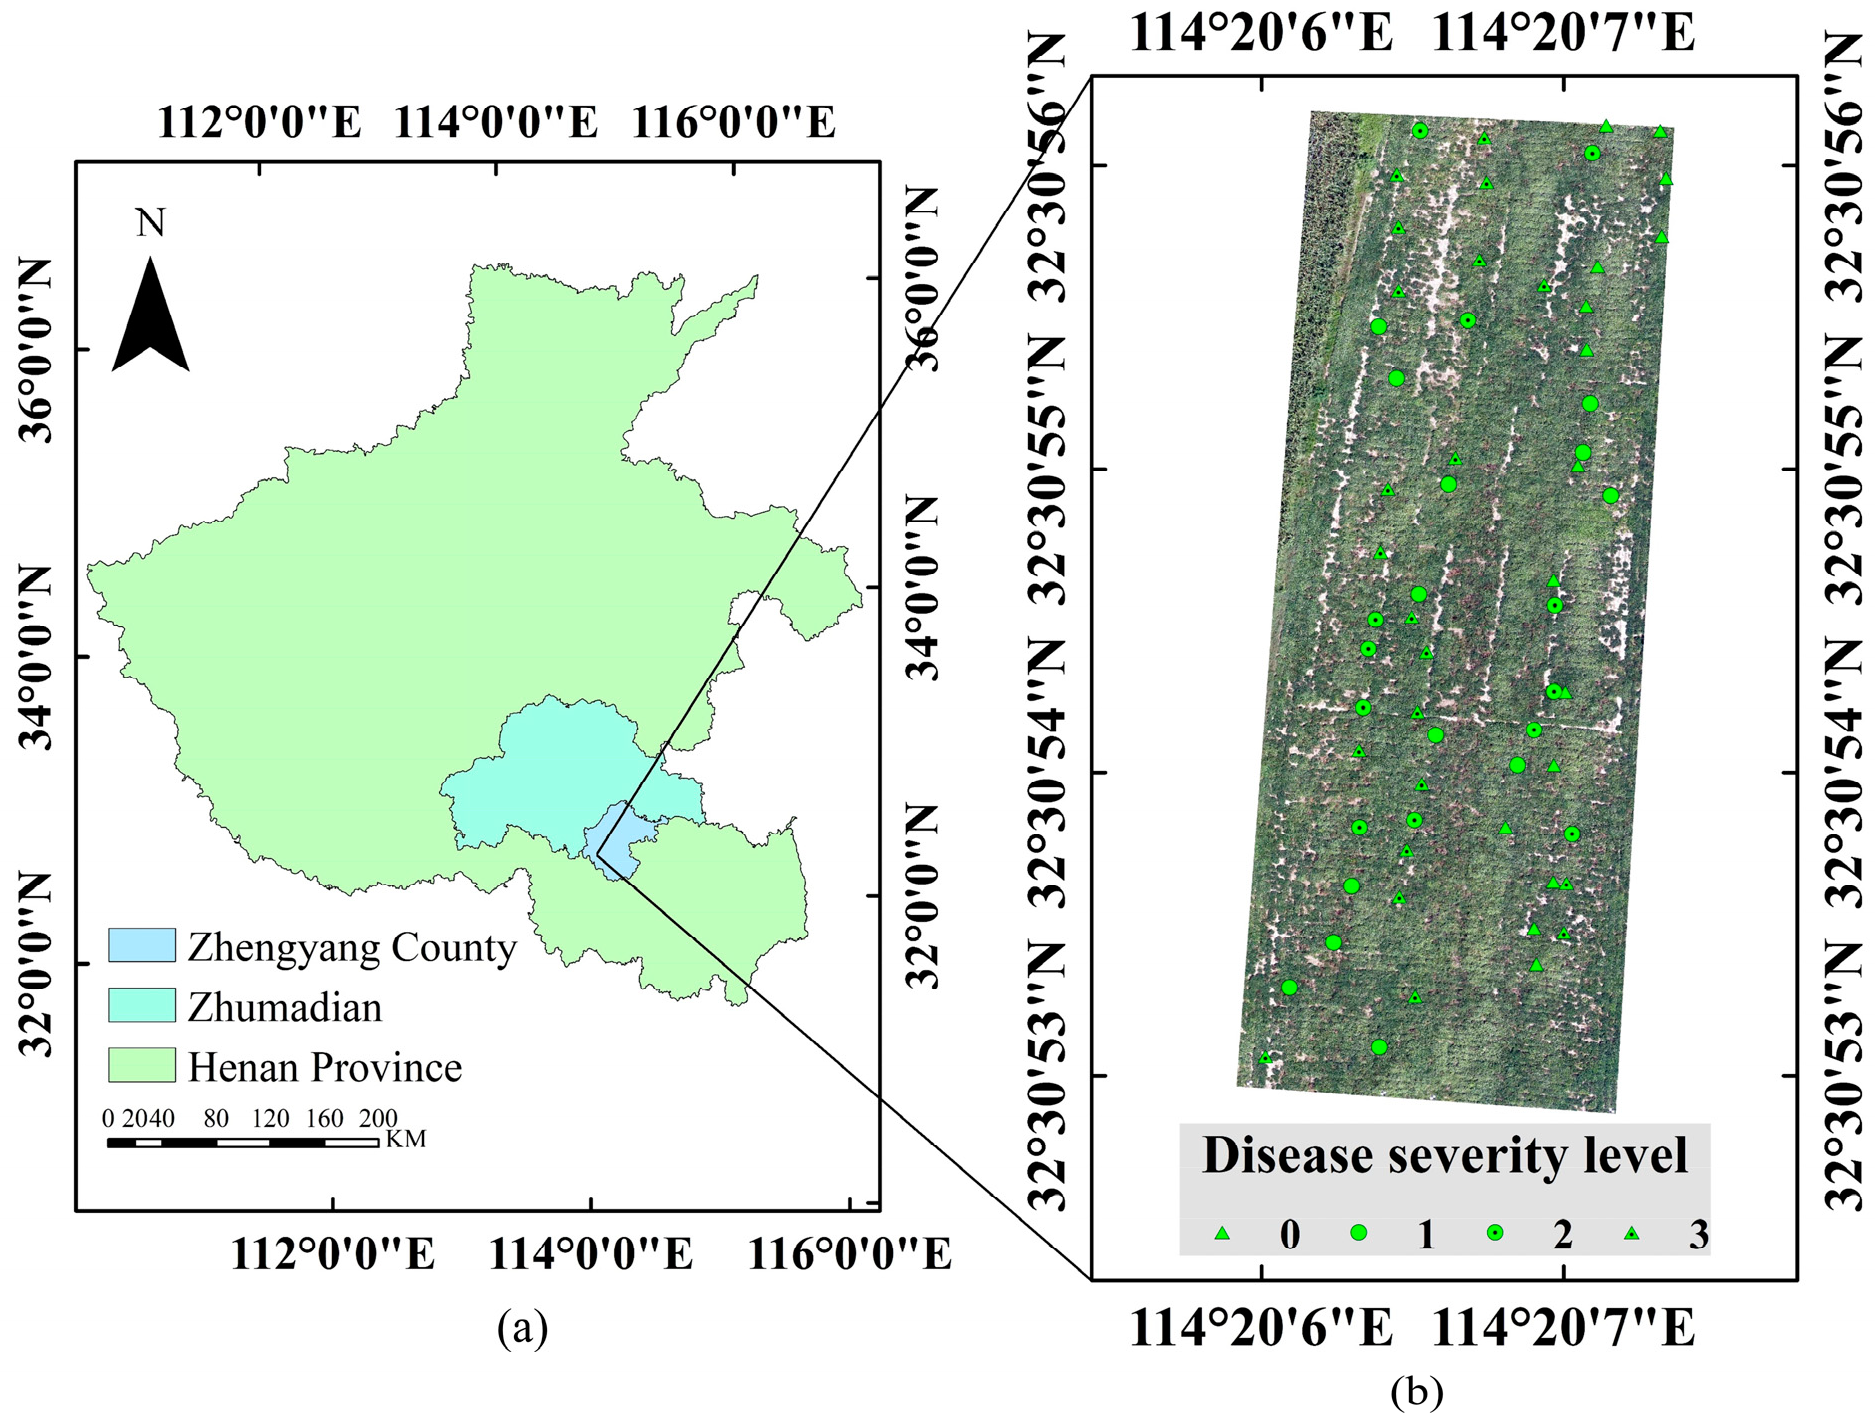
2.1. Overview of the Experiment Site

The experimental site was located in Zhengyang County, Zhumadian City, Henan Province, China (32°60′ N,114°38′ E), as shown in Figure 1. The experimental peanut variety was Yuhua 37, planted on 24 June 2022, with a row spacing of 45 cm and a plant spacing of 35 cm. Local agronomic practices were followed for weed control, pest management, and disease prevention. Naturally occurring peanut southern blight was present throughout the test field. For this experiment, a total of 61 ground survey sample points were selected. The data was collected on 6 September 2022, and finally, 610 peanut canopy hyperspectral data were obtained.

2.2. Data Collection

2.2.1. Disease Severity Assessment

The disease severity level is a qualitative description of the severity of peanut southern blight infesting peanut plants. He et al. [33] used a 0–9 rating scale to record the severity of the peanut southern blight disease, as shown in Table 1. Considering the complexity of the field environment, we have developed more suitable standards based on the existing grading standards as follows.

2.2.2. Canopy Spectral Collection

In this study, the spectral measurements were conducted using an ASD Field Spec3 geophysical spectrometer accompanied by a plant probe. The canopy spectra were collected in the wavelength range of 350 to 2500 nm, with sampling intervals of 1.4 nm (350 to 1000 nm) and 2 nm (1001 to 2500 nm). Resampling intervals of 1 nm were used, and the instrument had a field of view of 25°. The canopy spectra were measured in clear and windless weather, and the measurement time was from 10:00 to 14:00. To ensure the accuracy of the spectral data, a standard white plate was used to calibrate the instrument before each measurement. The probe was placed vertically downward at 50 cm above the canopy during the measurement. Representative plants were selected within each investigation sample point, and 10 consecutive spectral data readings were collected.
During the collection of spectral data from all the samples, it was observed that the data beyond 1350 nm in the spectral curves exhibited a high level of noise. For the purpose of the subsequent analyses, the data beyond 1350 nm were excluded from this study. Therefore, the raw data mentioned later in this article specifically refer to the spectral range of 350 to 1350 nm. Furthermore, during the data analysis process, two anomalous sample points were identified. As a result, these two data points were eliminated from the dataset. After their removal, a total of 590 non-imaging hyperspectral data of peanut canopy remained for further analysis. The number of samples with different disease severity levels is shown in Table 2.
The measurement data for the four severity levels are shown in Figure 2 [34]. As easily noticeable, there are notable differences in the data across different disease severity levels. It is particularly noteworthy that the difference between healthy plants and those severely infected plants is significant.

2.3. Relief-F Algorithm

The Relief-F algorithm is an extension of Kononenko’s Relief algorithm and can be used to solve multiple classification and regression problems [35]. The basic principle of the Relief-F algorithm is as follows:
(a)
Initialization: Randomly select a sample i from the training set and calculate the distance between it and the k nearest similar samples and the k nearest dissimilar samples.
(b)
For each feature t , calculate its corresponding weight W t , in which W t denotes the average of the distance difference between adjacent similar samples and adjacent dissimilar samples calculated by feature t . The formula is as follows:
W t = j s a m e 1 k · d i f f i , j j d i f f 1 k · d i f f i , j
where j s a m e denotes the adjacent samples belonging to the same category as sample i , j d i f f denotes the adjacent samples belonging to different categories from sample i , k denotes the number of adjacent samples of the same kind and adjacent samples of different kinds, and d i f f i , j denotes the contribution of feature t to the distance between sample i and sample j .
(c)
Rank the features according to the calculated weights and select the top k important features.
In this study, the Relief-F algorithm was employed to calculate the feature weights. Subsequently, the wavelength associated with the peak weight within the specified local range was determined as the sensitive wavelength [36]. Finally, these sensitive wavelengths were utilized to construct spectral indices through various wavelength combinations.

2.4. Construction of the Hyperspectral Index

In this study, the hyperspectral index of peanut southern blight was constructed using the sensitive wavelengths obtained after Relief-F selection in which the NSISB was adjusted based on the original calculation formula. The formula is as follows [37,38]:
N D S I S B = R i R j R i + R j + R i R k R i + R k
N S I S B = R i + R k R j
where i , j , and k are the sensitive wavelengths used to construct hyperspectral indices of peanut southern blight after Relief-F selection in order of importance.

2.5. Extraction of the Spectral Features

Furthermore, in this study, a total of nine vegetation indices and nine first-order differential spectral features were calculated. The detailed information on each spectral feature is presented in Table 3.

2.6. Classification Methods

In this study, the dataset was randomly divided into training and test sets at a ratio of 7:3, and the SVM, LightGBM, CatBoost, and ANN were used to assess disease severity levels.
Support Vector Machine (SVM) is a classic supervised learning algorithm originally proposed by Vapnik and Cortes in 1995 [49] and mainly used in classification and regression problems. The main idea of the SVM algorithm is to classify data by constructing the optimal classification hyperplane. When SVM is looking for a classification hyperplane, it maps the data into a high-dimensional space and finds a classification hyperplane that maximizes the distance between categories (Margin), thereby realizing the classification task. The implementation process of SVM includes steps such as data preprocessing, kernel function selection, determination of the hyperplane parameters, and calculation of the support vectors. The advantages of SVM include good generalization performance, effective processing of high-dimensional data and nonlinear data, excellent performance for small sample data, and easy optimization.
Light Gradient Boosting Machine (LightGBM) is an efficient gradient boosting framework for solving classification and regression problems in machine learning. It is based on the Gradient Boosting Decision Tree (GBDT) algorithm. First proposed by Ke et al. [50] in 2017, LightGBM employs an efficient histogram-based algorithm to handle the discretization of features, thus improving the training speed of the model. LightGBM also uses a sampling strategy called “Gradient-based One-Side Sampling (GOSS)” to reduce the computational cost of the training process by retaining samples with large gradients. It also supports parallelized training and the processing of large datasets with a low memory footprint.
CatBoost Categorical Boosting (CatBoost) is a GBDT framework with fewer parameters, support for categorical variables, and high accuracy based on symmetric decision trees (oblivious trees) as the base learner, which is especially suitable for processing data with categorical features. CatBoost, first proposed by Prokhorenkova in 2017 [51], has an adaptive feature transformation that can directly process classification features without additional preprocessing. CatBoost also employs an optimization algorithm called “Ordered Boosting”, which exploits the ordinal information of the feature values to improve the accuracy of the model. In addition, CatBoost solves the problem of Gradient Bias and Prediction shift to reduce the occurrence of overfitting, thus improving the accuracy and generalization of the algorithm.
Artificial neural networks are designed based on the research results of biological neural networks and are a system composed of many simple processing units that work in parallel. Artificial neural networks have enormous potential in information processing [52]. The model consists of three fully connected layers, namely the input layer, hidden layer, and output layer. Among them, both the input layer and the hidden layer contain 64 neurons, and the activation function is ReLU. The output layer contains four neurons with an activation function of Softmax. The model uses the Adam optimizer with a learning rate of 0.001. The epoch value of the model is set to 1000.
Grid Search was used to a perform the parameter search for the SVM, LightGBM, and CatBoost algorithms. Grid Search is widely recognized as one of the most commonly used hyperparameter optimization techniques [53]. It efficiently determines the best combination of hyperparameters by systematically traversing all possible combinations and evaluating their performance using cross-validation. By extensively exploring the hyperparameter space, Grid Search effectively enhances the model’s accuracy and generalization.
Where C, kernel, and gamma in the parameter table were selected for SVM, n_estimators and learning_rate in the parameter table were selected for LightGBM, and iterations and learning_rate in the parameter table were selected for CatBoost.

2.7. Evaluation Indicators

In this study, the overall accuracy (OA) and Kappa coefficient were used to evaluate the ability of spectral features to detect peanut southern blight. Each of these indicators can be calculated based on true positives (TP), true negatives (TN), false positives (FP), and false negatives (FN), as shown in Table 4. The specific formulas for OA and Kappa are as follows:
O A = T P + T N T P + T N + F P + F N
K a p p a = O A i = 1 n a i · b i N 2 1 i = 1 n a i · b i N 2
where a i denotes the number of samples in which their actual label is the i category, b i denotes the number of samples in which the predicted label is the i category, N is the total number of samples, and n is the total number of categories.

3. Results

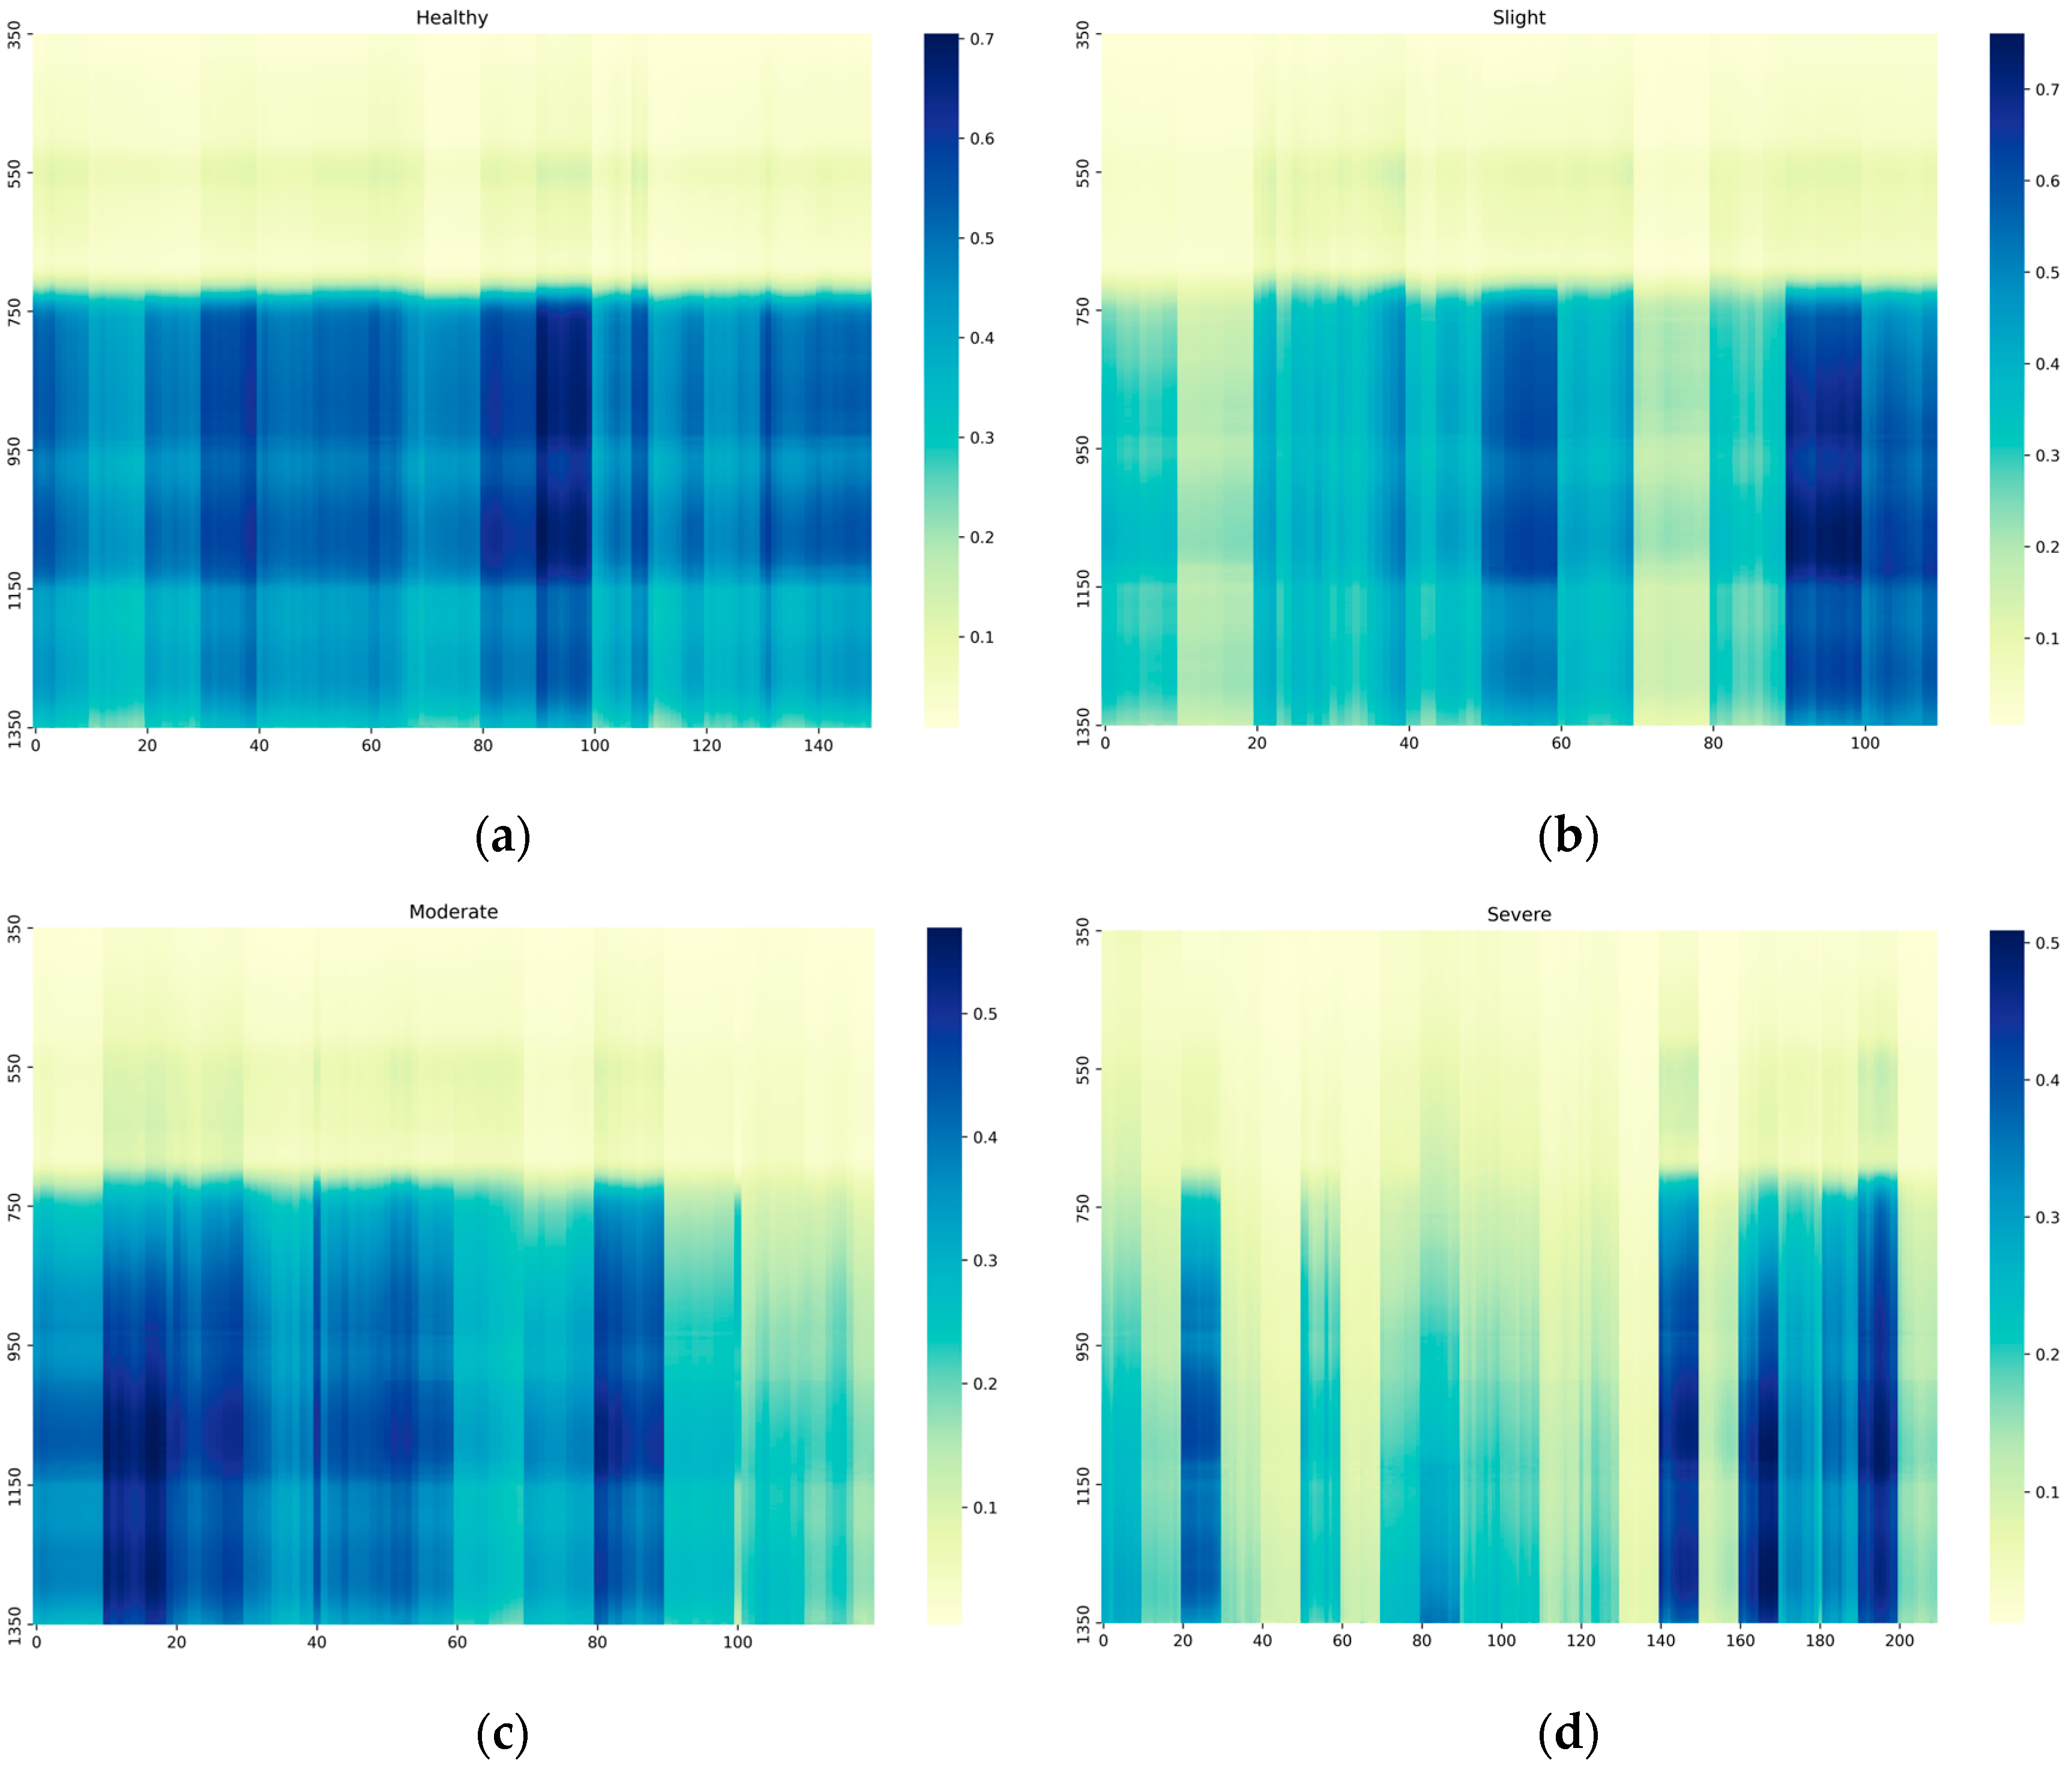
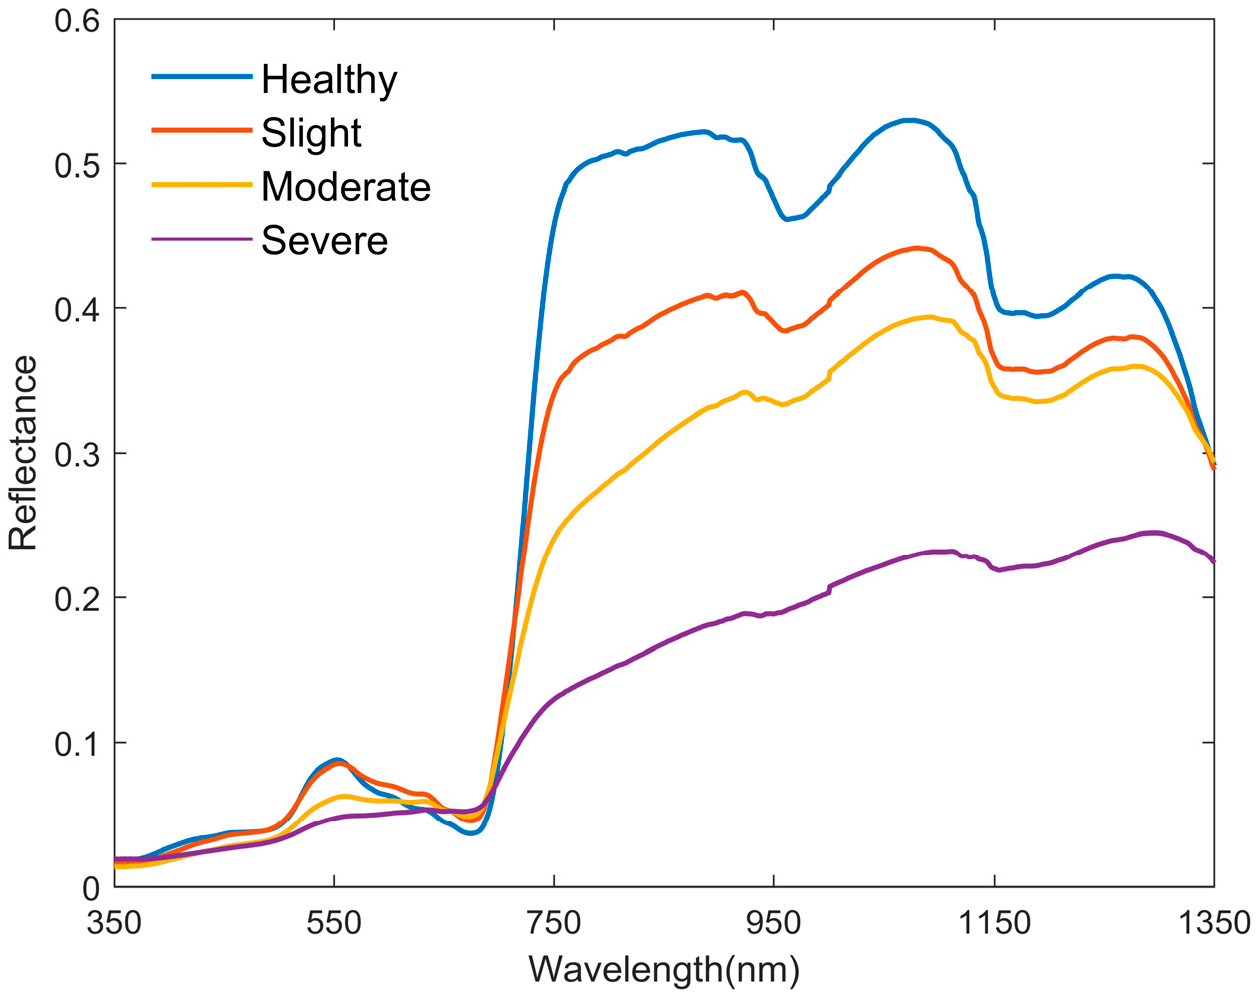
3.1. Original Spectral Characterization Analysis under Pathogen Stress

In the visible wavelength range, a healthy peanut canopy spectral curve exhibits obvious “green peak” (around 550 nm) and “red valley” (around 670 nm) features, as shown in Figure 3. As the severity increases, these features in the band curve tend to level off, and eventually, they almost disappear. The reflectance around 700 nm begins to sharply increase, forming a “red edge” phenomenon, which is the most obvious feature of plant curves and a key focus when studying spectral regions. In the near-infrared band, the spectral curve formed a highly reflective plateau due to multiple scattering, and two moisture-affected absorption bands existed near 950 nm and near 1100 nm. As the severity levels increased, the curve in the band where the absorption band was located similarly leveled off, and finally, the features almost disappeared. The disappearance of these features may be related to differences in the pigment and water content in mesophyll tissue [54]. The obvious differences in the spectral characteristics mentioned above provide an important optical basis for analyzing and constructing the relationship between the spectral indices and the severity of peanut southern blight.

3.2. Extraction of the Spectral Features

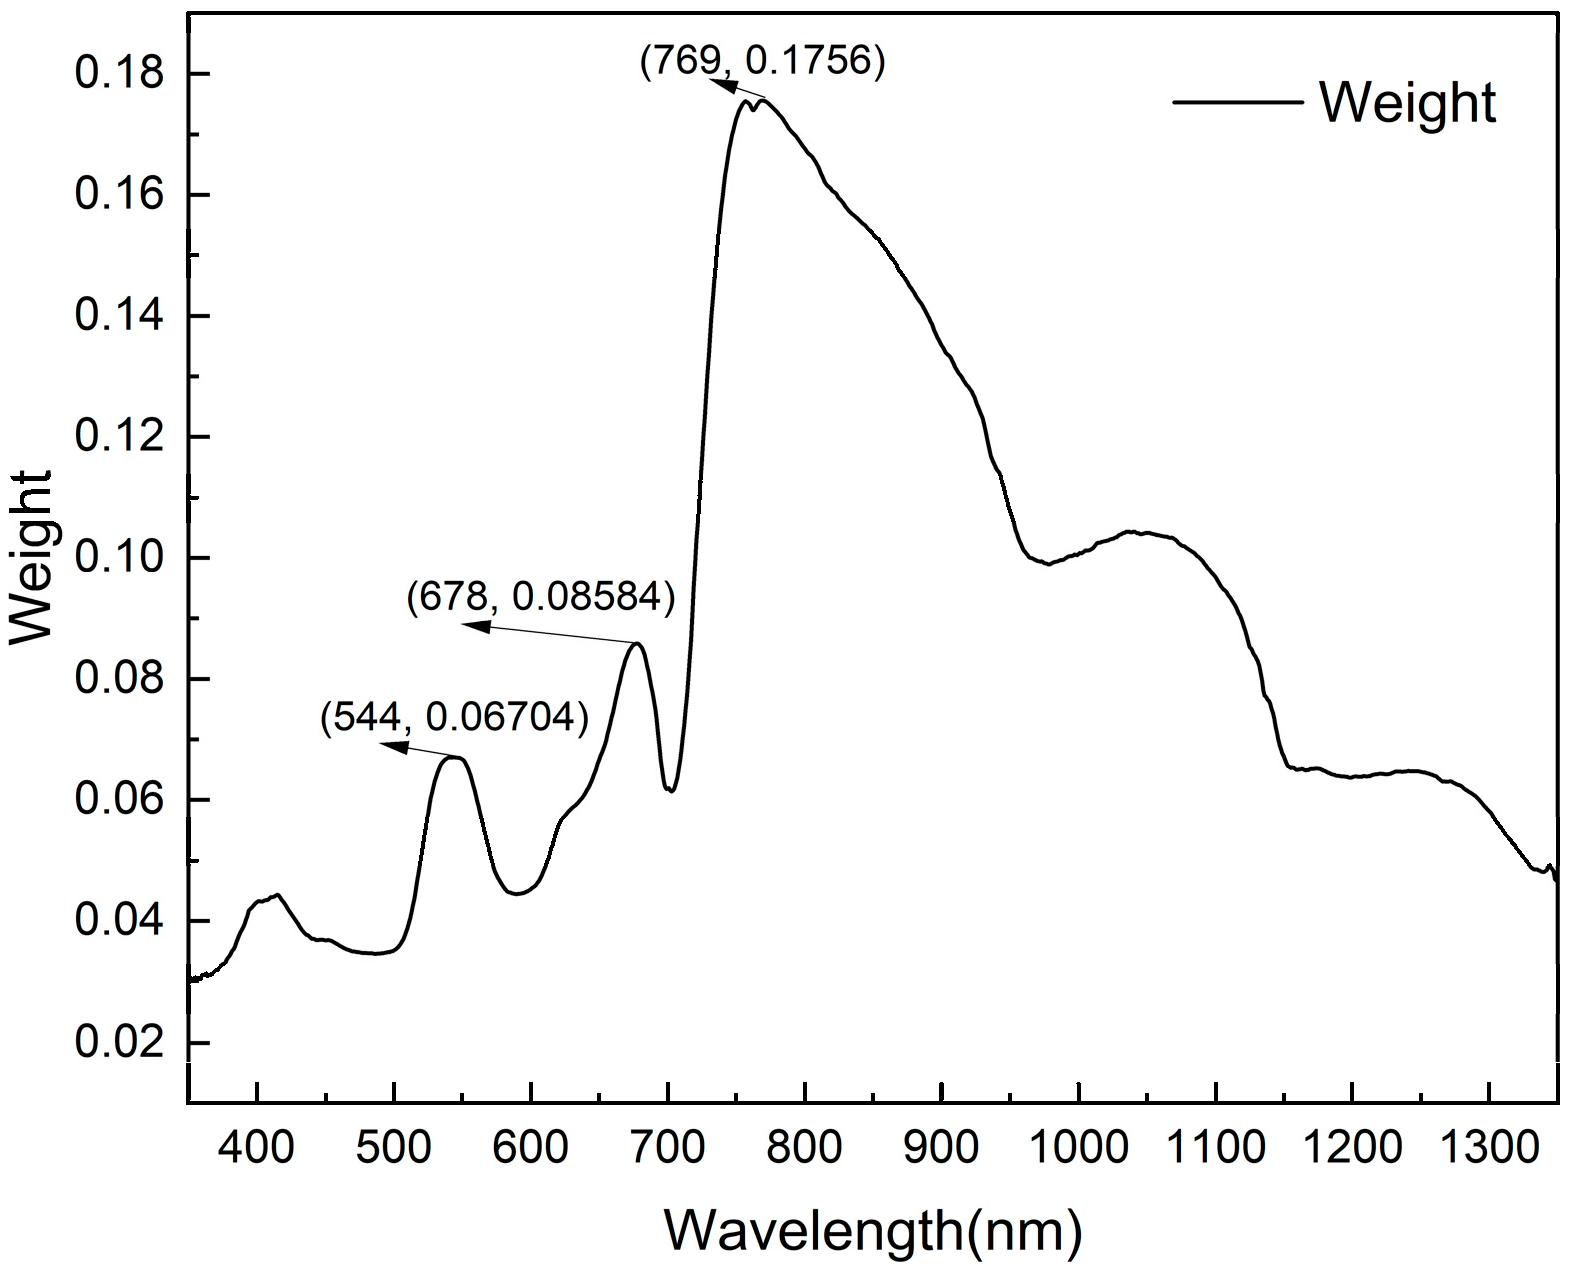
3.2.1. Sensitive Wavelengths Selection

Relief-F was used to screen the wavelengths sensitive to peanut southern blight. From Figure 4, it can be seen that the near-infrared band has a high feature weight value, reaching a maximum value of 0.1756 at 769 nm, and the feature weight value decreases with the increasing wavelength from 760 to 1350 nm. The next is the red band, reaching a peak value of 0.08584 at 678 nm. The last is the green band, reaching a peak value of 0.06704 at 544 nm. In this paper, the green band, the red band, and the near-infrared band were taken as local ranges, and the wavelengths corresponding to the peak feature weights were searched for in the local ranges. Finally, 544 nm, 678 nm, and 769 nm were selected as the sensitive wavelengths.

3.2.2. Comparison of New Spectral Features and Traditional Spectral Features

Correlation analysis is widely used in the study of crop diseases and pests [55,56,57]. This study used the Spearman correlation method to determine the identification ability of 20 spectral features for peanut southern blight. The Spearman correlation is different from the Pearson correlation in that it allows variables to become categories and has stronger robustness [58]. We will use the squared correlation coefficient as the indicator R2 to unify the positive and negative values in order to facilitate sorting the spectral features.
From Table 5, it can be seen that the correlation coefficient R between the first-order differential spectral features and peanut southern blight is between −0.854 and 0.863, and the highest correlation coefficient index is the SDy. The correlation coefficient R between the traditional spectral features and peanut southern blight is between −0.892 and 0.839, with the highest correlation coefficients being the NDVI and NBNDVI. Combining the formulas of the SDy, NDVI, and NBNDVI, it can be speculated that the red band and near-infrared band spectra have high application values for peanut southern blight. Finally, it is easy to see that the NSISB constructed in this study has the best correlation with peanut southern blight disease.

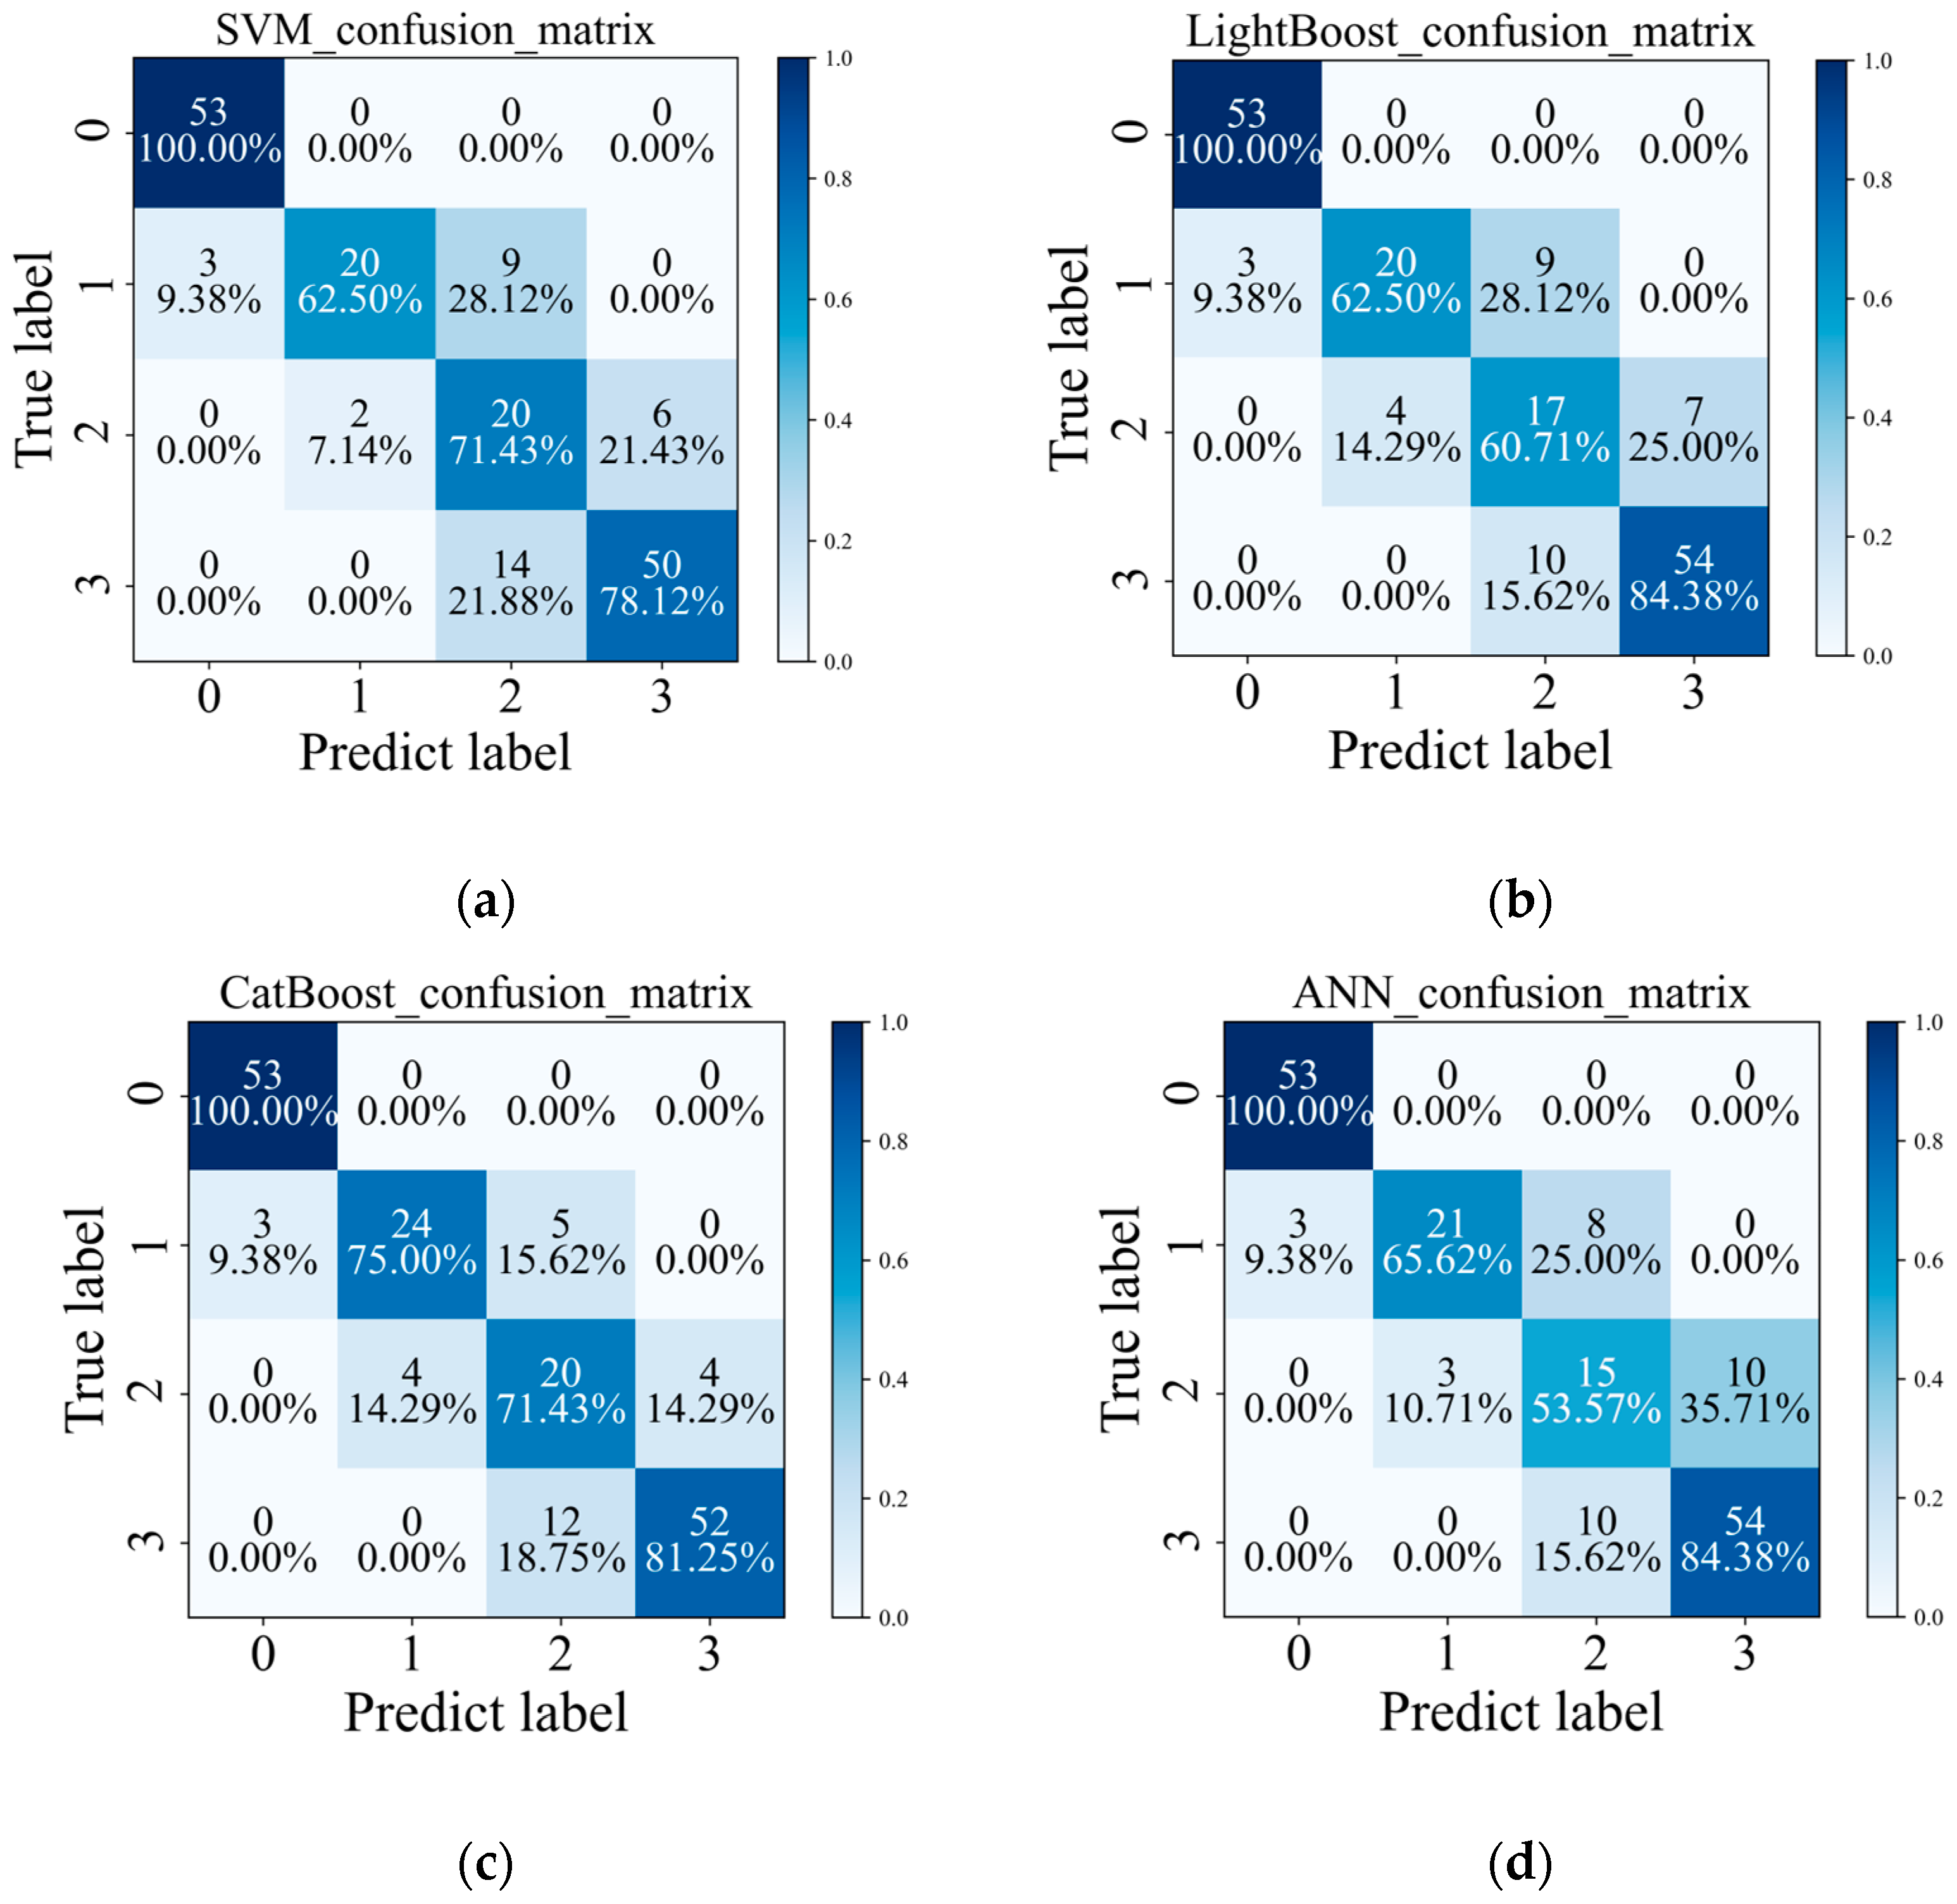
3.3. Disease Severity Level Detecting Model

This study used SVM, LightGBM, CatBoost, and ANN for modeling. We used the top six spectral features (TVI, SDy, NDSISB, NBNDVI, NDVI, and NSISB) ranked by correlation as input features to construct univariate detection models for peanut southern blight, respectively. The results are shown in Table 6.
The results show that the NSISB classification results proposed in this study are significantly better than the traditional spectral features, and the CatBoost algorithm has a higher correct score and a higher kappa coefficient than the other three classification algorithms. Therefore, in this study, the combination of the NSISB and CatBoost is more meaningful for the detecting of peanut southern blight, where the test set OA can reach 84.18%, and the kappa coefficient can reach 78.31%. When using the NSISB as the input feature, the OA of all four model test sets can reach over 80%, and the kappa coefficient can also reach over 70%.
Additionally, this study employs the confusion matrix to evaluate the effectiveness of the NSISB in detecting peanut southern blight, as shown in Figure 5. It can be seen that the CatBoost classification algorithm also outperforms the other three algorithms in classification accuracy at various severity levels. When using the CatBoost algorithm for classification, the accuracy of different disease severity levels could all reach more than 70%, with the “Healthy” and “Severe” accuracies greater than 80%. In addition, four classification algorithms outperformed the “Slight” and “Moderate” sample classification accuracy values in the “Healthy” and “Severe” sample classifications, probably because the difference between the “Slight” and “Moderate” samples was relatively small.

4. Discussion

4.1. Canopy Spectral Analysis of Peanut Southern Blight

Peanut southern blight first presents symptoms from the roots, which is different from peanut leaf spot disease and peanut stem rot disease [59,60]. As the disease progresses, the stem will rot, causing an inhibition of water and nutrient transport, ultimately leading to the withering and death of the entire plant. During this process, the chloroplasts in peanut leaves are destroyed, leading to continuous degradation of chlorophyll within the cells. The spectral reflectance near the “green peak” (550 nm) rapidly decreases, as shown in Figure 3. In addition, in our study, the spectral reflectance values in the near-infrared band significantly decreased with the increasing disease severity. This is similar to the research results of Guo et al. [61] on the spectrum of peanut leaves with southern blight disease.
Previous studies have shown that the decrease in green band reflectance is related to the decomposition of chlorophyll, while the change in red band reflectance may be related to changes in the carotenoids and lutein pigments [62]. The decrease in reflectance in the near-infrared band is mainly influenced by changes in the leaf structure and moisture content [63,64]. In this study, based on the incidence characteristics of peanut southern blight, changes in leaf color led to a decrease in reflectance within the “green peak” (around 550 nm) and an increase in reflectance near the “red valley” (around 670 nm). The withering of plants affects the leaf structure and moisture content, leading to a decrease in reflectance in the near-infrared band.

4.2. Traditional Spectral Features and the NSISB

In this study, we selected 18 spectral features commonly used in previous disease research. These spectral features provide a reference for our research. Hyperspectral data have a large number of bands and high redundancy. Different diseases may have different spectral response characteristics, resulting in different positions of sensitive bands. In our study, we analyzed the canopy spectra of peanut southern blight and determined that the sensitive bands for peanut southern blight were the green, red, and near-infrared bands, respectively. Among them, the spectral response of different disease severities varies most significantly in the near-infrared band. Then, we used the Relief-F algorithm to determine the specific band positions, which were 544 nm, 678 nm, and 769 nm, respectively. Finally, the most sensitive spectral index (NSISB) to peanut southern blight was constructed using these three bands. The NSISB proposed in this study has more relevant spectral information related to peanut southern blight; therefore, its performance is superior to other spectral features.

4.3. Models Comparison Analysis

In this study, we used spectral features to classify the severity of peanut southern blight disease using four models: SVM, LightGBM, CatBoost, and ANN. The results indicate that CatBoost has great potential in detecting peanut southern blight when applied to the NSISB. Compared to the other technologies, it achieved the highest accuracy of 84.18%. However, LightGBM achieved an accuracy of 81.36% when applied to NSISB, which was slightly inferior to CatBoost. CatBoost and LightGBM are both variants of gradient boosting tree algorithms. Compared to LightGBM, the advantage of CatBoost is its ability to automatically handle categorical variables without the need for additional encoding operations. At the same time, CatBoost uses a symmetric binary decision tree structure, which can effectively handle outliers, thereby improving the stability and generalization ability of the model. This makes CatBoost perform well on datasets with multiclass features [65,66]. Compared to CatBoost, the accuracy difference of the other three models is very small.
The general performance of the ANN model in this study may be related to the input feature of the model. ANNs are better at handling complex problems with multiple variables [67], and we explored the accuracy of using a single feature as an input feature. The advantage of neural networks has not been fully utilized.

5. Conclusions

In conclusion, we propose a new spectral index for peanut southern blight. The Relief-F algorithm was employed to select 544 nm, 678 nm, and 769 nm as sensitive wavelengths for constructing new spectral indices. The efficacy of SVM, LightGBM, CatBoost, and ANN in detecting peanut southern blight using different spectral features was examined. Finally, combining the evaluation metrics of the model, the NSISB combined with CatBoost model proposed in this paper had the superior performance, with an OA of 84.18% and a Kappa coefficient of 78.31%.
However, we will continue this research in the future. Future research will collect the spectral data of peanut southern blight disease canopy from different periods, varieties, and regions and verify the generalization of the proposed method by analyzing these data. More comprehensive data can also help us better understand the epidemic period, resistant varieties, and suitable soil environment of peanut southern blight disease.

Author Contributions

T.W.: investigation, methodology, validation, writing—original draft, and visualization. J.L.: investigation and writing—review and editing. Y.F.: investigation and validation. J.Y.: investigation and validation. Y.L.: investigation and validation. W.G.: conceptualization, writing—review and editing, and methodology. All authors have read and agreed to the published version of the manuscript.

Funding

This work was supported by the Henan Provincial Science and Technology Major Project (No. 221100110100), the National Natural Science Foundation of China, grant number (No. 32271993), the Joint Fund of Science and Technology Research Development program (Cultivation project of preponderant discipline) of Henan Province, China (No. 222301420114), and the earmarked fund for CARS-13.

Data Availability Statement

Dataset available on request from the corresponding authors. The data are not publicly available due to privacy.

Conflicts of Interest

The authors declare that they have no known competing financial interests or personal relationships that could have appeared to influence the research reported in this study.

References

  1. Guclu, V.; Aydogdu, M.; Basak, M.; Kizil, S.; Uzun, B.; Yol, E. Characterization of a groundnut collection to stem rot disease caused by Sclerotium rolfsii. Australas. Plant Pathol. 2020, 49, 691–700. [Google Scholar] [CrossRef]
  2. Ahmad, R.; Hussain, B.; Ahmad, T. Fresh and dry fruit production in Himalayan Kashmir, Sub-Himalayan Jammu and Trans-Himalayan Ladakh, India. Heliyon 2021, 7, e05835. [Google Scholar] [CrossRef] [PubMed]
  3. Minarni; Warman, I.; Yuhendra. Implementation of Case-Based Reasoning and Nearest Neighbor Similarity for Peanut Disease Diagnosis. J. Phys. Conf. Ser. 2019, 1196, 012053. [Google Scholar] [CrossRef]
  4. Xu, M.L.; Zhang, X.; Yu, J.; Guo, Z.Q.; Wu, J.X.; Li, X.G.; Chi, Y.C.; Wan, S.B. Biological control of peanut southern blight (Sclerotium rolfsii) by the strain Bacillus pumilus LX11. Biocontrol Sci. Technol. 2020, 30, 485–489. [Google Scholar] [CrossRef]
  5. Xie, C.Z.; Huang, C.H.; Vallad, G.E. Mycelial Compatibility and Pathogenic Diversity Among Sclerotium rolfsii Isolates in the Southern United States. Plant Dis. 2014, 98, 1685–1694. [Google Scholar] [CrossRef] [PubMed]
  6. Han, Z.Y.; Cui, K.D.; Wang, M.K.; Jiang, C.F.; Zhao, T.; Wang, M.Z.; Du, P.Q.; He, L.M.; Zhou, L. Bioactivity of the DMI fungicide mefentrifluconazole against Sclerotium rolfsii, the causal agent of peanut southern blight. Pest Manag. Sci. 2023, 79, 2126–2134. [Google Scholar] [CrossRef] [PubMed]
  7. Le, C.N.; Mendes, R.; Kruijt, M.; Raaijmakers, J.M. Genetic and Phenotypic Diversity of Sclerotium rolfsii in Groundnut Fields in Central Vietnam. Plant Dis. 2012, 96, 389–397. [Google Scholar] [CrossRef]
  8. Lu, J.Z.; Ehsani, R.; Shi, Y.Y.; Abdulridha, J.; de Castro, A.I.; Xu, Y.J. Field detection of anthracnose crown rot in strawberry using spectroscopy technology. Comput. Electron. Agric. 2017, 135, 289–299. [Google Scholar] [CrossRef]
  9. Fazari, A.; Pellicer-Valero, O.J.; Gómez-Sanchis, J.; Bernardi, B.; Cubero, S.; Benalia, S.; Zimbalatti, G.; Blasco, J. Application of deep convolutional neural networks for the detection of anthracnose in olives using VIS/NIR hyperspectral images. Comput. Electron. Agric. 2021, 187, 106252. [Google Scholar] [CrossRef]
  10. Tomaszewski, M.; Nalepa, J.; Moliszewska, E.; Ruszczak, B.; Smykała, K. Early detection of Solanum lycopersicum diseases from temporally-aggregated hyperspectral measurements using machine learning. Sci. Rep. 2023, 13, 7671. [Google Scholar] [CrossRef]
  11. Ray, S.S.; Jain, N.; Arora, R.K.; Chavan, S.; Panigrahy, S. Utility of Hyperspectral Data for Potato Late Blight Disease Detection. J. Indian Soc. Remote Sens. 2011, 39, 161–169. [Google Scholar] [CrossRef]
  12. Jing, X.; Huang, W.J.; Wang, J.H.; Wang, J.D.; Wang, K.R. Hyperspectral Inversion Models on Verticillium Wilt Severity of Cotton Leaf. Spectrosc. Spectr. Anal. 2009, 29, 3348–3352. [Google Scholar] [CrossRef]
  13. Liu, W.; Sun, C.F.; Zhao, Y.N.; Xu, F.; Song, Y.L.; Fan, J.R.; Zhou, Y.L.; Xu, X.M. Monitoring of Wheat Powdery Mildew under Different Nitrogen Input Levels Using Hyperspectral Remote Sensing. Remote Sens. 2021, 13, 3753. [Google Scholar] [CrossRef]
  14. Rai, A.K.; Reddy, K.R.; Singh, J.P. Photoacoustic study of nutritional deficiencies in cotton plants. Instrum. Sci. Technol. 2003, 31, 231–247. [Google Scholar] [CrossRef]
  15. Merzlyak, M.N.; Solovchenko, A.E.; Gitelson, A.A. Reflectance spectral features and non-destructive estimation of chlorophyll, carotenoid and anthocyanin content in apple fruit. Postharvest Biol. Technol. 2003, 27, 197–211. [Google Scholar] [CrossRef]
  16. Lins, E.C.; Belasque, J.; Marcassa, L.G. Detection of citrus canker in citrus plants using laser induced fluorescence spectroscopy. Precis. Agric. 2009, 10, 319–330. [Google Scholar] [CrossRef]
  17. le Maire, G.; François, C.; Dufrêne, E. Towards universal broad leaf chlorophyll indices using PROSPECT simulated database and hyperspectral reflectance measurements. Remote Sens. Environ. 2004, 89, 1–28. [Google Scholar] [CrossRef]
  18. Beget, M.E.; Di Bella, C.M. Flooding: The effect of water depth on the spectral response of grass canopies. J. Hydrol. 2007, 335, 285–294. [Google Scholar] [CrossRef]
  19. Guo, J.M.; Trotter, C.M. Estimating photosynthetic light-use efficiency using the photochemical reflectance index: Variations among species. Funct. Plant Biol. 2004, 31, 255–265. [Google Scholar] [CrossRef]
  20. Muhammed, H.H. Hyperspectral crop reflectance data for characterising and estimating fungal disease severity in wheat. Biosyst. Eng. 2005, 91, 9–20. [Google Scholar] [CrossRef]
  21. Ren, K.H.; Dong, Y.Y.; Huang, W.J.; Guo, A.T.; Jing, X. Monitoring of winter wheat stripe rust by collaborating canopy SIF with wavelet energy coefficients. Comput. Electron. Agric. 2023, 215, 108366. [Google Scholar] [CrossRef]
  22. Huang, H.; Liu, Y.; Kuerbanguli, D.; Zeng, F.L.; Mayiran, M.; Awaguli, M.; Maidinuerhan, A.; Guo, J.X. Ensemble Learning Model Incorporating Fractional Differential and PIMP-RF Algorithm to Predict Soluble Solids Content of Apples During Maturing Period. Spectrosc. Spectr. Anal. 2023, 43, 3059–3066. [Google Scholar]
  23. Reis-Pereira, M.; Tosin, R.; Martins, R.C.; Dos Santos, F.N.; Tavares, F.; Cunha, M. Enhancing Kiwi Bacterial Canker Leaf Assessment: Integrating Hyperspectral-Based Vegetation Indexes in Predictive Modeling. Eng. Proc. 2023, 48, 22. [Google Scholar]
  24. Haboudane, D.; Tremblay, N.; Miller, J.R.; Vigneault, P. Remote estimation of crop chlorophyll content using spectral indices derived from hyperspectral data. IEEE Trans. Geosci. Remote Sens. 2008, 46, 423–437. [Google Scholar] [CrossRef]
  25. Luo, J.H.; Huang, W.J.; Zhao, J.L.; Zhang, J.C.; Zhao, C.J.; Ma, R.H. Detecting Aphid Density of Winter Wheat Leaf Using Hyperspectral Measurements. IEEE J. Sel. Top. Appl. Earth Obs. Remote Sens. 2013, 6, 690–698. [Google Scholar] [CrossRef]
  26. Sow, M.; Mbow, C.; Hély, C.; Fensholt, R.; Sambou, B. Estimation of Herbaceous Fuel Moisture Content Using Vegetation Indices and Land Surface Temperature from MODIS Data. Remote Sens. 2013, 5, 2617–2638. [Google Scholar] [CrossRef]
  27. Wang, H.; Qin, F.; Qi, L.; Liu, R.; Rui, W.; Ma, Z.; Li, X.; Pei, C.; Wang, H. Identification and Disease Index Inversion of Wheat Stripe Rust and Wheat Leaf Rust Based on Hyperspectral Data at Canopy Level. J. Spectrosc. 2015, 2015, 651810. [Google Scholar] [CrossRef]
  28. Huang, W.; Lamb, D.W.; Niu, Z.; Zhang, Y.; Liu, L.; Wang, J. Identification of yellow rust in wheat using in-situ spectral reflectance measurements and airborne hyperspectral imaging. Precis. Agric. 2007, 8, 187–197. [Google Scholar] [CrossRef]
  29. Feng, W.; Shen, W.Y.; He, L.; Duan, J.Z.; Guo, B.B.; Li, Y.X.; Wang, C.Y.; Guo, T.C. Improved remote sensing detection of wheat powdery mildew using dual-green vegetation indices. Precis. Agric. 2016, 17, 608–627. [Google Scholar] [CrossRef]
  30. Luo, L.L.; Chang, Q.R.; Wang, Q.; Huang, Y. Identification and Severity Monitoring of Maize Dwarf Mosaic Virus Infection Based on Hyperspectral Measurements. Remote Sens. 2021, 13, 4560. [Google Scholar] [CrossRef]
  31. Liang, H.; He, J.; Lei, J.J. Monitoring of Corn Canopy Blight Disease Based on UAV Hyperspectral Method. Spectrosc. Spectr. Anal. 2020, 40, 1965–1972. [Google Scholar]
  32. Xiao, W.; Cao, Y.L.; Feng, S.; Liu, Y.D.; Jiang, K.L.; Yu, Z.X.; Yan, L. Detection of Rice Sheath Blight Disease Index Based on Split-Window Gram-Schmidt Transformation and PSO-SVR Algorithm. Spectrosc. Spectr. Anal. 2021, 41, 2181–2187. [Google Scholar]
  33. He, Y.; Du, P.Q.; Zhao, T.; Gao, F.; Wang, M.Z.; Zhang, J.J.; He, L.M.; Cui, K.D.; Zhou, L. Baseline sensitivity and bioactivity of tetramycin against Sclerotium rolfsii isolates in Huanghuai peanut-growing region of China. Ecotoxicol. Environ. Saf. 2022, 238, 113580. [Google Scholar] [CrossRef] [PubMed]
  34. Ruszczak, B.; Smykala, K.; Dziubanski, K. The detection of Alternaria solani infection on tomatoes using ensemble learning. J. Ambient Intell. Smart Environ. 2020, 12, 407–418. [Google Scholar] [CrossRef]
  35. Robnik-Sikonja, M.; Kononenko, I. Theoretical and empirical analysis of ReliefF and RReliefF. Mach. Learn. 2003, 53, 23–69. [Google Scholar] [CrossRef]
  36. Guan, Q.; Song, K.; Feng, S.; Yu, F.H.; Xu, T.Y. Detection of Peanut Leaf Spot Disease Based on Leaf-, Plant-, and Field-Scale Hyperspectral Reflectance. Remote Sens. 2022, 14, 4988. [Google Scholar] [CrossRef]
  37. Zhang, J.C.; Huang, Y.B.; Reddy, K.N.; Wang, B. Assessing crop damage from dicamba on non-dicamba-tolerant soybean by hyperspectral imaging through machine learning. Pest Manag. Sci. 2019, 75, 3260–3272. [Google Scholar] [CrossRef]
  38. Huang, W.J.; Guan, Q.S.; Luo, J.H.; Zhang, J.C.; Zhao, J.L.; Liang, D.; Huang, L.S.; Zhang, D.Y. New Optimized Spectral Indices for Identifying and Monitoring Winter Wheat Diseases. IEEE J. Sel. Top. Appl. Earth Obs. Remote Sens. 2014, 7, 2516–2524. [Google Scholar] [CrossRef]
  39. Rouse, J.W.; Haas, R.H.; Schell, J.A.; Deering, D.W. Monitoring Vegetation Systems in the Great Plains with Erts. NASA Spec. Publ. 1974, 351, 309. [Google Scholar]
  40. Merton, R.; Huntington, J. Early simulation results of the ARIES-1 satellite sensor for multi-temporal vegetation research derived from AVIRIS. In Proceedings of the Eighth Annual JPL Airborne Earth Science Workshop, Pasadena, CA, USA, 9–11 February 1999. [Google Scholar]
  41. Daughtry, C.S.; Walthall, C.L.; Kim, M.S.; De Colstoun, E.B.; McMurtrey Iii, J.E. Estimating corn leaf chlorophyll concentration from leaf and canopy reflectance. Remote Sens. Environ. Interdiscip. J. 2000, 74, 229–239. [Google Scholar] [CrossRef]
  42. Huang, W.; Huang, M.; Liu, L.; Wang, J.; Wang, J. Inversion of the severity of winter wheat yellow rust using proper hyper spectral index. Trans. Chin. Soc. Agric. Eng. 2005, 21, 97–103. [Google Scholar]
  43. Gamon, A.; Serrano, L.; Surfus, S. The photochemical reflectance index: An optical indicator of photosynthetic radiation use efficiency across species, functional types, and nutrient levels. Oecologia 1997, 112, 492–501. [Google Scholar] [CrossRef]
  44. CARTER; Gregory, A. Ratios of leaf reflectances in narrow wavebands as indicators of plant stress. Int. J. Remote Sens. 1994, 15, 697–703. [Google Scholar] [CrossRef]
  45. Gitelson, A.A.; Kaufman, Y.J.; Merzlyak, M.N. Use of a green channel in remote sensing of global vegetation from EOS-MODIS. Remote Sens. Environ. 1996, 58, 289–298. [Google Scholar] [CrossRef]
  46. Broge, N.H.; Leblanc, E. Comparing prediction power and stability of broadband and hyperspectral vegetation indices for estimation of green leaf area index and canopy chlorophyll density. Remote Sens. Environ. 2001, 76, 156–172. [Google Scholar] [CrossRef]
  47. Thenkabail, P.S.; Smith, R.B.; De Pauw, E. Evaluation of narrowband and broadband vegetation indices for determining optimal hyperspectral wavebands for agricultural crop characterization. Photogramm. Eng. Remote Sens. 2002, 68, 607–621. [Google Scholar]
  48. Gong, P.; Pu, R.; Heald, R.C. Analysis of in situ hyperspectral data for nutrient estimation of giant sequoia. Int. J. Remote Sens. 2010, 23, 1827–1850. [Google Scholar] [CrossRef]
  49. Cortes, C.; Vapnik, V. Support-Vector Networks. Mach. Learn. 1995, 20, 273–297. [Google Scholar] [CrossRef]
  50. Meng, Q. LightGBM: A Highly Efficient Gradient Boosting Decision Tree. In Proceedings of the NIPS’17 31st International Conference on Neural Information Processing Systems, Long Beach, CA, USA, 4–9 December 2017. [Google Scholar]
  51. Dorogush, A.V.; Ershov, V.; Gulin, A. CatBoost: Gradient boosting with categorical features support. arXiv 2018, arXiv:1810.11363. [Google Scholar]
  52. Li, J.; Wu, J.P.; Lin, J.Q.; Li, C.; Lu, H.Z.; Lin, C.X. Nondestructive Identification of Litchi Downy Blight at Different Stages Based on Spectroscopy Analysis. Agriculture 2022, 12, 402. [Google Scholar] [CrossRef]
  53. Pontes, F.J.; Amorim, G.F.; Balestrassi, P.P.; Paiva, A.P.; Ferreira, J.R. Design of experiments and focused grid search for neural network parameter optimization. Neurocomputing 2016, 186, 22–34. [Google Scholar] [CrossRef]
  54. Genc, L.; Nalpulat, M.; Kizil, U.; Mirik, M.; Smith, S.E.; Mendes, M. Determination of water stress with spectral reflectance on sweet corn (Zea mays L.) using classification tree (CT) analysis. Zemdirb. Agric. 2013, 100, 81–90. [Google Scholar] [CrossRef]
  55. Zhang, H.; Hu, H.; Zhang, X.B.; Zhu, L.F.; Zheng, K.F.; Jin, Q.Y.; Zeng, F.P. Estimation of rice neck blasts severity using spectral reflectance based on BP-neural network. Acta Physiol. Plant. 2011, 33, 2461–2466. [Google Scholar] [CrossRef]
  56. Chen, B.; Li, S.K.; Wang, K.R.; Wang, F.Y.; Xiao, C.H.; Pan, W.C. Study on Hyperspectral Estimation of Pigment Contents in Leaves of Cotton Under Disease Stress. Spectrosc. Spectr. Anal. 2010, 30, 421–425. [Google Scholar] [CrossRef]
  57. Guo, J.B.; Huang, C.; Wang, H.G.; Sun, Z.Y.; Ma, Z.H. Disease Index Inversion of Wheat Stripe Rust on Different Wheat Varieties with Hyperspectral Remote Sensing. Spectrosc. Spectr. Anal. 2009, 29, 3353–3357. [Google Scholar] [CrossRef]
  58. Xu, W.C.; Hou, Y.H.; Hung, Y.S.; Zou, Y.X. A comparative analysis of Spearman’s rho and Kendall’s tau in normal and contaminated normal models. Signal Process. 2013, 93, 261–276. [Google Scholar] [CrossRef]
  59. Chen, T.T.; Zhang, J.L.; Chen, Y.; Wan, S.B.; Zhang, L. Detection of peanut leaf spots disease using canopy hyperspectral reflectance. Comput. Electron. Agric. 2019, 156, 677–683. [Google Scholar] [CrossRef]
  60. Luo, Z.L.; Cui, R.J.; Chavarro, C.; Tseng, Y.C.; Zhou, H.; Peng, Z.; Chi, Y.; Yang, X.P.; Lopez, Y.; Tillman, B.; et al. Mapping quantitative trait loci (QTLs) and estimating the epistasis controlling stem rot resistance in cultivated peanut (Arachis hypogaea). Theor. Appl. Genet. 2020, 133, 1201–1212. [Google Scholar] [CrossRef]
  61. Guo, W.; Sun, H.G.; Qiao, H.B.; Zhang, H.; Zhou, L.; Dong, P.; Song, X.Y. Spectral Detection of Peanut Southern Blight Severity Based on Continuous Wavelet Transform and Machine Learning. Agriculture 2023, 13, 1504. [Google Scholar] [CrossRef]
  62. Devadas, R.; Lamb, D.W.; Simpfendorfer, S.; Backhouse, D. Evaluating ten spectral vegetation indices for identifying rust infection in individual wheat leaves. Precis. Agric. 2009, 10, 459–470. [Google Scholar] [CrossRef]
  63. Gitelson, A.A.; Kaufman, Y.J.; Stark, R.; Rundquist, D. Novel algorithms for remote estimation of vegetation fraction. Remote Sens. Environ. 2002, 80, 76–87. [Google Scholar] [CrossRef]
  64. Jacquemoud, S.; Baret, F. PROSPECT: A model of leaf optical properties spectra. Remote Sens. Environ. 1990, 34, 75–91. [Google Scholar] [CrossRef]
  65. Hancock, J.T.; Khoshgoftaar, T.M. CatBoost for big data: An interdisciplinary review. J. Big Data 2020, 7, 94. [Google Scholar] [CrossRef] [PubMed]
  66. Esmaeili, A.; Hekmatmehr, H.; Atashrouz, S.; Madani, S.A.; Pourmahdi, M.; Nedeljkovic, D.; Hemmati-Sarapardeh, A.; Mohaddespour, A. Insights into modeling refractive index of ionic liquids using chemical structure-based machine learning methods. Sci. Rep. 2023, 13, 11966. [Google Scholar] [CrossRef]
  67. Harsányi, E.; Bashir, B.; Arshad, S.; Ocwa, A.; Vad, A.; Alsalman, A.; Bácskai, I.; Rátonyi, T.; Hijazi, O.; Széles, A.; et al. Data Mining and Machine Learning Algorithms for Optimizing Maize Yield Forecasting in Central Europe. Agronomy 2023, 13, 1297. [Google Scholar] [CrossRef]
Figure 1. Overview of the experiment site. Disease severity level: 0 (Healthy), 1 (Slight), 2 (Moderate), and 3 (Severe). (a) Location of Zhengyang County in Henan Province. (b) Distribution and location of the experimental plots.
Horticulturae 10 00128 g001
Figure 2. A reflectance diagram (with consecutive numbers of measurement sets on the x-axis and the spectrum on the y-axis) for the different disease severity levels, including four degrees: (a) Healthy; (b) Slight; (c) Moderate; (d) Severe.
Horticulturae 10 00128 g002
Figure 3. Mean spectral reflectance for different disease severity levels.
Horticulturae 10 00128 g003
Figure 4. Sensitive wavelengths selection. Weight is calculated by the Relief-F algorithm, and 544 nm, 678 nm, and 769 nm are the band positions corresponding to the maximum feature weight values in the green band, red band, and near-infrared band, respectively.
Horticulturae 10 00128 g004
Figure 5. Confusion matrix, where 0: Healthy, 1: Slight, 2: Moderate, and 3: Severe. (a) SVM; (b) LightGBM; (c) CatBoost; (d) ANN. The numbers on the diagonal of each row indicate the number and percentage of correctly categorized samples in that category, while the other positions are for misclassified samples.
Horticulturae 10 00128 g005
Table 1. Standard for classification of the disease severity level.
Disease Severity Level of This StudyInfestation SymptomsDisease Severity Level
HealthyNo disease symptoms0
SlightLesions only on the stem of the plant1
Disease symptoms (e.g., stem base shrinking and wilting) < 1/3 of the plant3
ModerateDisease symptoms on 1/3–2/3 of the plant 5
Disease symptoms > 2/3 of the plant7
SevereComplete wilting and plant death9
Table 2. Number of the samples.
Disease Severity LevelNumber
Healthy150
Slight110
Moderate120
Severe210
Total590
Table 3. Spectral features.
No.Spectral FeaturesCalculation FormulaReference
1NDVI(R840 – R675)/(R840 + R675)[39]
2RVSI[(R712 + R752)/2] – R732[40]
3MCARI[(R700 – R670) – 0.2 × (R700 + R550)] × (R700/R670)[41]
4TCARI3 × [(R700 – R670) – 0.2 × (R700 + R550) × (R700/R670)][42]
5PRI(R570 – R531)/(R531 + R570)[43]
6SRR695/R420[44]
7GNDVI(R747 – R537)/(R747 + R537)[45]
8TVI0.5 × [120 × (R750 – R550) – 200 × (R670 – R550)][46]
9NBNDVI(R850 – R680)/(R850 + R680)[47]
10DbMaximum first-order differential value of blue edge (490~530 nm)[48]
11DyMaximum first-order differential value of yellow edge (550~582 nm)
12DrMaximum first-order differential value of red edge (670~737 nm)
13λbDb corresponding wavelength
14λyDy corresponding wavelength
15λrDr corresponding wavelength
16SDbBlue edge first-order differential sum
17SDyYellow edge first-order differential sum
18SDrRed edge first-order differential sum
19NDSISB((R769 – R678)/(R769 + R678)) + ((R769 – R544)/(R769 + R544))This study
20NSISBR769 + R544/R678This study
Table 4. Confusion matrix.
Actual ClassPredicted Class
PositiveNegative
PositiveTPFN
NegativeFPTN
Table 5. Results of the correlation analysis, where R is the Spearman’s correlation coefficient of each spectral feature with the disease, and R2 is the square of R.
No.Spectral FeaturesRR2Rank
1NDVI−0.8920.7962
2RVSI0.8170.66710
3MCARI−0.6760.45715
4TCARI−0.6760.45716
5PRI0.8390.7049
6SR0.5060.25617
7GNDVI−0.7670.58812
8TVI−0.8600.7406
9NBNDVI−0.8920.7963
10Db−0.7570.57313
11Dy0.7690.59111
12Dr−0.8540.7297
13λb0.01020
14λy−0.390.15218
15λr−0.3810.14519
16SDb−0.720.51814
17SDy0.8630.7455
18SDr−0.8510.7248
19NDSISB−0.8730.7624
20NSISB−0.9040.8171
Table 6. Classification algorithm results.
Spectral FeaturesSVMLightGBMCatBoostANN
OA (%)Kappa (%)OA (%)Kappa (%)OA (%)Kappa (%)OA (%)Kappa (%)
TVI73.4562.9473.4562.5472.8862.3470.6259.37
SDy73.4562.6671.7560.8973.4563.1671.7560.12
NDSISB72.3261.5075.7166.0273.4563.0872.3261.50
NBNDVI75.7165.6469.4958.1572.8862.6970.6258.70
NDVI75.7165.6472.3262.2075.1465.6174.5864.00
NSISB80.7973.6881.3674.2584.1878.3180.7973.34
Disclaimer/Publisher’s Note: The statements, opinions and data contained in all publications are solely those of the individual author(s) and contributor(s) and not of MDPI and/or the editor(s). MDPI and/or the editor(s) disclaim responsibility for any injury to people or property resulting from any ideas, methods, instructions or products referred to in the content.

