Article

Effect of Different Intensities of Leaf Removal on Tomato Development and Yield

1
Plant Production in Tropical and Subtropical Areas, Instituto Canario de Investigaciones Agrarias, ICIA, Carretera del Boquerón s/n, Valle de Guerra, 38270 La Laguna, Spain
2
Centro de Edafología y Biología Aplicada del Segura—Centro Superior de Investigaciones Científicas, CEBAS-CSIC, Campus de Espinardo, 30100 Murcia, Spain
3
Agricultural and Rural Engineering Department, Universidad de La Laguna, Carretera de Geneto, 2, 38296 La Laguna, Spain
4
Agricultural Extension and Rural Development Service, Cabildo Insular de Tenerife, Calle Alcalde Mandillo Tejera, 8, 38004 Santa Cruz de Tenerife, Spain
*
Author to whom correspondence should be addressed.
Horticulturae 2024, 10(11), 1136; https://doi.org/10.3390/horticulturae10111136
Submission received: 21 September 2024 / Revised: 10 October 2024 / Accepted: 18 October 2024 / Published: 25 October 2024

Abstract

:
Defoliation (leaf removal or pruning) is a common practice in tomato production that makes crops more manageable, prevents conditions conducive to fungal attack and increases the exposure of the fruit to light, especially in winter conditions. The intensity and frequency of leaf removal on commercial farms often vary according to workforce availability criteria, which makes it difficult to determine their effect on tomato crop yields. It would be reasonable to think that a reduction in leaf area influences radiation interception and, therefore, the production of assimilates and biomass. However, in intensive production systems with a high leaf area index (LAI), leaf pruning can increase radiation interception, either by reducing competition between productive and vegetative organs or by increasing radiation use efficiency. This study was therefore designed to assess the effect of different intensities and frequencies of basal leaf removal on dry matter production and partitioning between the different organs of the plant, and thus on tomato crop productivity. A series of trials were conducted over three consecutive seasons, with a trial conducted per season: (a) Trial 1: leaf removal control—LRC (with leaves removed from the base to two leaves below the truss close to harvest, T0) was compared with LR1 (leaf removal from the base to two leaves below the truss above T0, i.e., T1) and LR2 (two trusses above T0 (T2)); (b) Trial 2: LRC compared with LR2 and LR4 (four trusses above T0 (T4)), carried out at two frequencies; and (c) Trial 3: LRC compared with an intense leaf removal treatment (LRI) whereby between 10 and 12 leaves were left on each stem. LAI saturation values under our conditions were found to be around 2.0. No significant differences in yield were found between the control and treatments LR1, LR2 and LR4, with a reduction in the number of leaves of up to 35% and LAI values during harvest above 2.0. The intense leaf removal treatment (LRI), which reduced the number of leaves by 47% and the LAI value from 2.8 to 1.5 compared to the control, resulted in a 15% reduction in dry biomass and a 17% decrease in fruit yield.

1. Introduction

The yield of a tomato crop is determined by the total biomass production, the distribution of this biomass and the dry matter content of the fruits. The main reasons for differences in productivity are the accumulated light interception, the control and optimisation of climatic conditions (temperature, humidity, light and CO2), the cultural practices applied (irrigation, fertilisation, plant density, leaf pruning and fruit thinning, etc.) and, finally, the length of the production period. Therefore, to achieve increases in productivity, it is necessary to implement improvements in each of the above aspects while maintaining a balance between this implementation of improvements to optimise productivity and quality, and the increase in cost that this entails, taking into account the socio-economic and technical criteria of each area.
Leaf removal is a common practice in tomato cultivation for three reasons: (a) to prevent conditions conducive to fungal attack (by improving aeration of the crop and removing leaves that are in contact with the soil), (b) to increase exposure of the fruit to sunlight, especially in winter, and (c) to aid crop management, especially when using a high-wire system. Defoliation must be carried out with caution, as it has an effect on leaf area and thus on light interception, a predominant factor in tomato crop growth and biomass production. However, in most cases, its frequency and intensity do not respond to productive criteria, but rather to the availability of personnel to carry it out, which often means carrying out very intensive leaf removal each time.
In some cases, there is no reduction in tomato yield until 60% of leaves have been removed [1]. The capacity of tomato plants to withstand leaf removal without loss of yield is partly explained by the increased photosynthesis rates in the remaining leaves, which compensate in part for the removed leaves [2]. Accordingly, it is likely that defoliation will affect the net assimilation rate (NAR), defined as the rate of dry matter production per unit of total leaf area of the plant [3]. Some authors, however, have stated that the extra dry matter that accumulates in non-defoliated plants remains in the leaves without being translocated to the fruit [4], which could explain why the yield is similar to that of defoliated plants.
Moreover, the removal of young leaves that develop before the first inflorescence (immediately above) seems to encourage flowering under low light conditions with a risk of flower abortion [5]. Other trials involving the pruning of leaves at early stages of tomato development reduced the leaf area at harvest and yield, compared with a control with no leaf removal. Fruit size was not affected, so it appears that defoliation had the effect of reducing the number of flowers or fruit per truss [6].
In trials in the Netherlands in which old leaves were removed, an average LAI of 3.3 was found to be sufficient to achieve optimum yields in summer growing conditions [7]. Another reference puts this value at around 3.5 [8].
Moderate removal of young leaves (one leaf between two trusses), although it reduces LAI and total biomass, promotes the translocation of assimilates to the fruit and increases the yield, provided that a minimum LAI is maintained, either by delaying the removal of old leaves or by increasing planting density [9,10,11,12].
In light of the above and taking into account the importance of this cultural practice, especially in long-season greenhouse cultivation, the aim of this study was to assess the impact of different intensities and frequencies of basal leaf removal on dry matter production and yield of a greenhouse tomato crop, to establish a minimum leaf area index below which yield losses occur.

2. Materials and Methods

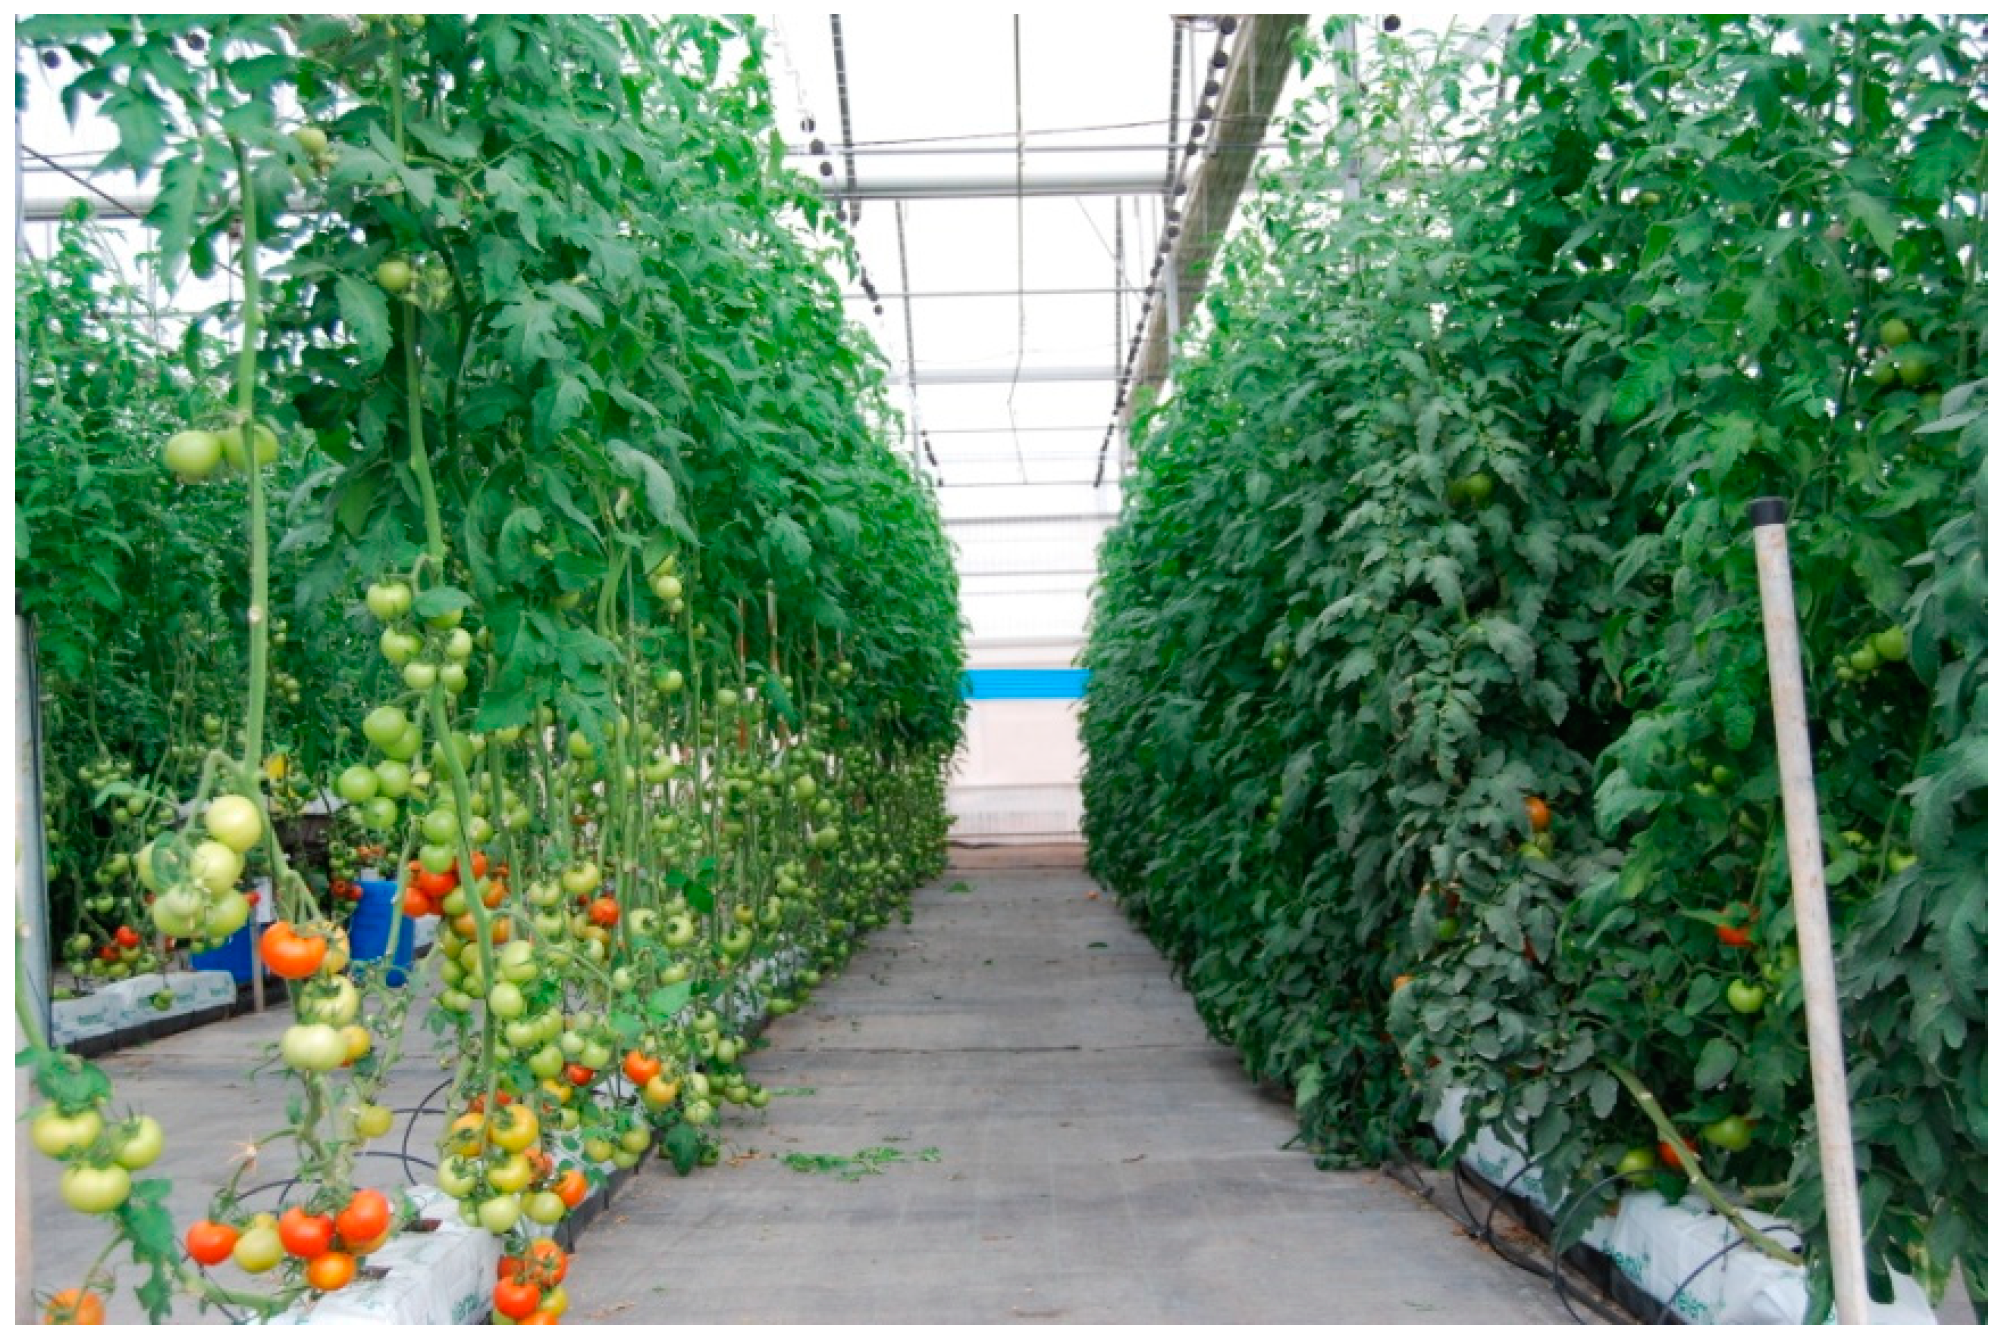
The trials were conducted over several consecutive winter growing seasons in the Canary Islands (Spain) (planted in August–September and harvested in April–May; between 202 and 270 days of cultivation).
The tomatoes were grown in a multi-span greenhouse with an 800-gauge polyethylene covering and polycarbonate siding, on the island of Gran Canaria (coordinates: 27.844680,−15.4304559). The Boludo (Seminis, Leverkusen, Germany) cultivar grafted on Beaufort (Seminis) was used in soilless culture on coir (coconut fibre), with a planting frame of 2.0 × 0.4 m and 2 stems per plant, corresponding to a density of 2.5 stems/m2. The plants were trained using a high-wire trellising system (3.5 m), with N–S row orientation.

2.1. Treatments and Trials

The leaf removal treatments were as follows (Figure 1 and Figure 2):
Leaf removal control (LRC): all leaves were removed from the base to 2 leaves below the truss close to harvest, which we identified as the reference truss (T0).
Leaf removal 1 (LR1): all leaves were removed from the base to 2 leaves below truss T1, the next truss above T0.
Leaf removal 2 (LR2): leaves were removed from the base to 2 leaves below T2 (second truss above T0).
Leaf removal 4 (LR4): leaves were removed from the base to 2 leaves below T4 (fourth truss above T0).
Intense leaf removal (LRI): between 10 and 12 leaves per stem were kept.
To evaluate the effect on yield and fruit quality, the following trials were performed:
Trial 1: The effect of two leaf removal intensities (LR1 and LR2) was tested against control LRC. Leaf removal was carried out on a monthly basis, during the 08/09 season.
Trial 2: The effect of two leaf removal intensities (LR2 and LR4) was tested against control LRC. Leaf removal was carried out at two frequencies: monthly and fortnightly, during the 09/10 season.
Trial 3: The effect of intense leaf removal (LRI) was compared to control LRC. Leaf removal was carried out fortnightly, during the 10/11 season (Figure 2).

2.2. Data Studied

2.2.1. Climate Variables

Global radiation (LICOR, Lincoln NE, USA, model LI-200 and Kipp & Zonen, Delft, The Netherlands, model CM6) and incident photosynthetically active radiation PAR (LICOR LI-190) outside and inside the greenhouses, as well as temperature and relative humidity (Vaisala, Vantaa, Finland, HMP45A probes), were measured in intervals of 30 min.

2.2.2. Crop Ecophysiological Parameters

These measurements were carried out on 9 plants with two stems each, per treatment:
Number of leaves emitted and removed. Measurements were taken monthly or fortnightly, depending on the leaf removal treatment, by counting the new leaves emitted on the plant since the last one marked in the previous measurement and the leaves removed according to the treatment tested.
For the following parameters, destructive measurements were taken monthly during the first 3 or 4 months after transplanting, and then every 2 months once the plant had a more stable growth rate, performing in total between 7 and 8 measurements in each growing season:
Biomass produced by destructive methods during various crop stages, sorted by stems, leaves, shoots, flowers and fruits.
Leaf area index (LAI) [13]. A Licor 3100C leaf area meter was used. Leaves with more than 50% of the surface area showing symptoms of senescence were not measured.
Number of trusses, flowers and fruits emitted, counting both viable and aborted fruit.
Specific leaf area (SLA), determined by the ratio between the leaf area sampled (LA) and its corresponding dry weight.
Radiation use efficiency (RUE, also referred to as light use efficiency LUE), calculated as the ratio between the biomass produced by the crop and the incident radiation during the same period.
Net assimilation rate (NAR), defined as the rate of dry matter production per unit leaf area. It was related to the incident radiation in the same measurement period.

2.2.3. Yield Components

Harvesting was monitored weekly on 21, 9 and 12 plants per treatment and replicated, for trials 1, 2 and 3, respectively, with the following data being collected:
Commercial and non-commercial yields.
Distribution by size of commercial fruit, 3M (35–47 mm), 2M (47–57 mm), M (57–67 mm), G (67–82 mm) and 2G (82–102 mm).
Harvest index (HI), calculated as the ratio of fruit yield, expressed in dry weight, to the total biomass obtained.

2.3. Statistical Analysis

A randomised complete block design with three replicates was used for Trials 1 and 3 where the response of different leaf removal intensities was assessed against a control. In Trial 2, where the effect of applying different leaf removal intensities and two leaf removal frequencies was compared, a split-plot experimental design was used, with frequency (monthly or fortnightly) as the main factor and leaf removal intensity (LRC, LR2 and LR4) as a secondary factor with three replicates.
The experimental unit consisted of between 24 and 48 plants, depending on the space available for the trials in each growing season. For destructive measurements, 3 plants per treatment and replicate in each destructive period were used.
Statistical analysis of the data was carried out with Statistix 9 (v 9.0) (Analytical Software).

3. Results

3.1. Climate Variables

The average temperature throughout the three trials showed very stable values between 15 and 28 °C, with the lowest values between February and March. The daily integral of PAR radiation also showed similar values in the three cycles, ranging from 2 to 8 MJ·m−2·day−1 (Figure 3).

3.2. Ecophysiological Variables

3.2.1. Leaves

There were no significant differences in the total number of leaves emitted between treatments in any of the trials (Table 1). The rate of leaf emission was maintained at a mean of 0.3 leaves per day, regardless of the leaf removal treatment used (Figure 4).
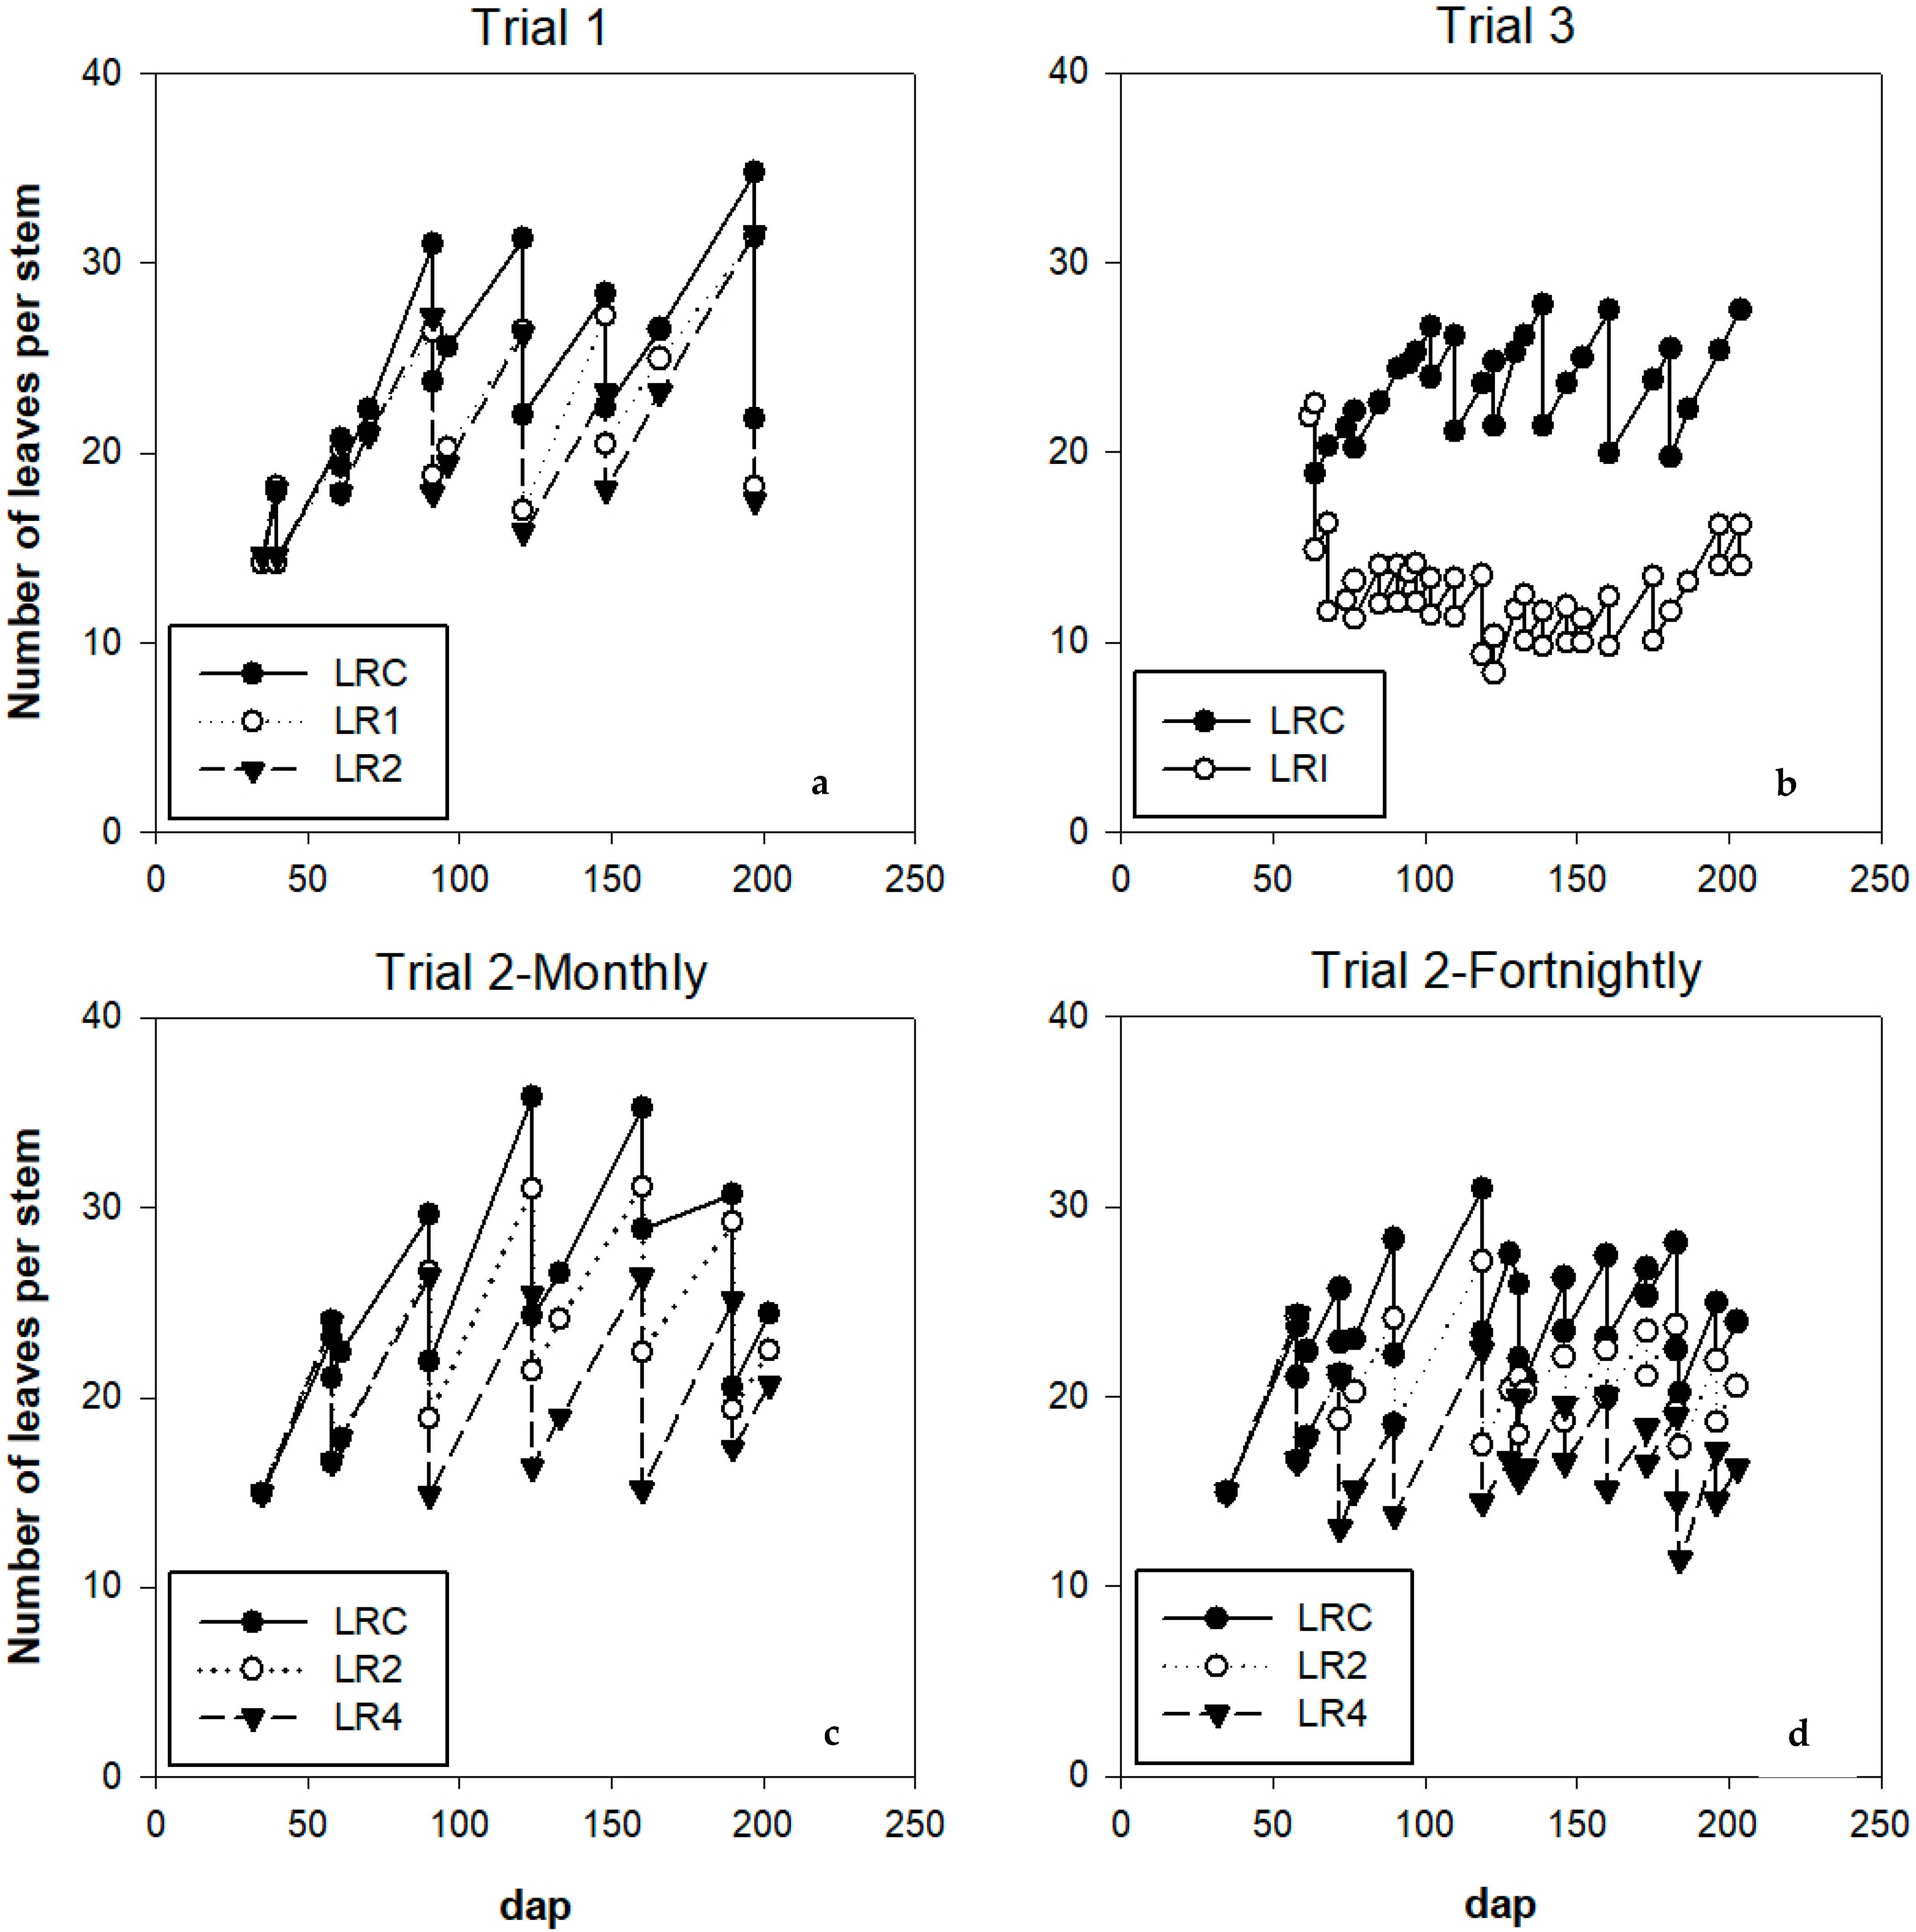
In Trial 1, the average reduction in the number of leaves on the plant compared to the control was significant (around 12% for LR1 and 16% for LR2). As a result of defoliation, the number of leaves on each stem followed a saw-tooth pattern, as shown in Figure 5a.
In Trial 2, the number of leaves on each stem during harvesting followed the evolution shown in Figure 5c,d, with lower mean values in fortnightly leaf removal compared to monthly leaf removal (Table 1). Within each leaf removal frequency, significant differences were found between the control and the LR4 treatment. Thus, the reduction in the mean number of leaves compared to the control in treatments LR2 and LR4 was 11% and 23% for the monthly frequency and 16% and 30% for the fortnightly frequency.
Similarly, in Trial 3, the total number of leaves removed was significantly higher in the LRI treatment than in LRC, with 46% fewer leaves present (Figure 5b). Between 5.3 leaves/stem were removed at each leaf removal in LRI compared to 2.9 leaves/stem in LRC (Table 1).

Leaf Area Index (LAI) and Specific Leaf Area (SLA)

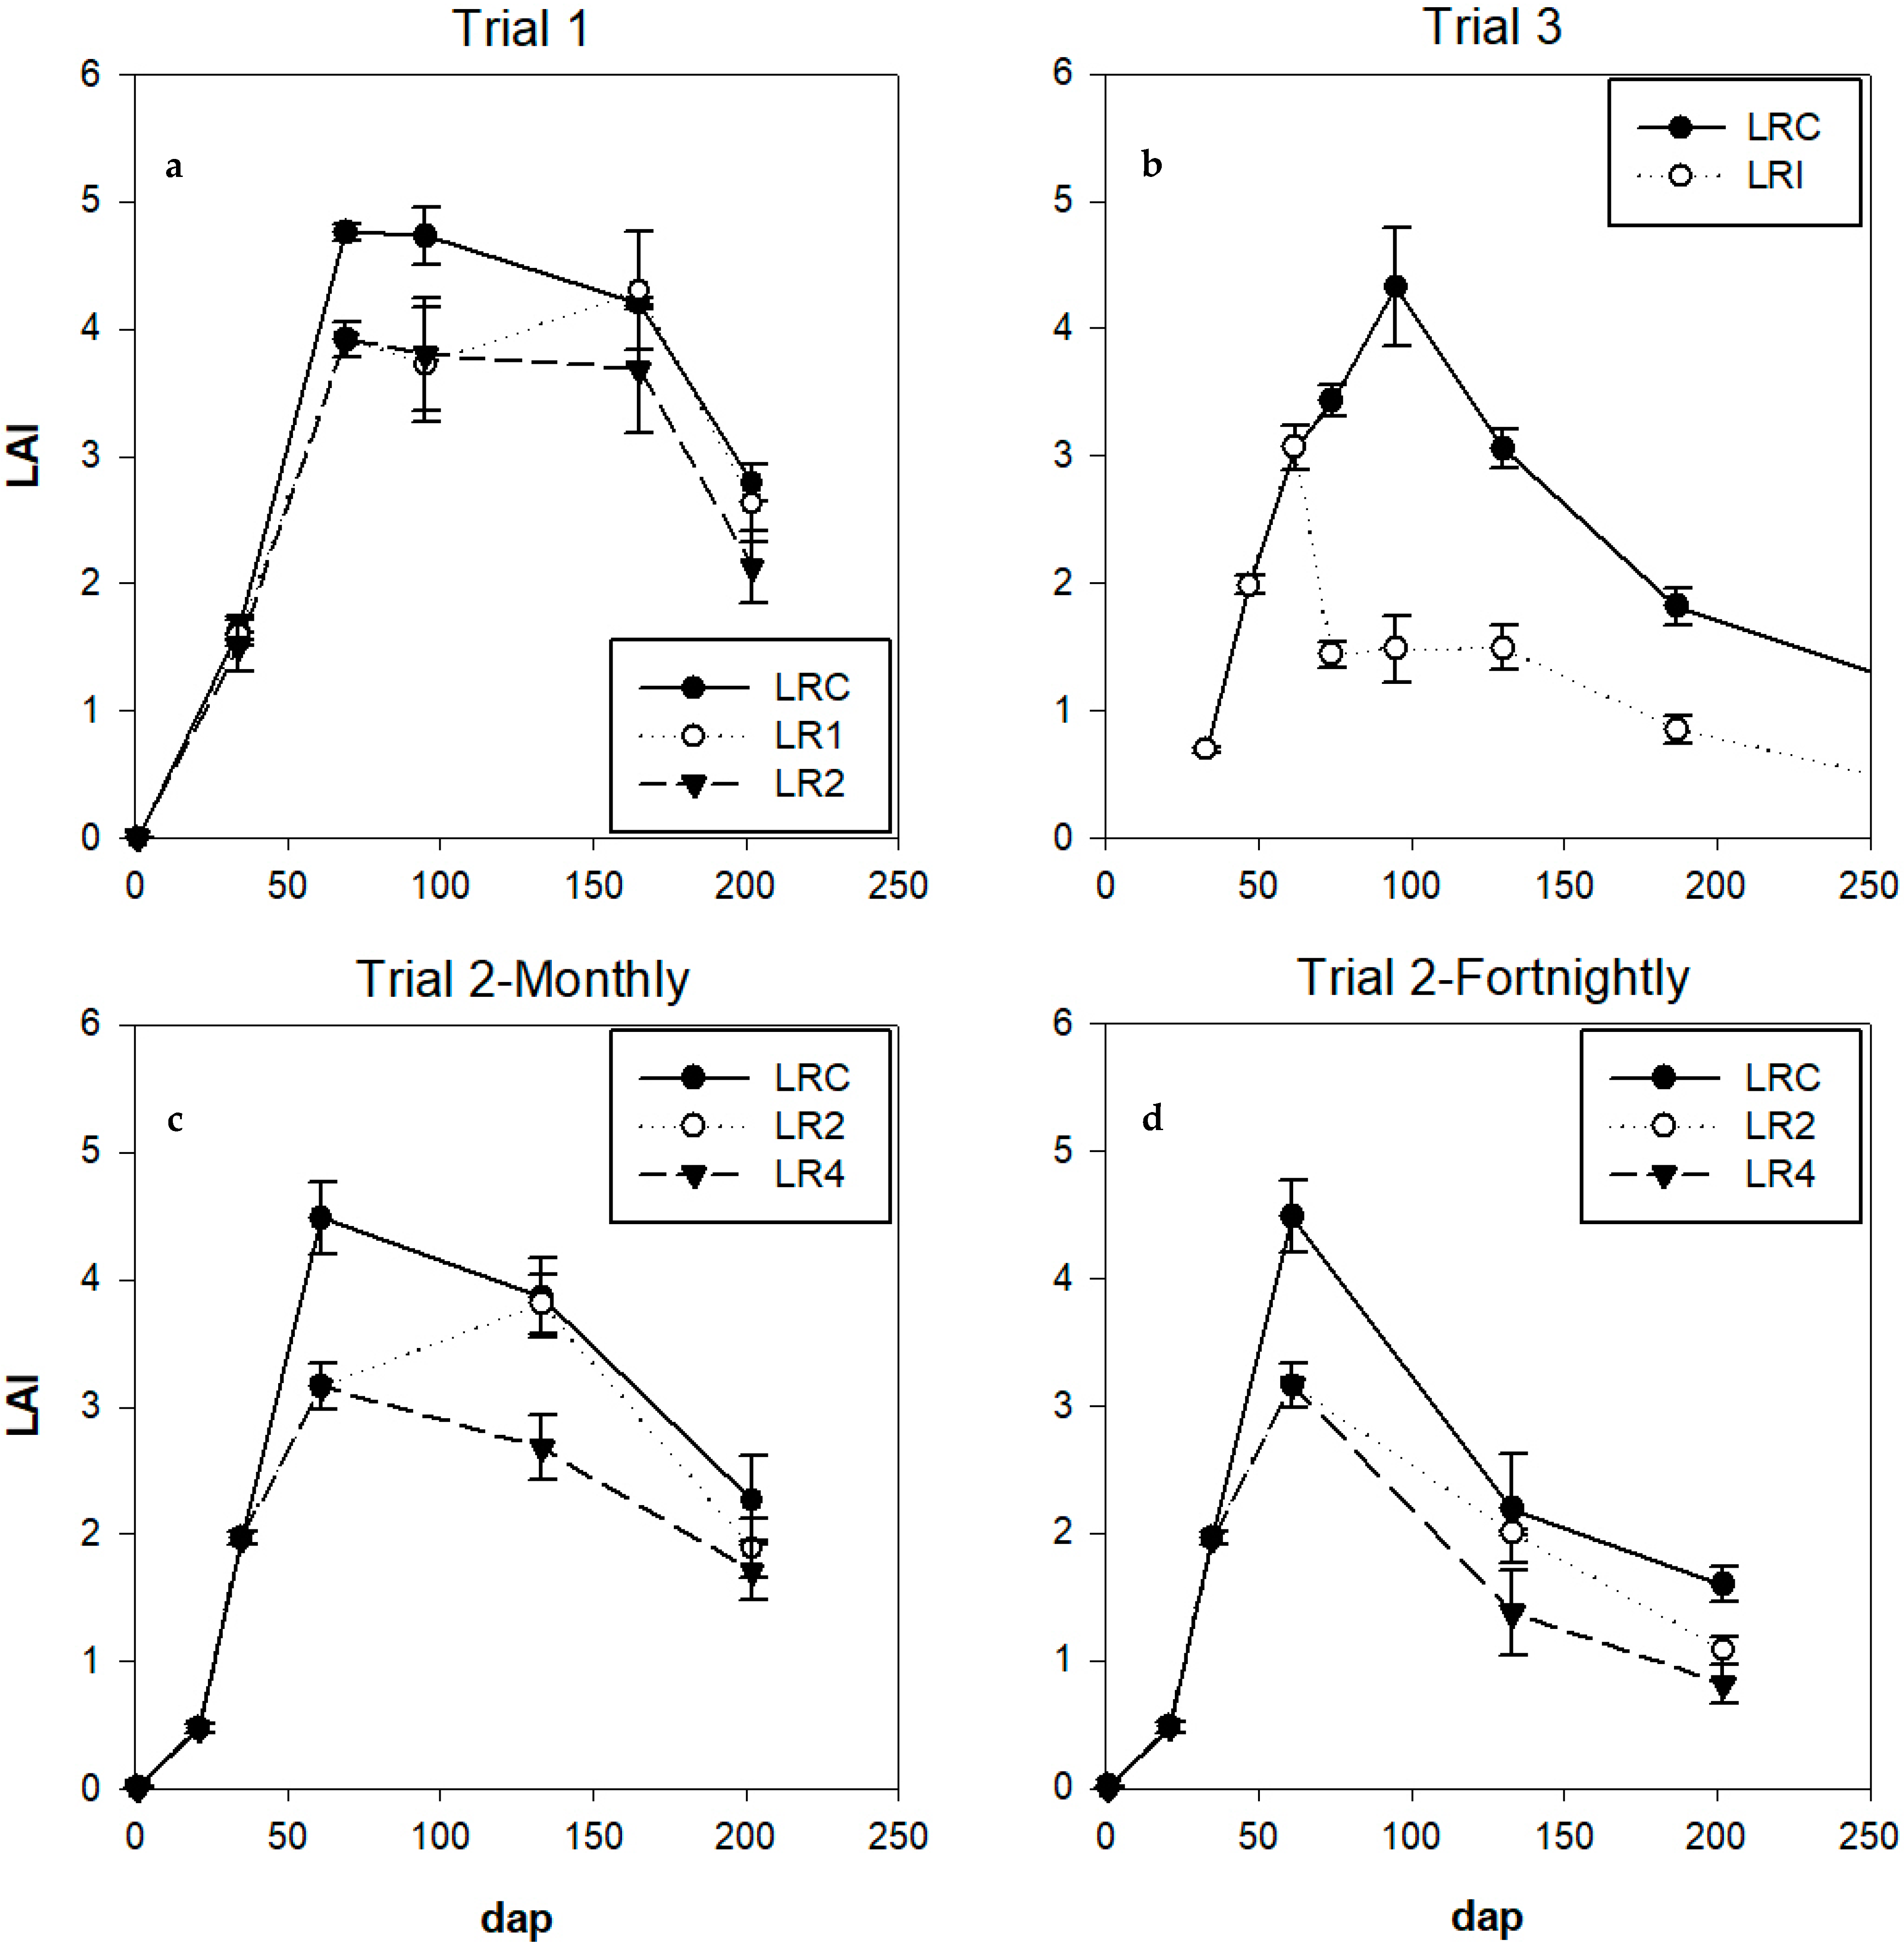
The mean LAI values between harvesting and topping in Trial 1 were 3.6 and 3.4 for LR1 and LR2, respectively, compared to 4.1 for the control, i.e., 12% and 18% reduction compared to the control, respectively (Figure 6a).
In Trial 2, the mean values were highest in the control (LRC)—3.5 and 2.8 (monthly and fortnightly frequency, respectively)—followed by LR2—3.0 and 2.1—and LR4—2.5 and 1.8. Slightly higher LAI values were obtained at the end of the period for the monthly frequency than for the fortnightly frequency (Figure 6c,d).
In Trial 3, there was a clear reduction in LAI in LRI compared to the LRC treatment, most marked between 80 and 150 days after planting (Figure 6b). The mean values were 2.8 for LRC and 1.5 for LRI: a 48% reduction. Only in this trial were clear differences in SLA observed between treatments, with mean values from the start of leaf removal of 200.9 cm2·g−1 in LRI versus 175.0 cm2·g−1 in LRC.
In all trials, a reduction in LAI was observed after 3 months of cultivation, coinciding with an increase in radiation at the beginning of spring.
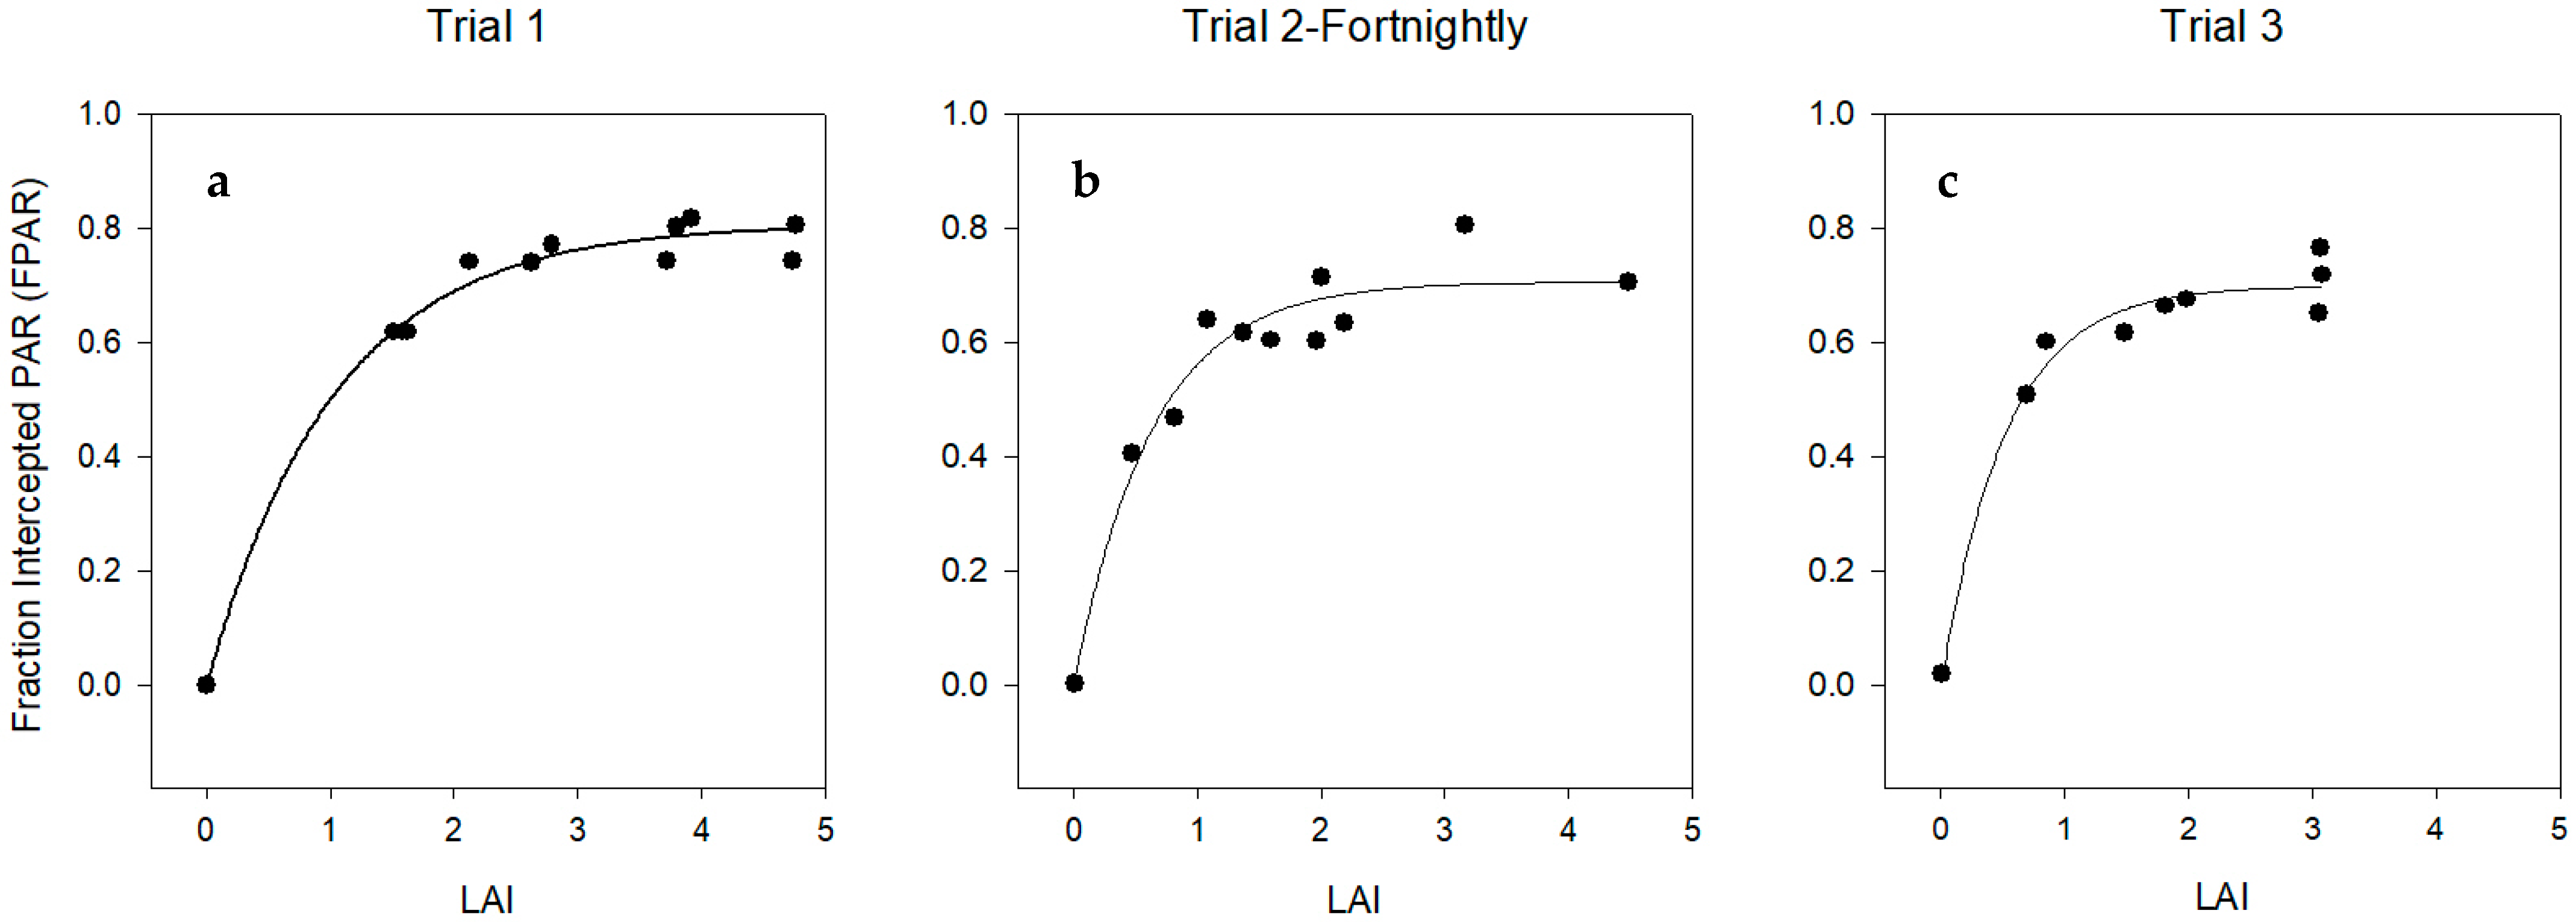
There was an exponential relationship between LAI and the fraction of PAR (FPAR) intercepted, as measured in Trials 1, 2 (fortnightly) and 3 (Figure 7), determined by the equation described by [14,15] based on the Bouguer–Lambert–Beer law or exponential ratio of light extinction: FPAR = a × (1 − exp(−k × LAI)). The LAI saturation value was around 2.0, above which the fraction of radiation intercepted by the crop hardly increased. The limitation observed in the maximum fraction of radiation intercepted (between 0.65 and 0.80 depending on the treatments) relates to the arrangement of the crop in rows that do not occupy the entire crop surface, such that part of the incident radiation is not intercepted by the crop. However, a row arrangement and correct orientation of the rows (N–S) could explain the observed values for k (extinction coefficient) being higher than 1 in Trials 2 and 3 (Figure 7), as this improves radiation interception on the vertical plane as compared to a horizontal crop. However, in trial 1, the extinction coefficient k reached a value close to 1, perhaps due to the higher LAI of the plants caused by a less intense leaf removal compared to trials 2 and 3, which could reduce the radiation intercepted in the vertical plane.

3.2.2. Trusses

As in the case of leaf emission, neither leaf removal type nor frequency had a significant influence on the number of trusses emitted per stem in any of the trials.
As for the number of flowers per stem, no significant differences were found between treatments (Table 2), although in Trial 3 a tendency towards flower abortion was observed in the LRI treatment (p = 0.065), mainly after 200 days from planting, with 16.6% fewer viable flowers than in the control (Table 2).

3.2.3. Biomass

Biomass Production

No significant differences in biomass production were found between the control and leaf removal treatments LR1, LR2 and LR4. However, there was a significant decrease in the total biomass produced by intensive leaf removal (LRI) in comparison to the control (p = 0.0007) (Table 3).

Radiation Use Efficiency (RUE)

There was a high correlation in the linear relationship between biomass production and cumulative incident PAR in all treatments (Figure 8). Radiation use efficiency tended to decrease when leaf removal intensity increased. For example, in Trial 3, it was observed that LRI treatment yielded 2.1 g·MJ−1 compared to 2.5 g·MJ−1 in the control treatment (LRC) (Figure 8b).
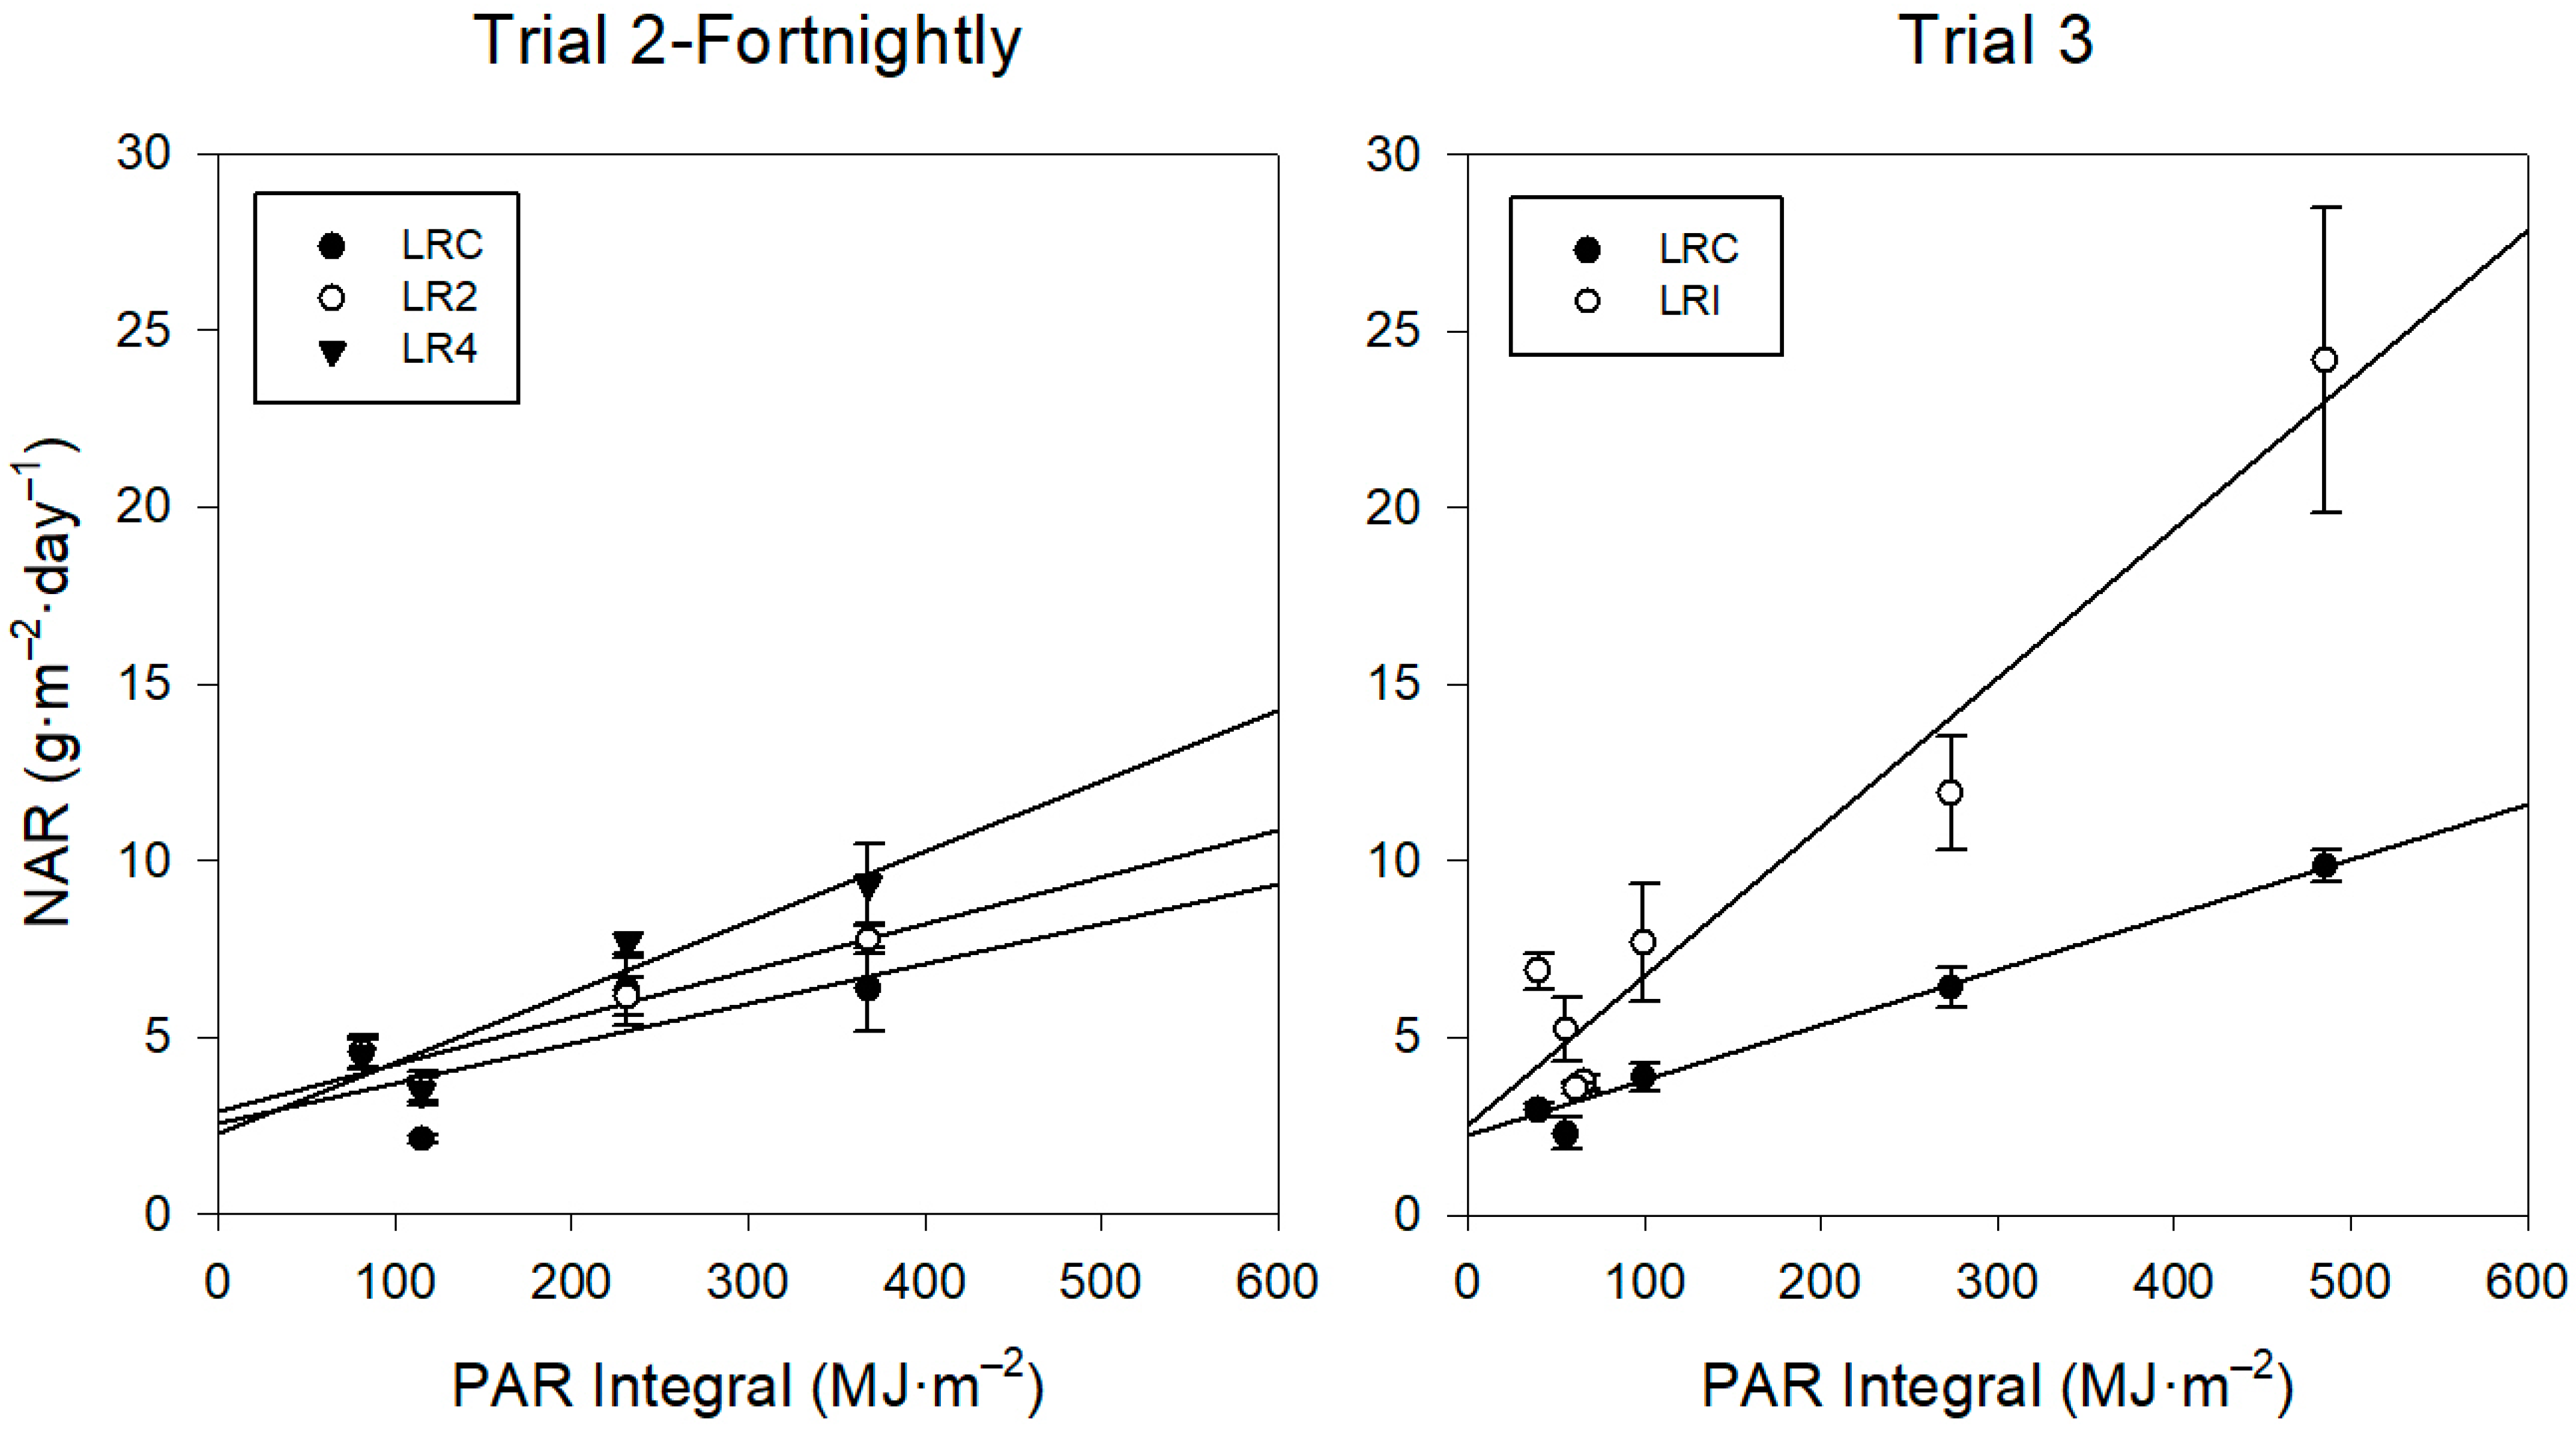
The net assimilation rate (NAR) is directly related to the incident PAR integral over the same period, with its value increasing the greater the density of leaf removal (Figure 9).

Assimilate Distribution

In the final allocation of biomass to the different organs of the plant, no significant differences were observed between treatments in any of the trials, with 20–27% of the total dry matter in the leaves and 51–61% in the fruits (Table 4).
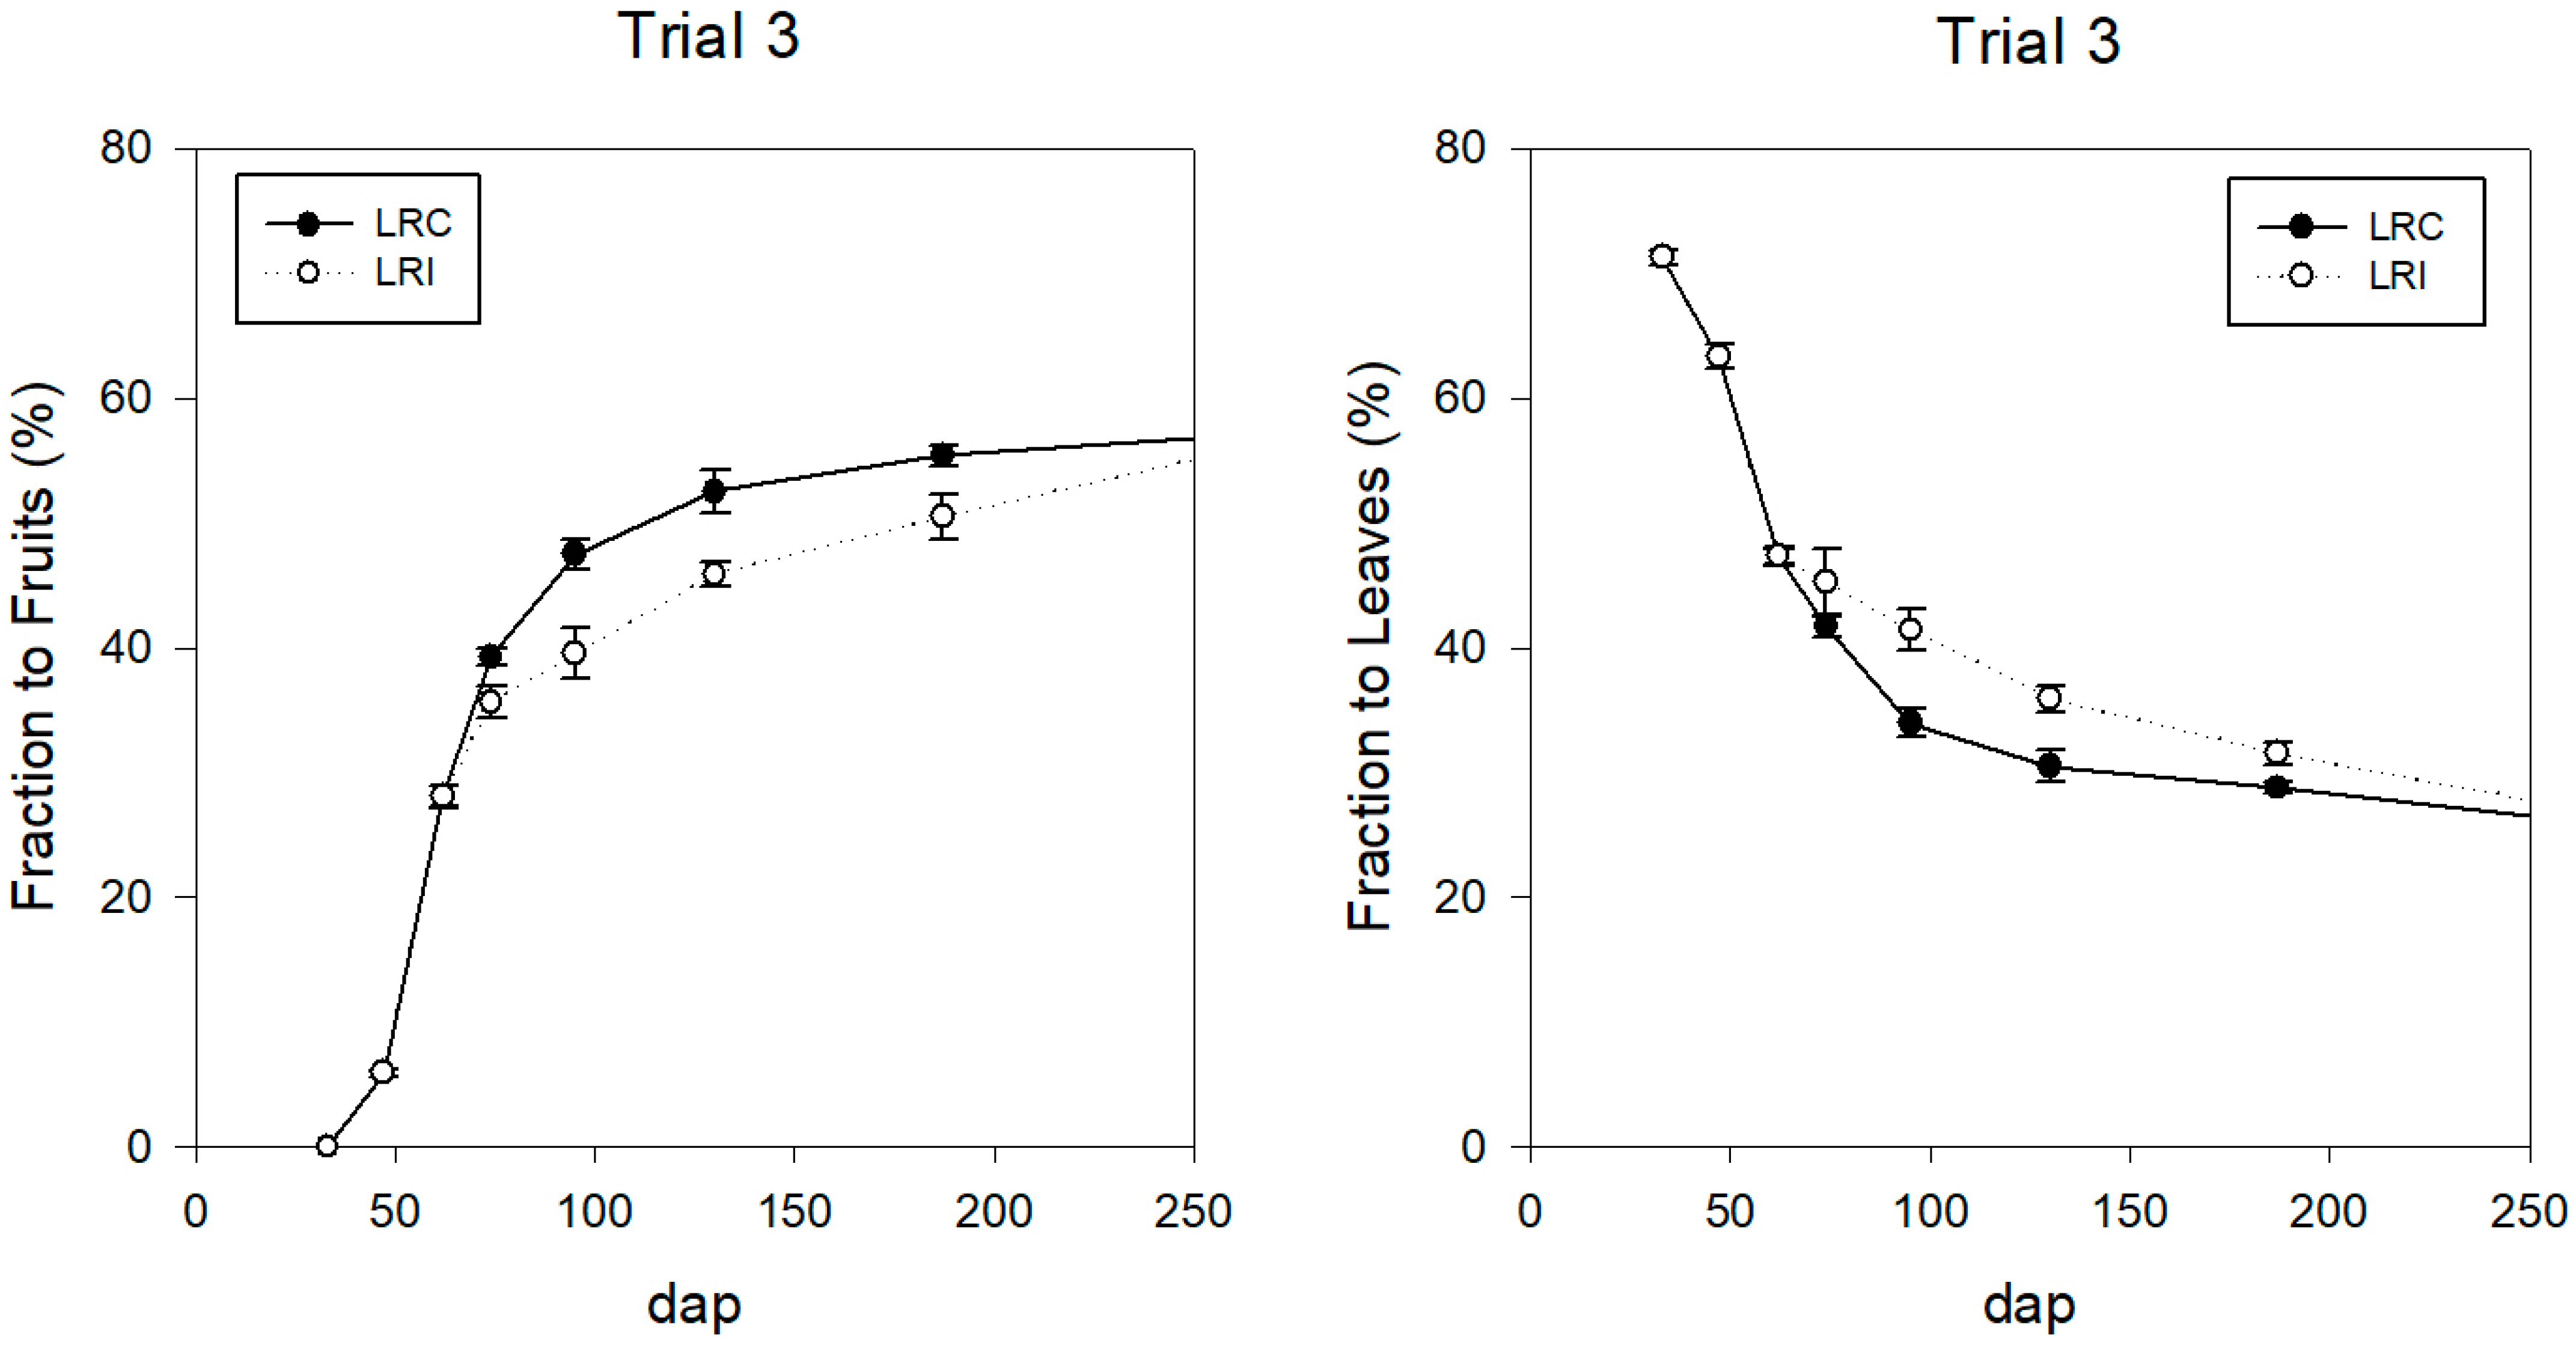
In the evolution of the fractions of dry matter allocated to fruit and leaves during the growing cycle, differences were only found in Trial 3 (Figure 10). The most intensive leaf removal treatment (LRI) produced a reduction in the fraction allocated to fruit and an increase in the fraction allocated to leaves at the beginning of defoliation. At 95 dap (one month after the first defoliation), the largest differences were found: 47.6% fruit fraction in LRC versus 39.5% in LRI (p = 0.058). In the case of the fraction allocated to leaves, LRC had 33.9% and LRI 41.4% (p = 0.044). Towards the end of the season, equal fractions of dry matter were allocated to leaves and fruits.

3.3. Yield Components

3.3.1. Fruit Yield and Size

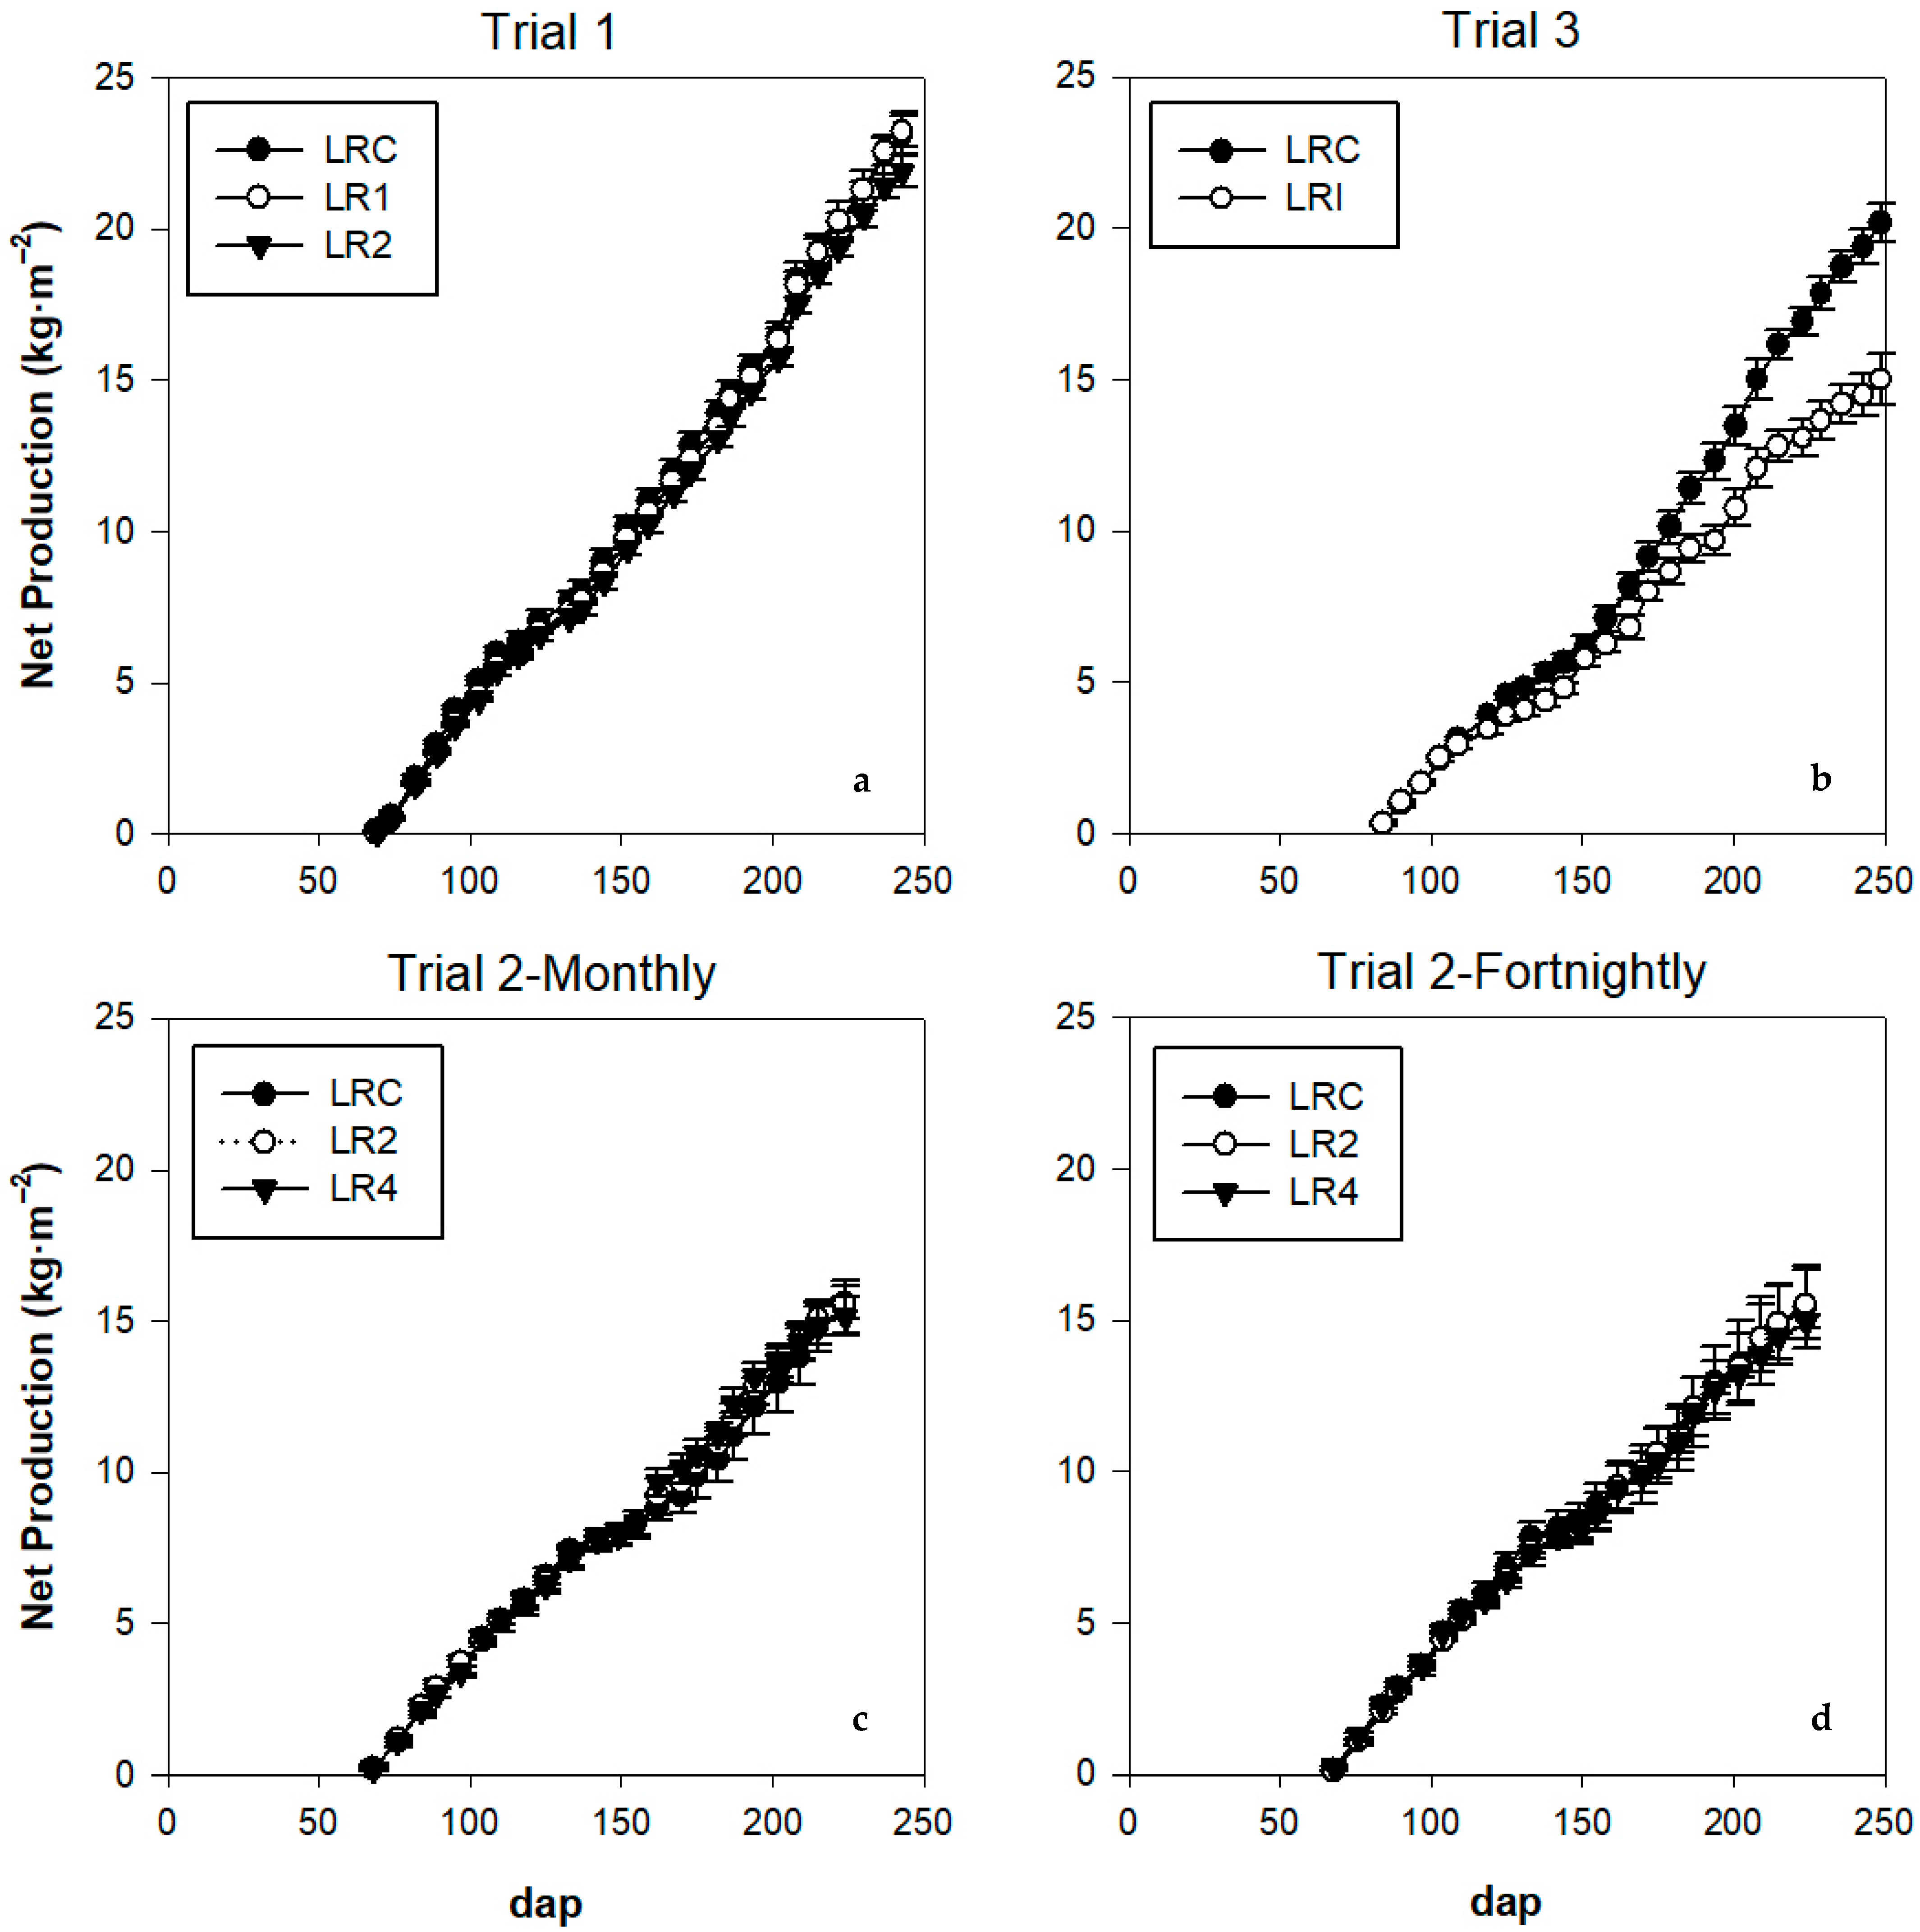
In Trial 1, no differences in yield or fruit size were found between treatments LR1, LR2 and the control. In Trial 2, the total yield of the LR4 treatment was significantly lower than that of the LRC and LR2 leaf removals (p = 0.0089). However, no significant differences were found in net yield as culled fruit was lower in the LR4 treatment than in LR2 and the control (LRC) (p = 0.0018) (Table 5; Figure 11a,c,d).
In Trial 3, both commercial (p = 0.0049) and total (p = 0.027) yields for the LRI treatment were significantly lower than the control (Table 5). The largest differences were observed from 200 dap upwards (Figure 11b).
No differences in fruit size were observed in any of the three trials.

3.3.2. Harvest Index

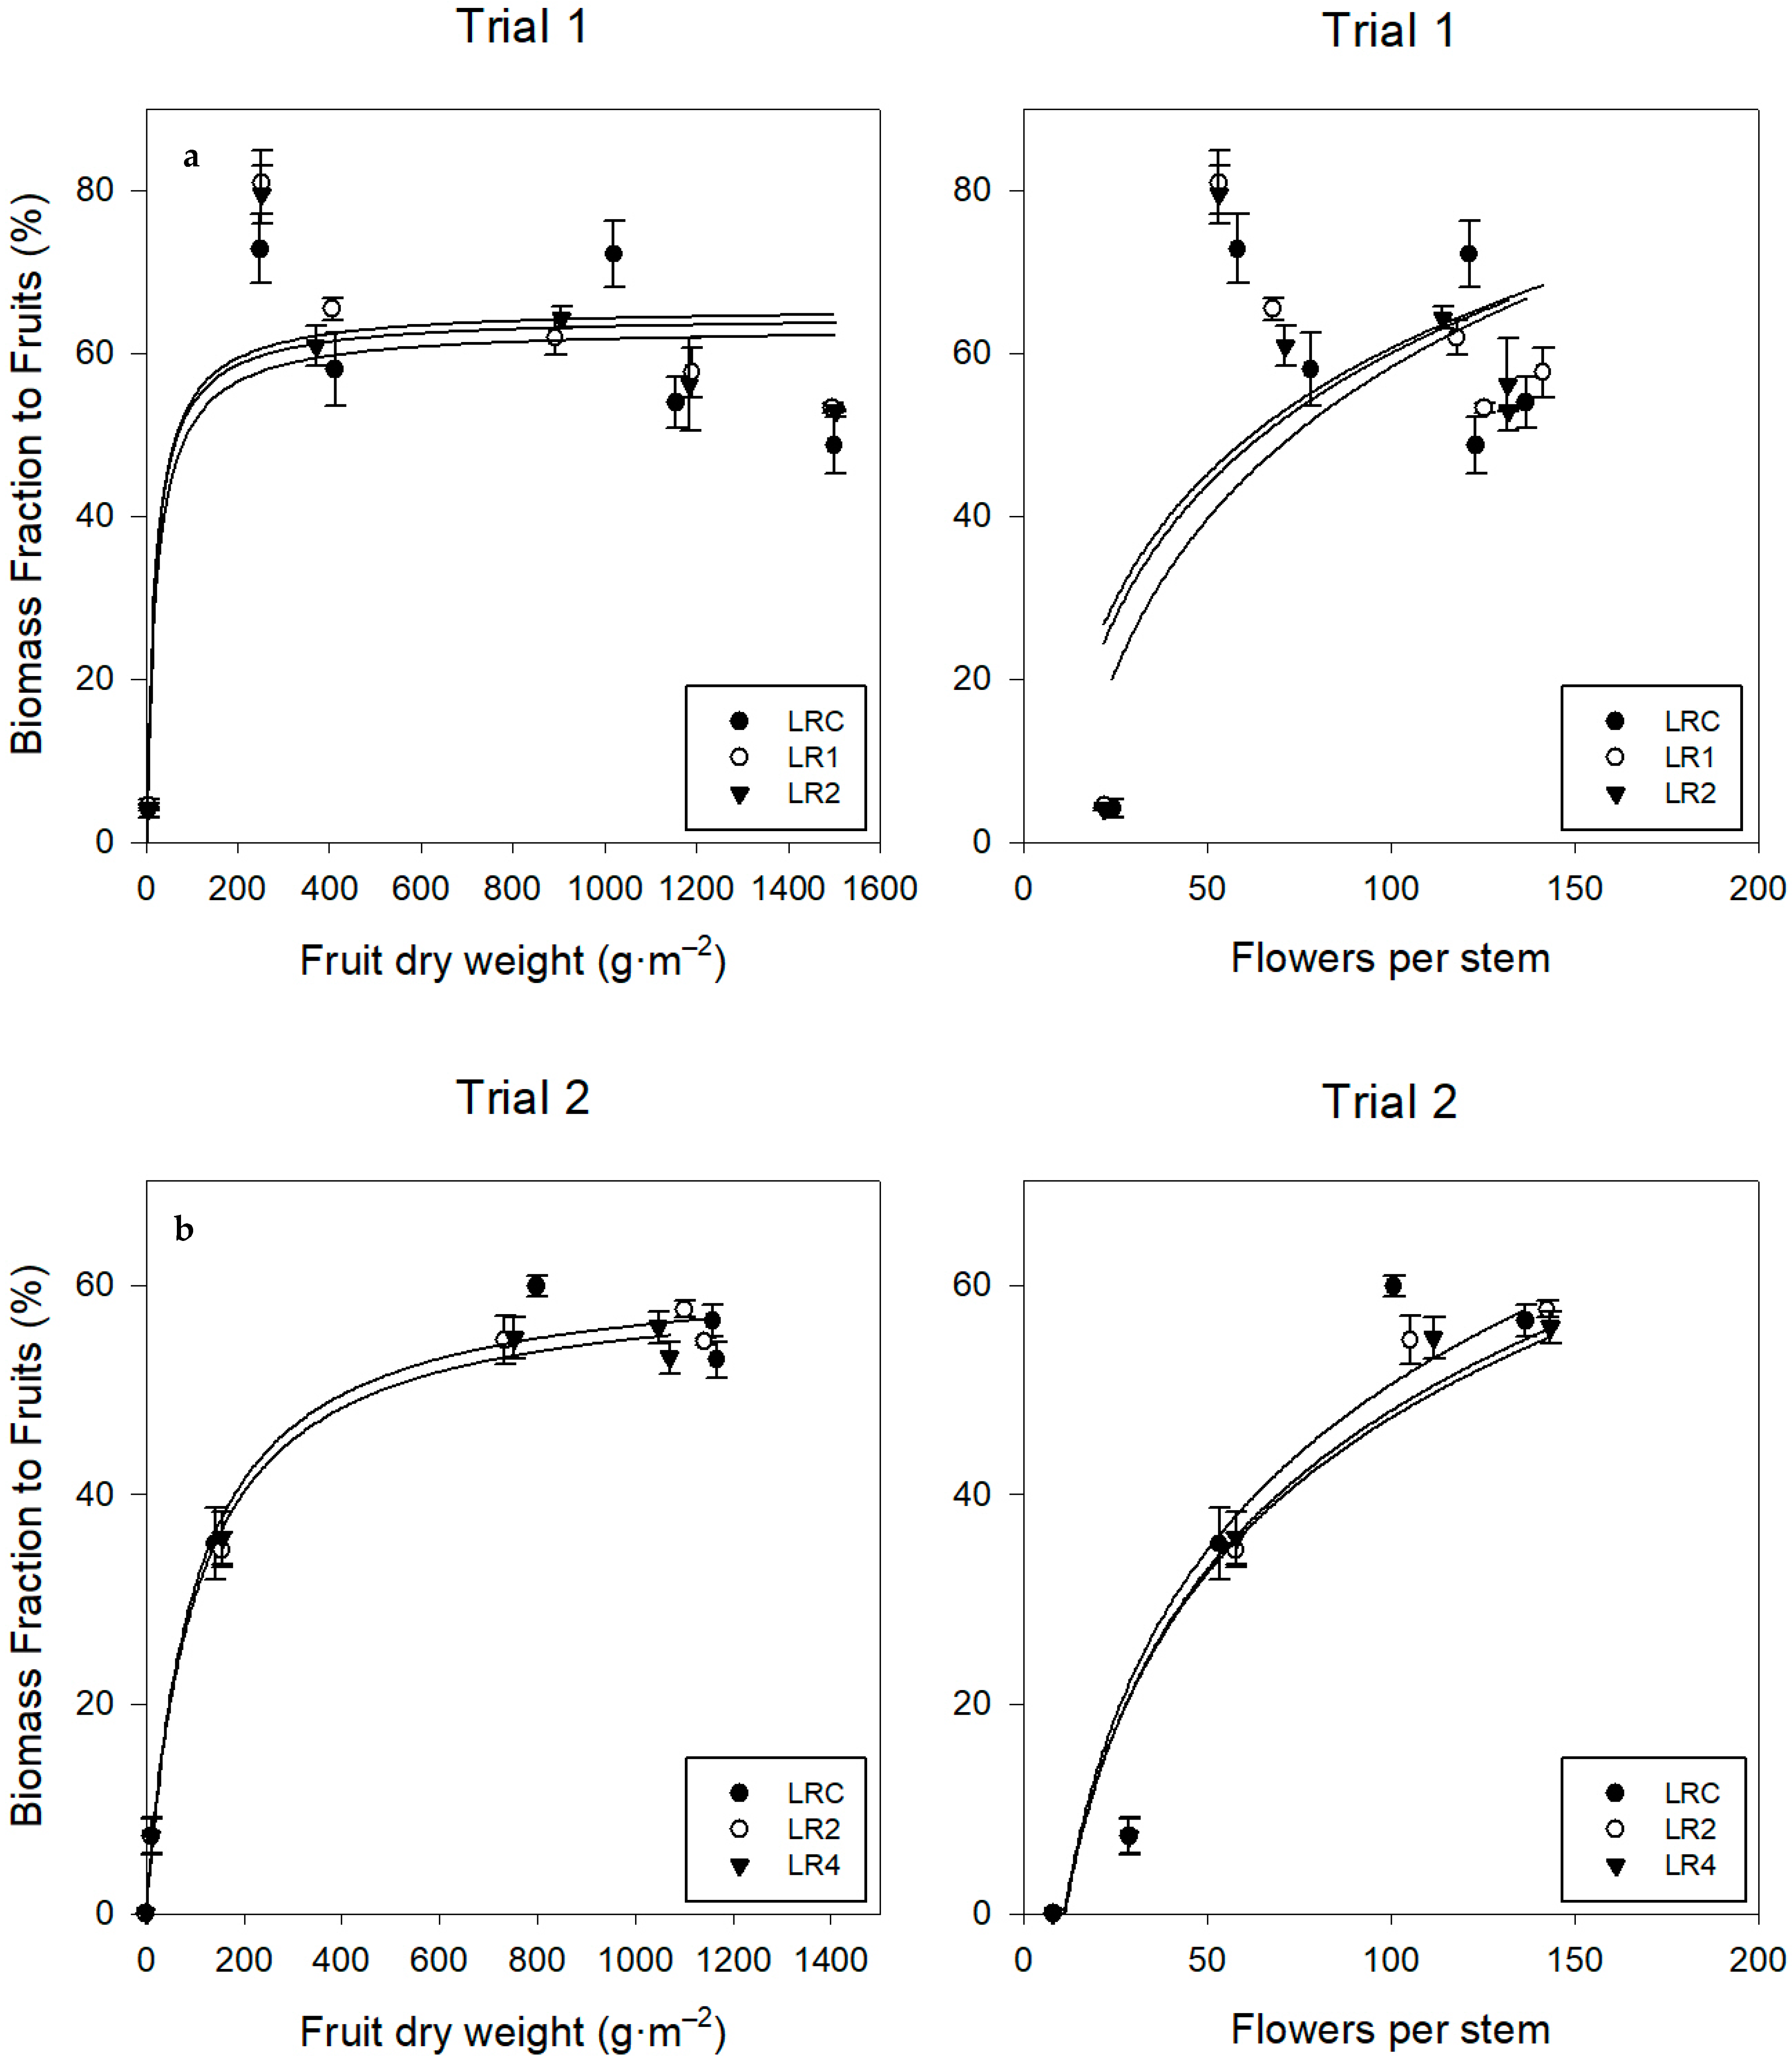
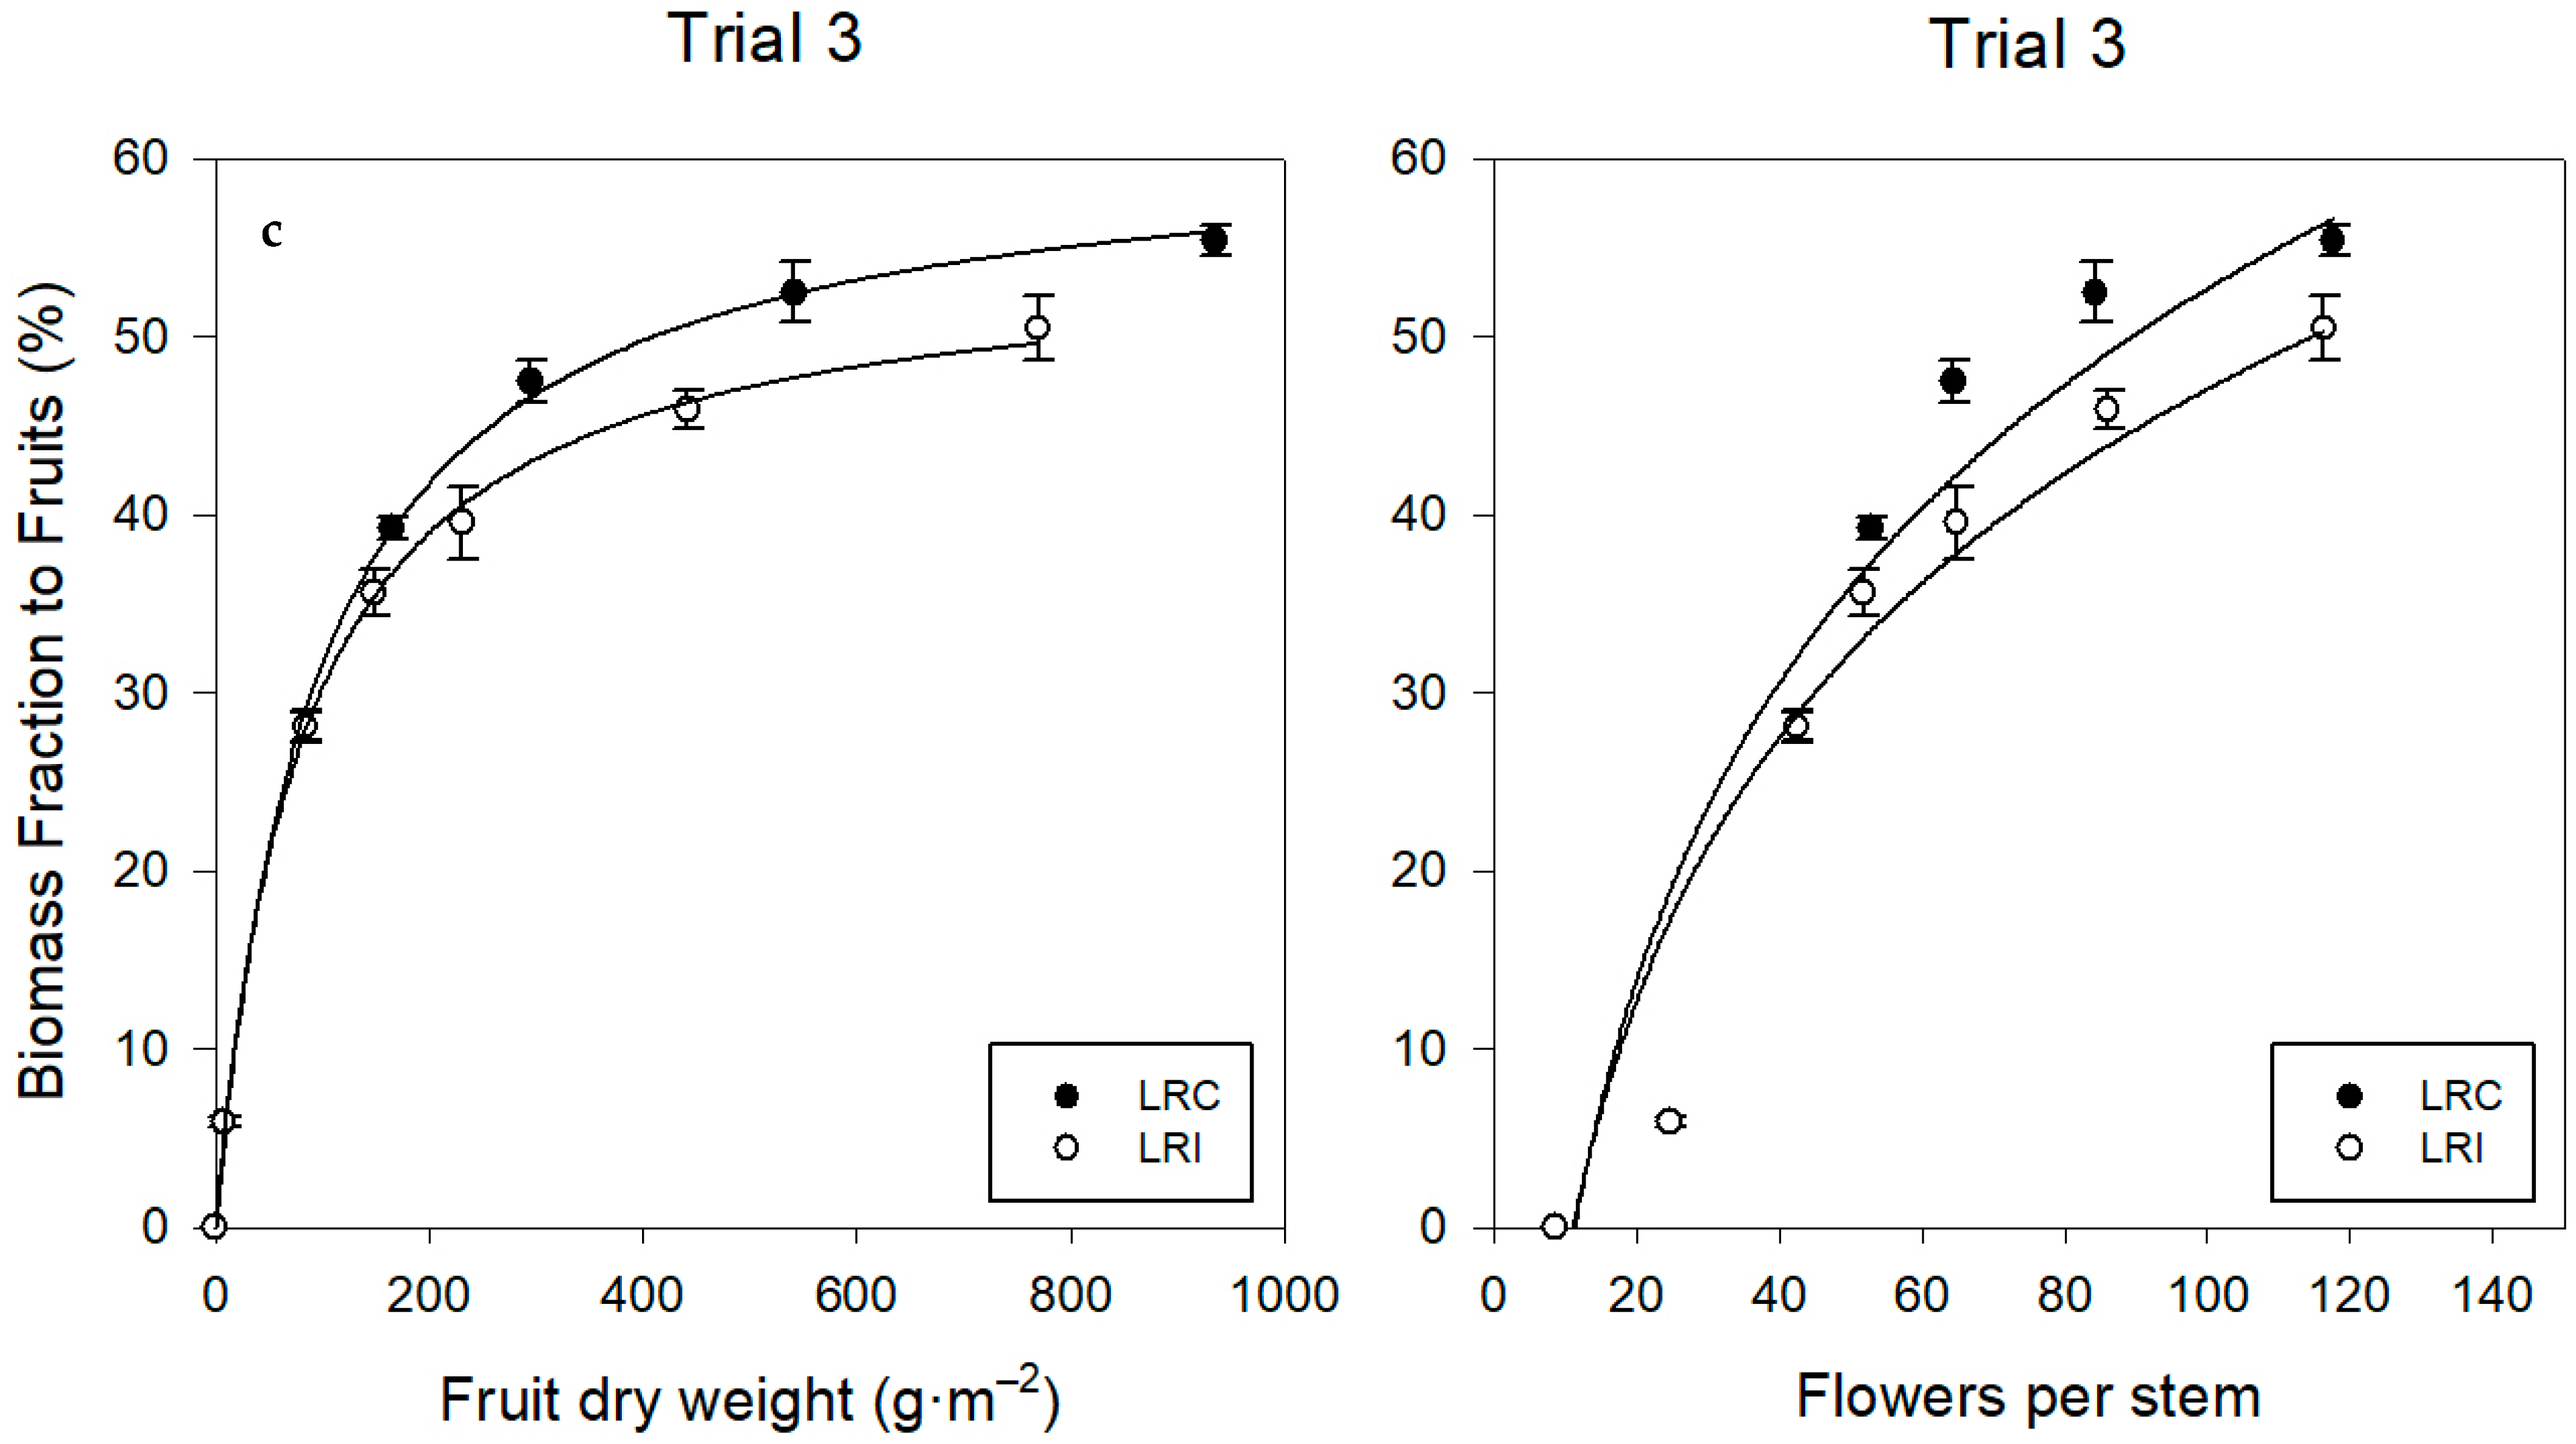
A similar harvest index was obtained in all leaf removal treatments, with 51–61% of dry matter allocated to the fruit. In Trial 3, there was a strong correlation between the distribution of assimilates to the fruit and the dry weight of the fruit; this influence was less pronounced at 400 g.m−2 and above. Similarly, a strong correlation was observed between the fraction of biomass allocated to the fruit and the number of flowers per stem (Figure 12). In trials 1 and 2, correlation levels were not as high for these variables.

4. Discussion

4.1. Leaves

4.1.1. Number of Leaves

Leaf emission was independent of leaf removal intensity. This is consistent with findings in the literature where no change in leaf emission rate has been observed when varying fruit load, leaf pruning or planting density [16,17,18].

4.1.2. Leaf Area Index (LAI) and Specific Leaf Area (SLA)

All leaf removal treatments had a direct effect on the leaves by increasing the SLA value relative to the control, the more so as the intensity of leaf removal increased. This may be associated with a decrease in the source–sink relationship in the plant. In this regard, some authors have linked the increase in the source–sink relationship due to the pruning of trusses or fruit with the presence of heavier and thicker leaves, resulting in a lower SLA [16,19]. Other authors associate the increase in LAI with the effect of leaf removal on an increase in photosynthetic rate [6,20] and of the growth of the remaining leaves on the plant to compensate for the negative effect of the decrease in leaf area after leaf removal [21]. In this trial, considering the proportional relationship between the number of leaves removed and the decrease in LAI, it was not possible to confirm that defoliation stimulates the growth of the remaining leaves on the plant. Therefore, the increase in SLA could be related to the reduction in the weight and thickness of the remaining leaves caused by the modification of the source–sink relationship, also taking into account the assimilate export capacity of the young tomato leaves [22].
Regardless of leaf removal intensity, a reduction in LAI and SLA was observed in all treatments as the crop progressed, coinciding with the increase in incident radiation and mean temperature. Leaves growing under conditions of high irradiance are smaller in leaf area and heavier [23]; in addition, high temperatures reduce the individual leaf area, leading to a decrease in SLA.

4.2. Trusses and Flowers

No differences were found in the number of trusses emitted per stem in any of the trials. A lower number of viable flowers per stem was only observed in the most intense leaf removal treatments in comparison to the control towards the end of the crop (from 190 dap), consistent with studies attributing the reduction in yield when leaf removal was carried out to the reduction in the number of flowers per truss [6]. This could be a consequence of the decrease in assimilates due to the reduction of source organs in plants with intense leaf removal [24] or due to the combined action of reduced availability and greater competition for assimilates between the different organs of the plant [18]. In this respect, the apex appears to be a more potent sink than the incipient inflorescences [25]. The number of flowers on the plant therefore depends on the assimilates, as seen in this trial. There is also competition between trusses under conditions of low assimilate supply, such that fruit growth on one truss limits the flowering of subsequent trusses [26]. LAI remained below 1 from 190 dap onwards in the treatment with intense leaf removal, which could explain the increase in aborted flowers compared to the control.

4.3. Biomass

4.3.1. Biomass Production

Reduction in LAI by increasing leaf removal intensity by pruning leaves from the base to two leaves below the first, second and fourth truss above the truss close to harvesting did not influence total dry matter production compared to the control (pruning leaves from the base to two leaves below the truss close to harvesting). This fact may be related to the low influence of LAI values above 2 on radiation interception by the crop, a predominant factor in crop growth and biomass formation. With cucumbers, a lower sensitivity to intercepted radiation was also observed with an LAI close to 2, when the shaded areas under the canopy increased and the leaves were more inclined with respect to the horizontal axis, resulting in a lower proportion of leaf surface receiving light [27]. In areas of Northern Europe, where the climate and growing seasons differ, this saturation value is higher, between 3.3 and 3.5 [8,28]. This lack of response to light interception may be attributed, on the one hand, to the low light penetration in the lower layers of the plant canopy, which means a lower contribution to the net photosynthesis of these leaves [8,29,30,31] and, on the other hand, to the low photosynthetic efficiency of the older leaves in tomato and pepper plants [8,32,33,34,35].
Conversely, when LAI was maintained at a mean value of 1.5 through intensive leaf removal, total dry matter production was reduced by 15% compared to the control, with a mean LAI of 2.8, since this task affected the intercepted radiation fraction.

4.3.2. Radiation Use Efficiency (RUE) and Net Assimilation Rate (NAR)

RUE tended to decrease with leaf pruning from the base to two leaves below the fourth truss above the truss close to harvest compared to the control. This tendency was more marked as leaf removal became more intense (maintaining 12 leaves per stem). However, taking NAR into account, the plants with the most intense leaf removal were the most efficient in terms of intercepted radiation in comparison with the control, which is consistent with the findings of some authors [21,36]. This increase in NAR associated with the reduction in the source–sink relationship could be explained by changes in light interception per leaf area unit [36] rather than by the rapid rate of increase in leaf area following defoliation [21]: leaves left on the plant after intense leaf removal are more exposed to radiation and, being young, have a high photosynthetic rate compared to leaves on less intensively defoliated plants, which are more numerous but older. Other authors state that the leaves left on the plant after defoliation increase their photosynthetic rate, which partially compensates for the negative effect of defoliation [2,34], although this is not consistent with the findings reported in other studies [36].

4.3.3. Assimilate Distribution

No effect of leaf removal treatments was observed on the distribution of assimilates among the different organs of the plant. However, from the moment defoliation began, there was a trend towards a decrease in the fraction of dry matter allocated to fruit and an increase in the fraction allocated to leaves in the treatment with the most intense leaf removal (12 leaves per stem).
Overall, taking all treatments into account, most of the biomass was allocated to fruit (51–61%), followed by leaves (20–27%) and stem (10–17%). The proportion allocated to fruit was slightly lower and the proportion allocated to leaves slightly higher than other reported values [17].

4.4. Yield Components

4.4.1. Fruit Yield and Size

Intensive leaf removal was the only treatment with a significantly lower yield value, 17% less than the control. This treatment kept 12.5 leaves/stem and an average LAI of 1.5 compared to 24 leaves/stem and an LAI of 2.8 for the control, a reduction of about 50% in both parameters. However, in some studies, no decrease in yield was found when LAI was reduced to 50% [29], although in that case the lowest LAI value was 2.6.
The biggest differences in net yield between the treatment with the most intense leaf removal and the control started at about 200 dap. About 2 months earlier, considered as the period of fruit development mainly dependent on temperature [7,37], the LAI of intense leaf removal remained below 1.5, which could explain the observed reduction in yield. A similar effect was observed with LAI between 1.5 and 2.0 in summer conditions, negatively affecting yield, photosynthesis and fruit quality [17,38].

4.4.2. Harvest Index

The pruning of leaves from the base to two leaves below the first, second and fourth truss above the truss close to harvest did not influence the distribution of assimilates to the fruit relative to the control, with an HI between 51.0 and 61.5% depending on the crop year. A source–sink unit is considered to consist of a truss and the three leaves below it [2] but this relationship is not absolute as there are overlaps in the source–sink relationships that compensate for losses in assimilate supply when some leaves are removed [26]. Therefore, it seems that this source–sink relationship is maintained in our conditions when pruning up to 10 leaves more than in the control.
In the most intense leaf removal treatment, a decrease of 8.1% in the fraction of dry matter allocated to the fruit was observed after the start of pruning (95 dap), coinciding with an increase of 7.5% in the fraction of dry matter allocated to the leaves, compared to the control. The fraction of assimilates distributed to the fruit is influenced by the number of fruits on the plant either due to their weight, there being a relationship between organ sink strength and size [16,24], or due to their age, quantified as potential growth rate [17,39]. In our case, the lower distribution of assimilates to the fruit observed from the beginning of leaf removal in the most intense treatment did not seem to be related to the reduction in the number of viable flowers per stem, as it occurred towards the end of the growing cycle. It seems that rather than the number or strength of sinks, it was the source–sink relationship that influenced the distribution of assimilates to the fruit: removing leaves that were still acting as a source seemed to reduce the rate of export of assimilates from the remaining leaves [34], such that they maintain the level necessary for their activity and, at the same time, increase the distribution of assimilates to the apical part, probably to compensate for the reduced photosynthate supply due to leaf removal.
However, at the end of the growing cycle, there were no significant differences between the intense leaf removal treatment and the control in the partitioning of dry matter between the different plant organs, reaching an HI between 56 and 57%, values somewhat lower than those cited by other authors [17,39].

5. Conclusions

LAI saturation values under our conditions were around 2.0, as the fraction of intercepted radiation did not increase above this value. With an average LAI during the production period of 1.8, no differences were found in total dry matter production or in the fraction of assimilates distributed to the harvestable part, and therefore in the final yield of the crop, compared to a control with an average LAI above 2.8. However, the decrease in LAI to 1.5 resulted in a 15% decrease in biomass produced and a 17% decrease in yield, (compared to a LAI value of 2.8 for the control). This decrease in yield of the heavily defoliated plants can be explained by the reduction in the fraction of intercepted radiation as the LAI decreases, which in turn influences biomass production. In addition, both the reduced fraction of dry matter allocated to the fruits from the beginning of leaf removal (with maximum values of 8%) and the decrease in viable flowers (17%), especially at the end of the growing cycle with LAI values below 1.0, may also have had an influence on production.
Defoliation had a direct effect on the leaf by increasing the SLA relative to the control, associated with the presence of thinner and lighter leaves as the source–sink relationship was reduced. Regardless of leaf removal intensity, both LAI and SLA decreased towards the end of the growing cycle, as incident radiation increased with a consequent decrease in leaf area, despite maintaining the same number of leaves. This suggests the desirability of increasing the number of leaves present in the final period of cultivation as received radiation increases.
Although the RUE showed a tendency to decrease as leaf removal intensity increased, the NAR was higher in the plants with a greater number of leaves removed, associated with greater photosynthetic efficiency due to a higher proportion of young leaves that were more exposed to light than in the control.
As a result, to avoid yield losses in our conditions, LAI should be kept above 2, suggesting a number of leaves per stem above 15 (preferably around 20) to be considered when leaf removal is carried out.

Author Contributions

Conceptualization, M.d.C.C., V.R. and D.R.; methodology, V.R., M.d.C.C., D.R. and M.P.; software, V.R. and M.d.C.C.; validation, V.R., M.d.C.C. and M.P.; formal analysis, V.R.; investigation, M.d.C.C., M.P., D.R. and V.R.; resources, M.d.C.C. and M.P.; data curation, V.R., M.P. and M.d.C.C.; writing—original draft preparation, V.R.; writing—review and editing, D.R., M.P., B.S. and V.R.; visualization, V.R., D.R., M.P. and B.S.; supervision D.R., M.P. and B.S.; project administration, M.d.C.C.; funding acquisition, M.d.C.C. and M.P. All authors have read and agreed to the published version of the manuscript.

Funding

This research was funded by projects RTA2005-00142-C02-01 and RTA2006-00157-00-00-00 of the National Subprogramme for Agricultural Resources and Technologies in coordination with the Autonomous Communities of the National Institute for Agricultural and Food Research and Technology (INIA), and the INTEAGRACAN Project ‘Integrated Agrarian Technological Packages for Covered Horticulture in the Canary Islands, Following Sustainability and Ecocompatibility Criteria’ from the Priority R&D Programs of the Canary Islands Government.

Data Availability Statement

The original contributions presented in this study are included in the article. Further inquiries can be directed to the corresponding author.

Acknowledgments

The authors would like to acknowledge the support and collaboration given by the ICIA workers who have contributed to ensuring that the crops and necessary measures were managed correctly.

Conflicts of Interest

The authors declare no conflict of interest. The funders had no role in the design of the study; in the collection, analyses, or interpretation of data; in the writing of the manuscript; or in the decision to publish the results.

References

  1. Jones, J.P. Tolerance of tomato to manual defoliation. Proc. Fla. State Hortic. Soc. 1979, 92, 99–100. [Google Scholar]
  2. Tanaka, A.; Fujita, K. Nutrio-physiological studies on the tomato plant. Soil Sci. Plant Nutr. 1974, 20, 305–315. [Google Scholar] [CrossRef]
  3. Picken, A.J.F.; Stewart, K.; Klapwijk, D. 1986. Germination and vegetative development. In The Tomato Crop: A Scientific Basis for Improvement; Atherton, J.G., Rudich, J., Eds.; Chapman & Hall Ltd.: London, UK; New York, NY, USA, 1986; pp. 111–166. [Google Scholar]
  4. Andriolo, J.L.; Falcão, L.L.; Duarte, T.S.; Skrebsky, E.C. Defoliation of greenhouse tomato plants and its effects on dry matter accumulation and distribution to fruits. Acta Hortic. 2001, 559, 123–126. [Google Scholar] [CrossRef]
  5. Kinet, J.M. Effect of defoliation and growth substances on the development of the inflorescence in tomato. Sci. Hortic. 1977, 6, 27–35. [Google Scholar] [CrossRef]
  6. Wolk, J.O.; Kretchman, D.W.; Ortega, D.G. Response of tomato to defoliation. J. Am. Soc. Hortic. Sci. 1983, 108, 536–540. [Google Scholar] [CrossRef]
  7. Heuvelink, E. Developmental processes. In Tomatoes; Heuvelink, E., Ed.; CABI Publishing: Oxford, UK, 2005; pp. 53–83. [Google Scholar]
  8. Acock, B.; Charles-Edwards, A.; Fitter, D.J.; Hand, D.W.; Ludwig, L.J.; Wilson, W.J.; Withers, A.C. The contribution of leaves from different levels within a tomato crop to canopy net photosynthesis: An experimental examination of two canopy models. J. Exp. Bot. 1978, 29, 815–827. [Google Scholar] [CrossRef]
  9. Grimaldi, C.A.; Carbone, A.; Garbi, M.; García, N.; Barrenechea, M.; Martínez, S.; Giménez, D. Incidence of leaf removal on the redistribution of assimilates in tomato (Lycopersicon esculentum Mill.). Acta Hortic. 2003, 614, 567–571. [Google Scholar] [CrossRef]
  10. Martínez, S.; Grimaldi, M.C.; Garbi, M.; Artur, M. Defoliation effect at three phenological stages upon tomato (Lycopersicon esculentum Mill.) yield under greenhouse. Agric. Técnica 2001, 61, 522–526. [Google Scholar]
  11. Xiao, S.; Heuvelink, E. Effect of synchronous leaf pruning on optimal distribution of dry matter in greenhouse tomato. Acta Hortic. Sin. 2005, 32, 510–512. [Google Scholar]
  12. Xiao, S.; Van der Ploeg, A.; Bakker, M.; Heuvelink, E. Two instead of three leaves between tomato trusses: Measured and simulated effects on partitioning and yield. Acta Hortic. 2004, 654, 303–309. [Google Scholar] [CrossRef]
  13. Watson, D.J. Comparative physiological studies on the growth of field crops: I. Variation in net assimilation rate and leaf area between species and varieties within and between years. Ann. Bot. 1947, 11, 41–76. [Google Scholar] [CrossRef]
  14. Russell, G.; Jarvis, P.G.; Monteith, J.L. Absorption of Radiation by Canopies and Stand Growth. In Plant Canopies: Their Growth Form and Function; Cambridge University Press: Cambridge, UK, 1989; pp. 21–39. [Google Scholar]
  15. Monsi, M.; Saeki, Y.T. Uber den Lichtfaktor in den Pflanzengesellschaften und seine Bedeutung für die Stoffproduktion. Jpn. J. Bot. 1953, 14, 22–52. [Google Scholar]
  16. Heuvelink, E.; Buiskoll, R.P.M. Influence of sink-source interaction on dry matter production in tomato. Ann. Bot. 1995, 75, 381–389. [Google Scholar] [CrossRef]
  17. De Koning, A.N.M. Growth of a tomato crop: Measurements for model validation. Acta Hortic. 1993, 328, 141–146. [Google Scholar] [CrossRef]
  18. Sandri, M.A.J.; Andriolo, J.L.; Witter, M.; Ross, T.D. High density of defoliated tomato plants in protected cultivation and its effects on development of trusses and fruits. Hortic. Bras. 2002, 20, 485–489. [Google Scholar] [CrossRef]
  19. Heuvelink, E.; Marcelis, L.F.M. Influence of assimilate supply on leaf formation in sweet pepper and tomato. J. Hortic. Sci. 1996, 71, 405–414. [Google Scholar] [CrossRef]
  20. Shishido, Y.; Kumakara, H.; Hori, Y. Changes in source-sink interaction by defoliation and darkening of source and sink leaf in tomato (Lycopersicon esculentum Mill.). J. Jpn. Soc. Hortic. Sci. 1993, 62, 95–102. [Google Scholar] [CrossRef]
  21. Aung, L.H.; Kelly, W.C. Influence of defoliation on vegetative, floral and fruit development in tomatoes (Lycopersicum esculentum Mill.). Proc. Am. Soc. Hortic. Sci. 1966, 89, 563–570. [Google Scholar]
  22. Hocking, P.J.; Steer, B.T. The distribution and identity of assimilates in tomato with special reference to stem reserves. Ann. Bot. 1994, 73, 315–325. [Google Scholar] [CrossRef]
  23. Hurd, R.G.; Thornley, J.H.M. An analysis of the growth of young tomato plants in water culture at different light integrals and CO2 concentrations. I: Physiological aspects. Ann. Bot. 1974, 38, 375–388. [Google Scholar] [CrossRef]
  24. Marcelis, L.F.M. Sink strength as a determinant of dry matter partitioning in the whole plant. J. Exp. Bot. 1996, 47, 1281–1291. [Google Scholar] [CrossRef] [PubMed]
  25. Kinet, J.M. Effect of light conditions on the development of the inflorescence in tomato. Sci. Hortic. 1977, 6, 15–26. [Google Scholar] [CrossRef]
  26. Ho, L.C. Tomato. In Photoassimilate Distribution in Plants and Crops: Source-Sink Relationships; Zamski, E., Schaffer, A.A., Eds.; Marcel Dekker Inc.: New York, NY, USA, 1996; pp. 709–728. [Google Scholar]
  27. Medrano, E. Gestión de Riego en Cultivo de Pepino “Cucumis sativus L.” en Sustrato: Evaluación de la Transpiración Durante la Ontogenia. Ph.D. Thesis, Universidad Politécnica de Madrid, Madrid, Spain, 1999. [Google Scholar]
  28. Heuvelink, E.; Bakkers, M.J.; Elings, A.; Kaarsemaker, R.C.; Marcelis, L.F.M. Effect of leaf area on tomato yield. Acta Hortic. 2005, 691, 43–50. [Google Scholar] [CrossRef]
  29. Adams, S.R.; Woodward, G.C.; Valdes, V.M. The effects of leaf removal and of modifying temperature set points with solar radiation on tomato yields. J. Hortic. Sci. Biotechnol. 2002, 77, 733–738. [Google Scholar] [CrossRef]
  30. Lorenzo, P. Intercepción de luz, Bioproductividad e Intercambios Gaseosos Durante la Ontogenia de un Cultivo Invernal de Pepino “Cucumis sativus L”. en Almería. Ph.D. Thesis, Universidad de Barcelona, Barcelona, Spain, 1994. [Google Scholar]
  31. Pettersen, R.I.; Torre, S.; Gislerod, H.R. Effects of leaf aging and light duration on photosynthetic characteristics in a cucumber canopy. Sci. Hortic. 2010, 125, 82–87. [Google Scholar] [CrossRef]
  32. Bolaños, J.A.; Hsiao, T.C. Photosynthetic and respiratory characterization of field grown tomato. Photosynth. Res. 1991, 28, 31–32. [Google Scholar] [CrossRef]
  33. Dueck, T.A.; Grashoff, C.; Broekhuijsen, G.; Marcelis, L.F.M. Efficency of light energy used by leaves situated in different levels of a sweet pepper canopy. Act. Hortic. 2006, 711, 201–205. [Google Scholar] [CrossRef]
  34. Shishido, Y.C.; Yun, C.J.; Yuhashi, T.; Seyama, N.; Imada, S. Changes in photosynthesis, translocation and distribution of C-14 assimilates during leaf development and the rate of contribution of each leaf to fruit growth in tomato. J. Jpn. Soc. Hortic. Sci. 1991, 59, 771–779. [Google Scholar] [CrossRef]
  35. Xu, H.L.; Gauthier, L.; Desjardins, Y.; Gosselin, A. Photosynthesis in leaves, fruits, stem and petioles of greenhouse-grown tomato plants. Photosynthetica 1997, 33, 113–123. [Google Scholar] [CrossRef]
  36. Matsuda, R.; Suzuki, K.; Nagano, A.; Higashide, T.; Takaichi, M. Responses of leaf photosynthesis and plant growth to altered source-sink balance in a japanese and a dutch tomato cultivar. Sci. Hortic. 2011, 127, 520–527. [Google Scholar] [CrossRef]
  37. Adams, S.R.; Cockshull, K.E.; Cave, C.R.J. Effect of temperature on the growth and development of tomato fruits. Ann. Bot. 2001, 88, 869–877. [Google Scholar] [CrossRef]
  38. Heuvelink, E. Evaluation of a dynamic simulation model for tomato crop growth and development. Ann. Bot. 1998, 83, 413–422. [Google Scholar] [CrossRef]
  39. Starck, Z. Photosynthesis and endogenous regulation of the source-sink relation in tomato plants. Photosynthetica 1983, 17, 1–11. [Google Scholar]
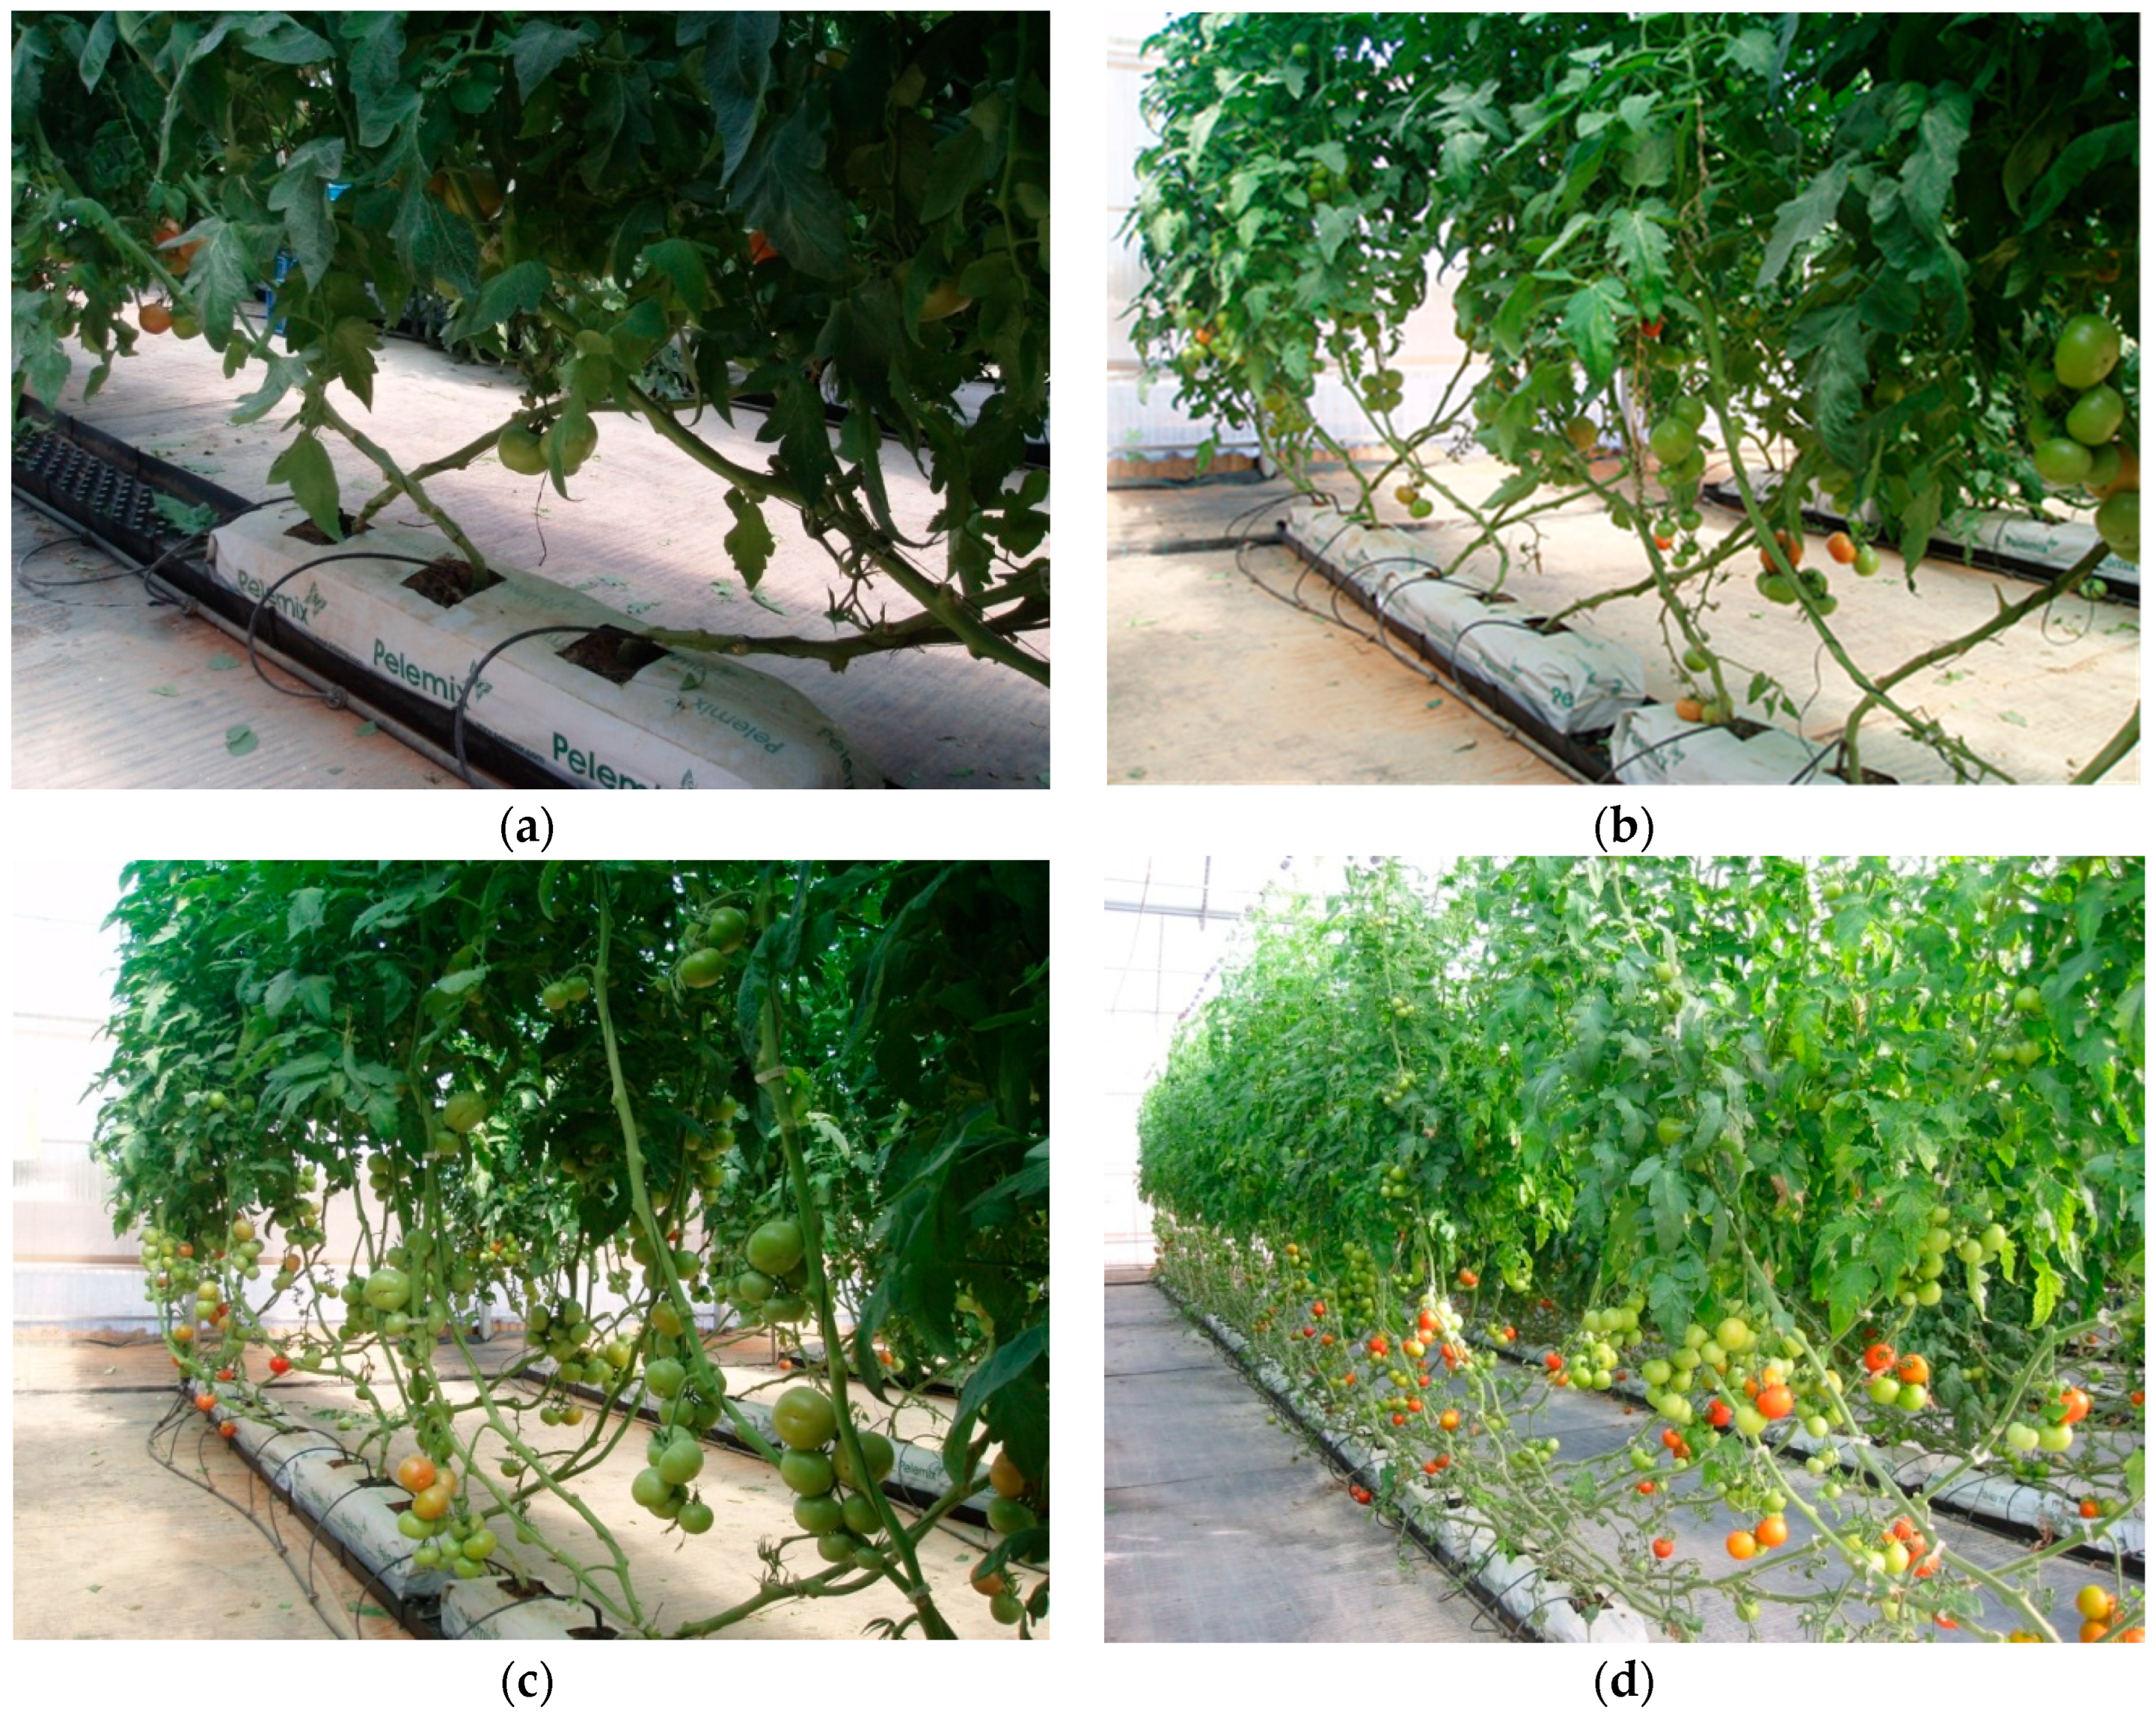
Figure 1. Types of leaf removal tested: (a) LRC, (b) LR1, (c) LR2 and (d) LR4.
Horticulturae 10 01136 g001
Figure 2. Leaf removal control (LRC) compared to leaf removal LRI during cultivation.
Horticulturae 10 01136 g002
Figure 3. Average daily temperature (°C) and daily integral of photosynthetically active radiation (PAR) (MJ·m−2·day−1) inside the experimental greenhouse throughout the three growing cycles.
Horticulturae 10 01136 g003
Figure 4. Total number of leaves emitted per stem throughout the growing cycle with adjustment equation: (a) Trial 1, regression eq. LRC: y = 0.27x + 7.06 (R2 = 0.9877); LR1: y = 0.27x + 6.87 (R2 = 0.9925); LR2: y = 0.28x + 6.37 (R2 = 0.9949); (b) Trial 3, regression eq. LRC: y = 0.30x + 2.28 (R2 = 0.9962); LRI: y = 0.29x + 2.83 (R2 = 0.9943); (c) Trial 2: monthly, regression eq. LRC: y = 0.31x + 3.10 (R2 = 0.9909); LR2: y = 0.32x + 3.15 (R2 = 0.9897); LR4: y = 0.32x + 3.18 (R2 = 0.9916); (d) Trial 2: fortnightly, regression eq. LRC: y = 0.32x + 3.64 (R2 = 0.9873); LR2: y = 0.31x + 3.76 (R2 = 0.9894); LR4: y = 0.31x + 4.16 (R2 = 0.9870) (dap: days after planting).
Horticulturae 10 01136 g004
Figure 5. Evolution of the number of leaves present per stem in (a) Trial 1: treatments LRC, LR1 and LR2; (b) Trial 3: treatments LRC and LRI; (c) Trial 2: treatments LRC, LR2 and LR4 with a monthly frequency; (d) treatments LRC, LR2 and LR4 with a fortnightly frequency (dap: days after planting).
Horticulturae 10 01136 g005
Figure 6. Evolution of leaf area index (LAI) throughout the growing cycle: (a) Trial 1; (b) Trial 3; (c) Trial 2: monthly; (d) Trial 2: fortnightly (dap: days after planting).
Horticulturae 10 01136 g006
Figure 7. Relationship between the leaf area index (LAI) and the fraction of intercepted PAR (FPAR) throughout the growing season measured in the leaf removal treatments. (a) Trial 1, treatments LRC, LR1 and LR2 (exponential equation: FPAR = 0.8055 × (1 − exp(−0.9704 × LAI))); (b) Trial 2, treatments LRC, LR2 and LR4 with a fortnightly frequency (exponential equation: FPAR = 0.7061 × (1 − exp(−1.5838 × LAI))); and (c) Trial 3 treatments LRC and LRI (exponential equation: FPAR = 0.6986 × (1 − exp(−1.9075 × LAI))).
Horticulturae 10 01136 g007
Figure 8. Biomass produced (g·m−2) in relation to accumulated incident PAR throughout the growing cycle. (a) Trial 1, regression eq. LRC: y = 2.92x − 601.26 (R2 = 0.980); LR1: y = 2.70x − 541.50 (R2 = 0.985); LR2: y = 2.75x − 561.92 (R2 = 0.982). (b) Trial 3, regression eq. LRC: y = 2.48x − 393.55 (R2 = 0.983); LRI: y = 2.11x − 288.27 (R2 = 0.970). (c) Trial 2 (monthly), regression eq. LRC: y = 2.42x − 264.25 (R2 = 0.968); LR2: y = 2.31x − 240.53 (R2 = 0.973); LR4: y = 2.15x − 209.77 (R2 = 0.976). (d) Trial 2 (fortnightly), regression eq. LRC: y = 2.36x − 251.14 (R2 = 0.970); LR2: y = 2.21x − 212.48 (R2 = 0.977); LR4: y = 2.15x − 200.63 (R2 = 0.974).
Horticulturae 10 01136 g008
Figure 9. Relationship between the daily mean net assimilation rate (NAR) (biomass per unit leaf area) in each measurement period and the incident PAR integral. (Left) Trial 2 fortnightly, regression eq. LRC: y = 0.01x + 2.57 (R2 = 0.3023); LR2: y = 0.01x + 2.87 (R2 = 0.8391); LR4: y = 0.02x + 2.26 (R2 = 0.8465). (Right) Trial 3, regression eq. LRC: y = 0.02x + 2.25 (R2 = 0.9693); LRI: y = 0.04x + 2.49 (R2 = 0.9281).
Horticulturae 10 01136 g009
Figure 10. Fraction of dry matter partitioned to fruits (left) and to leaves (right) throughout the growing cycle in the leaf removal control treatment (LRC) versus intense leaf removal (LRI) during Trial 3 (dap: days after planting).
Horticulturae 10 01136 g010
Figure 11. Evolution of net yield throughout the growing cycle in (a) Trial 1: treatments LRC, LR1 and LR2; (b) Trial 3: treatments LRC and LRI; (c) Trial 2: treatments LRC, LR2 and LR4 with a monthly frequency; (d) treatments LRC, LR2 and LR4 with a fortnightly frequency (dap: days after planting).
Horticulturae 10 01136 g011
Figure 12. Relationship between biomass allocated to fruit and fruit dry weight (left) and the number of flowers per stem (right) in the LRC, LR1 and LR2 treatments of Trial 1 (a), LRC, LR2 and LR4 treatments with a fortnightly leaf removal frequency of Trial 2 (b) and LRC and LRI treatments of Trial 3 (c).
Horticulturae 10 01136 g012aHorticulturae 10 01136 g012b
Table 1. Mean total leaves emitted, present and removed per stem in the leaf removal treatments within each trial: Trial 1 (LRC, LR1 and LR2), Trial 2 (LRC, LR2 and LR4) and Trial 3 (LRC and LRI). M and F: monthly and fortnightly leaf removal.
ParameterTrial 1Trial 2Trial 3
LRCLR1LR2 LRCLR2LR4LRCLRI
crop duration (days)252202270
total emitted leaves60.6 a60.4 a62.5 aM66.5 a65.5 a65.9 a83.5 a81.8 a
F67.6 a66.1 a65.1 a
average leaves present24.4 a21.5 b20.4 bM24.4 a21.5 b19.1 c23.4 a12.7 b
F22.1 b19.2 c15.4 d
average leaves pruned per removal6.8 b7.3 ab7.5 aM7.6 b8.7 ab9.4 a5.3 a2.9 b
F4.0 c4.4 c5.0 c
Data within the same trial followed by the same letter are not significantly different (Tukey test, 95%).
Table 2. Number of total and viable flowers emitted per stem. M and F: monthly and fortnightly leaf removal frequencies.
Trial 1Trial 2Trial 3
LRCLR1LR2LRCLR2LR4LRCLRI
Crop duration (days)252 202270
Total flower number136.8 a141.4 a131.8 aM137.8 a145.5 a136.7 a155.1 a146.8 a
F136.7 a142.6 a143.4 a
Viable flower number123.8 a127.6 a117.9 aM112.7 a127.3 a115.2 a129.8 a108.3 a
F119.2 a121.2 a125.4 a
Data within the same trial followed by the same letter are not significantly different (Tukey test, 95%).
Table 3. Total biomass production (g·m−2) in the leaf removal treatments within each trial: Trial 1 (LRC, LR1 and LR2), Trial 2 (LRC, LR2 and LR4) and Trial 3 (LRC and LRI). M and F: monthly and fortnightly leaf removal frequencies.
TRIAL 1TRIAL 2TRIAL 3
LRCLR1LR2 LRCLR2LR4LRCLRI
Crop duration (days)252 202270
Biomass production3120 a2810 a2841 aM2282 a2187 a2025 a2626 a2237 b
F2218 a2091 a2017 a
Data within the same trial followed by the same letter are not significantly different (Tukey test, 95%).
Table 4. Partitioning of dry matter between the different organs of the plant, expressed as a percentage of dry weight (top row) and in its absolute value in g·m−2 (bottom row), in the leaf removal treatments within each trial: Trial 1 (LRC, LR1 and LR2), Trial 2 (LRC, LR2 and LR4) and Trial 3 (LRC and LRI). M and F: leaf removal with monthly and fortnightly frequencies, respectively.
Trial 1 Trial 2Trial 3
LRCLR1LR2 LRCLR2LR4LRCLRI
Stem%
g·m−2
11.9
352.7
10.4
291.1
10.7
305.7
M17.1
390.2
9.8
213.9
9.7
197.2
10.9
286.5
11.2
251.0
F11.5
258.1
10.2
212.5
10.5
211.7
Leaves%
g·m−2
26.6
786.6
26.1
729.2
26.4
751.9
M20.0
456.0
25.2
550.3
27.5
556.1
25.9
679.1
26.5
595.0
F25.9
580.7
24.7
515.7
26.7
539.0
Side shoots%
g·m−2
7.8
230.6
7.5
209.3
7.4
211.3
M1.0
23.7
1.2
25.4
0.9
19.0
3.0
79.2
3.0
68.0
F1.0
21.8
1.0
20.5
0.9
18.4
Flowers%
g·m−2
2.9
84.5
2.6
71.4
2.6
74.1
M2.2
49.8
2.5
54.2
2.3
46.4
2.9
76.0
2.9
64.0
F2.5
55.7
2.8
58.7
2.9
57.8
Fruits%
g·m−2
50.8
1500.8
53.5
1496.9
52.8
1503.0
M59.7
1362.8
61.4
1343.1
59.6
1206.4
57.3
1505.4
56.4
1264.8
F59.1
1322.3
61.4
1282.8
59.0
1191.5
Table 5. Total, net and non-commercial yield (kg·m−2) in the leaf removal treatments within each trial: Trial 1 (LRC, LR1 and LR2), Trial 2 (LRC, LR2 and LR4) and Trial 3 (LRC and LRI). M and F: leaf removal with monthly and fortnightly frequencies, respectively.
Trial 1Trial 2Trial 3
LRCLR1LR2LRCLR2LR4LRCLRI
Net23.3 a23.5 a23.1 a15.4 a15.6 a15.1 a20.8 a15.3 b
Non-commercial3.0 a3.1 a3.0 a7.1 a6.3 ab5.0 b6.4 a7.3 a
Total26.3 a26.6 a26.2 a22.5 a21.8 a20.1 b27.2 a22.6 b
Data followed by the same letter in the same trial are not significantly different with a probability of 5% according to the Tukey test.
Disclaimer/Publisher’s Note: The statements, opinions and data contained in all publications are solely those of the individual author(s) and contributor(s) and not of MDPI and/or the editor(s). MDPI and/or the editor(s) disclaim responsibility for any injury to people or property resulting from any ideas, methods, instructions or products referred to in the content.