Article

Effects of Light Spectra on Growth, Physiological Responses, and Antioxidant Capacity in Five Radish Varieties in an Indoor Vertical Farming System

by
Panita Chutimanukul
1,
Pakin Piew-ondee
2,
Thanyaluk Dangsamer
2,
Akira Thongtip
1,
Supattana Janta
1,
Praderm Wanichananan
1,
Ornprapa Thepsilvisut
2,
Hiroshi Ehara
3 and
Preuk Chutimanukul
2,*
1
National Center for Genetic Engineering and Biotechnology (BIOTEC), National Science and Technology Development Agency, Khlong Luang, Pathum Thani 12120, Thailand
2
Department of Agricultural Technology, Faculty of Science and Technology, Thammasat University, Pathum Thani 12120, Thailand
3
International Center for Research and Education in Agriculture, Nagoya University, Nagoya 464-8601, Japan
*
Author to whom correspondence should be addressed.
Horticulturae 2024, 10(10), 1059; https://doi.org/10.3390/horticulturae10101059
Submission received: 26 August 2024 / Revised: 1 October 2024 / Accepted: 2 October 2024 / Published: 3 October 2024

Abstract

:
Radish (Raphanus sativus L.) is highly nutritious and contains antioxidants that help reduce the risk of diseases. Light is a crucial factor in their growth and the stimulation of secondary metabolite production. Therefore, this study aimed to investigate the effects of light spectra on the development, physiological responses, and antioxidant capacity of radish varieties including cherry belle (CB), black Spanish (BS), hailstone white (HW), Malaga violet (MV), and sparkler white tip (SW) under a controlled environment. Various spectra of red (R), green (G), and blue (B) light were used. The study found that using a combination of red and blue light (3R:1B) resulted in the highest growth in root diameter, fresh weight, and dry weight across all five radish varieties, with values ranging from 1.83 to 4.63 cm, 13.58 to 89.33 g, and 1.20 to 4.64 g, respectively. In terms of physiological responses, the CB and BS varieties showed a higher photosynthetic rate after exposure to mixed red and blue light (1R:3B, 3R:1B). Additionally, adding green light to the red and blue light also enhanced the photosynthetic rate, with statistically significant differences ranging from 3.31 to 3.99 µmol m−2 s−1. The SW variety of radish exhibited an increase in phenolic compounds, flavonoids, and anthocyanins when exposed to light spectra of 1R:1G:1B, 1R:2G:1B, 1R:3G:1B, and 1R:3B. The highest levels of phenolic compounds were 4.67–5.14 mg GAE/g DW, flavonoids were 1.62–1.96 mg Rutin/g DW, and anthocyanins were 1.20–1.58 µg/g DW. However, the antioxidant capacity of five radish varieties under different light spectra did not show significant differences. Thus, the growth, photosynthesis, and antioxidant capacity depend on the optimal light spectrum for each radish variety.

1. Introduction

Radish (Raphanus sativus L.) is a small, erect plant classified in the Brassicaceae family [1]. It is highly valued and widely consumed worldwide [2], particularly in Asia, where it is a crucial crop in countries like China, Japan, and Korea. Various radish varieties display unique traits, such as differences in root color, shape, and usage for nutrient storage or utilization [3]. Radish cultivation constitutes about 2% of the world’s vegetable production, yielding 7 million tons annually [4]. It is commonly consumed fresh, incorporated into dishes, or juiced [5]. Radishes are rich in nutrients, vitamins, and various minerals. Additionally, they contain bioactive compounds such as flavonoids, phenolic acids, anthocyanins [6], and antioxidants [7]. Radishes are known for their high nutritional value. They are considered an option in treating various diseases, including heart disease, cancer, diabetes, and respiratory diseases, helping to reduce blood fat and high blood pressure [8,9]. Consuming vegetables rich in antioxidants can reduce the risk of human diseases by protecting or mitigating damage to cells caused by free radicals [10]. The primary role of antioxidants is to prevent the formation of free radicals [11]. Antioxidants effectively inhibit and treat chronic diseases, blocking or slowing down the reaction of biomolecules with free radicals by transferring electrons to neutralize free radicals and inhibiting oxidation [12]. Their mechanism is based on the capture or neutralization of free radicals, thereby reducing the oxidative damage caused by free radicals to cells and molecules [13,14,15]. Thus, antioxidant compounds found in natural plant sources can be used as dietary supplements and play a role in disease prevention [16].
Cultivating plants under an indoor vertical farming system using plant factory technology involves applying various technologies from different disciplines to cultivate plants in a controlled environment. This controlled environment regulates factors such as light spectrum, intensity, duration, temperature, humidity, mineral content, carbon dioxide levels, and even artificial light sources, such as light-emitting diodes (LEDs) or fluorescent lamps. The selection of light color and wavelength is crucial as it significantly influences plant growth, photosynthesis, and the production of secondary metabolites [17,18]. Plant factory technology plays a crucial role in food and pharmaceutical production, focusing on increasing quantity, improving quality, and efficiently utilizing resources in an environmentally friendly manner [19,20]. In addition, in plant factories, light is a critical factor for plants because they need it for photosynthesis to support growth and development at various stages. It also stimulates the production of secondary metabolites. It is essential to consider the type of plant being cultivated since different plant species respond differently to light spectrum and wavelength [21]. Cultivating plants in closed systems relies on artificial light sources, particularly light-emitting diodes (LEDs), known for their efficient light emission. LEDs can effectively replace solar energy and promote the growth of plants [22]. Furthermore, LED light bulbs consume less energy and exhibit durability. They allow control over light intensity and wavelength [23]. In general, when plants undergo an increase in photosynthesis, it leads to a higher accumulation of primary metabolites (carbohydrates and amino acids). These substances serve as precursors in producing secondary metabolites with antioxidant properties [24]. Studies have investigated using red and blue LED bulbs, which can stimulate the production of free radicals in plants [25,26]. Therefore, this research aims to study the effects of artificial light on the growth, physiological responses, and secondary metabolite production of five varieties of radish under controlled conditions in a plant factory.

2. Materials and Methods

2.1. Plant Material and Growth Condition

Five varieties of radish seeds were selected from commercial sources, including cherry belle (CB), black Spanish (BS), hailstone white (HW), Malaga violet (MV), and sparkler white tip (SW). All seeds were sown onto germination sponges and germinated under controlled environmental conditions. These conditions included a photosynthetic photon flux density (PPFD) of 150 µmol m−2 s−1, a 16 hd−1 photoperiod, an air temperature of 25 ± 1.5 °C, and a relative humidity of 70 ± 5%. After 7 days, the seedlings with true leaves and roots were transplanted into the DFT (deep flow technique) system. This transplanting process involved using a modified Enshi nutrient solution with an electrical conductivity (EC) of 1.3 mS/cm and a pH of 6.5. The plants were then provided with a PPFD of 150 µmol m−2 s−1 from LEDs for a 16 hd−1 photoperiod, a temperature of 25 ± 1 °C, a relative humidity of 70 ± 1%, and a CO2 concentration of 1000 ± 100 ppm, conducted in an indoor vertical farming system at the National Science and Technology Development Agency (NSTDA), Thailand.

2.2. Spectral Light Conditions

In the experiment, the light spectrum was modified based on the method of Chutimanukul et al. [27] using LEDs (AGRI-OPTECH Co., Ltd., Taiwan) that emit red light (R) (λ = 600–700 nm, peak at 660 nm), blue light (B) (λ = 400–500 nm, peak at 450 nm), and green light (G) (λ = 500–600 nm, peak at 525 nm). Then, five varieties of radish were transplanted and subjected to different spectral light treatments in five different ratios of R, G, and B, including (L1) 1R:1G:1B = 33.33:33.34:33.33, (L2) 1R:2G:1B = 25:50:25, (L3) 1R:3G:1B = 20:60:20, (L4) 1R:0G:3B = 25:0:75, and (L5) 3R:0G:1B = 75:0:25. The LEDs were installed horizontally at 40 cm above the cultivation bench. R, B, and G photosynthetic photon flux density (PPFD) was measured using a spectrometer (LI-180, LI-COR Inc., Lincoln, NE, USA). The spectral compositions of the light treatments were recorded using a light meter (Sekonic C-7000, Sekonic, Tokyo, Japan), with a PPFD maintained at 150 µmol m−2 s−1 for all treatments (Figure 1).

2.3. Plant Growth Measurements

A total of 28 days after transplanting (DAT) was used for measuring the growth parameters. A ruler and digital caliper were used to measure the root diameter (cm) and root length (cm) (excluding enlarged hypocotyl). After a 72 h drying period at 50 °C in an oven, the fresh weight and dry weight of the roots were measured. Plant samples were collected from each treatment with 4 replications and 3 plants per replication.

2.4. Physiological Measurements

The physiological parameters of radishes were measured 28 days after transplanting, including the photosynthetic rate (A), stomatal conductance (gsw), transpiration rate (E), and intercellular CO2 concentration (Ci), using the Portable Photosynthesis System (LI-6800, LICOR Inc., Lincoln, NE, USA) with a standard chamber of 3 cm2 round aperture. The chamber conditions were as follows: 500 mmol m−2 s−1 of airflow per unit leaf area, a leaf temperature of 25 °C, 70% relative humidity (RH), and a CO2 concentration of 1000 µmol mol−1. Light intensity measurements were recorded at 150 µmol m−2 s−1 of Photosynthetic Photon Flux Density (PPFD) on a fully expanded leaf of the plant.

2.5. Secondary Metabolite Quantification

2.5.1. Sample Extraction

After harvest at 28 DAT, all plant samples were dried in an oven at 50 °C for 72 h and ground with mortar and pestle until a fine powder was formed. Plant extraction followed a modified method from Chutimanukul et al. [28] A 10 mg sample of the powdered plant material was mixed with 5 mL of methanol containing 1% HCl in a 15 mL tube. The mixture was vortexed to ensure homogenization and then incubated at room temperature for 3 h. After incubation, the solution was centrifuged at 8500 rpm for 8 min using an Eppendorf Centrifuge 5810R with rotor F-34 6–38 (6 × 125 g). The supernatant solution was then transferred to a 2 mL microcentrifuge tube to analyze phenolics, total flavonoids, anthocyanin, and DPPH radical scavenging activity.

2.5.2. Determination of Total Phenolic Compounds (TPCs)

TPC was determined by a modified Folin-Ciocalteu assay using the modified methods of Chutimanukul et al. [28]. The 200 µL extracted solution was mixed with 200 µL of 1 N Folin-Ciocalteu reagent. After vortexing, it was centrifuged at 10,000 rpm for 2 min and then incubated for 15 min. Following this, 600 µL of 7.5% sodium carbonate (Na2CO3) was added, vortexed again, and centrifuged at 10,000 rpm for 2 min. After the 1 h incubation, the absorbance of the mixed solution was measured at 730 nm using a microplate reader (Multiskan Sky, Thermo Scientific, Waltham, MA, USA). TPC was calculated using standard gallic acid with concentrations ranging from 0 to 250 µg/mL (250, 125, 62.5, 31.25, 15.63, 7.8, 3.9, 1.9, and 0.97 µg/mL), prepared from a gallic acid solution dissolved in water to establish calibration curves for TPC concentration calculation. The result was presented as milligrams of gallic acid equivalent (mg of GAE) per gram of sample DW.

2.5.3. Determination of Flavonoid Content

The quantification of flavonoid content was modified from the method of Chutimanukul et al. [28], using a mix of 350 µL of the extracted solution with 75 µL of 5% sodium nitrite (NaNO2) in a 1.5 mL microcentrifuge tube, then centrifuging at 10,000 rpm for 2 min. After incubating at 25 °C for 5 min, 75 µL of 10% aluminum chloride (AlCl3·6H2O) was added and then centrifuged at 10,000 rpm for 2 min. The mixture was then incubated at 25 °C for 5 min. Subsequently, 500 µL of 1 M sodium hydroxide (NaOH) was added and vortexed to homogenize the solution before being centrifuged at 10,000 rpm for 2 min. After 15 min, the absorbance of the mixed solution was measured at 515 nm using a microplate reader (Multiskan Sky, Thermo Scientific, Waltham, MA, USA). Total flavonoid content was calculated from a standard curve of rutin solution dissolved in dimethyl sulfoxide (DMSO). The result was presented as milligrams of rutin equivalents per gram of DW.

2.5.4. Determination of Anthocyanin Content

The method for determining anthocyanin content was adapted from the description by Chutimanukul et al. [28]. The extracted solution with 500 µL was mixed with 400 µL of deionized water and 400 µL of chloroform, followed by centrifugation at 10,000 rpm for 5 min at 25 °C. Then, the supernatant solution was separated, and the absorbance was measured at 515 and 657 nm using a microplate reader (Multiskan Sky, Thermo Scientific, Waltham, MA, USA). The anthocyanin content was calculated using the formula A530 − (0.33 × A657).

2.5.5. DPPH Radical Scavenging Activity

Radishes’ free radical scavenging activity was examined using a slightly modified method by Chutimanukul et al. [28], using 2,2-diphenyl-1-picrylhydrazyl (DPPH) as a free radical. A volume of 100 µL of the extracted solution was pipetted into a 1.5 mL microcentrifuge tube and then supplemented with 900 µL of 0.1 mM DPPH. The mixture was vortexed to homogenize the solution, followed by centrifugation at 10,000 rpm for 2 min. After being kept in the darkness at 25 °C for 3 h (during which the solution changed from purple to yellow), the absorbance was measured at 515 nm using a microplate reader (Multiskan Sky, Thermo Scientific, Waltham, MA, USA). Subsequently, the DPPH scavenging activity was calculated using the following equation:
% DPPH   inhibition = absorbance   of   control     absorbance   of   sample absorbance   of   control   ×   100

2.6. Statistical Analysis

The experimental data were evaluated by one-way analysis of variance with Duncan’s multiple range test (DMRT) at a significance tested level p < 0.05. The statistical analyses were conducted using IBM SPSS Statistics 21 (IBM Corporation; Armonk, NY, USA).

3. Results

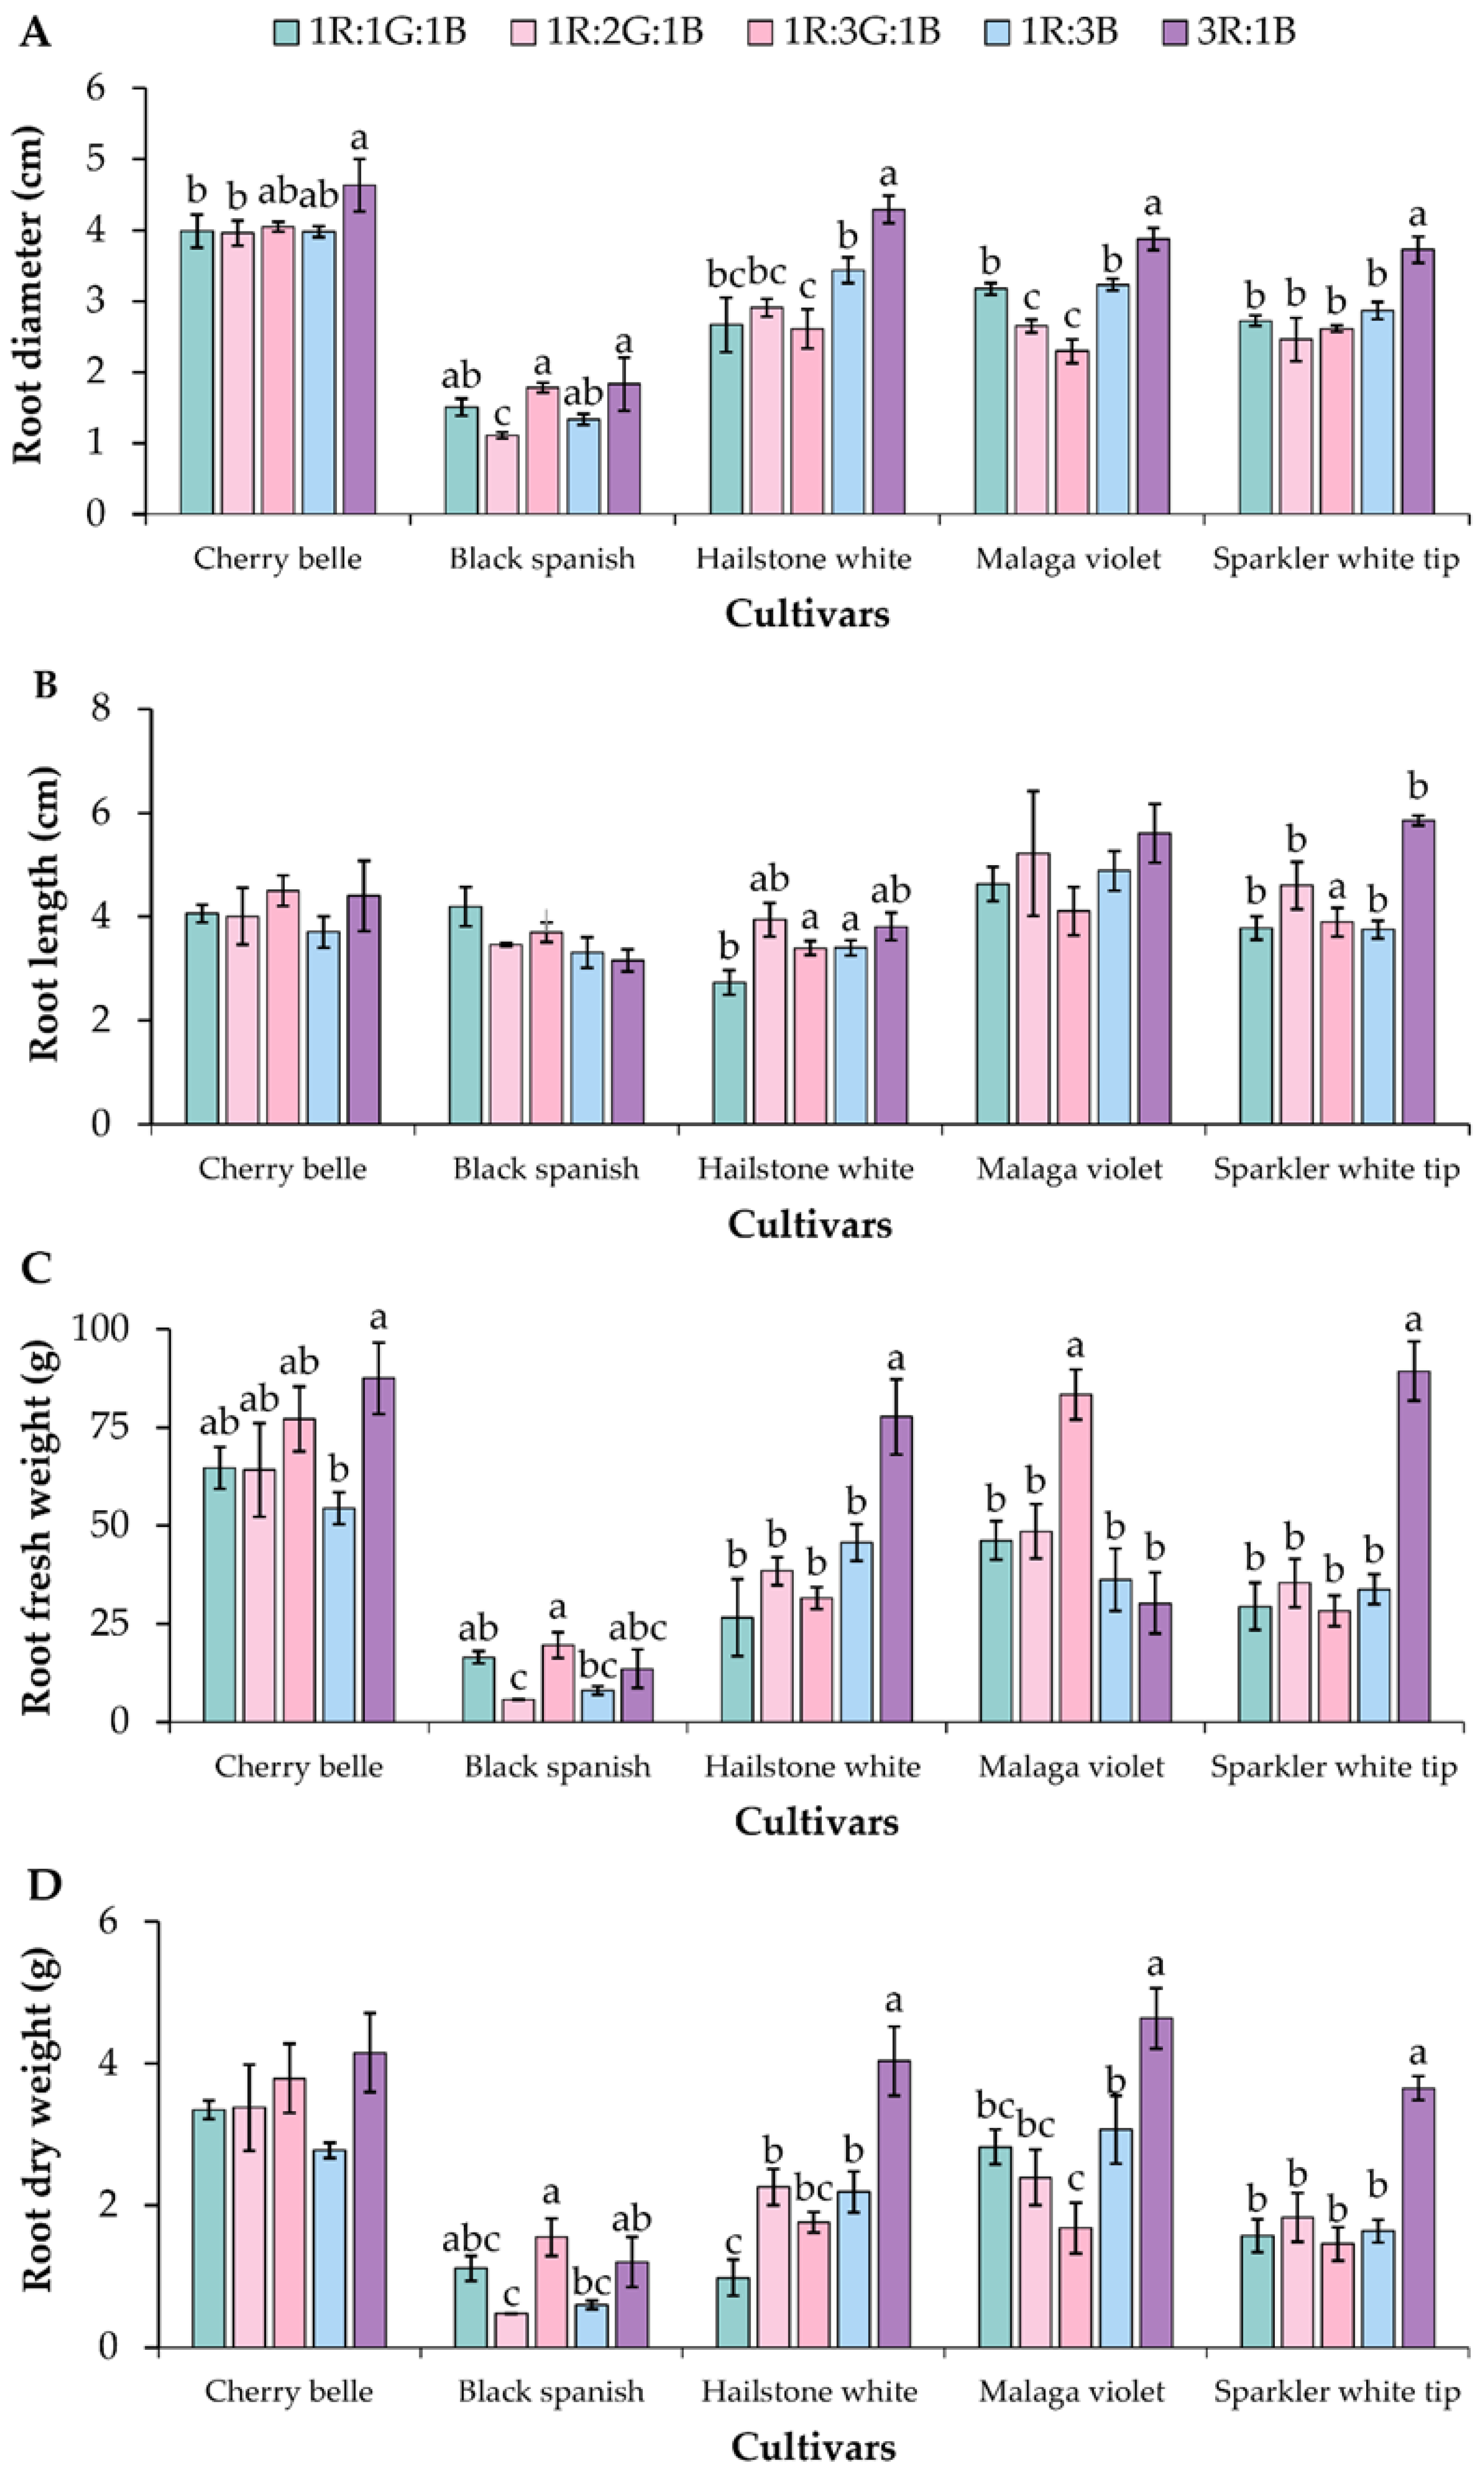
3.1. Biomass Accumulation and Plant Growth

The development of radish roots in five cultivars under different light spectra revealed significant differences in root diameter, shown in Figure 2 and Figure 3. CB, HW, MV, and SW under 3R:1B light spectra had the highest root diameters, measuring 4.63, 4.29, 3.88, and 3.72 cm, respectively. Conversely, the 1R:2G:1B spectrum resulted in BS having the smallest root diameter at 1.11 cm. Additionally, under the 3R:1B spectrum, SW had the longest root length at 5.85 cm, while HW had the shortest at 2.73 cm under 1R:1G:1B. Differences in light spectra did not significantly affect plant root length in CB, BS, and MV. Regarding weight, significant differences were observed in both fresh weights and dry weights under the 3R:1B spectrum. SW, CB, MV, and HW had the highest fresh root weights at 89.37, 87.53, 83.37, and 77.7 g, respectively, while MV, HW, and SW had the highest dry weights at 4.64, 4.03, and 3.65 g, respectively. Conversely, BS had the lowest fresh and dry weights at 5.73 and 0.47 g under the 1R:2G:1B spectrum. Significant differences were not found in the root dry weight of CB.

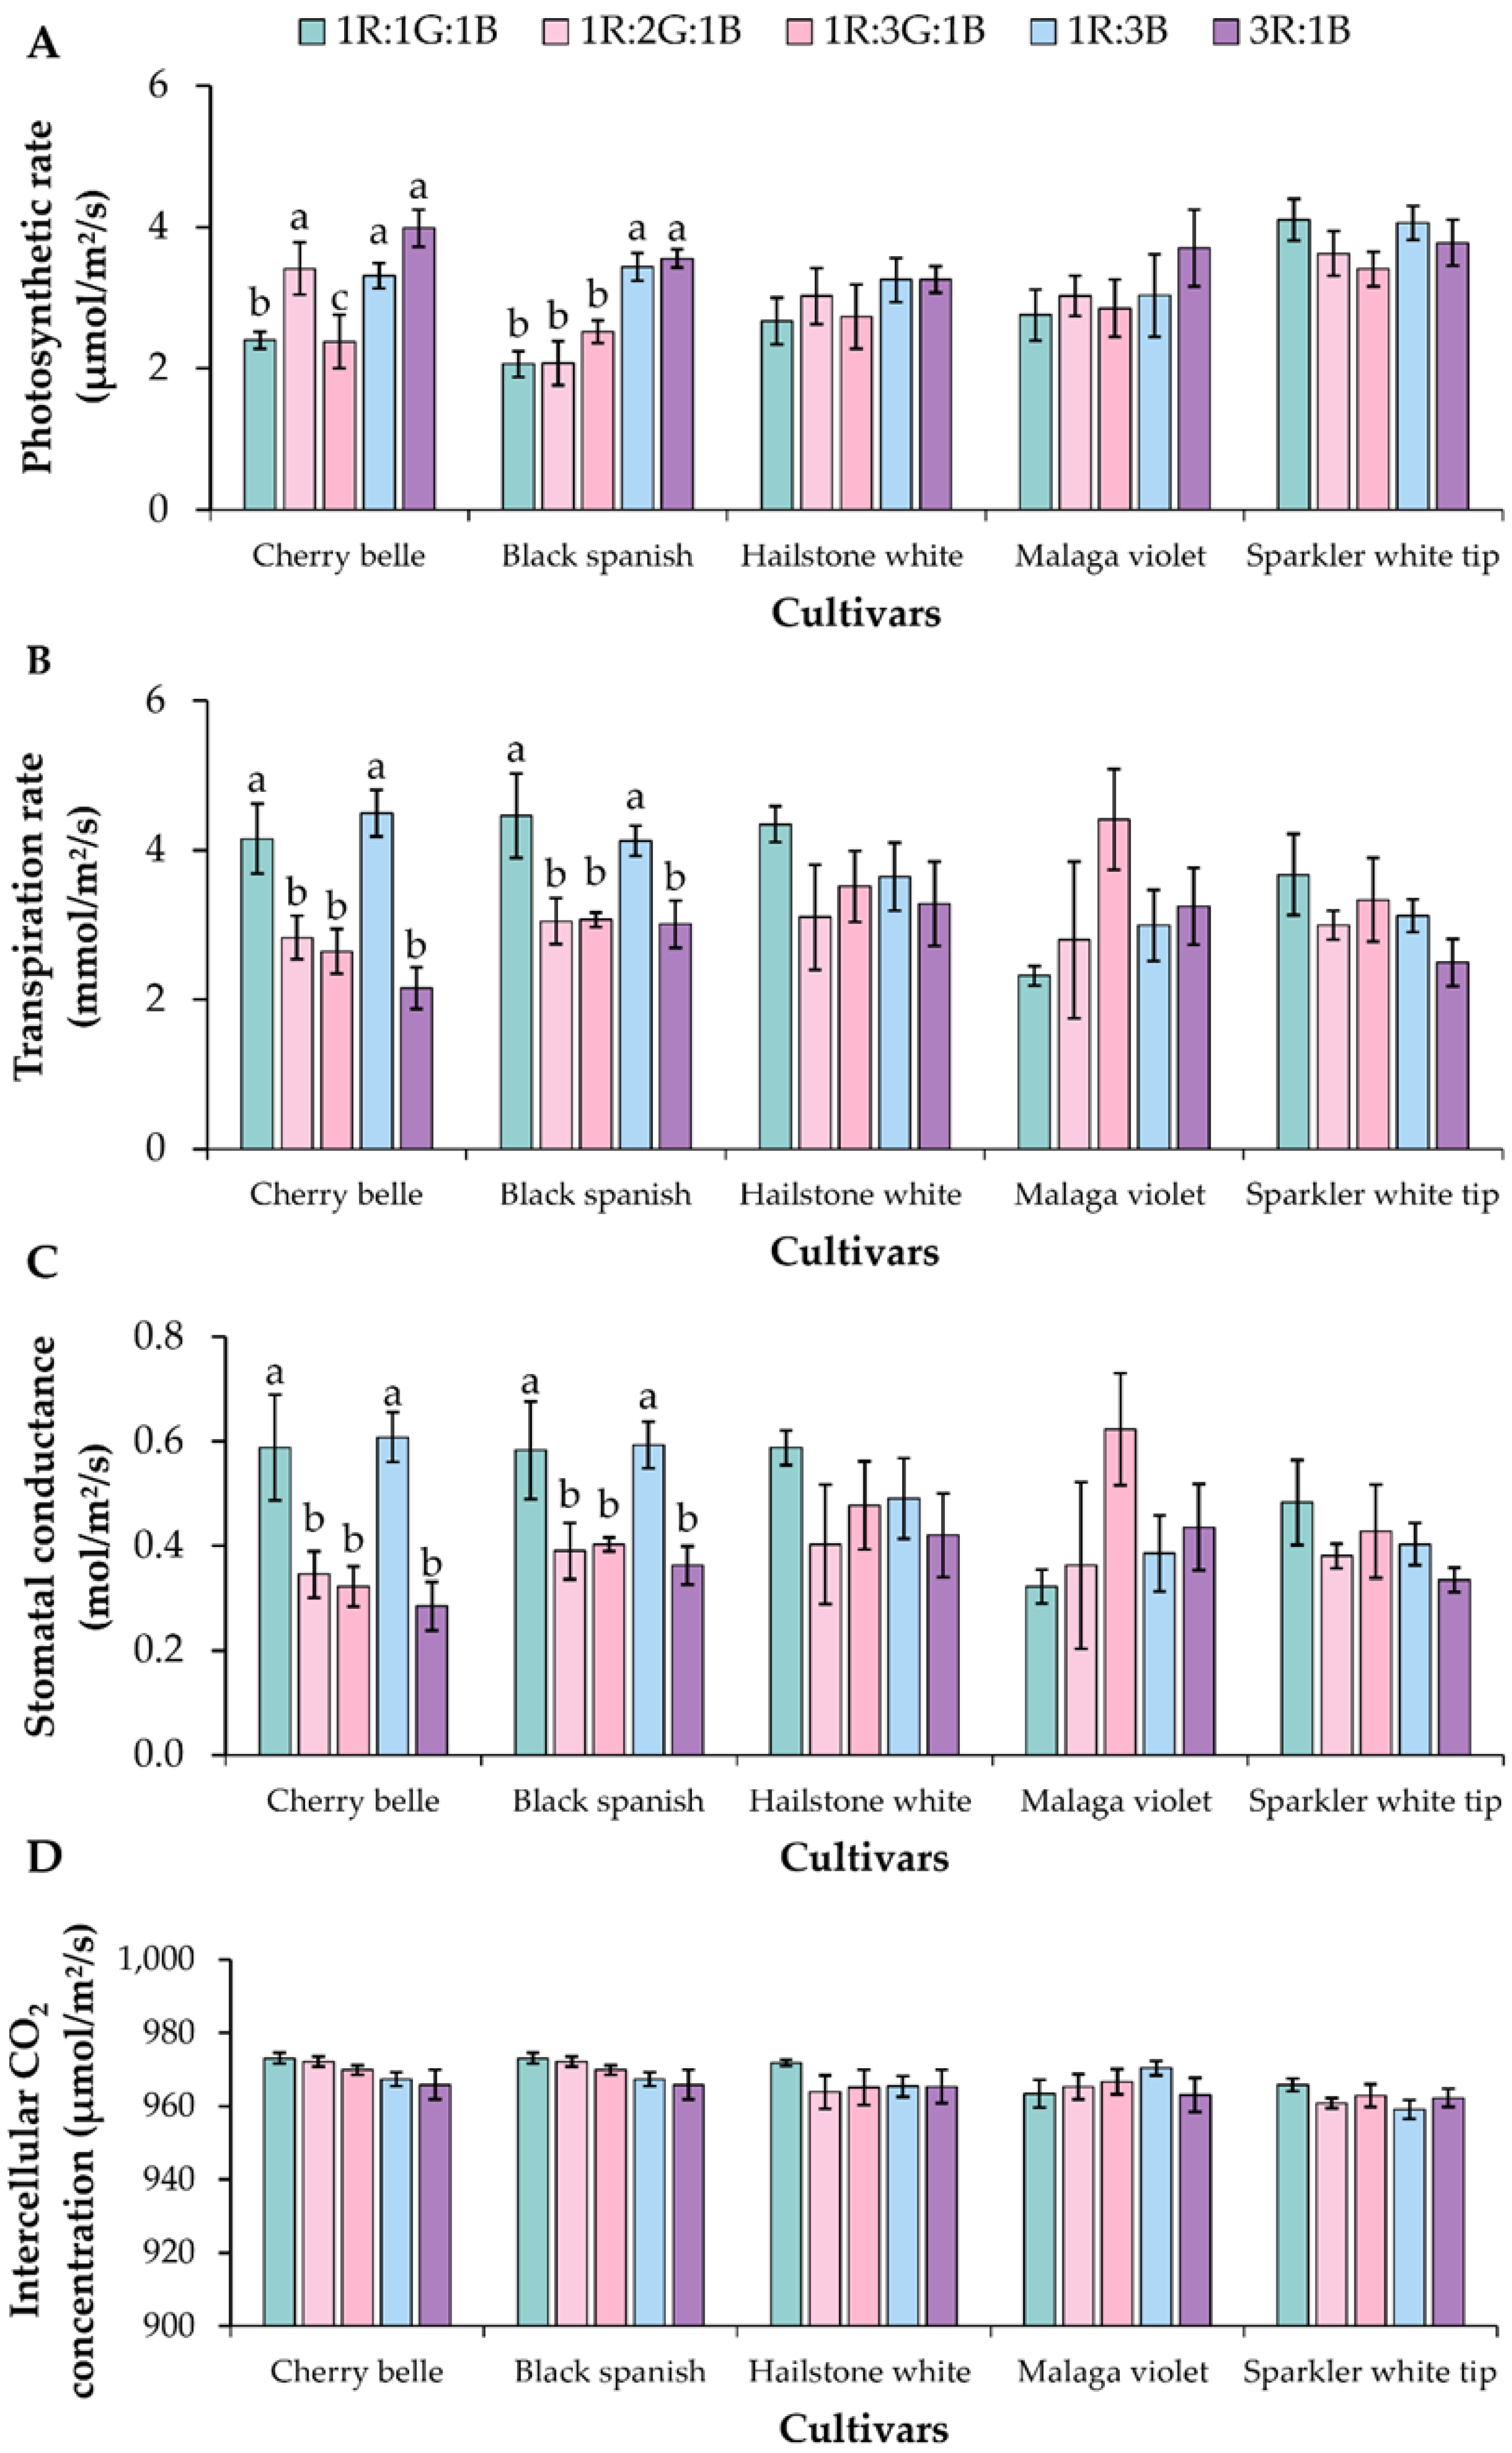
3.2. Physiological Responses

The experiment revealed that different light spectra significantly affected the physiological response of radish, particularly in terms of the photosynthetic rate (A) (Figure 4A). For the CB variety, significant differences were observed, where the 3R:1B, 1R:2G:1B, and 1R:3B light spectra promoted the highest photosynthetic rates at 3.99, 3.41, and 3.31 µmol m−2 s−1, respectively. The highest photosynthetic rates were observed for the BS variety with the 3R:1B and 1R:3B light spectra at 3.56 and 3.44 µmol m−2 s−1, respectively. However, no statistical differences were observed in the HW, MV, and SW cultivars.
The transpiration rate (E) was highest in the CB variety under the 1R:1G:1B and 3R:1B light spectra, resulting in values of 4.15 and 4.49 mol m−2 s−1, respectively. Similarly, in the BS variety, under the 1R:1G:1B and 3R:1B light spectra, the transpiration rates were 4.35 and 3.64 mol m−2 s−1, respectively (Figure 4B). Stomatal conductance (gsw) showed significant increases in both CB and BS radish varieties under the 3R:1B and 1R:1G:1B light spectra, with values reaching 0.61 and 0.59 mol m−2 s−1 for CB and 0.59 and 0.58 mol m−2 s−1 for BS, respectively. However, significant differences were not observed in E and gsw in the HW, MV, and SW varieties (Figure 4C). CO2 concentrations (Ci) in all radish cultivars ranged from 959.08 to 973.02 µmol m−2 s−1, with no statistically significant effect observed from the different light spectra. (Figure 4D).

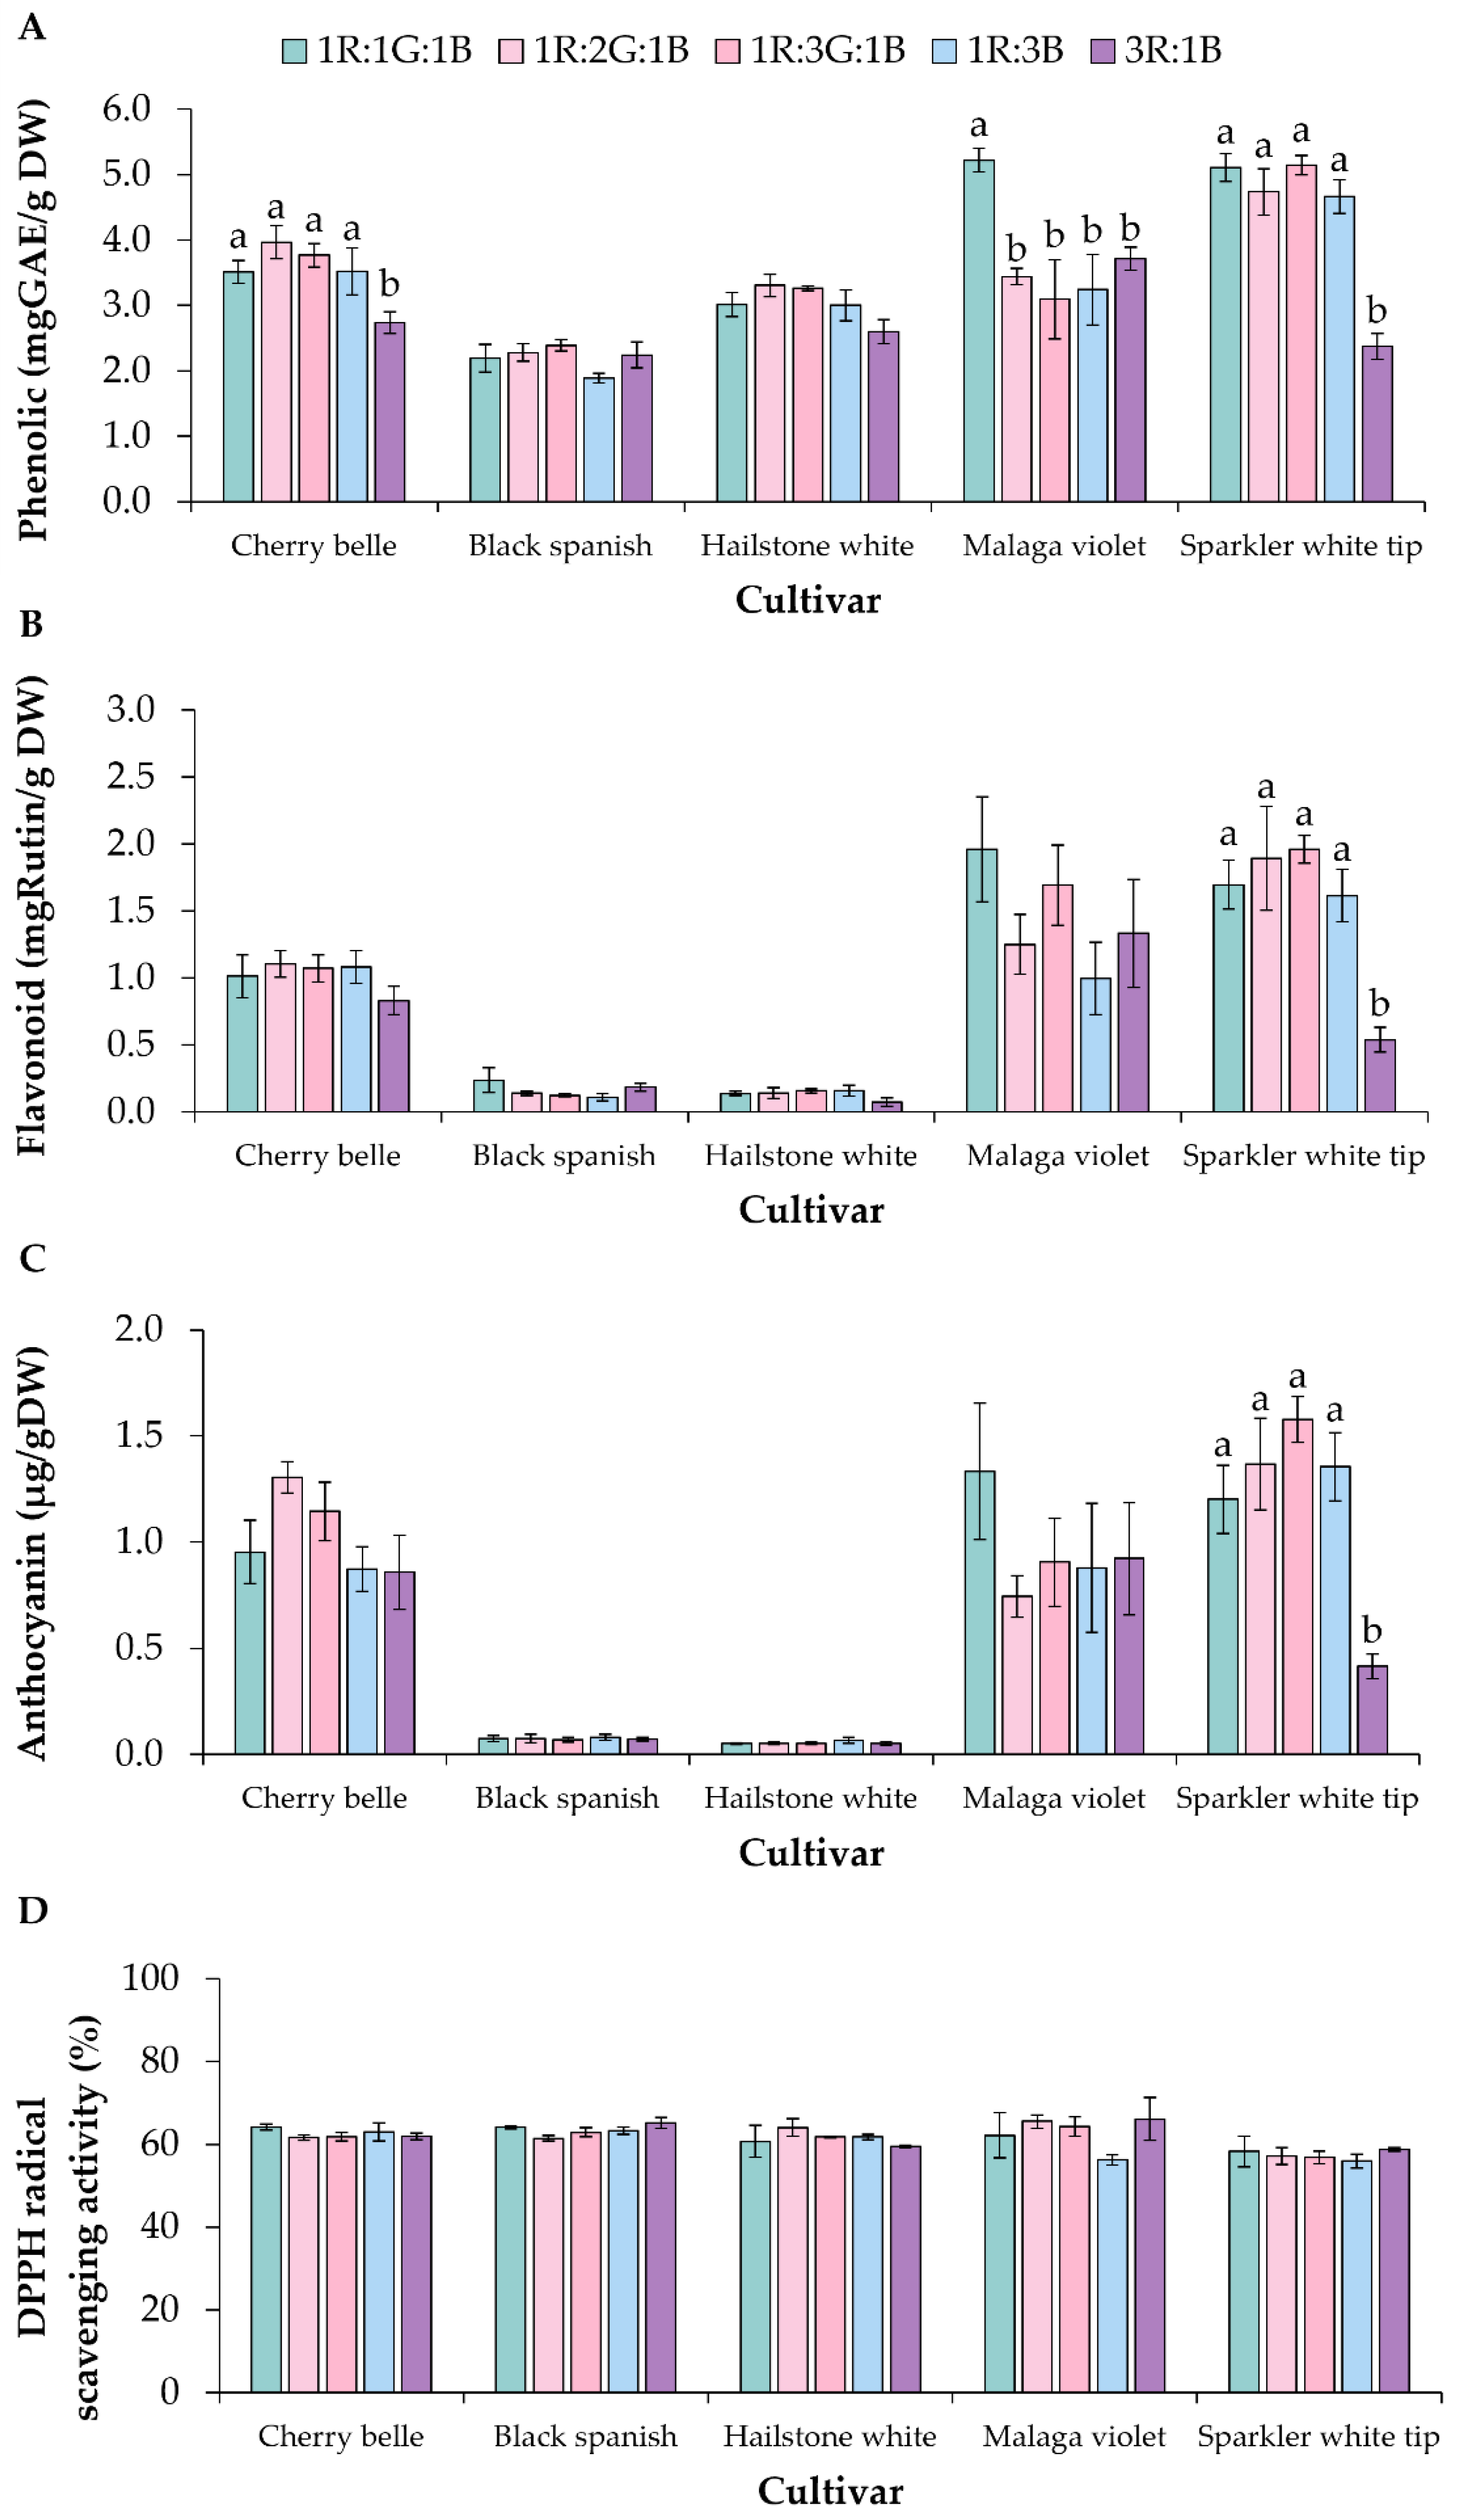
3.3. Secondary Metabolite Quantification

The study of phenolic compound quantities in radish of five cultivars subjected to different light spectra revealed that radish cultivars CB and SW under light spectra of 1R:1G:1B, 1R:3B, 1R:2G:1B, and 1R:3G:1B exhibited the highest phenolic compound quantities. For cultivar CB, the quantities were 3.52, 3.52, 3.97, and 3.77 mgGAE/g DW, respectively, while for cultivar SW, they were 5.11, 4.67, 4.74, and 5.14 mgGAE/g DW, respectively. Radish cultivar MV under the spectrum of 1R:1G:1B had the highest phenolic compound quantity at 5.22 mgGAE/g DW. Cultivars BS and HW under different light spectra showed no statistically significant difference in phenolic compound quantities (Figure 5A).
The study of flavonoid quantities in radish of five cultivars subjected to different light spectra found that radish cultivar SW under spectra of 1R:1G:1B, 1R:3B, 1R:2G:1B, and 1R:3G:1B exhibited the highest flavonoid quantities. The quantities were 1.70, 1.62, 1.89, and 1.96 mgRutin/g DW, respectively. Conversely, the cultivar under the spectrum of 3R:1B showed the lowest flavonoid quantity at 0.54 mgRutin/g DW. Cultivars CB, BS, HW, and MV under different light spectra showed no statistically significant difference in flavonoid quantities (Figure 5B).
The study of anthocyanin quantities in radish of five cultivars subjected to different light spectra found that radish cultivar SW under spectra of 1R:1G:1B, 1R:3B, 1R:2G:1B, and 1R:3G:1B exhibited the highest anthocyanin quantities. The quantities were 1.20, 1.35, 1.37, and 1.58 µg/gDW, respectively. Conversely, the cultivar under the spectrum of 3R:1B showed the lowest anthocyanin quantity at 0.42 µg/gDW. Cultivars CB, BS, HW, and MV under different light spectra showed no statistically significant difference in anthocyanin quantities (Figure 5C).
The study of DPPH radical scavenging activity in radish of five cultivars subjected to different light spectra found that all five cultivars showed no statistically significant difference in antioxidant capacities (Figure 5D).

4. Discussion

The experimental results showed that the growth response of radishes in all cultivars, including root length, root fresh weight, and root dry weight, tended to increase when exposed to light spectra with high ratios of red light, indicating that different light spectra had a clear effect on plant growth. A study by Yorio et al. [29] investigated the promotion of growth factors in radishes by providing different light spectra. It was found that providing only red light did not promote radish growth as effectively as combining red and blue light. Specifically, providing red light alone resulted in reduced growth compared to providing fluorescent light, and red light combined with blue light. Blue light was found to be essential for plant growth. Therefore, providing a combination of red and blue light promoted radish growth, increasing the dry weight of the roots. In the study of Zha and Liu [30], which demonstrated the efficiency factors of light, including light quality, intensity, and duration on cherry belle radish cultivars, it was found that providing red light alone was a factor that led to the low development of radish roots. Moreover, blue light promoted root. However, providing blue light in high ratios also adversely affected radish growth. Thus, light spectrum ratios need to be managed appropriately. It was found that providing red and blue light in a 2:1 ratio (2R:1B) for 16 hd−1 promoted radish growth in terms of root length, diameter, fresh weight, and dry weight compared to growth in stem aspects when compared to providing red and blue light in a 1:1 ratio (1R:1B). Additionally, increasing light intensity led to higher radish growth. This intensity has a relationship with photosynthesis to produce plant energy. Similarly, in a study by Gam et al. [31], which studied light provision from LED light sources, it was found that providing red and blue light with a higher ratio, such as 4:1 (4R:1B), resulted in the highest growth in terms of stem diameter, fresh weight, dry weight, and highest biomass production, and stimulated higher production of phytochemicals in plants compared to other light spectra from LED or fluorescent light sources. A report by Pritchard et al. [32] found that when plants received high levels of carbon dioxide, it stimulated growth in the underground parts, such as roots, more than the above-ground parts, such as stems and leaves. About 50% of the nutrients from photosynthesis are sent to the roots underground for plant nutrition. In addition, light intensity is a factor because light intensity plays an important role in the growth of radishes, especially in root development, affecting plant photosynthesis and growth, and the accumulation of nutrients in radish roots. If plants receive light with high intensity, they can photosynthesize more, but if the light intensity decreases, growth will decrease accordingly [30]. Blue light is crucial in promoting photosynthesis, chlorophyll production, and regulating plant growth. Cryptochromes (CRYs) help control plant developmental processes in response to blue light [33], with optimal growth occurring at appropriate blue light proportions. It enhances photosynthetic efficiency and nutrient absorption [34].
Red and blue light spectra significantly enhance the efficiency of photosynthesis in plants, as they fall within the visible light range that plants utilize for this process. Samuoliene et al. [35] reported that red and blue light spectra affect the photosynthetic efficiency of radish. When exposed solely to red light, radishes exhibited a reduced photosynthetic rate due to the accumulation of pigments used in photosynthesis and low carbohydrate levels in the leaves. Red light alone was insufficient for optimal photosynthesis, leading to a lower photosynthetic rate. However, when combined with blue light, radishes demonstrated a higher photosynthetic rate. This finding aligns with research by Liu and Lersel [36], which examined the effects of red, green, and blue light spectra on plant photosynthesis. Their study revealed that red light had the highest photosynthetic rate compared to blue and green light. Different wavelengths affect light absorption and energy utilization in photosynthesis. Excessive wavelengths that plants do not use effectively, such as yellow or green, can reduce photosynthetic efficiency. Choosing light spectra close to plants’ wavelengths in photosynthesis enhances this process. Red light plays a crucial role in photosynthesis as one of the primary wavelengths plants use for energy production. In the photosynthetic process, chlorophyll absorbs red light, particularly in Photosystem I, initiating reactions that produce ATP and NADPH necessary for carbohydrate synthesis in the Calvin cycle [37]. Additionally, red light affects stomatal opening, facilitating gas exchange and the absorption of carbon dioxide essential for photosynthesis [36]. Red and blue light are absorbed more efficiently by photosynthetic pigments compared to green light. This means that red and blue light primarily excite chloroplasts in the upper layers of leaves, while green light can penetrate deeper, reaching chloroplasts in lower layers [36].
Stomatal conductance is a measure of the opening and closing of stomata, which correlates with the water potential indicating the plant’s water status, and it reflects the width of stomatal pores when they are open per unit of time. If the stomata are widely open, it indicates a high value. It is measured in mmol m−2 s−1 and indicates efficiency and gas exchange in plants, affecting photosynthesis and transpiration [38]. Therefore, if a plant can open its stomata widely and keep them open for longer, it will enhance photosynthetic efficiency because plants can exchange carbon dioxide from the atmosphere more effectively. However, a decrease in stomatal conductance, resulting from narrower stomatal openings, can help prevent water loss in plants [37]. Stomatal opening is primarily influenced by blue light and red light [39]. Blue light signals stomatal opening, while red light provides the energy necessary for photosynthesis and stomatal function. In many vascular plants, the presence of BL is necessary for stomatal opening, especially when combined with red light. Weak blue light alone does not significantly induce stomatal opening; however, when it is superimposed on strong red light, it can lead to a rapid and substantial opening of the stomata [39].
When considering the quantity of phenolic compounds in radish cultivars CB and SW under the light spectra of 1R:1G:1B, 1R:3B, 1R:2G:1B, and 1R:3G:1B, it resulted in the highest quantity of phenolic compounds. Under the same light spectra, the radish cultivar SW exhibited the highest quantity of flavonoids. Radish cultivar SW when subjected to light spectra of 1R:1G:1B, 1R:3B, 1R:2G:1B, and 1R:3G:1B resulted in the highest quantity of anthocyanins. In general, when plants undergo photosynthesis with higher light intensity, it leads to an accumulation of primary metabolites (carbohydrates and amino acids), which are precursors in producing antioxidant compounds [24]. Additionally, both red and blue light spectra affect the production of antioxidant compounds [40]. It is observed that blue and red light promoted antioxidant activities and secondary compounds, such as phenolic compounds, pinitol accumulation, and betacyanin [41]. The quantity of phenolic compounds serves as an important index of seedling quality, and the accumulation of phenolic compounds can be stimulated by cultivating under different wavelengths of LED light [42], especially blue light spectra, which induce phenolic compound synthesis, as light stimulates certain key enzymes that act as intermediaries in phenolic compound synthesis [43]. Batista et al. [44] reported that blue light plays a role in regulating microtubule synthesis-related genes and secondary metabolite synthesis-related genes, and that red light and green light are also closely associated with the expression of defense-related genes. Moreover, in lettuce, blue light has been demonstrated to enhance the content of antioxidant polyphenols, anthocyanins, and carotenoids [45,46]. Jang et al. [47] reported that camellia callus produces larger amounts of phenolics when exposed to RB and RGB because of defense-related mechanisms. Kondo [48] states that blue light plays a crucial role in stimulating the accumulation of anthocyanins. Stutte et al. [49] reported that blue light is essential for producing purple pigments associated with anthocyanin synthesis. It is known that green light, the same as blue and UV, is also absorbed by the cryptochromes, although the specific photoreceptor of such light remains to be identified in higher plants. The green light can be more efficiently absorbed by the outer leaves of the canopy and stimulate photosynthesis at lower leaf levels [42,50,51]. Few accessible reports showed that green light used as monochromatic or as part of a broader light combination frequently had no effect or reduced accumulation of phenolic compounds and can reverse the positive impact of monochromatic blue light [42,50]. The green light had positive results in only a few cases. For example, it enhanced the total phenolic and total flavonoid production of Prunella vulgaris callus cultures [52]. Tang et al. [53] reported that blue and red in the RBG light and the RBW light increased the antioxidant activities of three vegetable species (lettuce, radish, and tomato) compared to the W light. However, contrasting examples in the literature indicate that the amount of secondary metabolism under artificial lighting is light and species dependent. For example, no essential difference was found in pigment content in Dieffenbachia amoena, Ficus elastica, and Boston lettuce [54,55]. Consequently, the production of phenolic compounds depends concurrently on the light environment and the physiological and biochemical factors. Additionally, phenolic compounds and flavonoids are phytochemicals with antioxidant properties found in natural plants and are the primary antioxidants involved in inhibiting oxidation processes in plants [56,57]. However, it is possible that in this experiment, phenolic compounds and flavonoids did not affect the antioxidant activity in radish. This is because non-enzymatic antioxidants can be classified into several groups, including ascorbic acid, phenolic compounds such as phenols, phenolics, flavonoids, tannins, glycosides, alkaloids, and lignin [58], which may include other substances that influence the antioxidant activity in radish. Therefore, further in-depth studies are required.

5. Conclusions

This study demonstrated the effects of light spectra on growth, secondary metabolites, and antioxidant capacity. It was found that radishes of all five varieties exposed to the 3R:1B light spectrum showed tendencies for increased growth in terms of diameter, fresh weight, and dry weight. The mixed red and blue light spectrum (3R:1B) effectively promoted plant growth. Similarly, physiological responses in the CB and BS varieties indicated a higher photosynthetic rate after exposure to the mixed red and blue light (1R:3B, 3R:1B). Additionally, adding green light to the red and blue light spectrum also enhanced the photosynthetic rate. For the SW variety, the quantity of phenolic compounds, flavonoids, and anthocyanins tended to increase when exposed to the 1R:1G:1B, 1R:2G:1B, 1R:3G:1B, and 1R:3B light spectra. The antioxidant capacity of five radish varieties under different light spectra did not show significant differences. Thus, the growth, photosynthesis, and antioxidant capacity depend on the optimal light spectrum for each radish variety. However, this system faces limitations in terms of high energy costs. Nevertheless, the demand for vertical farming systems is expected to increase in the future, particularly for herbal plants and functional foods, contributing to food security and sustainability.

Author Contributions

Conceptualization, P.C. (Panita Chutimanuku), A.T. and P.C. (Preuk Chutimanukul); methodology, P.C. (Panita Chutimanuku), A.T. and P.C. (Preuk Chutimanukul); validation, P.C. (Panita Chutimanuku), P.P.-o., T.D., O.T. and P.C. (Preuk Chutimanukul); formal analysis, S.J. and P.C. (Preuk Chutimanukul); investigation, P.P.-o., T.D. and P.C. (Preuk Chutimanukul); resources, P.C. (Panita Chutimanuku), S.J., P.W. and P.C. (Preuk Chutimanukul); data curation, P.C. (Panita Chutimanuku), H.E. and P.C. (Preuk Chutimanukul); writing—original draft preparation, P.C. (Panita Chutimanuku), P.P.-o., T.D. and P.C. (Preuk Chutimanukul); writing—review and editing, P.C. (Panita Chutimanuku) and P.C. (Preuk Chutimanukul); supervision, P.C. (Preuk Chutimanukul); funding acquisition, P.C. (Preuk Chutimanukul) All authors have read and agreed to the published version of the manuscript.

Funding

This study was supported by Thammasat University Research Fund (contract No. TUFT 8/2567) and the National Center for Genetic Engineering and Biotechnology (BIOTEC), Thailand (basic research fund: fiscal year 2023 with contract No. 4709540).

Data Availability Statement

The datasets used and/or analyzed during the current study are included in the article; further inquiries can be directed to the corresponding author.

Acknowledgments

The authors would like to thank Thammasat University Center of Excellence in Agriculture Innovation Center through Supply Chain and Value Chain, the Faculty of Science and Technology, Thammasat University, the National Center for Genetic Engineering and Biotechnology (BIOTEC), and the National Science and Technology Development Agency for providing technical supports and instrument.

Conflicts of Interest

The authors declare no conflicts of interest.

References

  1. Nishio, T. Economic and Academic Importance of Radish. In The Radish Genome; Springer: Berlin/Heidelberg, Germany, 2017; pp. 1–10. [Google Scholar]
  2. Kitashiba, H.; Li, F.; Hirakawa, H.; Kawanabe, T.; Zou, Z.; Hasegawa, Y.; Tonosaki, K.; Shirasawa, S.; Fukushima, A.; Yokoi, S.; et al. Draft sequences of the radish (Raphanus sativus L.) genome. DNA Res. 2014, 21, 481–490. [Google Scholar] [CrossRef] [PubMed]
  3. Lu, G.; Cao, J.; Yu, X.; Xiang, X.; Chen, H. Mapping QTLs for root morphological traits in Brassica rapa L. based on AFLP and RAPD markers. J. Appl. Genet. 2008, 49, 23–31. [Google Scholar] [CrossRef] [PubMed]
  4. Kopta, T.; Pokluda, R. Yields, quality and nutritional parameters of radish (Raphanus sativus) cultivars when grown organically in the Czech Republic. Hortic. Sci. 2013, 40, 16–21. [Google Scholar] [CrossRef]
  5. Banihani, S.A. Radish (Raphanus sativus) and Diabetes. Nutrients 2017, 9, 1014. [Google Scholar] [CrossRef]
  6. Papetti, A.; Milanese, C.; Zanchi, C.; Gazzani, G. HPLC–DAD–ESI/MSn characterization of environmentally friendly polyphenolic extract from Raphanus sativus L. var. “Cherry Belle” skin and stability of its red components. Food Res. Int. 2014, 65, 238–246. [Google Scholar] [CrossRef]
  7. Rani, A.; Arfat, Y.; Aziz, R.S.; Ali, L.; Ahmed, H.; Asim, S.; Rashid, M.; Hocart, C.H. Enzymatically assisted extraction of antioxidant and anti-mutagenic compounds from radish (Raphanus sativus). Environ. Technol. Innov. 2021, 23, 101620. [Google Scholar] [CrossRef]
  8. Rakhmawati, R. Potency of Lobak Leaves (Raphanus sativus L. var. hortensis Back) as Anticancer and Antimicrobial Candidates. Biodiversitas J. Biol. Divers. 2009, 10, 158–162. [Google Scholar] [CrossRef]
  9. Curtis, I. The noble radish: Past, present and future. Trends Plant Sci. 2003, 8, 305–307. [Google Scholar] [CrossRef]
  10. Kumar, S. The importance of antioxidant and their role in pharmaceutical science—A review. Asian J. Res. Chem. Pharm. Sci. 2014, 1, 27–44. [Google Scholar]
  11. Hu, Y.; Zheng, Z.; Zhai, D.; Liang, P.; Wang, Z.; Jiang, C.; Guo, Y.; Chen, H.; Shen, C.; Wu, Y.; et al. A Mini-Review: Exploring the Application Prospects of the Three Major Rules in the Field of Antioxidants. J. Mol. Struct. 2024, 1304, 137746. [Google Scholar] [CrossRef]
  12. Losada-Barreiro, S.; Sezgin-Bayindir, Z.; Paiva-Martins, F.; Bravo-Díaz, C. Biochemistry of Antioxidants: Mechanisms and Pharmaceutical Applications. Biomedicines 2022, 10, 3051. [Google Scholar] [CrossRef] [PubMed]
  13. Kurutas, E. The importance of antioxidants which play the role in cellular response against oxidative/nitrosative stress: Current state. Nutr. J. 2016, 15, 71. [Google Scholar] [CrossRef] [PubMed]
  14. Niki, E. Antioxidants: Basic Principles, Emerging Concepts, and Problems. Biomed. J. 2014, 37, 106–111. [Google Scholar] [CrossRef] [PubMed]
  15. Nimse, S.B.; Pal, D. Free radicals, natural antioxidants, and their reaction mechanisms. RSC Adv. 2015, 5, 27986–28006. [Google Scholar] [CrossRef]
  16. Goyeneche, R.; Roura, S.; Ponce, A.G.; Vega-Galvez, A.; Quispe, I.; Uribe, E.; Di Scala, K. Chemical characterization and antioxidant capacity of red radish (Raphanus sativus L.) leaves and roots. J. Funct. Foods 2015, 16, 256–264. [Google Scholar] [CrossRef]
  17. Kozai, T. Propagation, grafting and transplant production in closed systems with artificial lighting for commercialization in Japan. Propag. Ornam. Plants 2007, 7, 145–149. [Google Scholar]
  18. Kozai, T.; Kubota, C.; Chun, C.; Afreen, F.; Ohyama, K. Necessity and Concept of the Closed Transplant Production System. In Transplant Production in the 21st Century: Proceedings of the International Symposium on Transplant Production in Closed System for Solving the Global Issues on Environmental Conservation, Food, Resources and Energy; Springer: Dordrecht, The Netherlands, 2000. [Google Scholar]
  19. Morimoto, T.; Torii, T.; Hashimoto, Y. Optimal control of physiological processes of plants in a green plant factory. Control Eng. Pract. 1995, 3, 505–511. [Google Scholar] [CrossRef]
  20. Nicole, C.C.s.; Charalambous, F.; Martinakos, S.; Voort, S.; Li, Z.; Verhoog, M.; Krijn, M. Lettuce growth and quality optimization in a plant factory. Acta Hortic. 2016, 1134, 231–238. [Google Scholar] [CrossRef]
  21. Kang, J.; Sugumaran, K.; Atulba, S.L.; Jeong, B.R.; Hwang, S. Light intensity and photoperiod influence the growth and development of hydroponically grown leaf lettuce in a closed-type plant factory system. Horticulture 2013, 54, 501–509. [Google Scholar] [CrossRef]
  22. Shimizu, H. Light Environment Optimization for Lettuce Growth in Plant Factory. IFAC Proc. Vol. 2011, 18, 605–609. [Google Scholar] [CrossRef]
  23. Kozai, T. Resource use efficiency of closed plant production system with artificial light: Concept, estimation and application to plant factory. Proc. Jpn. Acad. Ser. B Phys. Biol. Sci. 2013, 89, 447–461. [Google Scholar] [CrossRef] [PubMed]
  24. Bantis, F.; Ouzounis, T.; Radoglou, K. Artificial LED lighting enhances growth characteristics and total phenolic content of Ocimum basilicum, but variably affects transplant success. Sci. Hortic. 2016, 198, 277–283. [Google Scholar] [CrossRef]
  25. Shao, L.; Fu, Y.; Liu, H.; Liu, H. Changes of the antioxidant capacity in Gynura bicolor DC under different light sources. Sci. Hortic. 2015, 184, 40–45. [Google Scholar] [CrossRef]
  26. Shiga, T.; Shoji, K.; Shimada, H.; Hashida, S.-n.; Goto, F.; Yoshihara, T. Effect of light quality on rosmarinic acid content and antioxidant activity of sweet basil, Ocimum basilicum L. Plant Biotechnol. 2009, 26, 255–259. [Google Scholar] [CrossRef]
  27. Chutimanukul, P.; Wanichananan, P.; Janta, S.; Toojinda, T.; Darwell, C.T.; Mosaleeyanon, K. The influence of different light spectra on physiological responses, antioxidant capacity and chemical compositions in two holy basil cultivars. Sci. Rep. 2022, 12, 588. [Google Scholar] [CrossRef]
  28. Chutimanukul, P.; Jindamol, H.; Thongtip, A.; Korinsak, S.; Romyanon, K.; Toojinda, T.; Darwell, C.T.; Wanichananan, P.; Panya, A.; Kaewsri, W.; et al. Physiological responses and variation in secondary metabolite content among Thai holy basil cultivars (Ocimum tenuiflorum L.) grown under controlled environmental conditions in a plant factory. Front. Plant Sci. 2022, 13, 1008917. [Google Scholar] [CrossRef]
  29. Yorio, N.C.; Goins, G.D.; Kagie, H.R.; Wheeler, R.M.; Sager, J.C. Improving spinach, radish, and lettuce growth under red light-emitting diodes (LEDs) with blue light supplementation. HortScience 2001, 36, 380–383. [Google Scholar] [CrossRef]
  30. Zha, L.; Liu, W. Effects of light quality, light intensity, and photoperiod on growth and yield of cherry radish grown under red plus blue LEDs. Hortic. Environ. Biotechnol. 2018, 59, 511–518. [Google Scholar] [CrossRef]
  31. Gam, D.T.; Khoi, P.H.; Ngoc, P.B.; Linh, L.K.; Hung, N.K.; Anh, P.T.L.; Thu, N.T.; Hien, N.T.T.; Khanh, T.D.; Ha, C.H. LED Lights Promote Growth and Flavonoid Accumulation of Anoectochilus roxburghii and Are Linked to the Enhanced Expression of Several Related Genes. Plants 2020, 9, 1344. [Google Scholar] [CrossRef]
  32. Pritchard, S.G.; Prior, S.A.; Rogers, H.H.; Davis, M.A.; Runion, G.B.; Popham, T.W. Effects of elevated atmospheric CO2 on root dynamics and productivity of sorghum grown under conventional and conservation agricultural management practices. Agric. Ecosyst. Environ. 2006, 113, 175–183. [Google Scholar] [CrossRef]
  33. Yang, Z.; Liu, B.; Su, J.; Liao, J.; Lin, C.; Oka, Y. Cryptochromes Orchestrate Transcription Regulation of Diverse Blue Light Responses in Plants. Photochem. Photobiol. 2017, 93, 112–127. [Google Scholar] [CrossRef] [PubMed]
  34. Liang, Y.; Kang, C.; Kaiser, E.; Kuang, Y.; Yang, Q.; Li, T. Red/blue light ratios induce morphology and physiology alterations differently in cucumber and tomato. Sci. Hortic. 2021, 281, 109995. [Google Scholar] [CrossRef]
  35. Samuoliene, G.; Sirtautas, R.; Brazaitytė, A.; Miliauskienė, J.; Sakalauskienė, S.; Duchovskis, P. The impact of red and blue light-emitting diode illumination on radish physiological indices. Cent. Eur. J. Biol. 2011, 6, 821–828. [Google Scholar] [CrossRef]
  36. Liu, J.; van Iersel, M.W. Photosynthetic Physiology of Blue, Green, and Red Light: Light Intensity Effects and Underlying Mechanisms. Front. Plant Sci. 2021, 12, 619987. [Google Scholar] [CrossRef]
  37. Stirbet, A.; Lazár, D.; Guo, Y.; Govindjee, G. Photosynthesis: Basics, history and modelling. Ann. Bot. 2019, 126, 511–537. [Google Scholar] [CrossRef]
  38. Engineer, C.B.; Hashimoto-Sugimoto, M.; Negi, J.; Israelsson-Nordström, M.; Azoulay-Shemer, T.; Rappel, W.-J.; Iba, K.; Schroeder, J.I. CO2 Sensing and CO2 Regulation of Stomatal Conductance: Advances and Open Questions. Trends Plant Sci. 2016, 21, 16–30. [Google Scholar] [CrossRef]
  39. Doi, M.; Kitagawa, Y.; Shimazaki, K. Stomatal Blue Light Response Is Present in Early Vascular Plants. Plant Physiol. 2015, 169, 1205–1213. [Google Scholar] [CrossRef]
  40. Lattanzio, V.; Lattanzino, V.M.T.; Cardinali, A. Role of phenolics in the resistance mechanisms of plants against fungal pathogens and insects. Phytochem. Adv. Res. 2006, 661, 23–67. [Google Scholar]
  41. Weeplian, T.; Yen, T.-B.; Ho, Y.-S. Growth, Development, and Chemical Constituents of Edible Ice Plant (Mesembryanthemum crystallinum L.) Produced under Combinations of Light-emitting Diode Lights. HortScience 2018, 53, 865–874. [Google Scholar] [CrossRef]
  42. Zhang, X.; Bian, Z.; Yuan, X.; Chen, X.; Lu, C. A review on the effects of light-emitting diode (LED) light on the nutrients of sprouts and microgreens. Trends Food Sci. Technol. 2020, 99, 203–216. [Google Scholar]
  43. Taulavuori, K.; Pyysalo, A.; Taulavuori, E.; Julkunen-Tiitto, R. Responses of phenolic acid and flavonoid synthesis to blue and blue-violet light depends on plant species. Environ. Exp. Bot. 2018, 150, 183–187. [Google Scholar] [CrossRef]
  44. Batista, D.S.; Felipe, S.H.S.; Silva, T.D.; Castro, K.M.; Mamedes-Rodrigues, T.C.; Miranda, N.A.; Ríos-Ríos, A.M.; Faria, D.V.; Fortini, E.A.; Chagas, K.; et al. Light quality in plant tissue culture: Does it matter? In Vitro Cell. Dev. Biol. Plant 2018, 54, 195–215. [Google Scholar]
  45. Li, Q.; Kubota, C. Effects of supplemental light quality on growth and phytochemicals of baby leaf lettuce. Environ. Exp. Bot. 2009, 67, 59–64. [Google Scholar] [CrossRef]
  46. Johkan, M.; Shoji, K.; Goto, F.; Hashida, S.-N.; Yoshihara, T. Blue Light-emitting Diode Light Irradiation of Seedlings Improves Seedling Quality and Growth after Transplanting in Red Leaf Lettuce. HortScience 2010, 45, 1809–1814. [Google Scholar] [CrossRef]
  47. Jang, E.B.; Ho, T.-T.; Park, S.-Y. Effect of light quality and tissue origin on phenolic compound accumulation and antioxidant activity in Camellia japonica calli. In Vitro Cell. Dev. Biol. Plant 2020, 56, 567–577. [Google Scholar] [CrossRef]
  48. Kondo, S.; Tomiyama, H.; Rodyoung, A.; Okawa, K.; Ohara, H.; Sugaya, S.; Terahara, N.; Hirai, N. Abscisic acid metabolism and anthocyanin synthesis in grape skin are affected by light emitting diode (LED) irradiation at night. J. Plant Physiol. 2014, 171, 823–829. [Google Scholar] [CrossRef]
  49. Stutte, G.W. Light-emitting Diodes for Manipulating the Phytochrome Apparatus. HortScience 2009, 44, 231–234. [Google Scholar] [CrossRef]
  50. Wong, C.E.; Teo, Z.W.N.; Shen, L.; Yu, H. Seeing the lights for leafy greens in indoor vertical farming. Trends Food Sci. Technol. 2020, 106, 48–63. [Google Scholar] [CrossRef]
  51. Landi, M.; Zivcak, M.; Sytar, O.; Brestic, M.; Allakhverdiev, S.I. Plasticity of photosynthetic processes and the accumulation of secondary metabolites in plants in response to monochromatic light environments: A review. Biochim. Biophys. Acta Bioenerg. 2020, 1861, 148131. [Google Scholar] [CrossRef]
  52. Fazal, H.; Abbasi, B.H.; Ahmad, N.; Ali, S.S.; Akbar, F.; Kanwal, F. Correlation of different spectral lights with biomass accumulation and production of antioxidant secondary metabolites in callus cultures of medicinally important Prunella vulgaris L. J. Photochem. Photobiol. B Biol. 2016, 159, 1–7. [Google Scholar] [CrossRef]
  53. Tang, Y.; Mao, R.; Guo, S. Effects of LED spectra on growth, gas exchange, antioxidant activity and nutritional quality of vegetable species. Life Sci. Space Res. 2020, 26, 77–84. [Google Scholar] [CrossRef]
  54. Heo, J.; Lee, Y.; Kim, D.; Chang, Y.; Chun, C. Effects of Supplementary LED Lighting on Growth and Biochemical Parametets in Dieffenbachia amoena ‘Camella’ and Ficus elastica ‘Melany’. J. Korean Hort. Sci. Tech. 2010, 28, 51–58. [Google Scholar]
  55. Martineau, V.; Lefsrud, M.; Naznin, T.; Kopsell, D. Comparison of Light-emitting Diode and High-pressure Sodium Light Treatments for Hydroponics Growth of Boston Lettuce. HortScience 2012, 47, 477–482. [Google Scholar] [CrossRef]
  56. Barros, L.; Ferreira, M.-J.; Queirós, B.; Ferreira, I.; Baptista, P. Total phenols, ascorbic acid, B-Carotene and lycopene in Portuguese wild edible mushrooms and their antioxidant activities. Food Chem. 2007, 103, 413–419. [Google Scholar] [CrossRef]
  57. Murakami, M.; Yamaguchi, T.; Takamura, H.; Matoba, T. Effects of Ascorbic Acid and α-Tocopherol on Antioxidant Activity of Polyphenolic Compounds. J. Food Sci. 2006, 68, 1622–1625. [Google Scholar] [CrossRef]
  58. Lobo, V.; Patil, A.; Phatak, A.; Chandra, N. Free radicals, antioxidants and functional foods: Impact on human health. Pharmacogn. Rev. 2010, 4, 118–126. [Google Scholar] [CrossRef]
Figure 1. Five different light spectrum treatments were applied to the five radish cultivars.
Horticulturae 10 01059 g001
Figure 2. The phenotype of cherry belle (A), black Spanish (B), hailstone white (C), Malaga violet (D), and sparkler white tip (E) under five light treatments (1R:1G:1B, 1R:2G:1B, 1R:3G:1B, 1R:3B, and 3R:1B). R, G, and B represent the red, green, and blue light spectra, respectively, and the number before the letter stands for the ratio of each light spectrum.
Horticulturae 10 01059 g002
Figure 3. Biomass and plant growth of five radish varieties on different light spectrum treatments on root diameter (A), root length (B), root fresh weight (C), and root dry weight (D). R, G, and B represent the red, green, and blue light spectra, respectively, and the number before the letters stands for the ratio of each light spectrum. Values are means with standard deviations (n = 4). The letters above the bars indicate statistically significant differences by Duncan’s multiple range tests (p < 0.05). The absence of letters indicates no significant difference.
Horticulturae 10 01059 g003
Figure 4. Physiological responses of five radish varieties on different light spectrum treatments on photosynthetic rate (A), transpiration rate (B), stomatal conductance (C), and intercellular CO2 concentration (D). R, G, and B represent the red, green, and blue light spectra, respectively, and the number before the letters stands for the ratio of each light spectrum. Values are means with standard deviations (n = 4). The letters above the bars indicate statistically significant differences by Duncan’s multiple range tests (p < 0.05). The absence of letters indicates no significant difference.
Horticulturae 10 01059 g004
Figure 5. The quantities of secondary metabolites and antioxidant capacity of five radish varieties on different light spectrum treatments on total phenolic (A), flavonoid (B), anthocyanin (C), and DPPH scavenging activity (D). R, G, and B represent the red, green, and blue light spectra, respectively, and the number before the letters stands for the ratio of each light spectrum. Values are means with standard deviations (n = 4). The letters above the bars indicate statistically significant differences by Duncan’s multiple range tests (p < 0.05). The absence of letters indicates no significant difference.
Horticulturae 10 01059 g005
Disclaimer/Publisher’s Note: The statements, opinions and data contained in all publications are solely those of the individual author(s) and contributor(s) and not of MDPI and/or the editor(s). MDPI and/or the editor(s) disclaim responsibility for any injury to people or property resulting from any ideas, methods, instructions or products referred to in the content.

