1. Introduction
The generic name “Eustoma” combines the Greek words “Eu” (beauty) and “stoma” (mouth), meaning “flower with a large and beautiful mouth” [
1,
2,
3]. The color and shape of lisianthus flowers are highly valued commercially, making them popular among growers and distributors [
4]. Lisianthus is native to Texas and the Colorado plateau in the United States, where it has been cultivated since 1960 [
5], and cultivation for cut flower production began in the early 1980s by Japanese seed companies [
1,
6,
7].
In recent years, the market demand for cut flowers has continued to expand, with over 4 billion dollars globally distributed [
8]. The appearance of lisianthus, with its rose-like petals, is highly appealing to consumers [
9,
10], leading to a sharp increase in sales over the past few years [
11]. From a growers’ perspective, lisianthus produces many blossoms on a single stem, and its flowers and leaves are highly durable [
9], making it easy to transport worldwide [
12,
13]. Lisianthus can be cultivated annually, and its shipping schedule can be adjusted, making it a highly valuable crop for growers [
2].
The market value of cut flowers largely depends on their vase life [
8]. Cut flowers experience a decrease in moisture content owing to active transpiration and low water absorption, leading to quality degradation and shortened vase life during transportation and storage [
8]. Additionally, a low moisture content inhibits water transpiration through the leaves, causing secondary water stress, which further affects the vase life of cut flowers and rapidly diminishes their decorative value [
14]. Cut flowers have limited vase life because senescence accelerates after flower cutting and is typically accompanied by morphological, physiological, and biochemical deterioration [
15,
16]. This is induced by ethylene biosynthesis as oxidative stress associated with the production of reactive oxygen species and free radical increases [
17]. Ethylene also affects the gene expression and activity of degradative enzymes such as lipoxygenase, lipase, pectinase, protease, polygalacturonase, and chlorophyllase [
18,
19,
20,
21]. The postharvest longevity of cut flowers is influenced by water and nutrient loss due to increased respiration and pathogen infection. Bacteria and fungi cause stomatal blockage, hindering the water transport [
22,
23,
24]. Moreover, the vase life of cut flowers is significantly affected by the cultivation environment [
25]. Lisianthus is typically produced by soil cultivation via vegetative propagation. However, vegetatively propagated lisianthus seedlings have the disadvantage of inconsistent quality in terms of flowering time, plant height, and number of flowers [
26]. Furthermore, continuous cropping of lisianthus in soil cultivation often leads to severe quality degradation and yield reduction [
27]. Although the reasons for the continuous cropping damage are not yet clear, they have been reported to be related to inadequate soil nutrient conditions and allelopathy [
28]. Therefore, hydroponic cultivation has recently been widely applied in South Korea as an alternative to soil cultivation of lisianthus [
29].
Among the several techniques prolonging the vase life and quality of cut flowers, chemical treatments are widely used in floriculture industry. Cut flowers are kept in vase solutions, containing carbohydrates, germicides, plant growth regulators, ethylene inhibitors, mineral salts, and organic acids to extend flower postharvest performance [
30]. The vase life can be extended by supplying soluble sugars, such as sucrose, glucose, or fructose, in preservatives [
30]. The sugars act as a source of respiratory substrate, improving the absorption capacity, helping to maintain petal turgidity and prolonging the vase life of cut flowers [
24]. The germicides are antimicrobial chemicals designed to prevent the growth of bacteria, fungi, and other microorganisms [
31]. Organic acids lower the pH of vase solutions, inhibiting the proliferation of bacteria that block xylem vessels in the cut area and prevent the maintenance of water balance [
24]. The ethylene inhibitors, aminoethoxyvinylglycine, aminooxyacetic acid, and 1-methylcyclopropene, prevent the synthesis of ethylene, which accelerates senescence. On the contrary, several plant hormones have the effect of delaying senescence. Salicylic acid (SA) has been widely used in the floriculture industry to extend the vase life of roses, gladiolus, carnation, and other cut flowers [
29]. SA is known to play an important role in systemic acquired resistance to pathogens and inhibits ethlyene production by suppressing the activities of 1-aminocyclopropane-1-carboxylate (ACC) synthase and ACC oxidase [
29]. Moreover, several phenolic compounds, which are induced by SA, directly affect the photosynthetic electron transport chain or indirectly influence the photosynthetic machinery by controlling stomatal conductivity [
29].
In general, destructive methods have been used to identify substances present in plants or to estimate their content, which involve grinding the plants and measuring them using a spectrophotometer or high-performance liquid chromatography (HPLC). This destructive measurement approach requires significant sample quantities, substantial time, and labor investment for the measurements. However, with the recent rise of smart farms and smart agriculture, non-destructive methods are becoming more important than destructive ones. This is because measuring crop status using real-time, non-destructive methods can be widely used throughout all stages of crop production, cultivation and distribution. These systems are implemented using hyperspectral imaging technology. Hyperspectral imaging (HSI) is a technology that combines spectroscopic and imaging techniques to accurately analyze various material properties by measuring continuous wavelengths from the visible and near-infrared spectrum range [
32]. The most common wavelength range used for flavonoid detection is the visible and near-infrared spectrum, typically spanning from 400 nm to 1000 nm [
33]. Our research utilized a colorimeter to detect the increase in colorless or yellowish flavonols observed as senescent changes in cut flowers, determined by b* values. The CIELAB is a three-dimensional color space with three coordinates: L* (lightness, ranging from 0 (black) to 100 (white)), a* (red–green axis, with negative values toward green and positive values toward red), and b* (blue–yellow axis, with negative values toward blue and positive values toward yellow). The a* and b* axes are unbounded, but measurement software limits them to a range such as −128 to 127 [
34]. Colorimeters use three filters (red, green, blue) to take wideband readings along the visible spectrum to obtain an estimate of color and a measurement wavelength range of 380–500 nm is mentioned for detecting yellow color [
34]. Although the measurement range of the colorimeter we used is limited to the visible light spectrum, our previous study has demonstrated that colorimeter is capable of detecting flavonols, which can be used to estimate the vase life of cut flowers [
29].
The color of leaves and flowers in plant organs serves as a phenotypic indicator of the physiological status of plants [
35]. Flower petal color is an important indicator of floral quality and can be accurately measured using a colorimeter based on the CIELAB color system [
36]. The petal color of lisianthus varies significantly among cultivars, and even within the same cultivar, color can change depending on the cultivation environment [
37]. Additionally, the color change in cut flowers is associated with vase life, resulting in differences in the petal color space over time, which can be used to predict or distinguish vase life [
29,
38,
39]. The physiological and biochemical properties of pigments are closely related to the senescence process of flowers, and in our previous research, we developed a model that predicts vase life based on petal color data [
29]. In this study, we have aimed to measure the CIELAB values of petals on each day of vase life, determine the color space distribution of each petal over time, and develop a machine learning model to differentiate measurement days based on these data.
2. Materials and Methods
2.1. Plant Materials
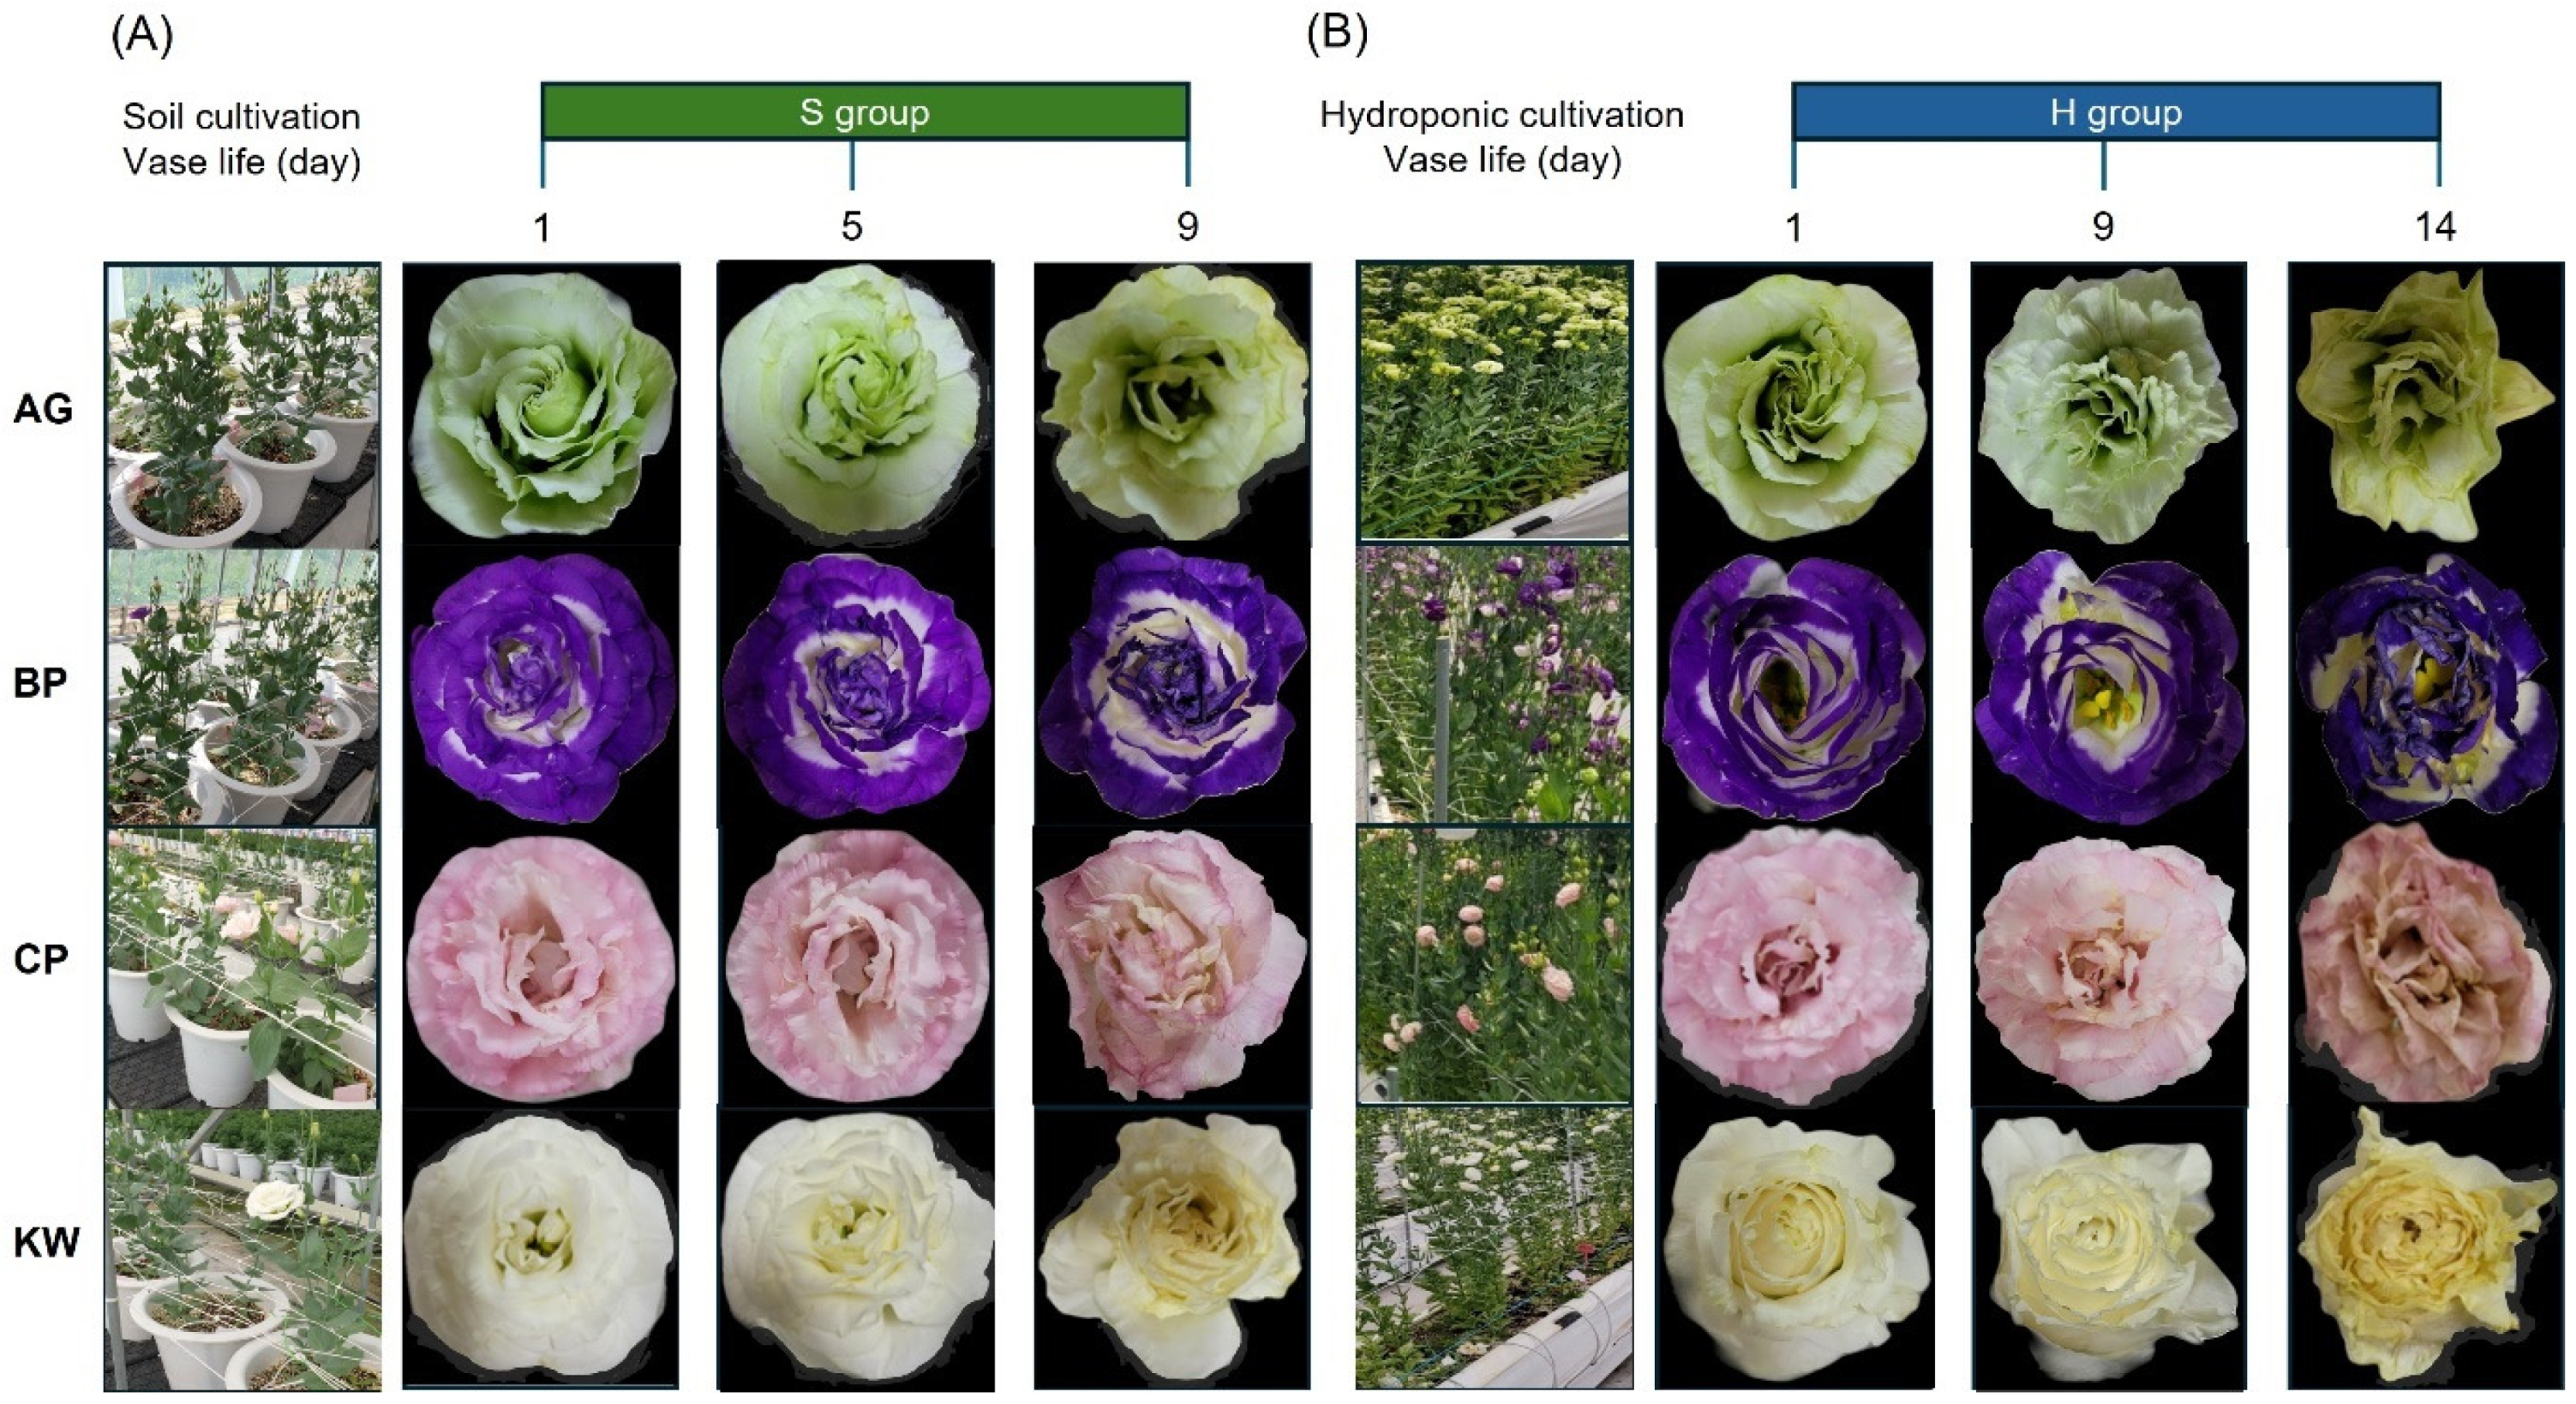
One thousand lisianthus seedlings were planted in a greenhouse at the Pocheon Agricultural Technology Center on 22 June 2022. Four cultivars were planted in equal proportions: Arena Green (AG), Blue Picote (BP), Corelli Pink (CP), and Kroma White (KW). These sixty-five-day-old seedlings were randomly divided into soil (S) or hydroponic (H) cultivation groups, and 48 seedlings were randomly selected and assigned to the two treatment groups after cultivation. This process was repeated thrice for each group. Throughout the cultivation period, the greenhouse maintained an average temperature of 28 °C and an average duration of 13.5 h, utilizing natural daylight with shading from 11:00 AM to 2:00 PM on days of high light intensity or artificial light on cloudy days. The greenhouse maintained a humidity level of 65 ± 10% and a CO2 concentration of 393.3 ppm. Designated beds were established within the greenhouse for the cultivation of S and H.
The soil for S cultivation was prepared by mixing peat moss, horticultural substrates, perlite, and oil cake in the following proportions: 0.50:0.38:0.10:0.02. The composite soil samples were analyzed as follows: pH (1:5), 6.9; organic matter (OM), 54 g kg−1; available phosphate (Av. P2O4), 790 mg kg−1; exchangeable (Exch.) K, 14.8 cmolc kg−1; Exch. Ca, 14.8 cmolc kg−1; Exch. Mg, 4.8 cmolc kg−1; and electrical conductivity (EC), 2.3 dS m−1.
The nutrient solution for H cultivation, based on a volume of 1000 L, was prepared for tank A by combining KNO3 (303 g), CaNO3 (944 g), and Fe-EDTA (22.62 mg) and for tank B by combining KNO3 (303 g), NH4H2PO4 (115 g), MgSO4·7H2O (492 g), CuSO4·5H2O (78.58 mg), H3BO3 (2858.5 mg), MnSO4·H2O (1538 mg), ZnSO4·7H2O (219.8 mg), and NH4Mo7O24·4H2O (121.3 mg). The prepared nutrient solution was applied using a drip irrigation system. The nutrient solution was analyzed as follows: pH (1:5), 6.7; OM, 54 g kg−1; Av. P2O4, 674 mg kg−1; Exch. K, 13.7 cmolc kg−1; Exch. Ca, 13.7 cmolc kg−1; Exch. Mg, 4.4 cmolc kg−1; and EC, 2.7 dS m−1. The medium comprised peat moss and perlite in a 1:1 ratio.
The two treatment groups were cultivated in the same greenhouse; however, the moisture and nutrients supplied to the soil differed. In the S cultivation, lisianthus was planted three times in a container of 35 × 30 × 24 cm. For the first two weeks after planting, 2 L of water was supplied four times a week per container, and from the third week onward, the same amount of water was provided three times a week. Watering was consistently carried out between 9:00 AM and 10:00 AM.
In contrast, in the H cultivation, lisianthus was replanted in a container measuring 30 × 40 × 2500 cm filled with media. During the first two weeks after planting, only tap water was provided. In the second week, 30 mL of the nutrient solution was supplied five times a day using a drip irrigation system, each time lasting 10 s. From the fourth week onwards, 40 mL of the nutrient solution was supplied eight times a day, each time lasting 10 s. As a result, lisianthus in S cultivation occupied a smaller area than that in H cultivation, and the two treatment groups had different moisture and nutrient supplies. The time to first flowering was 56 and 58 days for S and H cultivation, respectively. In addition, the time required to harvest three flowers from each lisianthus plant was longer under H cultivation than under S cultivation.
2.2. Preparation of Cut Flowers and Collection of Colorimetric Data According to the Stages of Vase Life
The flowers were cut on 31 August 2022 for the S cultivation and on 16 September 2022 for the H cultivation. Taking into account factors such as flower size and flowering opening (whether the flower was 60–70% open), we selected and cut flowers that were at a similar stage of flowering. The four lisianthus cultivars showed differences in their flowers, stems, and the appearance and location of their leaves. The flower stems were cut to 5 cm to match the stem length of the four cultivars, and all lower leaves were removed. Cut flowers cultivated under S cultivation were measured for petal color using a colorimeter on the day of cutting (designated as Day 1) and subsequently at Days 5 and 9 after cutting. For cut flowers in H cultivation, which possess a longer vase life compared to those from S cultivation, petal color measurements were obtained at Days 1, 9, and 14. Forty-eight cut flowers were collected for each cultivar, and colorimetric data were measured in five replicates per cut flower. Thus, a total of 960 measurements were obtained for each cultivation group. Cut flowers were grown in a laboratory at a constant temperature of 20.4 °C, relative humidity of 60–76%, and illumination of 7.43–9.45 μmol m2 s−1. The water in the vase was obtained from tap water in the laboratory and replaced with fresh water every 5 days. The water levels in each vase were maintained at a constant level and no preservatives were added to ensure that the vase life of all flowers was assessed fairly. Three stems of each lisianthus species were placed in each vase. The CIELAB color space was measured using a colorimeter (CR-300; Konica Minolta, Tokyo, Japan) and consisted of L* (lightness), a*, and b* (chromaticity indices) values. Color changes were observed from the initial flowering stage of cut flowers (Day 1) until obvious wilting (Day 9 for S cultivation or Day 14 for H cultivation).
2.3. Statistical Analysis
We used a two-way interaction between cultivar and group to explain the CIELAB values (L*, a*, b*). The figures were visualized using R 4.4.1 [
40] on RStudio (v. 2024.04.02) using the following packages: dplyr, emmeans, ggplot2, ggpubr, rstatix, and tidyverse. To describe senescence over time after flower cutting, we visualized the color changes of the flowers for the measurement days. For graphical demonstration, flowers grown in the S treatment group were grouped by measurement day (Day 1, 5, and 9) and cultivar (AG, BP, CP, and KW). The flowers treated in the H group were grouped by measurement day (Day 1, 9, and 14) and cultivar.
Each data point (L*, a*, b*) was plotted in 3-dimensional space where the x-, y-, and z-axes represent the values of a*, b*, and L*, respectively. The L*, a*, and b* values were converted to standardized RGB values, and each data point was colored using the associated RGB values. The 3-dimensional mean vector and covariance matrix were estimated for each cultivar and measurement day, and an ellipsoid was superimposed in the 3-dimensional space to represent a confidence region for the three expected color parameters at a confidence level of 0.95. The plot3D and rgl packages were used in R for graphical representation.
In addition, we used machine learning (ML) algorithms to classify the measurement days of vase life using petal colorimetric values. The vase life of cut flowers in soil cultivation was approximately 10 days, and measurements were obtained on Days 1, 5, and 9 after flower cutting, with five repeated measurements in 48 samples. The vase life of cut flowers in hydroponic cultivation was approximately 15 days, and measurements were obtained on Days 1, 9, and 14 in the same way as described above. The H
2O package (
https://docs.h2o.ai, accessed on 1 July 2024) was used to implement the ML algorithms in R [
41]. The area under the ROC curve (AUC) was calculated for classification.
ML analysis suffers from repetitive processes such as data pre-processing, variable selection, algorithm selection, training, and hyperparameter tuning. This leads to researchers from various fields experiencing considerable difficulty in applying machine learning. To facilitate this, researchers can readily develop ML models owing to the automation of processes through automated machine learning (AutoML). While numerous AutoML frameworks have been developed to date, we opted for the use of H
2O’s AutoML platform [
41]. We employed an ensemble method that combines various ML models to distinguish different stages of vase life. Ensemble machine learning models use multiple algorithms to obtain better classification performance than could be obtained from any of the constituent learning algorithms [
41]. We used distributed random forests (DRF), gradient boosting machines (GBM), and generalized linear models (GLM), among various algorithms.
3. Results
3.1. The Changes in Petal Color Depending on Cultivation Method
In South Korea, lisianthus is primarily cultivated through soil cultivation; however, hydroponic cultivation is increasingly used to extend vase life (
Figure 1). In soil cultivation, the vase life is approximately 10 days, whereas in hydroponic cultivation, it reaches approximately 15 days. After flower cutting, changes in the color and shape of the petals occur over time. The circular flower corolla becomes more distorted as the senescence progresses. Additionally, the vibrant color of the petals gradually fades as vase life increases. The main reason for this is that, as shown in
Figure 1, the color of the petals turns more yellow as senescence progresses. This coloration differs from that produced by carotenoids and, when compared to other petal colors, appears as a nearly colorless or yellowish hue. This coloration arises from the expression of flavones or flavonols, which are types of flavonoids distinct from anthocyanins. These compounds act as copigments. Copigmentation is the phenomenon in which anthocyanins form complexes with copigments, such as flavonols or flavones, resulting in an enhancement of pigmentation [
29]. In the case of BP, a deepening of the purple color is observed as senescence progresses, due to increased binding between anthocyanins responsible for the initial violet hue and flavones which intensify the coloration. However, in AG and KW, the expression of anthocyanins is relatively low. Consequently, as senescence progresses, the pale-yellow color of the copigments becomes more prominent. Therefore, the increased expression of these copigments is a phenotype directly linked to senescence, and an index reflecting the relative increase in their content could provide a basis for quantifying flower senescence.
The petal color of the four cultivars was measured using a colorimeter according to the day of vase life (
Figure 2). In the CIELAB color space, the L* value represents the lightness: black at 0 and white at 100. The a* value represents the green–red opponent colors, and negative values toward green and positive values toward red. The b* value represents the blue–yellow opponent colors, and negative values toward blue and positive values toward yellow.
Across all cultivation groups, significant differences in L*, a*, and b* values were observed among the four cultivars according to their stage of senescence. In the S group, BP had an average a* value of 10.4 on Day 9, which was significantly lower than the values seen on Days 1 and 5 (13.5 and 14.2, respectively, p-values: 1.93 × 10⁻⁴ for Day 1 vs. Day 9, and 1.99 × 10⁻⁴ for Day 5 vs. Day 9). The average b* value on Day 9 was −7.27, which also showed a significant difference from the value on Day 5 (−10.7, p-value 3.63 × 10⁻⁴) and Day 1 (−10.3, p-value 1.21 × 10⁻⁴). In other words, for BP of the S group, there was a rapid change in the chromaticity indices (a* and b* values), excluding lightness (L* value), on Day 9 as the color senescence progressed. For CP in the S group, the average a* value on Day 1 was 12.3, but it significantly decreased to 8.7 on Day 9 (8.80 × 10⁻⁶). In other words, the pink color of CP gradually fades with petal senescence. On Day 1, the average b* value for CP was 2.8; however, it increased to 4.6 on Day 9 with a statistically non-significant change. This indicates that the petal color of CP became more yellow on Day 9, which was the vase life limit for the S group. Within the S group cultivars, no significant difference in L* values was observed as senescence progressed.
Regarding the L* value, the BP cultivated in the H group showed a significant difference in L* values between Days 1 and 14 (
p-value 7.84 × 10
−13) and between Days 9 and 14 (
p-value 1.14 × 10
−13), unlike the other cultivars. As the vase life reached 15 days, the L* value rapidly decreased, indicating a reduction in lightness, as shown in
Figure 1. In the H group, there was a trend of decreasing average L* values with increasing vase life, although the difference was not statistically significant except for BP. However, the BP in the S group showed no difference in the L* value between Days 1, 5, and 9. On Day 14, the average a* value for BP increased, making the red color more intense. The b* value decreased to −3.58 on Day 14 (
p-value 8.22 × 10
−3 for Day 9 vs. Day 14) from −0.64 on Day 9.
For the CP and KW in the H group, only the b* value changed significantly as senescence progressed. The average b* value was 4.4 on Day 1, but it increased significantly to 8.5 on Day 9 and 10.9 on Day 14 (p-value 2.71 × 10⁻⁴ and 1.70 × 10⁻¹², respectively). KW also showed a significant increase only in the b* value, similar to CP. The average b* value, which showed no difference between Day 1 and Day 9 (4.4 and 3.9, respectively), suddenly increased to 9.1 on Day 14 (p-value 2.01 × 10⁻⁷ for Day 1 vs. Day 14, and 2.27 × 10⁻⁶ for Day 9 vs. Day 14). Unlike BP, CP and KW showed an increase in the b* value by Day 14, indicating an increase in copigment expression. As petal senescence progressed significantly, the expression of the yellow color increased. Although senescence-induced changes in b* values varied across cultivars and cultivation method, there was a general tendency for b* values to increase as senescence progressed.
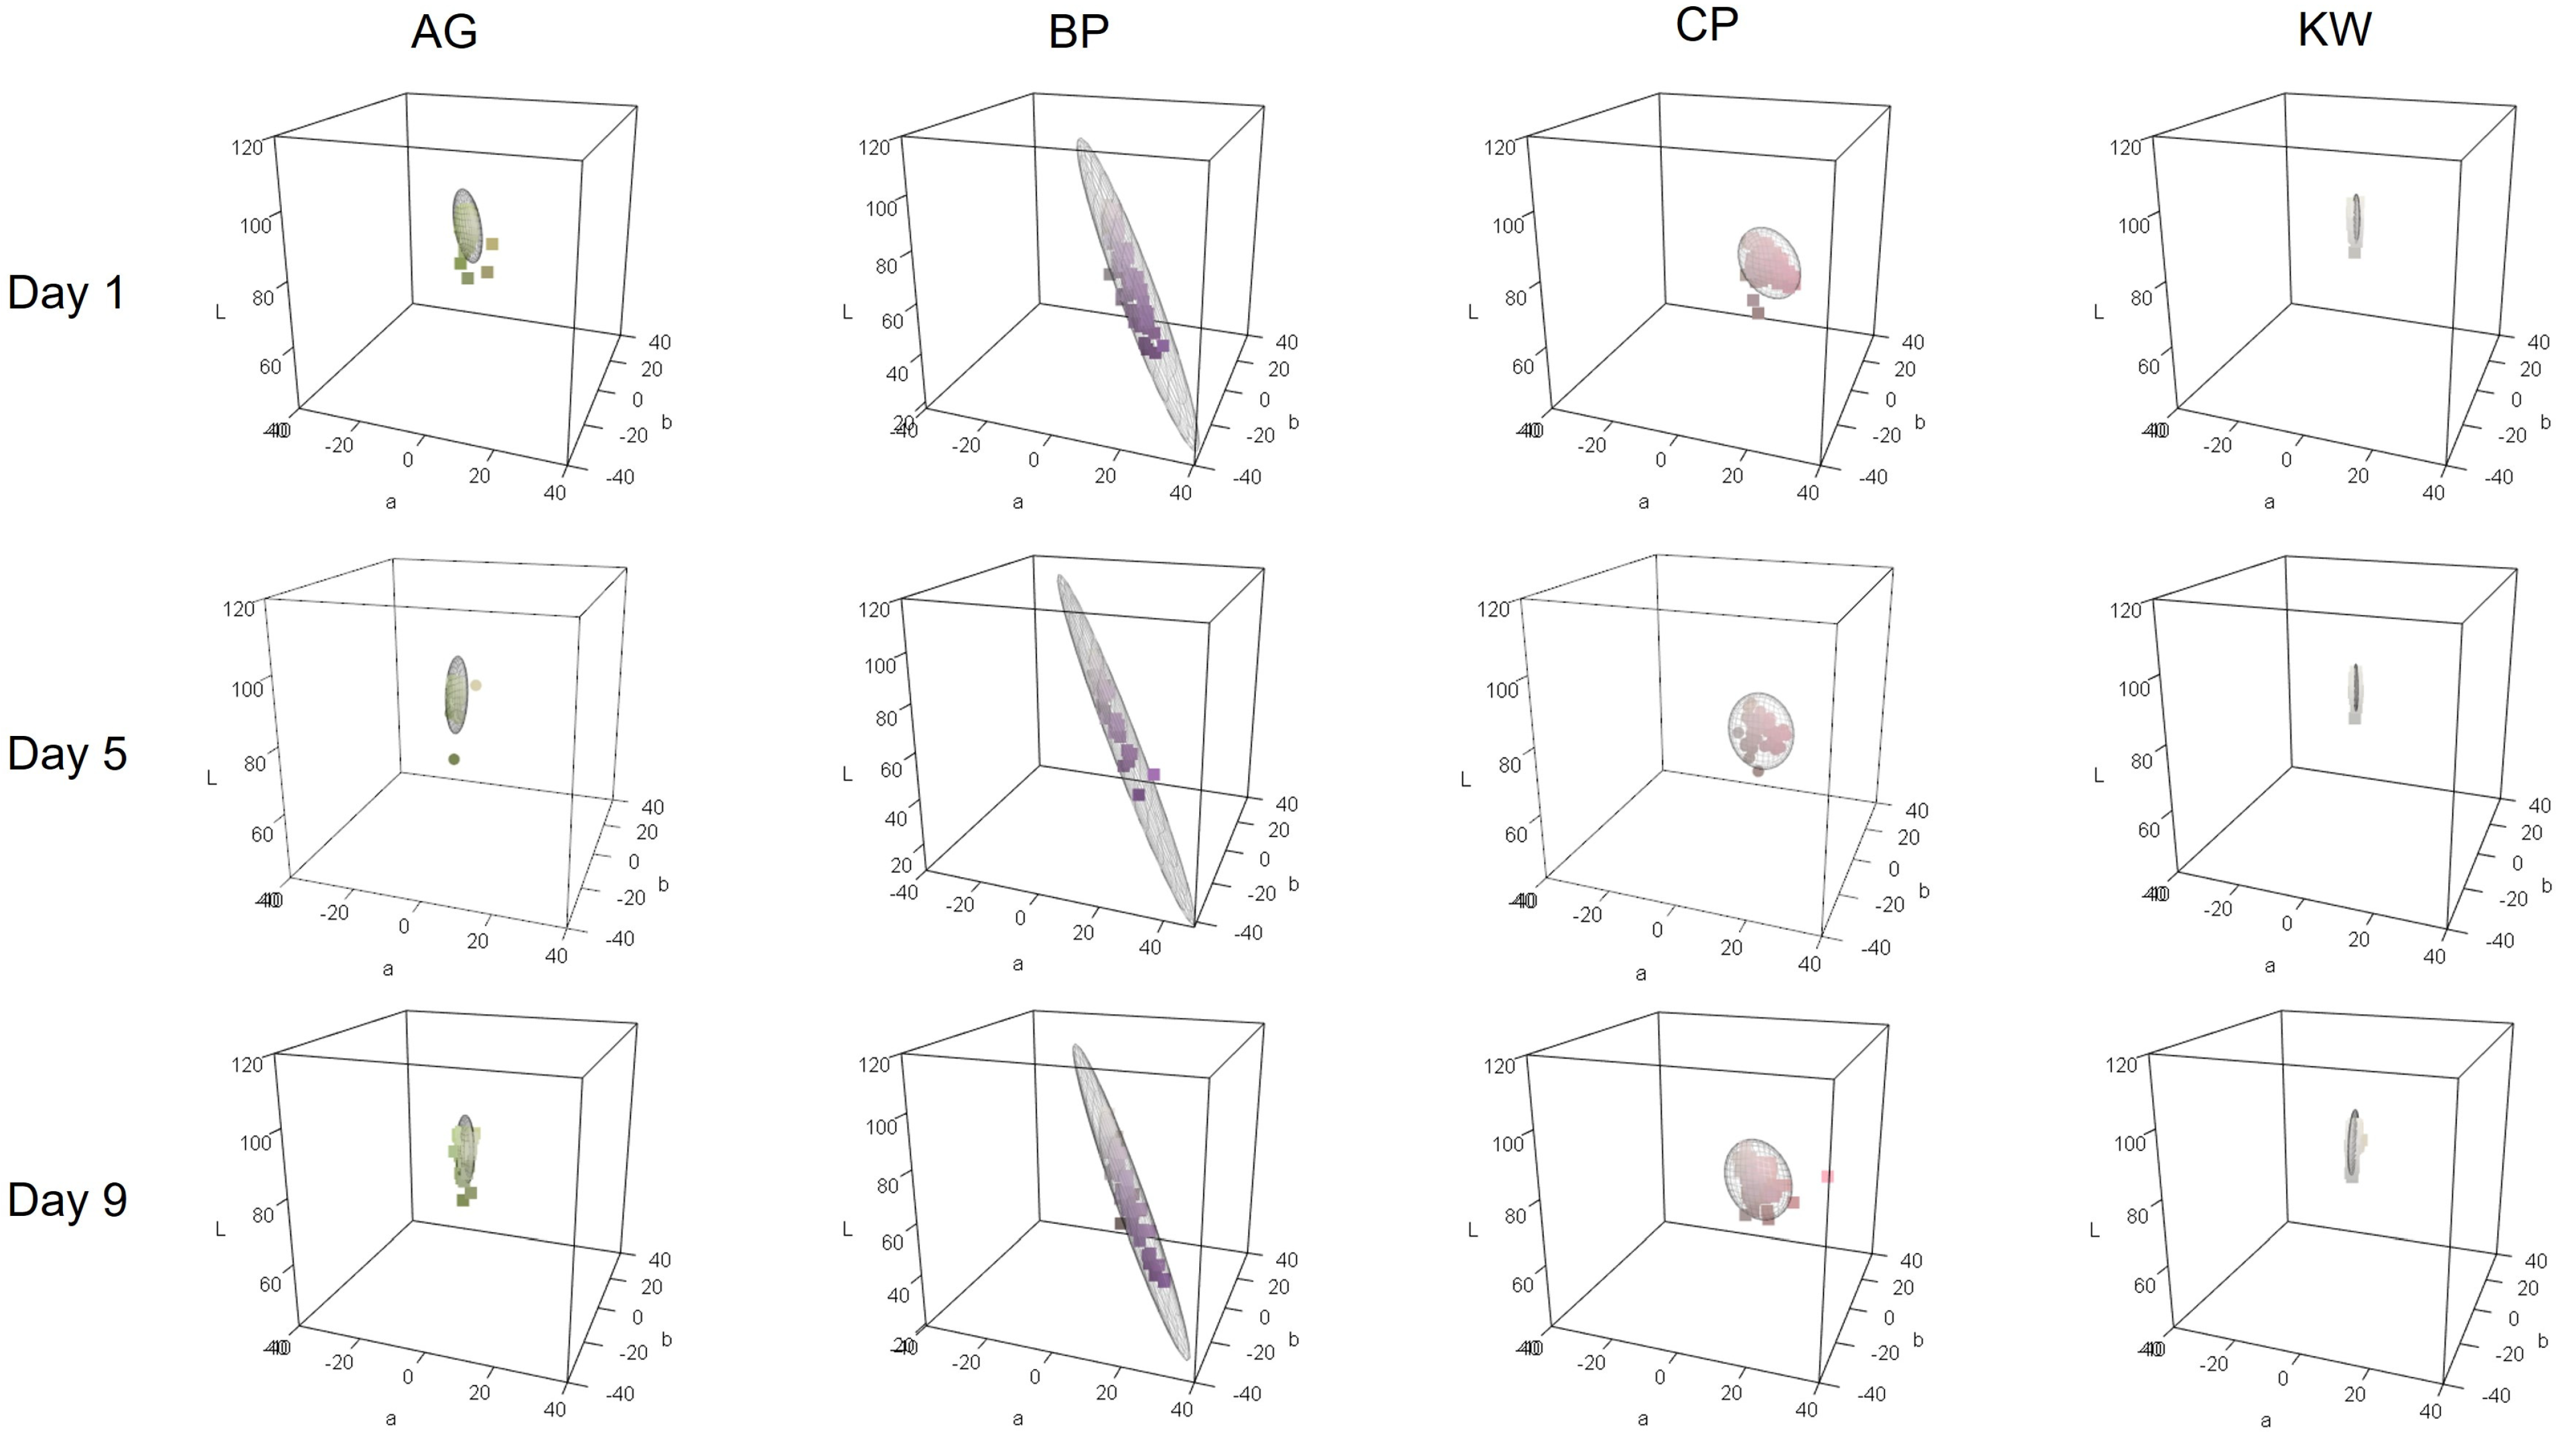
3.2. Three-Dimensional Plot Based on Petal Colorimetric Data
The three-dimensional color space was arranged according to the cultivar and measurement day (
Figure 3 for the S group and
Figure 4 for the H group). The points in the figure represent the petal color obtained by converting the CIELAB values into the RGB color. AG and KW formed an elongated ellipse parallel to the b* axis. This means that the variation in the b* values was large when compared to the other values. In contrast, CP formed an ellipse along the a* axis, indicating pink petals with a high a* value. BP had a purple petal color and exhibited the characteristics of a large a* value and a small b* value.
3.2.1. Soil Cultivation Group
The average vase life of cut lisianthus grown in group S was approximately 10 days after flower cutting. Therefore, petal colorimetric data were collected from the day that flower cutting was performed (Day 1) to Days 5 and 9 (
Figure 3). The change in the color space from Day 1 to Day 9 was not significant for any of the cultivars. The color space did not change significantly with changes in the measurement day of vase life, and as petal senescence progressed, the size of the ellipse did not change significantly. This means that, unlike in the H group, there was little variation between individuals, and the difference in color space between measurement days was not significant, making it difficult to distinguish based on petal color data between measurement days. While AG exhibited minimal variations in a* and b* values, the considerable variations in L* values resulted in an elongated oval shape aligned with the L* axis. Even as senescence progressed, the AG of the S group cultivars did not exhibit a significant increase in b* values. The ellipse of BP also did not change much with petal senescence, but the b* value increased and the a* value decreased, gradually weakening the characteristic purple color. The ellipse of CP has a larger b* value and a smaller a* value as it ages, meaning that the pink color of CP becomes less pink and the yellowish hue becomes more emphasized. KW did not show much variation in CIELAB values, forming a much smaller ellipse than the other varieties. However, as with the other varieties, there was a tendency for the b* value to increase on Day 9.
3.2.2. Hydroponic Cultivation Group
In the H group (
Figure 4), the average vase life after flower cutting was approximately 15 days; therefore, the color space of the petals was examined on Days 1, 9, and 14. Because the H group had a relatively longer vase life than the S group, the petal color space differed significantly depending on the day of measurement. The color space on Day 1 for the three cultivars, except BP, was parallel to the L* axis. On Day 14, the color space tended to be parallel to the a* × b* plane, meaning that on Day 1, the difference in petal color was due to differences in brightness, while on Day 14, the variation in hue was greater than that in lightness.
Within the H group, AG did not exhibit differences in L*, a*, and b* values across the measurement days. However, the petal color variation increased on Day 14, resulting in the formation of a larger ellipse. On Day 14, the lime green color has appeared due to the relatively pale green and darker yellow color. BP demonstrated an increasing ellipse size as color senescence progressed. As senescence progresses, the variation in L, a, and b values increases significantly. The lightness of BP decreases and the red color becomes darker as senescence progresses. However, although the b* values of Day 9 and Day 14 are statistically different, it cannot be said that the b* value has decreased due to its large variability on Day 14. Also, the b* value is negative, indicating a blue color, but some samples on Day 14 have a positive value, showing that some individuals have a yellow color. Therefore, the tendency for b* values to increase with senescence can also be said to apply to BP in the H group. In the H group, both the CP and KW ellipses tended towards increasing b* values over time. Based on these aforementioned observations, particularly the distinct color space on Day 14 compared to the other measurement days, it was concluded that classification based on petal senescence is possible.
3.3. Classification Model for Predicting Vase Life Based on Biomass-Related Characteristics
Using the h2o package, we constructed a distributed random forest-based stacked ensemble model that could classify the day of vase life measurement based on petal colorimetric data (
Figure 5).
The distinction between measurement days was clearer in the H group (
Figure 5B) than in the S group (
Figure 5A). In the H group, the distinction between Day 9 and Day 14 showed high performance with an AUC of 0.800. However, the distinction between Days 1 and 9 showed a relatively low performance, with an AUC of 0.528. This means that the difference of color space from flower cutting to Day 9 was not significant in the H group, and it can be seen that flower senescence progresses rapidly as it approaches Day 14. In other words, there is very little senescence progression from Day 1 to Day 9 in the H group, with a significant change in petal color at Day 14.
However, the S group showed a lower classification performance than the H group model, making it difficult to classify vase life based on the color space from petal senescence. The largest AUC values were observed between Days 1 and 9 (0.673), followed by Days 5 and 9 (0.631). However, it was difficult to distinguish between Day 1 and Day 5 (0.555). This indicated that in the S group, there was a sharp change in the color space due to senescence after Day 5.
4. Discussion
As shown in
Figure 1 and
Figure 2, each cultivar has its own color pattern. However, they share the common characteristic of an increasing amount of yellow in the petals as senescence progresses. In other words, all cultivars showed an increasing trend in b* values as the senescence progressed. Specifically, regardless of S or H cultivation, on the day when the vase life reached its limit, the b* value increased significantly, differentiating it from other days. This is because, as senescence progresses, colorless or pale-yellow flavonols or flavones increase more than anthocyanins. This phenomenon is called copigmentation [
42], and the intensity of the color change depends on the ratio of copigments to anthocyanins. In our previous study [
29], we proposed the ratio between flavonol and anthocyanin content as a senescence index. As flower senescence progresses, the senescence index increases, indicating that vase life approaches its end. We are currently developing indirect and non-destructive phenomic methods using multispectral or hyperspectral cameras instead of directly measuring anthocyanins and other flavonoids using HPLC. Our next goal is to directly measure the amount of anthocyanins and flavonols in petals at different vase life stages using HPLC, and also to measure indices that are highly correlated with the content of each flavonoid using a hyperspectral camera. We plan to investigate the correlation between the calculated senescence index derived from HPLC results and spectral reflectance indices obtained from HSI.
As mentioned in the previous results, the BP of the H group showed the opposite trend to the common varieties, where the b* value decreased. However, as shown in
Figure 2, this is likely due to the statistical error caused by the increased variability of the b* value of BP in the H group, which resulted in the average value being lower than those of other measurement days. In
Figure 2, the b* value of the H group is much larger than that of the S group. In addition, the b* value of BP on Day 14 is much larger than that of other measurement days, with more individuals having positive values, and the value is as high as 20. In other words, BPs in the H group have the same tendency to increase the value of b* value as they senesce.
The best-performing model selected by AutoML was a stacked ensemble model using DRF and GBM as base models and GLM as the meta classifier. As shown in
Figure 5A, comparison of Days 1 and 9 for S cultivation showed the best performance, with an AUC value of 0.673.
Figure 5B shows the best performance, with an AUC value of 0.800, when comparing Days 9 and 14 of H cultivation. In H cultivation, it was difficult to distinguish vase life based on petal color until day 9; however, after day 9, this distinction became clear. Unlike H cultivation, S cultivation did not show the same level of performance in the differentiation of vase life stage, so we need to accumulate more data from our samples to refine our model parameters in the future.
This research is our third study investigating the vase life of cut lisianthus. Our first research has focused on improving the vase life of cut lisianthus through exogenous salicylic acid (SA) treatment and cultivation method (soil or hydroponic cultivation) [
29]. That study revealed the effects of different cultivars (genotype) and growing conditions (environment), including SA treatment timing (vegetative or reproductive stage) and concentration (SA 0, 0.1, 0.3, or 0.5 mM), on improving vase life. It was confirmed that hydroponics and SA treatment at the reproductive stage increased the expected vase life after flower cutting, and the longest vase life was expected at a concentration of 0.5 mM SA for the KW cultivar among all cultivars and treatment groups [
29]. Furthermore, we attempted to estimate senescence by observing and quantifying petal color changes in cut lisianthus. The automated machine learning models can improve the predictability of vase life based on the colorimetric (R
2 = 0.9551) and SPAD data (R
2 = 0.6966).
Our second study examined various biomass-related characteristics of the preharvest period under the same conditions as the first study and investigated their correlation with vase life, a postharvest characteristic [
43]. The biomass-related characteristics are as follows: vegetative characteristics (stem diameter, number of stem nodes, stem length, number of stem bushes, flowering day, and SPAD value), reproductive characteristics (fresh weight, dry weight, weight difference, petal number, petal size), and leaf chemical components (nitrogen (N), phosphorus (P), potassium (K), magnesium (Mg), and calcium (Ca)). The second study showed that vase life has a high positive correlation with dry weight, SPAD, Mg content, and flowering day. As these characteristics directly or indirectly relate to photosynthesis, this result implies that increased photosynthetic efficiency significantly relates to improved vase life. The higher photosynthetic efficiency reflected in greater dry weight, which has a positive influence on vase life. The increase in dry weight serves as a source of carbohydrates that determine the longevity of cut flowers. In addition, we suggest that high tissue water content also contributes to extended vase life. Principle component analysis (PCA) revealed that BP cultivar’s longer vase life is attributable to a combination of high carbohydrate content generated through photosynthesis and high tissue water content, both exceeding those observed in other cultivars [
43]. We developed a machine learning model to estimate vase life based on preharvest biomass-related characteristics. According to the AutoML model and PCA result, dry weight was the strongest predictor of vase life. The R
2 value of this machine learning model based on biomass-related characteristics is 0.62.
In this study, our third, we attempted a classification analysis to distinguish the stages of vase life, rather than a regression analysis to estimate vase life as in the previous studies [
29,
43]. Specifically, regression models based on several biomass-related characteristics are less industrially valuable because each characteristic must be investigated during the lisianthus growing season. Therefore, to develop a model readily and immediately applicable in the floriculture industry, we attempted to create a model capable of discerning the stages of senescence directly from the cut flower state. As evident from our previous research findings, we aimed to target a single characteristic that is directly related to the vase life of cut flowers, rather than targeting multiple characteristics, so that it can be applied immediately in the industrial field. Therefore, we tried to develop a classification model based on petal color change using a colorimeter, as explored in our first study. With the increasing demand for cut flowers in the current flower market, it is crucial to conduct follow-up research to develop similar models for popular flower crops, such as roses, carnations, and chrysanthemums.


