Article

Inheritance of the Flesh Color and Shape of the Tuberous Root of Sweet Potato (Ipomoea batatas [L.] Lam.)

by
Alfredo Morales
1,*,
Iván Javier Pastrana Vargas
2,*,
Dania Rodríguez del-Sol
1,
Orelvis Portal
3,4,
Yoel Beovides García
1,
Yuniel Rodríguez García
1,
Alay Jiménez Medina
1,
Yusbiel León Valdivies
5 and
Vaniert Ventura Chávez
1
1
Research Institute of Tropical Roots and Tuber Crops (INIVIT), Santo Domingo 53000, Cuba
2
Department of Agronomic Engineering and Rural Development, Faculty of Agricultural Sciences, Universidad de Córdoba, Carrera 6 No. 77-305, Montería 230002, Colombia
3
Departamento de Biología, Facultad de Ciencias Agropecuarias, Universidad Central “Marta Abreu” de Las Villas, Santa Clara 54830, Cuba
4
Centro de Investigaciones Agropecuarias, Facultad de Ciencias Agropecuarias, Universidad Central “Marta Abreu” de Las Villas, Santa Clara 54830, Cuba
5
Finca Maripa, Cumanayagua 57600, Cuba
*
Authors to whom correspondence should be addressed.
Horticulturae 2024, 10(10), 1032; https://doi.org/10.3390/horticulturae10101032
Submission received: 19 August 2024 / Revised: 22 September 2024 / Accepted: 26 September 2024 / Published: 28 September 2024
(This article belongs to the Section Genetics, Genomics, Breeding, and Biotechnology (G2B2))

Abstract

:
The continued success of any conventional sweet potato breeding program is limited by knowledge of the inheritance of the traits under study, such as flesh color and tuberous root shape, because of the difficulty of segregating color frequencies by visual separation. The objective of this study was to understand the mode of inheritance of these genetic traits. The cross blocks were established at the Research Institute of Tropical Roots and Tuber Crops (INIVIT-Cuba). Eight parental genotypes of known compatibility were selected, with contrasting phenotypic characteristics to develop segregating populations. To express color objectively, the CIE L*a*b* color space was used (L*: lightness; a* and b*: chromatic coordinates), and four morphometric variables related to the shape and dimensions of the tuberous root were evaluated. From 2419 reciprocal crosses, 2045 botanical seeds and 1764 seedlings were obtained. Incomplete dominance of the white and purple flesh colors over the orange color was observed, as well as transgressive segregation for purple, orange, and white flesh colors and for the shape of the tuberous root. The results allowed us to propose a genetic model of biparental crosses for the improvement of the flesh color of sweet potato (Ipomoea batatas [L.] Lam.), as well as a predictive formula of the progeny to be selected.

1. Introduction

For the first time in the history of biology, Gregor Mendel subjected biological phenomena to high numerical rigor with a solid mathematical and statistical basis. Mendel created a predictive theory based on the species Pisum sativum L. (2x) and, with it, a whole new field of science, “Genetics”. Mendel’s work is considered “one of the triumphs of the human mind” [1,2].
Without Mendel’s discoveries, plant breeders would have been limited to random crosses, which would have taken much longer to produce a new, improved variety. However, Mendel worked with contrasting states of the target traits in a diploid species with simpler inheritance than a polyploid (such as the sweet potato), where (for many traits) continuous quantitative variation is obtained.
Sweet potato (Ipomoea batatas [L.] Lam.) is a hexaploid species (2n = 6x = 90) with a base number of x = 15 [3]. The mode of inheritance (allo or autopolyploid) is of great importance in population genetic studies of I. batatas. Recent molecular studies suggest that sweet potato is an autoallopolyploid, with some preferential meiotic pairing [4] and autopolyploid [5].
Linkage map studies have shown that sweet potato follows the polysomic mode of inheritance [4,6]. The following models have been proposed: disomic, tetrasomic, tetradisomic, and hexasomic, in I. batatas [6,7], making the genetics of simple traits more complex, with up to six alleles per locus. In a 2x species, and the simple case of one locus and biallelism, there are three genotypes, AA, Aa, and aa, and seven possible genotypes for an autohexaploid (A6, A5a, A4a2, A3a3, A2a4, Aa5, a6) [8]. At 6x, within the allele frequency range of approximately q = 0.2 to q = 0.8, the frequency of heterozygosity remains >0.75 [9], which means that heterozygous genotypes occur at much higher frequencies.
Recently, there have been few studies related to the phenotypic segregation of I. batatas have been developed. The main characters studied were leaf shape [10,11], stem color [12,13], tuberous root shape [14], and tuberous root skin and flesh color [11,15].
The most studied trait is the color of the flesh of the tuberous root because of its importance to consumers. The color (white, cream, orange, yellow, and purple) is generally influenced by the levels of metabolites found in the tuberous root [16]. Orange sweet potatoes present β-carotene (carotenoid) as the main compound [17]; on the other hand, purple sweet potatoes have bioactive compounds such as phenolic acids, flavonoids, and anthocyanins in their chemical composition [18]. These phytochemicals have antioxidant properties with numerous health benefits and may have antibacterial, antitumor, antiviral, and antimutagenic activity in addition to acting as cardioprotective agents [19]. Furthermore, frequent consumption of foods with significant amounts of these antioxidants may reduce the risk of developing degenerative diseases, such as some types of cancer, and contribute to delaying cellular aging [20].
Despite several studies on the inheritance of the color of the tuberous root of I. batatas, there are inconsistencies about the genetics governing this trait [9,21], mainly because there are no homozygous genotypes due to the homomorphic multiallelic self-incompatibility of the sporophytic type [22]. In addition, the difficulty of fractionating color frequencies in sweet potato (between cream and yellow tones and between different intensities of red) by visual separation has been reported [11,23]. To avoid inconsistencies and to express color objectively (numerically), different color spaces are currently used, including the CIE L*a*b* (L*: lightness; a* and b*: chromatic coordinates). Only one study considered the segregated color of sweet potato flesh using the CIE L*a*b* color space, considering a combination (cream flesh × yellow flesh) [15]. None of the previous research on this topic considered the purple-fleshed genotypes of I. batatas in their different possible cross-breeding combinations due to their relatively recent discovery [24]. In addition, the shape of the tuberous root shape has not been studied using professional digital image analysis software.
Genetic improvement of sweet potato is the main way to maintain its constant genetic gain, focused on obtaining superior genotypes. Hybridization to generate segregating populations and to select new genotypes has enabled an increase in the average yield, the content of carotenes and anthocyanins, improved the stability, adaptability, and tolerance to some pests (Cylas formicarius Fab., Typophorus nigritus F. and nematodes), allowing a greater adoption of new varieties [25]. The continued success of genetic improvement programs has its limits. It is based on the selection of genotypes with as many superior traits as possible with large genetic distances to be used as parents in the directed crossing blocks and the subsequent precision in the selection of seedlings. During the last decades, important advances have been made in the breeding scheme used. However, it has been observed that the improvement of some traits (flesh color and tuberous root shape) has reached a limited potential level. To achieve greater success in obtaining more efficient and genetically balanced cultivars, it is of utmost importance to understand the mode of inheritance of genetic traits.

2. Materials and Methods

2.1. Study Area

The crossing blocks were established at the Research Institute of Tropical Roots and Tuber Crops (INIVIT), municipality of Santo Domingo, province of Villa Clara, Cuba, located at 22°35′00″ N and 80°14′18″ W, at 50 m above sea level. The design was planted under field conditions in August 2022 in soft, carbonated brown soil [26].

2.2. Crossing Blocks

Eight parental genotypes of known compatibility were selected. At the end of August 2022, 20 plants of each parent were planted with stakes at a distance of 1 × 1 m. The meteorological data were recorded in the Institute’s automatic meteorological station (national meteorological network code: 78326, data: http://www.insmet.cu [accessed on 12 July 2023]). Controlled cross-pollination of the selected parental genotypes started at the beginning of December 2023. The flowers used as females were emasculated in the afternoon of the previous day and covered with sections of large absorbent straws (0.7 cm in diameter) cut into approximately 3 cm lengths. The flowers used as a pollen source were covered in the same way without emasculation. Cross-pollinations were carried out the next day between 0700 and 1000 h. Each pollinated flower was labeled according to the parents and re-covered with the absorbent straw sections, and daily records of the crosses were kept. Irrigation was applied as needed to keep the plants in a moderately vigorous growing condition.

2.3. Botanical Seeds and Seedlings

Seeds were harvested when the pedicel became necrotic and were separated according to parentage, cleaned, placed in paper envelopes, and stored. Seeds were cleaned and placed in paper envelopes for storage. Each batch of seeds from individual crosses was assigned a family code, ISS 230#: I = INIVIT, S = seed, S = sweet potato, 23 = year 2023 and 0# = family number. The seeds were scarified by a physical method (nail clippers), placed in Petri dishes the day before sowing, and watered to a depth of about 2 mm. In June 2023, they were sown in CRAS (Center for Accelerated Seed Reproduction) chambers of the INIVIT, with 5 cm between seedlings and 20 cm between rows, where they were grown for up to 50 days. Seedlings of all F1 parent combinations were cut 30 cm from the apical part of the stem. The seedlings were planted in the field in July 2023 at a distance of 0.90 × 0.50 m. In November of the same year, the seedlings were harvested, and part of the foliage of each plant was independently placed in paper bags and labeled with the code corresponding to the family.

2.4. Characters Investigated

To determine the inheritance pattern of the flesh color and tuberous root shape, parents with contrasting phenotypic characteristics were selected to develop segregating populations of I. batatas. The strategy and the phenotypic characters of the parents are presented in Table 1.
All parents used are conserved in the national collection of sweet potato germplasm and maintained at INIVIT (in vivo and in vitro).

2.5. Morphometric Variables

In November 2023, the samples were photographed individually with a Canon EOS 600D camera (Fukushima Canon Inc., Fukushima, Japan). The tuberous roots of the different families were washed and dried before determining their color. Seven morphometric variables were used (Table 2): four related to the shape and dimensions of the tuberous root (C, AR, R, and S), and three to the color of the skin and flesh of the tuberous root (L*, a*, b*). Three points were measured on the skin and three on the flesh (cross-section at the midpoint) in three tuberous roots per genotype, for a total of 18 pieces of data per genotype. In addition, a controlled environment, in terms of temperature (20 ± 2 °C), relative humidity (75 ± 5%), and illumination (500 lx), was maintained during the measurement process. The professional digital image analysis software programmed in Java was used: ImageJ ver. 1.46 of the National Institute of Health, following the instructions of Ferreira and Rasband [27].
The color space used was CIE. L*a*b* from 1976 of the International Commission on Illumination [28], where: L* = luminosity, a* = red/green coordinates (+a indicates red, −a indicates green) and b * = yellow/blue coordinates (+b indicates yellow, −b indicates blue).

2.6. Statistical Analysis and Visualization

The ‘variability’ package [29] of the RStudio 2023.03.1 software was used to estimate the genetic parameters of each character. The following genetic parameters were estimated:
σ p 2 = σ g 2 + σ e 2
where
  • σ p 2 : phenotypic variance;
  • σ g 2 : genotypic variance;
  • σ e 2 : environmental variance.
σ p 2 = F i m 2 n 1
where
  • Fi: term of the data set;
  • m: medium;
  • n: number of observations.
In the parents, it is assumed that phenotypic differences correspond to environmental differences: σ g 2 = 0 , σ p 2 = σ e 2 . To determine the σ p 2 and σ g 2 of the progeny, the σ e 2 the σ p 2 of the parents is taken.
Heritability in a broad sense is as follows:
H 2 = σ g 2 σ p 2 × 100
The non-parametric Pearson chi-square test (X2) (goodness of fit) was used to determine statistical differences between the observed frequencies. Data manipulation, evaluation, and graphing were performed using RStudio 2023.03.1 software. All graphs were visualized using ggplot2 [30]. The scatter plots were plotted using the geom_jitter() function with ggMarginal(), the density plots were plotted with the geom_density_2d() function and the colors were selected from ColorBrewer [31] and viridis [32]. In order to determine the degree of association between the phenotypic traits study, the segregating populations of full siblings of the families from the cross between ‘INIVIT BS-16’ × ‘CEMSA 74-228’ and ‘INIVIT BM-90’ × ‘ISS-18-004’ were used, taking into account simultaneously several traits without neglecting the relationship between them; the multivariate method used was interdependence [33] since no variable was defined as independent or dependent. In order to know which variables are associated or not and which influence in the same or opposite direction, a Principal Component Analysis (PCA) was performed, and its eigenvector matrix (coefficients of the linear combinations of the original variables) was interpreted. In addition, a line graph was generated using the values of the proportion of absolute and accumulated variance (Y-axis), explained by each principal component (X-axis). The correlation between the original variables and the selected principal components was calculated using the following formula [34]:
r(jk) = l(jk) × (λ(κ))1/2/S(ij)
where
  • r(jk) = correlation between the original variable x(j) and the k-th component.
  • l(jk) = j-th element of the k-th eigenvector.
  • λ(κ) = k-th eigenvalue.
  • S(ij) = variances of the correlation matrix.
To determine whether or not there was independent segregation between the skin color, flesh color, and tuberous root shape traits, an alluvial trend plot was developed between these traits. For this purpose, the ‘ggalluvial’ package using RStudio 2023.03.1 software was used. In addition, a decision tree model was developed. Different subsets of the data set were created by partitioning by decision nodes. To predict the outcome at each decision node, the probability obtained in the segregating populations of I. batatas was used. For the tree structure, the software EdrawMax ver. 12.5 for Windows was used.

3. Results

3.1. Pollinations

A total of 2419 reciprocal crosses were made, of which 1361 were positive. The percentage of positive pollinations ranged from 45.06 to 72.47%, with an average of 58.57%. A total of 2045 botanical seeds were obtained, the number of these seeds per capsule ranged from 1.17 to 1.98 with an average of 1.54. The percentage of seed germination per family varied between 79.20 and 92.20%, with an average of 86.34%. Finally, 1764 seedlings were obtained (total population) (Table 3).

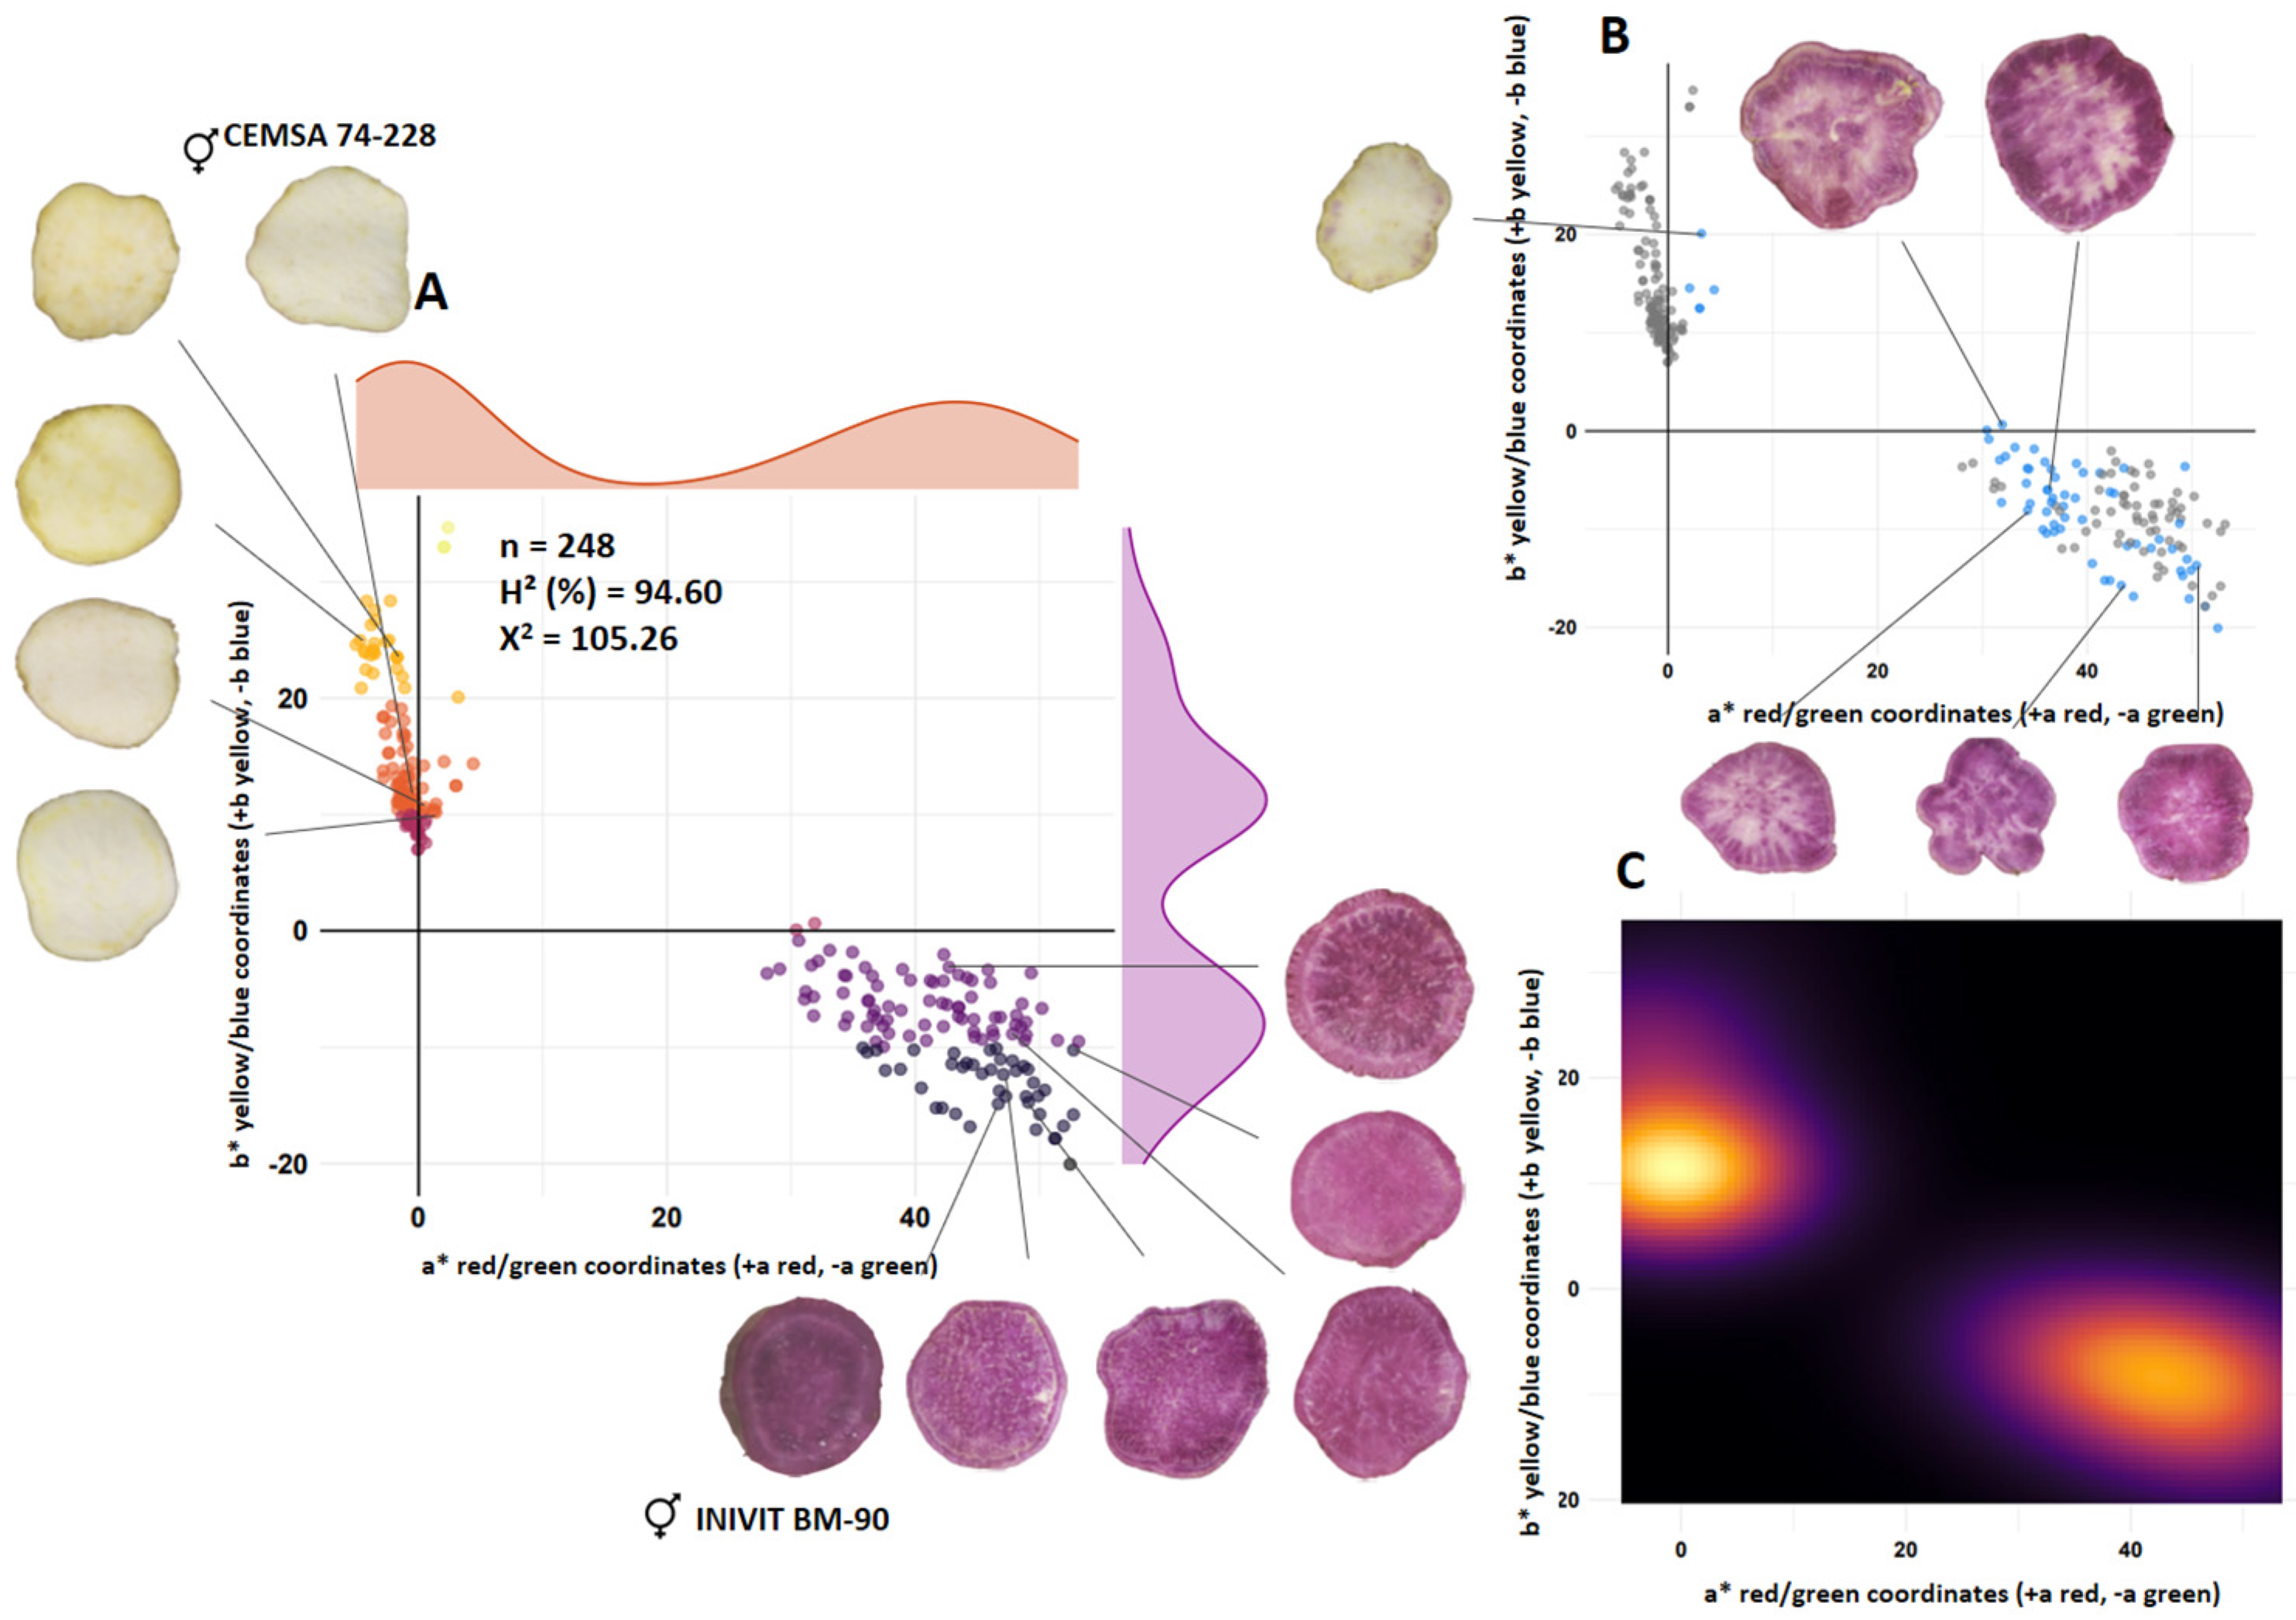
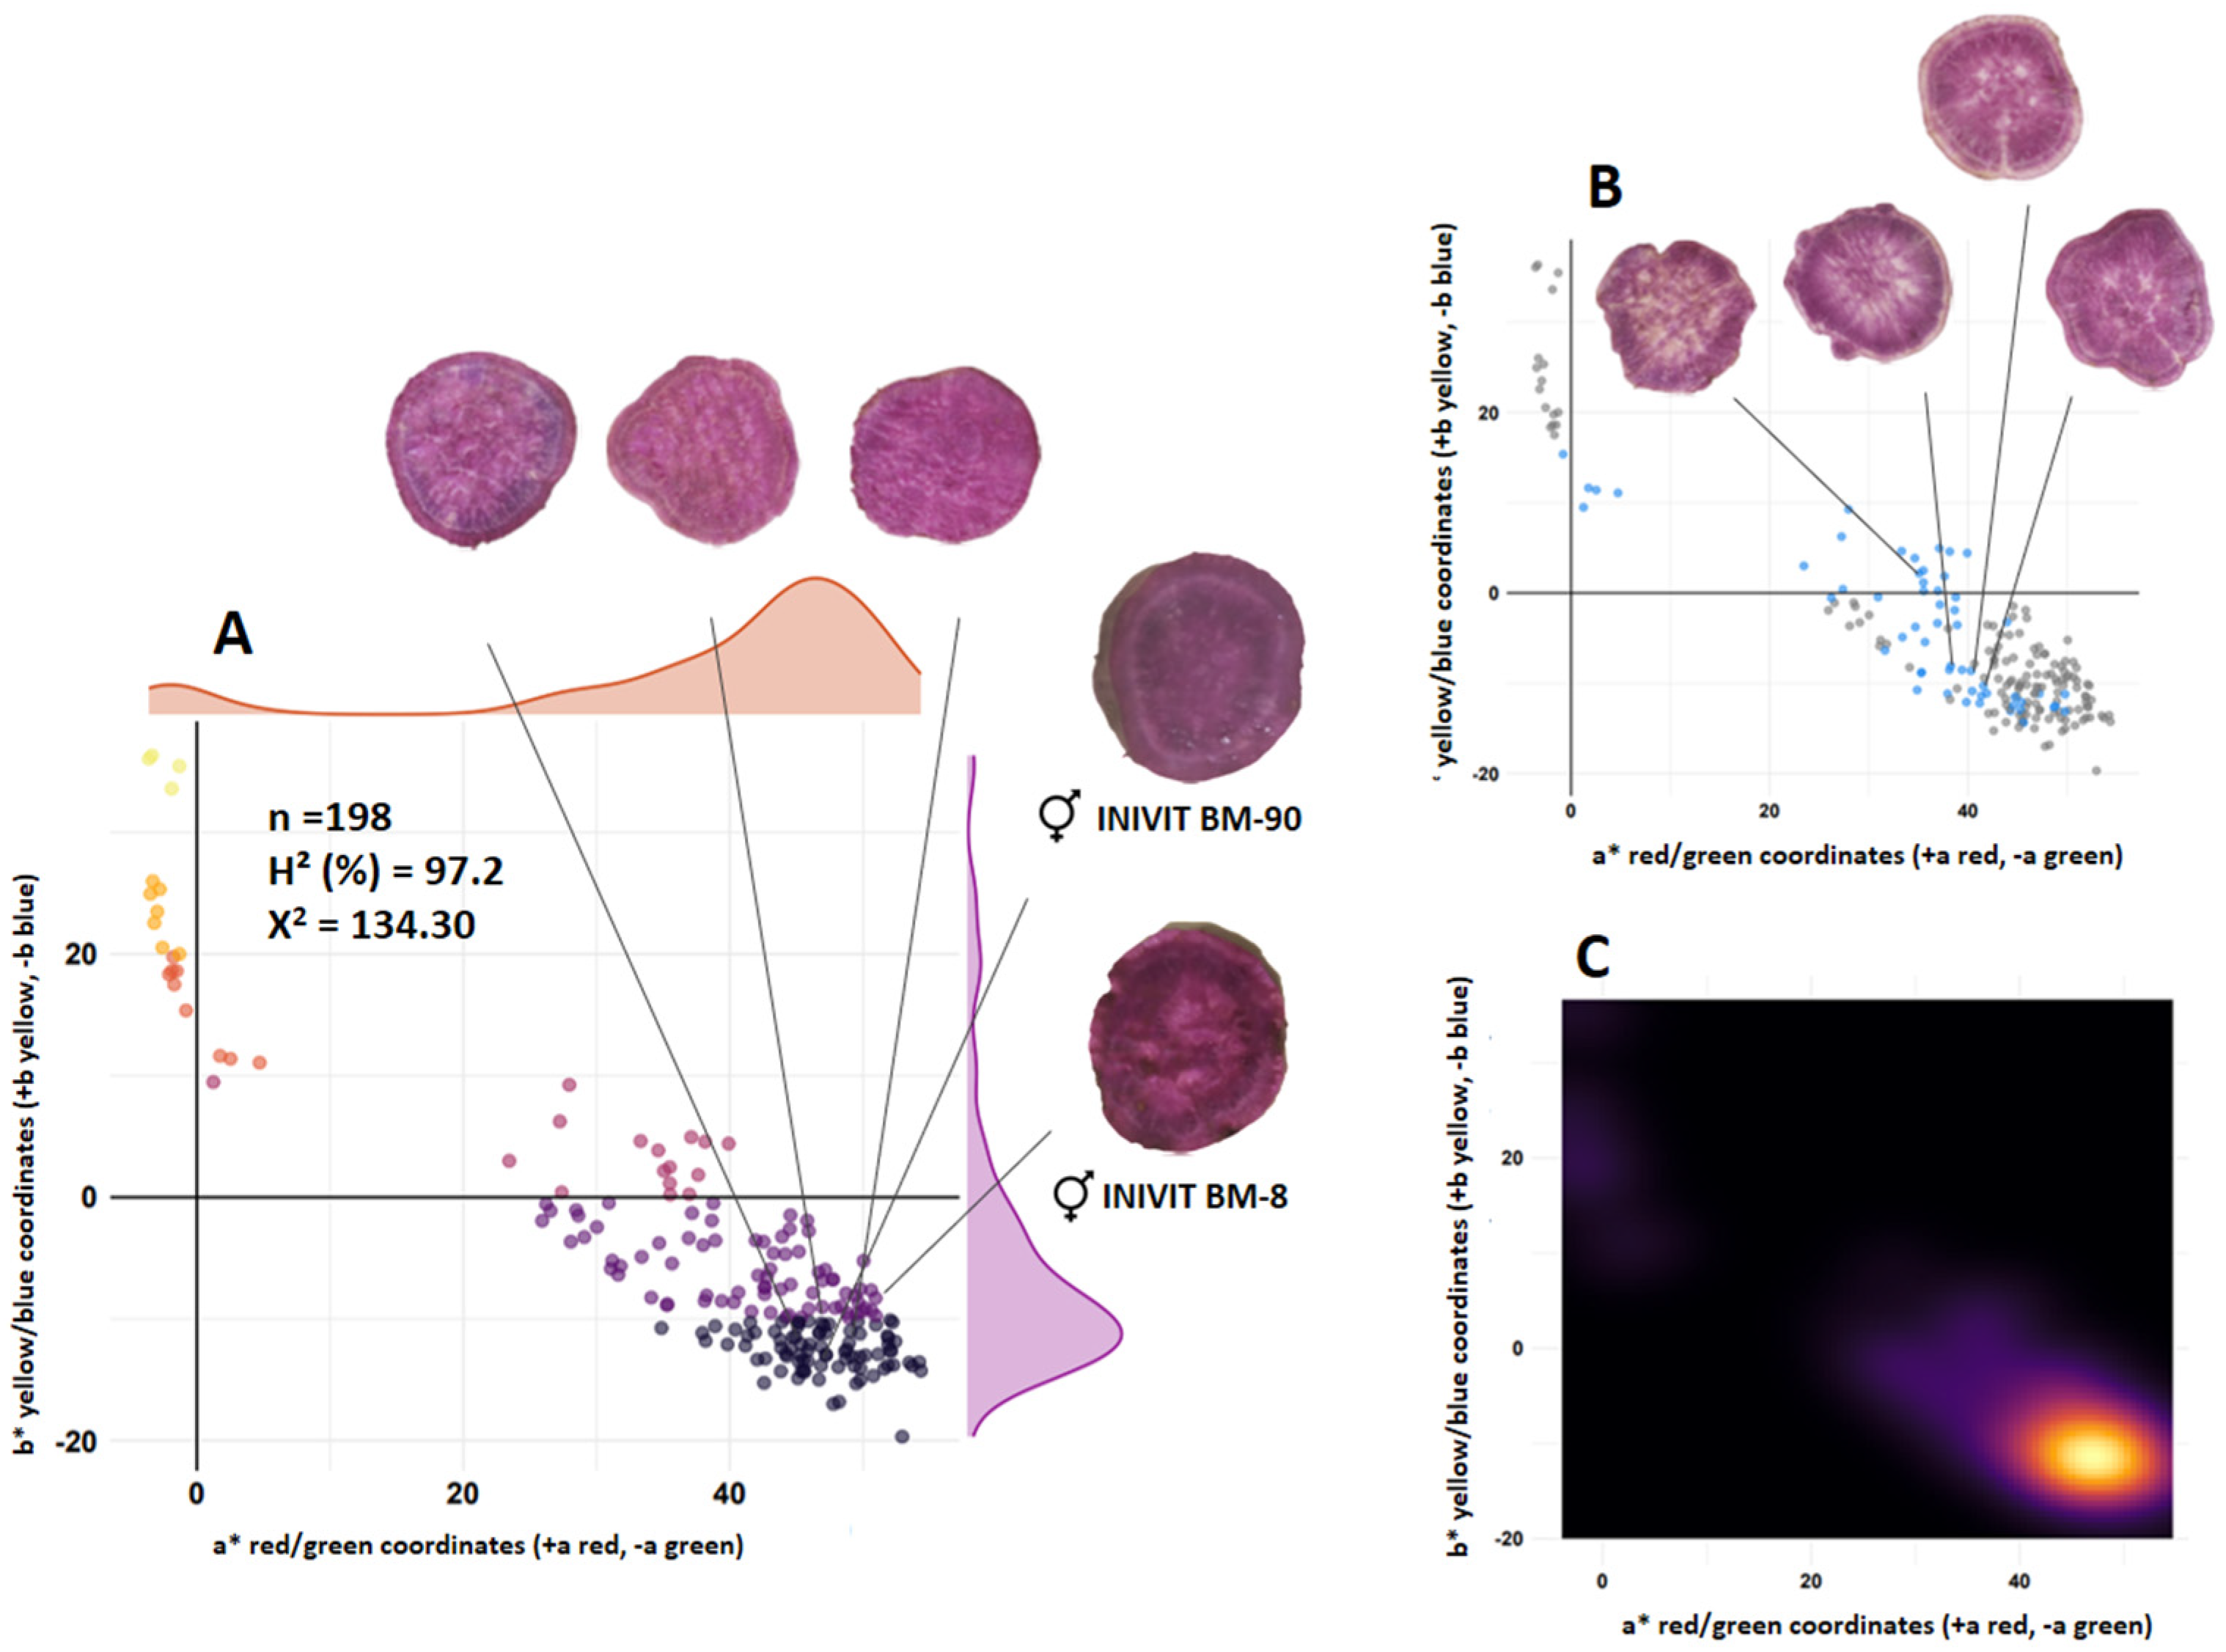
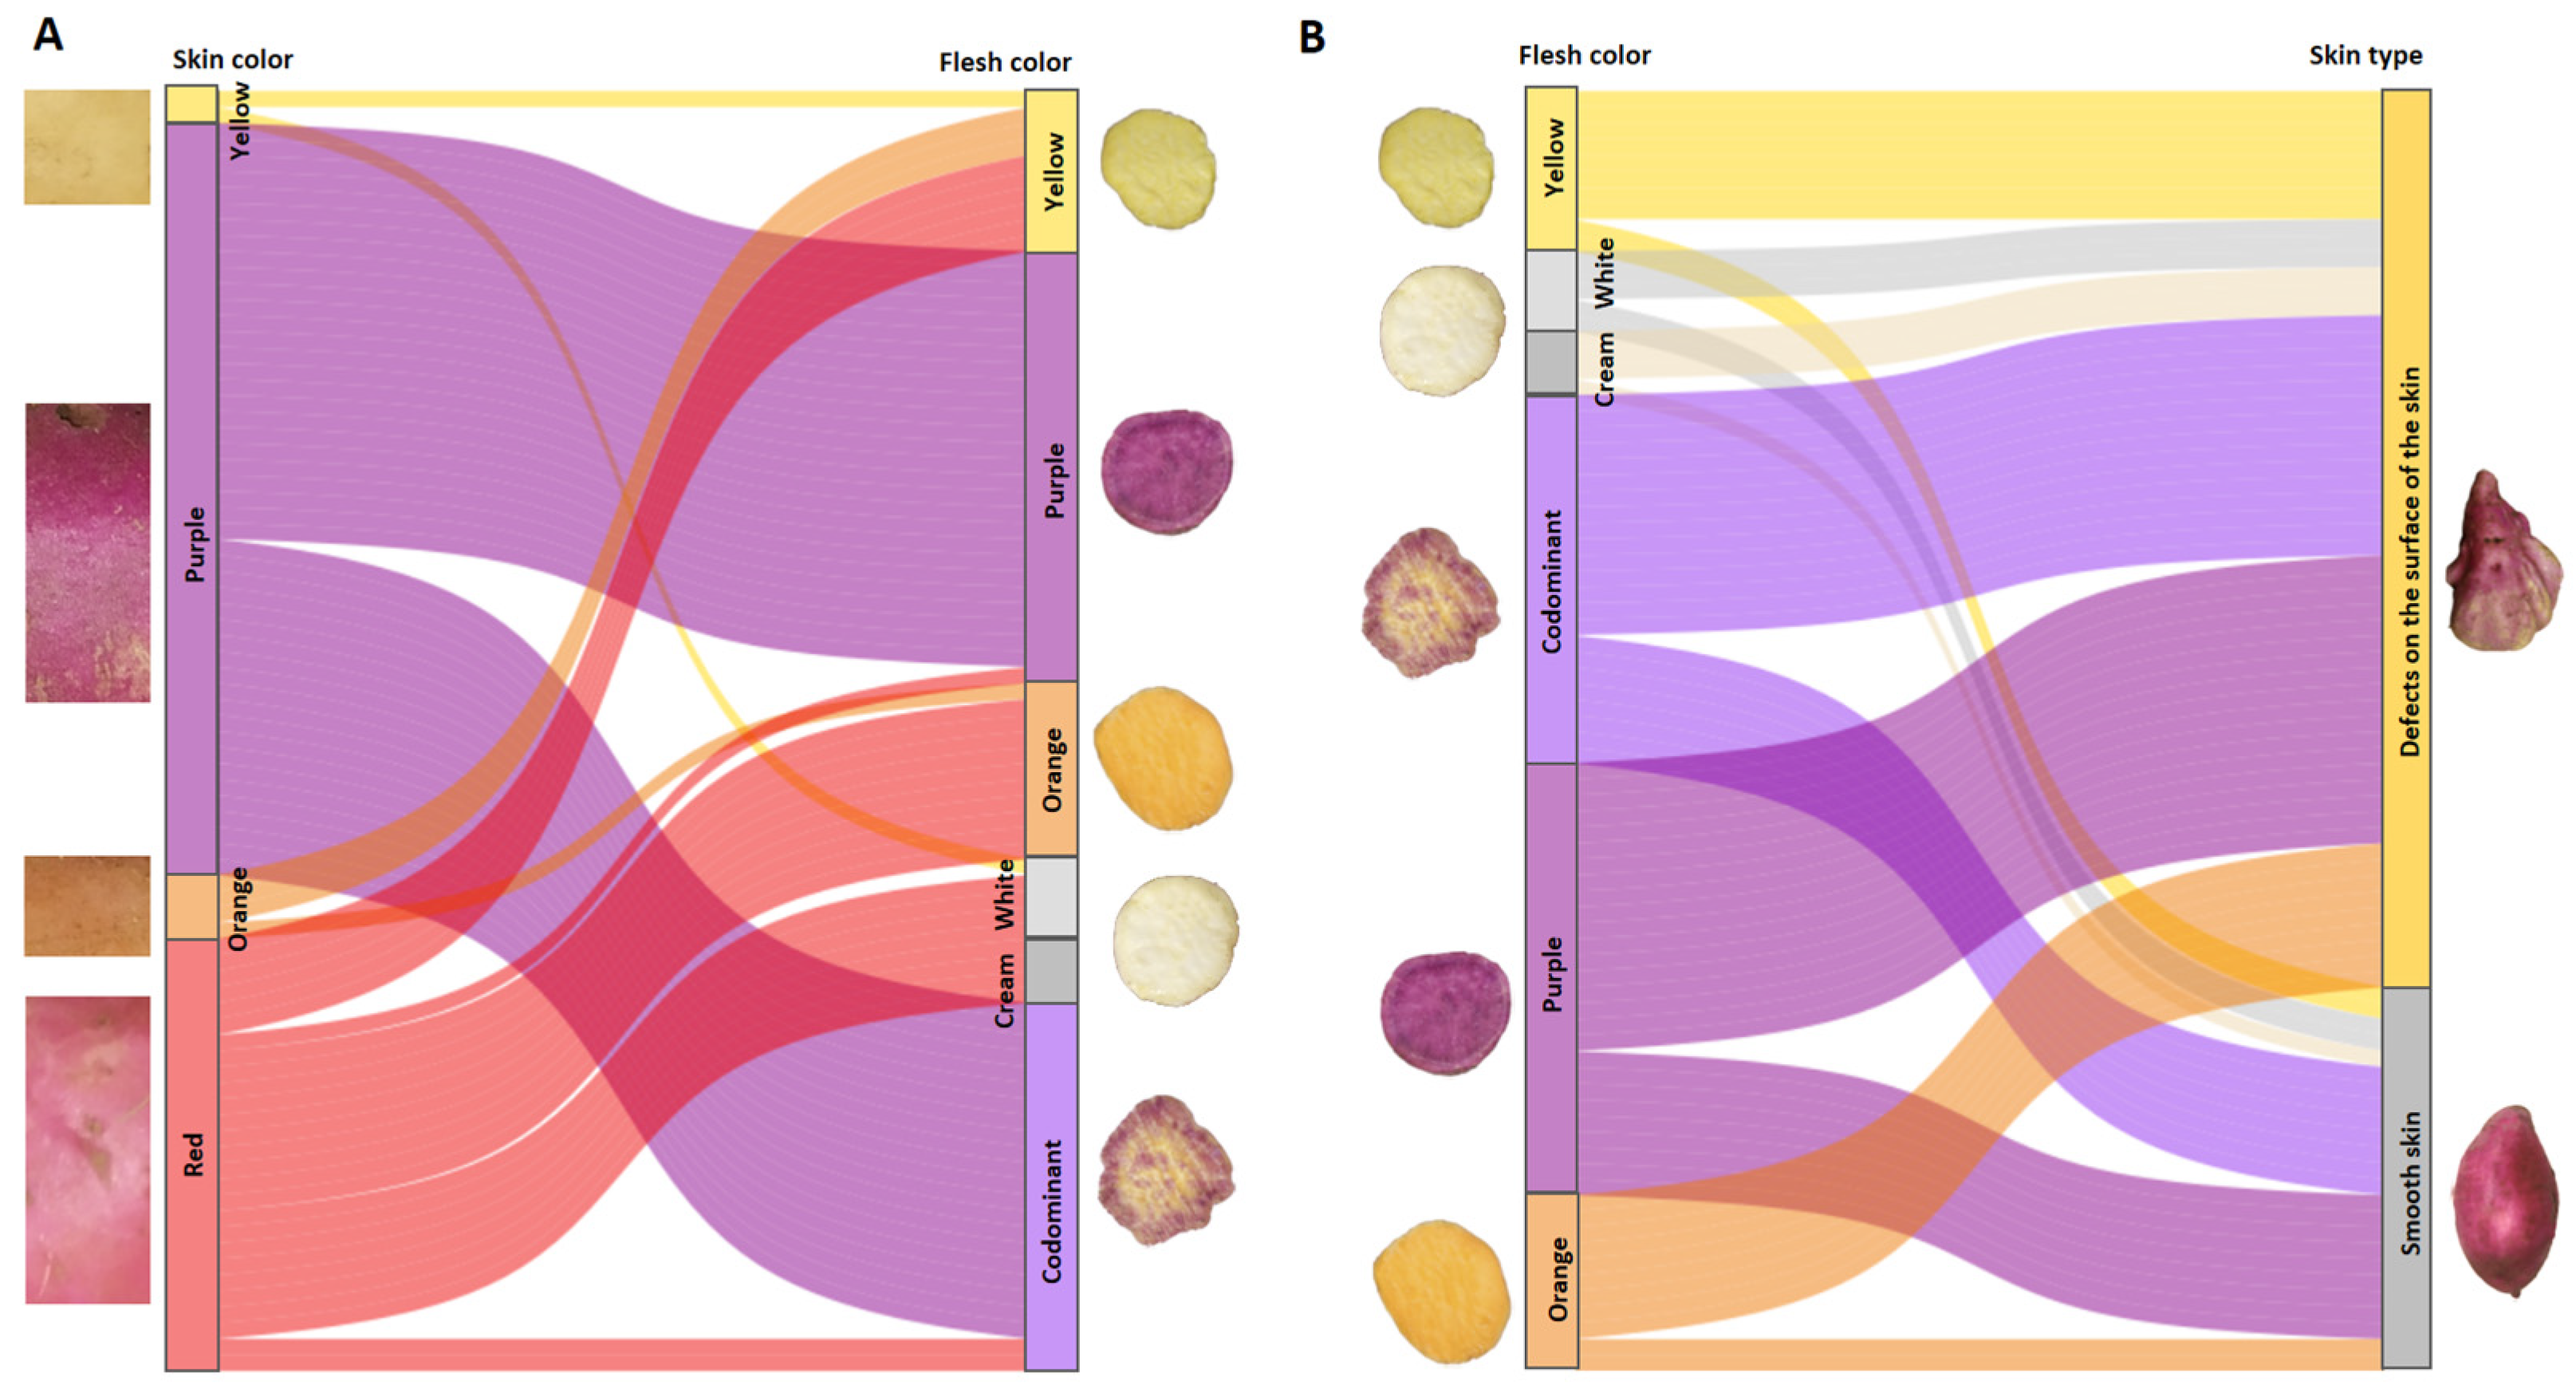
3.2. Flesh Color of Tuberous Roots

The segregation of tuberous root flesh color trait from all full-sib families was plotted in scatter plots with measurements of two morphometric variables (a* and b* coordinates of the CIE L*a*b* color space).
The family ISS-2305 (n = 248), from the cross between a white-fleshed parent (CEMSA 74-228; L* = 72.79) and a purple-fleshed parent (INIVIT BM-90; L* = 22.55), had a segregation ratio of 1:2:1 (cream-white:purple:codominant) (64:118:66) (Figure 1A). Purple and white color were codominant in 26.61% of the total population and 50.76% of the purple-fleshed population (Figure 1B). The estimated broad-sense heritability for the lightness (L*) trait indicated that 94.60% of the proportion of phenotypic differences were due to genotypic differences, suggesting that the effect of the environment on the variation is small. The contour plot of the densities (Figure 1C) shows greater color intensity in two places, toward the left half (cream–white color) and the lower right corner (purple color), suggesting the existence of incomplete dominance between the two colors. The observed frequencies (X2 = 105.26) (p-value < 0.05) do not fit the Mendelian proportions (expected frequencies) (Figure 1).
The F1 generation obtained by crossing two purple-fleshed parents (INIVIT BM-90 [L* = 22.55] × INIVIT BM-8 [L* = 21.68]) (n = 198) showed that it is almost entirely composed of purple-fleshed genotypes. The segregation ratio was 8:1:3.5 (purple:cream-white:codominant) (125:16:57). Flesh color was codominant in 28.78% of the total population and 31.31% of the purple-fleshed population (Figure 2B). The estimated broad-sense heritability for the lightness (L*) trait was 97.02%. Transgressive segregation was observed for purple flesh color, as some seedlings had darker anthocyanin pigmentation than both parents (Figure 2).
The segregation from the cross between two orange-fleshed parents (INIVIT BS-16 [L* = 62.16] × Español [L* = 63.05]) (n = 198) showed a monofactorial phenotypic ratio of 2:1:1 (orange:white:yellow) (122:47:52). The estimated broad-sense heritability was 93.25%. The density contour plot (Figure 3B) reflects greater color intensity toward the upper center (orange color). The observed frequencies (X2 = 121.20) (p-value < 0.05) do not fit the Mendelian proportions. Transgressive segregation was observed for the orange flesh color (Figure 3).
The family ISS-2308 (n = 251), from the cross between a white-fleshed parent (CEMSA 78-326; L* = 74.63) and an orange-fleshed parent (INIVIT BS-16; L* = 62.16), had a segregation ratio of 3.5:1:1.5 (cream-white:yellow:orange) (142:41:68). The estimated broad sense heritability for the lightness trait (L*) was 91.14%. The contour plot of densities (Figure 4B) reflects greater color intensity toward the lower left corner (cream–white color), so there was incomplete dominance of white over orange color (Figure 4).
The resulting progeny (n = 268) from the cross between an orange-fleshed parent (INIVIT BS-16; L* = 62.16) and a purple-fleshed parent (INIVIT BM 25-19; L* = 24.57) showed a segregation ratio of 5:5:1:2:2 (purple:codominant:white:yellow:orange) (90:80:17:38:43). Clusters with fractional color frequencies of different shades, from white to orange, and different shades of purple were observed (Figure 5A). Purple–white and purple–orange were codominant in 29.85% of the total population and 47.05% of the purple-fleshed population (Figure 5B). The estimated broad-sense heritability for the lightness (L*) trait was 91.72%. The density contour plot (Figure 5C) reflects greater color intensity in the lower right corner (purple color), so there was incomplete dominance of purple over orange (Figure 5).
The frequencies observed for all families (X2 = > 100) (p-value < 0.05) do not fit the Mendelian proportions (expected frequencies).

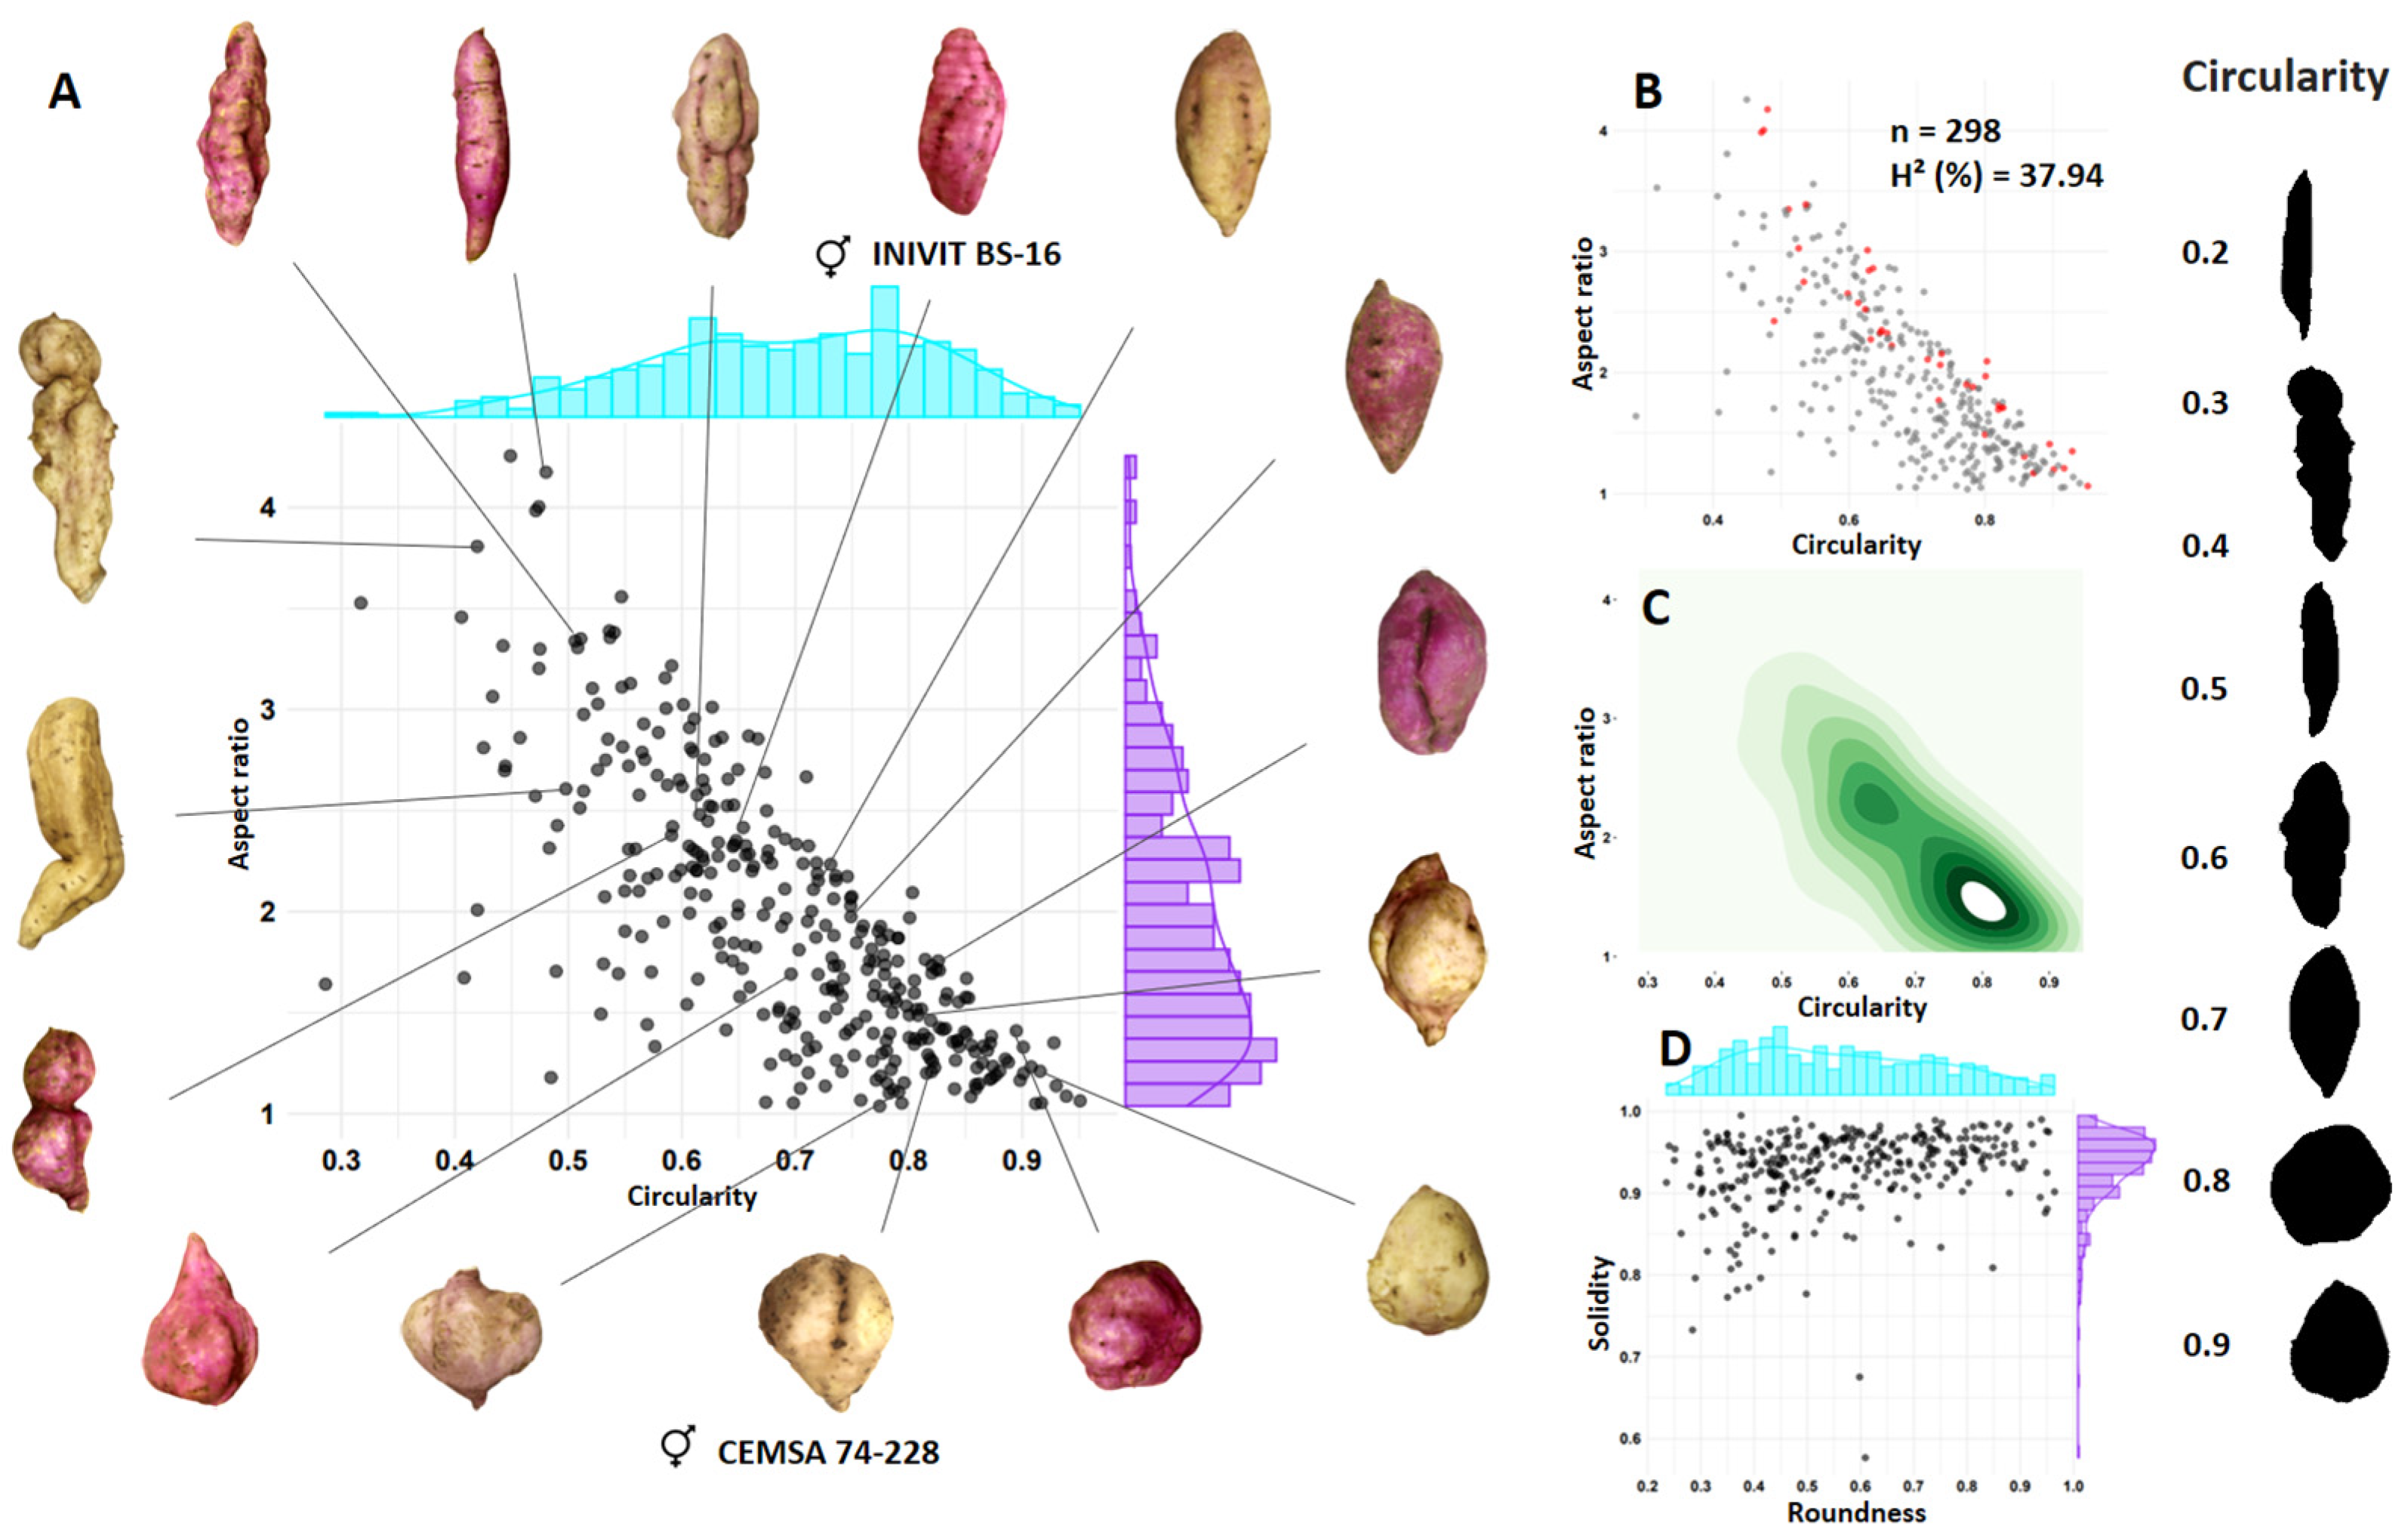
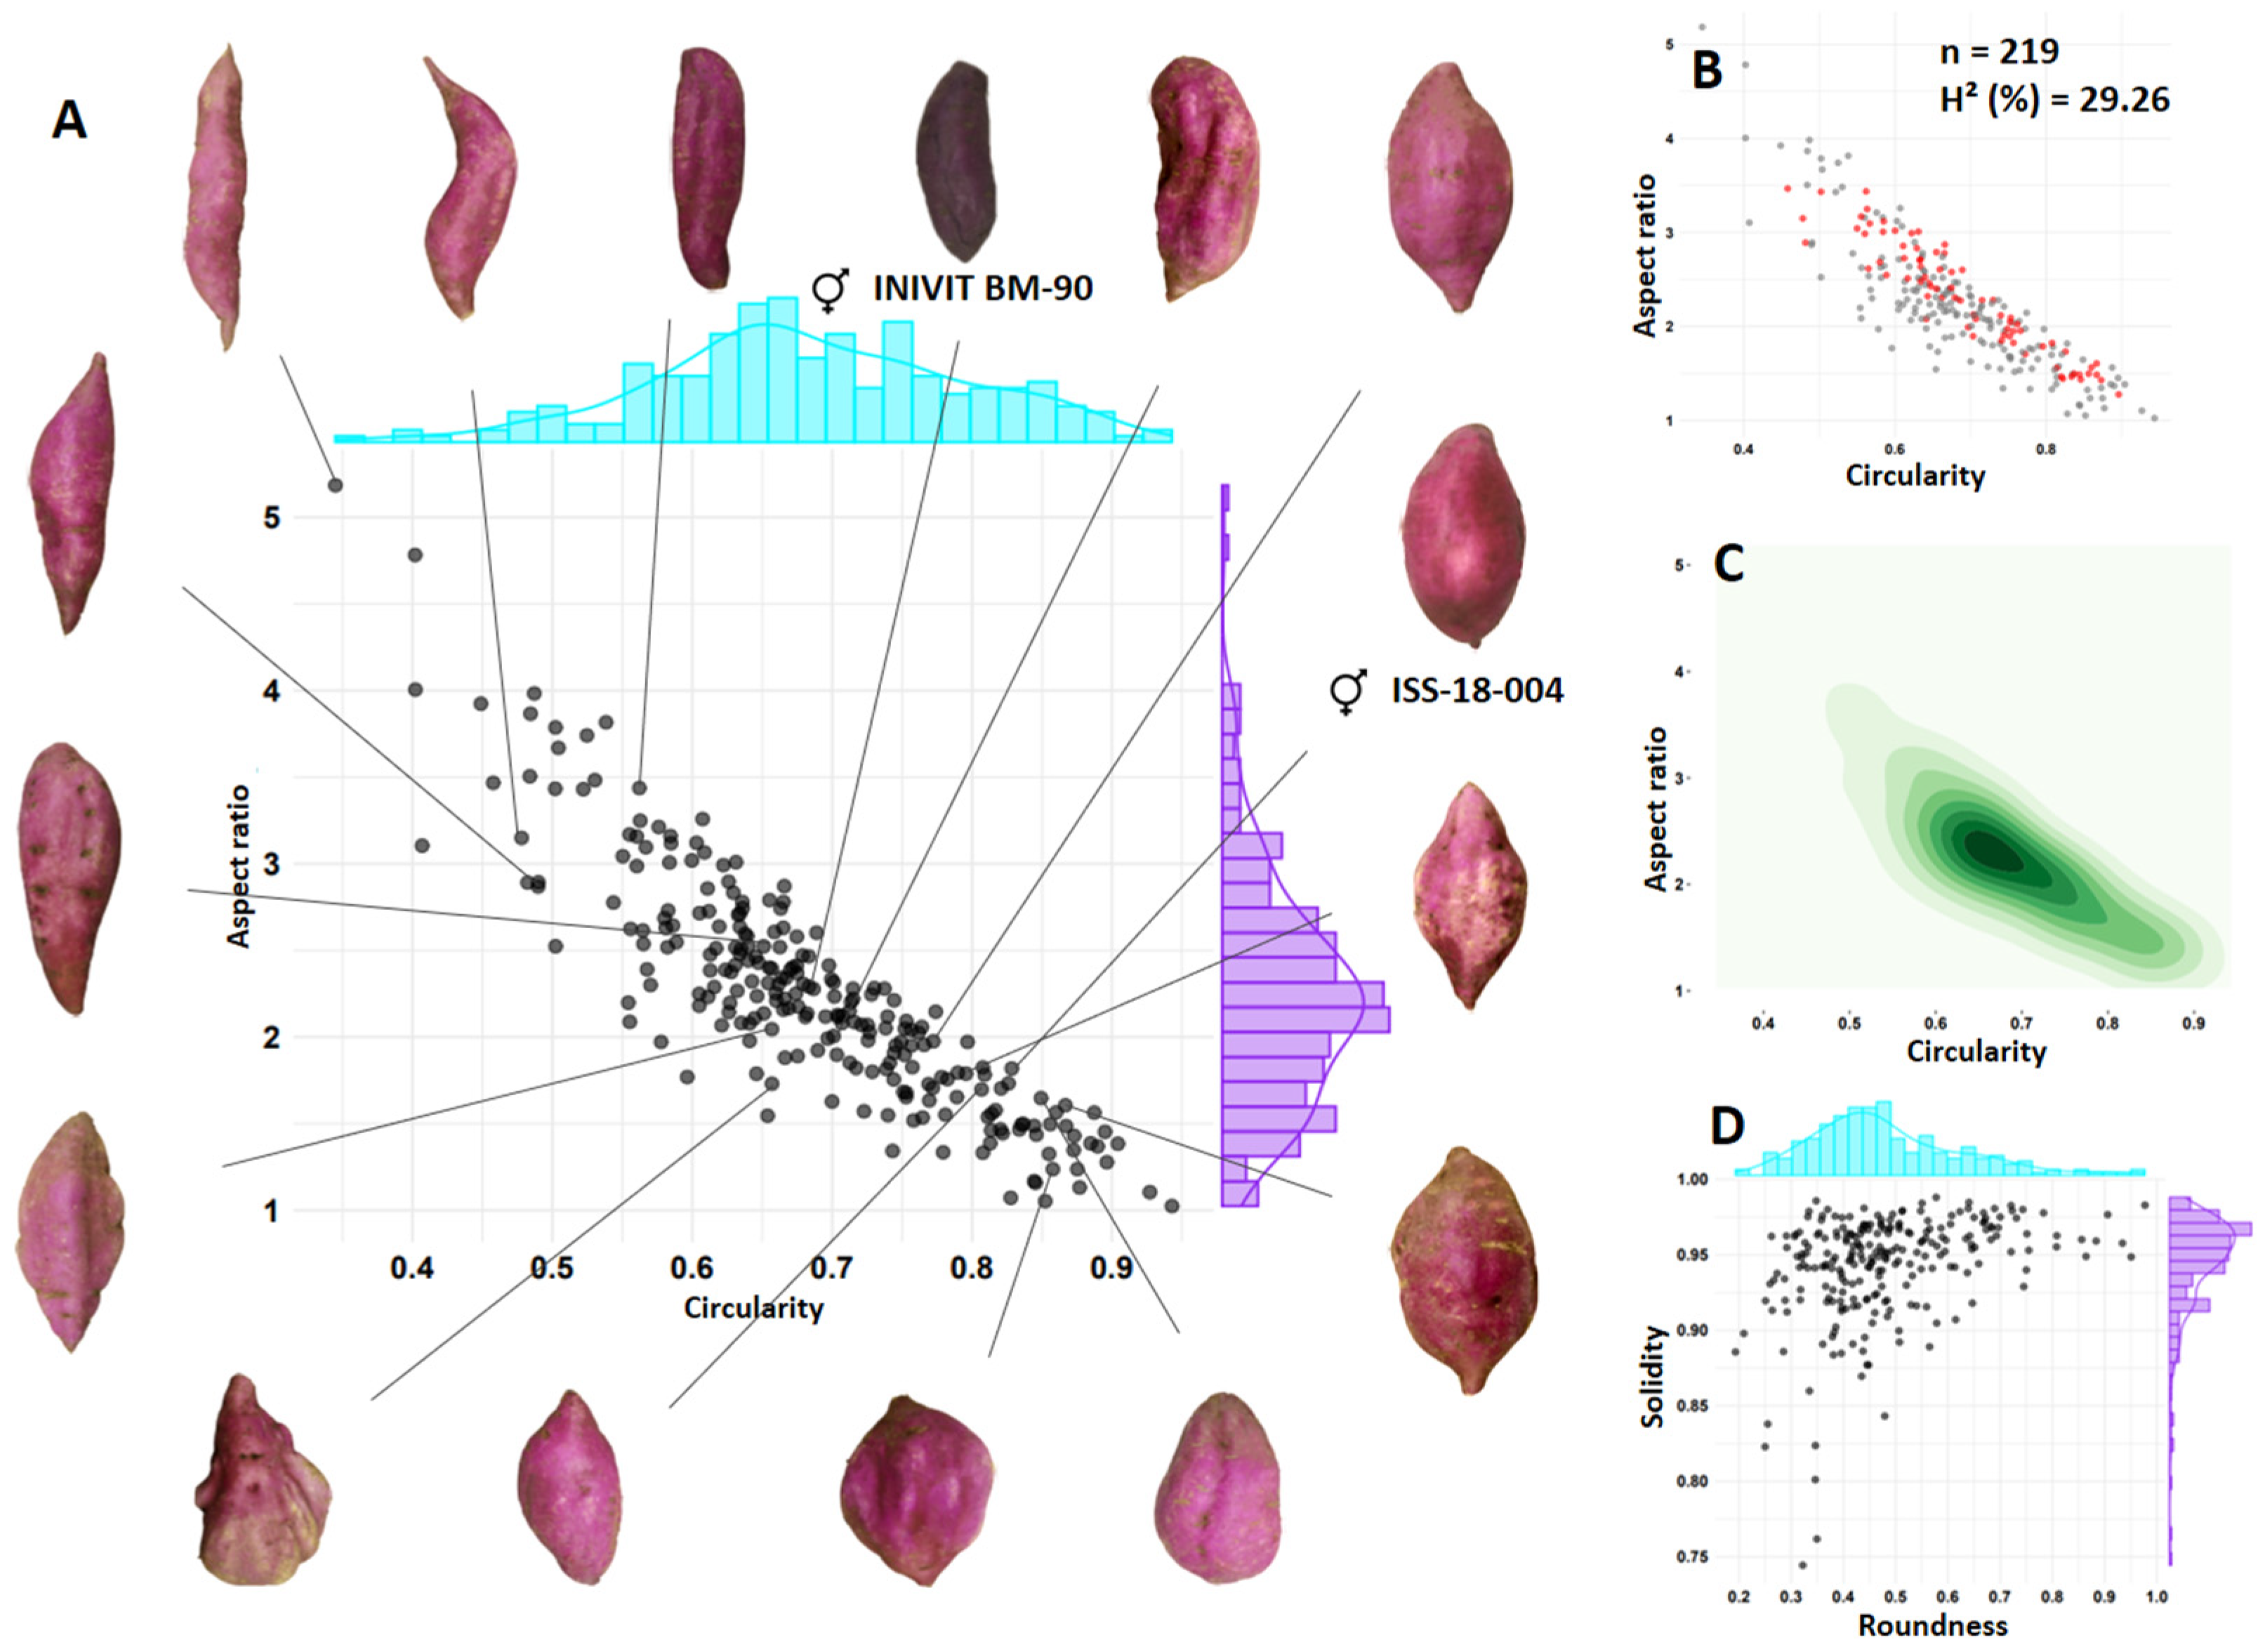
3.3. Shape of Tuberous Roots

The diversity of shapes obtained from the tuberous root of the population (n = 332) from the cross between two parents with defects on the surface of the tuberous root (CEMSA 74-228 [Circularity = 0.83, skin with longitudinal grooves] × INIVIT BS-16 [Circularity = 0.64, skin with horizontal constrictions and longitudinal grooves]) was represented with the combinations of four morphometric descriptors (circularity × aspect ratio, Figure 6A) (roundness × solidity, Figure 6C). Circularity, roundness, and solidity are sensitive indices for sweet potatoes with defects on the skin surface, while aspect ratio can reach proportional values independently of the defects. The progeny resulted to have an average for the circularity character of 0.69, an aspect ratio of 1.95, a roundness of 0.57, and a solidity of 0.93. A total of 44.7% of the population had circularity values between 0.7 and 0.94, indicating that about half of the population had sweet potatoes with a shape close to circular in terms of aspect ratio; the population with values above 2–3 (two to three times longer than wide) was 42.5%.
The contour plot of densities (Figure 6C) reflects greater color intensity toward the lower right corner and center, confirming the above, and is also corroborated by the solidity × roundness scatter plot (Figure 6D).
Of the 332 progeny, 298 produced tuberous roots, and only 35 had smooth skin without surface defects (11.74%), for a ratio of 8.5:1 (skin with defects:smooth skin) (Figure 6B). Of the sweet potatoes with AR values of 2–3 (42.5% of the total population), only 29.41% had smooth skin, and these are the sweet potatoes preferred by the market.
The estimated broad sense heritability indicated that 37.94% of the proportion of phenotypic differences was due to genotypic differences, suggesting that the effect of the environment on the variation in tuberous root shape is high, and it was also observed that the variation in shape within the same genotype could be high in some cases.
Similarly, the diversity of forms obtained from a tuberous root in the full sib family ISS-2311 (n = 246), resulting from two parents without defects on the surface of the tuberous root (smooth skin) (INIVIT BM-90 [Circularity = 0.67] × ISS-18-004 [Circularity = 0.81]), was represented with the combinations of four morphometric descriptors (Figure 7). Circularity ranged from 0.41 to 0.92, with 48.75% of the population in the range of from 0.6 to 0.75 (Figure 7A). The aspect ratio ranged from 1.09 to 5.34, with 50.0% in the range of from 2 to 3. Considering that the parent INIVIT BM-90 has an AR = 2.55 and ISS-18-004 has an AR = 1.83, the quantitative inheritance of this trait and the cumulative effect of multiple genes is confirmed.
Of the 246 progeny, 219 produced tuberous roots and 71 had smooth skin without surface defects (32.42%), for a ratio of 3:1 (skin with defects:smooth skin) (Figure 7B). Of the sweet potatoes with AR values of 2–3 (50.0% of the total population), 33.33% had smooth skin.
The contour plot of densities (Figure 7C) reflects greater color intensity toward the center, indicating that the tuberous roots were generally from two to three times longer than they were wide (Figure 7).
The estimated broad-sense heritability was 29.26%, similar to the previous family, indicating a strong environmental effect on this trait, as well as intrinsic variation within the same genotype.

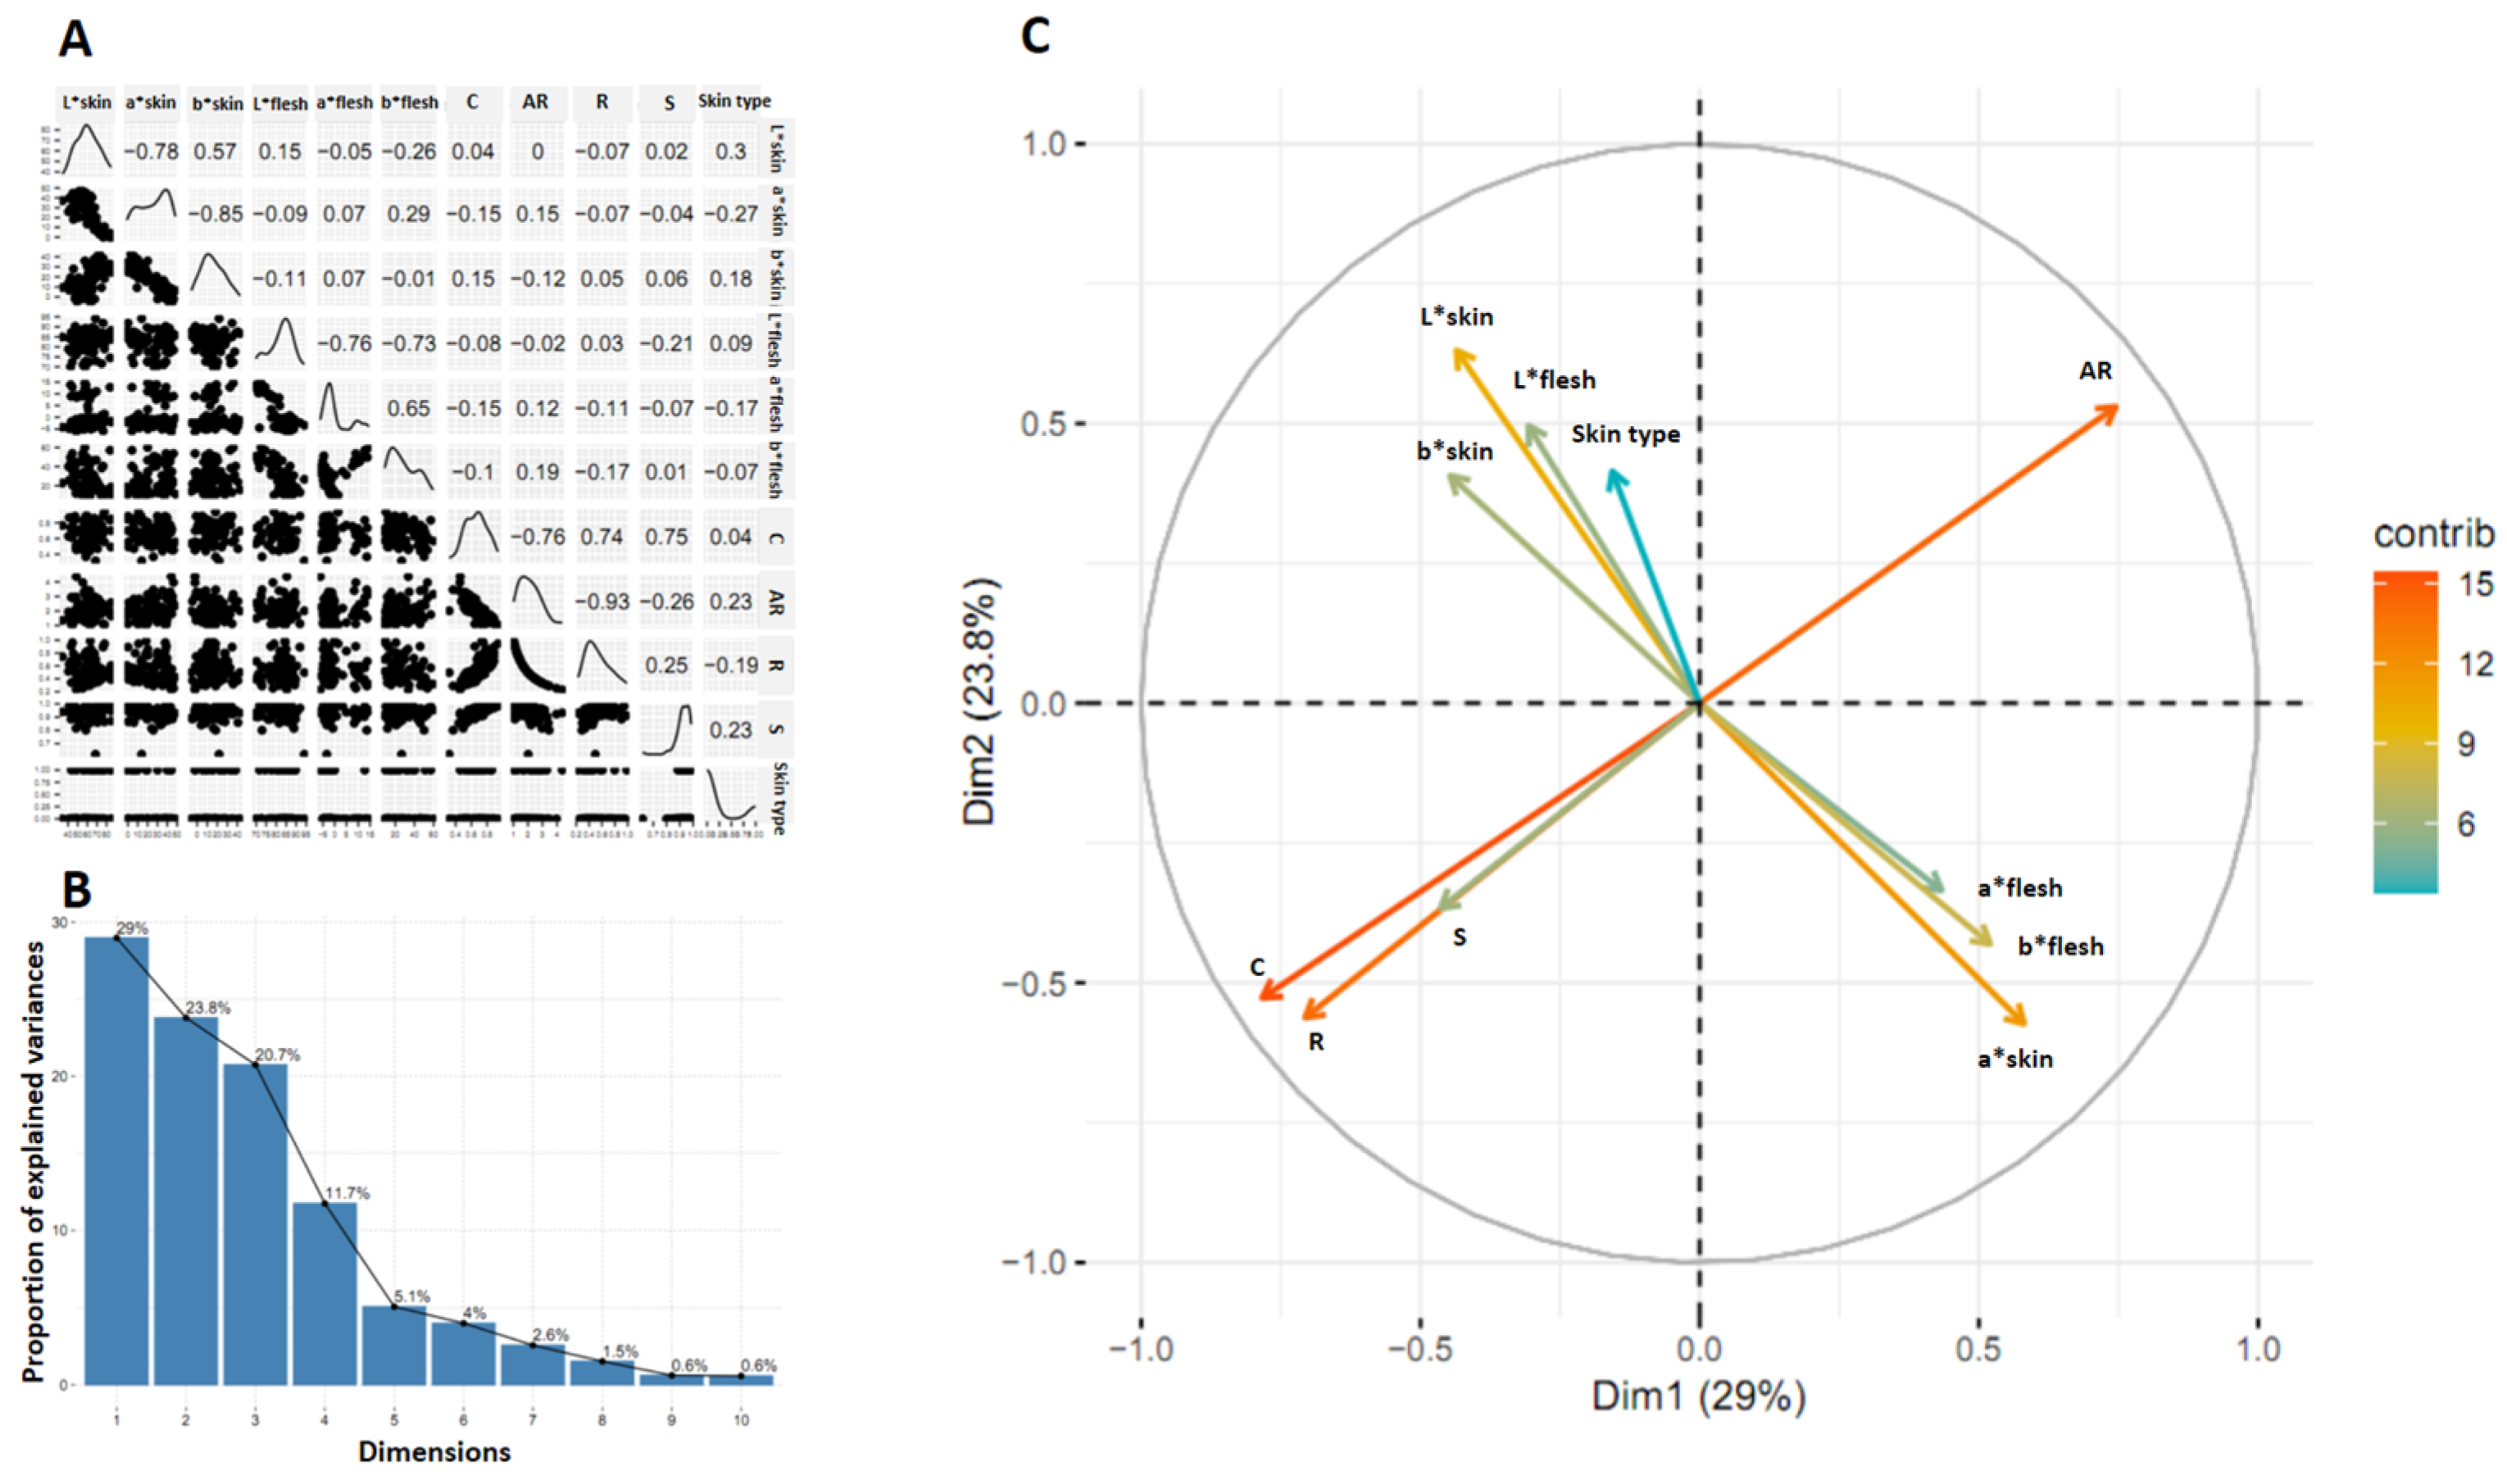
3.4. Association between Traits

The correlation matrix of 11 variables evaluated in the progeny resulting from the cross between two parents with defects on the surface of the tuberous root (CEMSA 74-228 × INIVIT BS-16) was represented (Figure 8A). The correlation between 11 variables (3 for skin color, 3 for flesh color, 4 for tuberous root shape, and 1 for skin type [with defect or smooth]) showed a very low and insignificant correlation between the four groups of variables. The correlation coefficient between tuberous root shape and flesh luminosity was r = 0.09, and between tuberous root shape and skin luminosity was r = 0.30, indicating that there was no linear relationship between these traits.
It was observed that the variance associated with each dimension was different and decreased in order (Figure 8B). The first dimension explained 29.0%, and the second 23.8% of the total variance. Together, the first two dimensions together explained 52.8% of the variance. In this sense, the first dimension was the most important because it explained the largest percentage of the variance in the data.
The projection of the correlation between the original variables and the first two dimensions was plotted (Figure 8C). The proximity between variables is interpreted as a similarity in their behavior with respect to the progeny (close values in them), and it also means that they are highly correlated with each other and have low correlations with respect to the other variables. This results in four well-defined variable-point clouds (groups of variables). Those with the greatest contribution (further from the center) in a negative sense were C and R, with a high relationship between both, and, in a positive sense, AR; the directions of the point clouds and their angular separation showed that the variable AR goes in the opposite direction to C and R, which indicates a strong negative correlation. The colorimetric variables contributed less to the variance. The skin type variable is close to the origin, so it had little relationship with the two dimensions. Despite the lack of correlation between L*skin, L*flesh, and skin type, the directions of the three variables and their angular separation showed that there might be some relationship between them (Figure 8C). To clarify this aspect, alluvial plots of the trends between L*skin and L*flesh and between L*flesh and skin type were made.
The correlation matrix of 11 variables evaluated in the progeny resulting from the cross between two parents with smooth skin of tuberous root (INIVIT BM-90 × ISS-18-004) is represented in Figure 9A. The results of the correlation, the variance associated with each dimension (Figure 9B), and the projection of the correlation between the original variables and the first two dimensions (Figure 9C) are similar to the family previously studied, so it is inferred that there is a similarity in the behavior of the variables independently of the families.
To determine if there was a relationship between different skin colors and a specific flesh color, and between flesh colors and skin type, alluvial plotsdiagrams of trends between these traits were made. Figure 10A,B shows the result for the segregating population between two parents with defects on the surface of the tuberous root, one with red skin and orange flesh (INIVIT BS-16), and another with cream skin and white flesh (CEMSA 74-228).
The yellow-skinned progeny was more likely to have white flesh (1:3), and, to a lesser extent, yellow (1:11), orange (1:16), and cream (1:23) flesh. Those with orange skin tended to be associated with yellow (1:5) and cream (1:4) flesh and, to a lesser extent, orange (1:16). Those with red skin were associated with all flesh colors (yellow, white, orange, and cream). There was an incomplete dominance of red skin color over cream skin (70% of the population had red skin), and the progenies, regardless of their flesh color, mostly had red skin. No genotypes were obtained with the combination of white flesh and orange flesh, but there were genotypes with cream flesh and orange skin. It can be inferred that these skin and flesh colors have independent segregation, except for orange skin and white flesh (there was no recombination frequency). The low combination of genotypes with orange skin and orange flesh is due to the incomplete dominance of red skin color over other lighter colors (Figure 10A). Smooth skin progeny was associated with all four flesh colors present in this family, mostly yellow (3:1), white (4:1), cream (3:1), and, to a lesser extent, orange (16:1), suggesting that most of the orange-fleshed genotypes had surface skin defects. It is evident that there was no relationship between flesh color and smooth skin, i.e., smooth skin segregates independently of its flesh color (Figure 10B).
Figure 11A,B shows the results for the segregating population between two smooth-skinned tuberous root parents, one with red skin and orange flesh (ISS-18-004), and another with purple skin and purple flesh (INIVIT BM-90).
The yellow-skinned progeny was associated with white flesh (1:5) and yellow flesh (1:10). The purple-skinned progeny was only associated with purple flesh and codominant flesh (purple-orange, purple-white), indicating an association between the purple skin and flesh color. There were no purple-skinned genotypes with yellow, orange, or creamy–white flesh, indicating a linkage disequilibrium between these skin colors and flesh colors. They did not segregate independently because the recombination frequency was not observed. The orange-skinned progeny was associated with yellow and orange flesh. The red-skinned progeny was associated with yellow, orange, cream–white, and codominant flesh, confirming the independent segregation of red skin and flesh colors. There was incomplete dominance of purple skin over red skin (61% of the purple-skinned population) (Figure 11A).
The smooth-skinned progeny was associated with the six flesh colors present in this family, mostly purple (3:1) and codominant (3:1), confirming that the smooth-skinned trait has independent segregation with respect to flesh color (Figure 11B).
Taking into account the results of this research, the following genetic model of biparental crosses is proposed to improve the flesh color of I. batatas (Figure 12), as well as a predictive formula for the progenies to be selected (5).
The predictive formula for the progenies to be selected is as follows:
PS = [(n × PPDC1) × PPDC2] × SSC
where
  • PS: Progenies to be selected;
  • n: Number of seedlings per family;
  • PPDC1: proportion of progeny with the desired color;
  • PPDC2: proportion of progeny with the desired color (if necessary, otherwise it will be = 1);
  • SSC: Smooth Skin Coefficient.
Objective: purple flesh (n = 100).
Purple flesh × white flesh:
PS = [(100 × 0.52) × 0.50] × 0.34 = 9 purple smooth-skinned sweet potatoes.
Purple flesh × orange flesh:
PS = [(100 × 0.66) × 0.50] × 0.34 = 11 purple smooth-skinned sweet potatoes.
Purple flesh × purple flesh:
PS = [(100 × 0.92) × 0.69] × 0.34 = 21 purple smooth-skinned sweet potatoes (most efficient route).
Objective: orange flesh (n = 100).
Orange flesh × white flesh:
PS = [(100 × 0.28) × 1] × 0.18 = 5 orange smooth-skinned sweet potatoes.
Orange flesh × purple
PS = [(100 × 0.14) × 1] × 0.18 = 3 orange smooth-skinned sweet potatoes.
Orange flesh × orange flesh:
PS = [(100 × 0.55) × 1] × 0.18 = 10 orange smooth-skinned sweet potatoes (most efficient route).
Objective: white flesh (for n = 100).
White flesh × purple flesh:
PS = [(100 × 0.47) × 1] × 0.22 = 10 white smooth-skinned sweet potatoes.
White flesh × orange flesh:
PS = [(100 × 0.56) × 1] × 0.22 = 12 white smooth-skinned sweet potatoes.
White flesh × white:
PS = [(100 × 0.92) × 1] × 0.22 = 20 white smooth-skinned sweet potatoes.
The model does not take into account skin color since it is a character of relative importance depending on consumer preferences, although the international market prefers sweet potatoes with orange and red skins.
In addition, the genetic model did not take into account the yellow color of the flesh in its different possible combinations since there are different intensities of yellow that, towards their extremes, can be confused with cream and orange colors. Instead, parents with intense orange flesh were used. However, if the objective is to obtain yellow flesh genotypes, efficient combinations can be made between yellow × yellow or yellow × orange flesh parents. The formula to use would theoretically be PS = [(n × 0.70) × 1] × 0.26.
If the objectives of a genetic improvement program include the combination of anthocyanin and carotenoid pigments in the same genotype (codominant flesh), only purple-fleshed × orange-fleshed parents should be crossed; approximately 11 codominant smooth-skinned sweet potatoes should be obtained.

4. Discussion

In none of the crosses made, 100% positive pollinations were observed; this phenomenon is explained by different reasons, including pollen fertility and environmental conditions at the time of crossing, among others [25]. This limited gametic fertility is also explained by abnormalities observed during meiosis, related to the hexaploid nature of the sweet potato genome [35].
In sweet potatoes, the percentage of capsules obtained from pollinated flowers varies according to the authors, between 30 and 75% [23], 63.21% [36], and 35 and 87% [37]. The number of seeds per capsule has been reported to be 1.2 [15], between 1.10 and 1.68 [38], and less than 2 [37]. The results obtained are consistent in all cases.
Some progeny from crosses of white and yellow-fleshed parents produce seedlings that segregate both colors, but white flesh color appears to be dominant over yellow flesh color [12]. When a white-fleshed parent is crossed with an orange-fleshed parent, 62.0–84.1% of the seedlings have white-fleshed roots [13,21,39,40]. The present results confirm what has been reported previously, that the progeny resulting from the cross of a white × orange-fleshed parent results in 28% of seedlings with orange flesh, confirming the incomplete dominance of white flesh color over orange. This may be due to the action of two or more white color genes on the orange flesh genes or the possible presence of an inhibitory gene [39].
Sweet potato seedlings may have higher concentrations of carotenoids (more intense orange flesh) than either of their parents [13,41]. Crossing two parents, one with high (18.5 mg) and one with low (1.2 mg) levels of carotenoids, produced 18.8% of the progeny with roots containing more than 21 mg of carotenoid pigments [39]. The inheritance of the orange flesh color behaves as a typical quantitative character, and it is possible that six genes with additive effects control the carotenoids [21]. In all the studies carried out, transgressive inheritance has been observed, which is of great practical importance for some characters since it is possible to find individuals with a greater degree of superiority than the original parent and a greater degree of inferiority than the original parent. Thus, by using superior individuals as parents in breeding programs and discarding inferior individuals, gradual improvement of important quantitative traits can occur [42]. It is clear that, in sweet potato, if a high percentage of carotene-rich progeny is desired, parents with high carotene content (intense orange pigmentation) must be used. Therefore, in the proposed genetic model, this is the suggested way since the carotene content is inhered quantitatively with an additive effect of genes.
In a study of a population of 1630 seedlings from biparental crosses having orange pulp color, it was reported that the orange color was predominant (37.48%), followed by light orange (28.71%) and dark orange (6.38%). Cream, white, and yellow pulp were found in smaller proportions [11]. The results are in agreement with those obtained: the progeny resulting from the cross between orange parents had a mono-factorial phenotypic ratio of 2:1:1 (orange:white:yellow).
In the case of tuberous root surface defects, 239 seedlings (91.92%) out of 260 showed roots with horizontal constrictions or longitudinal grooves [14]. The present results confirm this because, when crossing two parents with defects on the surface of the tuberous root, only 11.74% of seedlings with smooth skin without defects on the surface of the tuberous root were obtained, and, when crossing two parents without defects on the surface of the tuberous root (smooth skin), 32.42% of progeny with smooth skin were obtained. This suggests an additive effect of the genes for this trait and the importance of using parents with smooth skin. It is possible that, in other breeding programs in other parts of the world, the proportions of smooth skin in the progeny can be increased by using parents with a high degree of improvement for this trait due to dosage effects. The parents used in this study did not have this level of improvement.
Sweet potato progeny have varying length-to-width (L:W) ratios within the same family, ranging from 1.54 to 3.03 L:W. For different families, the progeny have different percentages (60, 39.4, 42.9, 48.1%) in the ratio of from 1.5 to 3.0 L:W. Furthermore, some progenies do not produce a defined pattern. It is likely that there are two sets of genes, one for length and one for width, that function independently and probably control root shape [43].
The aspect ratio of between 2 and 3 was obtained in 42.5% of the total population of one family and 50.0% of the other, indicating a high variation in the shape of the tuberous root within the same family. Furthermore, in both families, progeny with a higher aspect ratio than the longest parent and progeny with a lower value than the parent with the lowest value was observed, indicating transgressive segregation for this trait. Considering the AR values obtained in the progeny and the fact that the parents used have different AR, it can be inferred that this trait has a quantitative inheritance with no dominance of one form over another, suggesting that there is an interaction, several genes involved, and, perhaps, a cumulative effect.
Low heritability values (0.04) have been reported for tuberous roots [44]. In the present study, low broad-sense heritability values (0.29–0.38) were also found for this trait, which is due to the high variation in shape for the same genotype and the large environmental influence [45].
Following open pollination with purple-skinned and white-fleshed parents, the progeny will have monofactorial proportions of 1:4 light flesh/purple skin, 1:2 light flesh/brown skin, and 1:4 mottled purple flesh/purple skin. In addition, half of the purple-skinned plants have purple spots on the flesh [14]. These observations are consistent with the results of the present study, which reports that the seedlings from the combination of purple × white flesh and purple × orange flesh represented 50.76 and 47.05%, respectively, of the segregating population of purple flesh. In the case of the flesh with codominantly expressed color, which, in our case, instead of presenting purple spots on the flesh, was the opposite, the purple flesh presented orange or white spots in a smaller proportion than the predominant purple color. In addition, an incomplete dominance of the red skin over the cream skin color was obtained.
It has been suggested that the association between sweet potato skin and flesh color is neither independent nor determined by monofactorial segregations. Fractionation for dihybrid segregation indicates a good fit for a ratio of 9:7 purple:cream skin and 13:3 orange:cream flesh [14]. Of the orange-skinned progeny, the majority (63%) have orange flesh, whereas when the skin is anthocyanin or white/cream, most genotypes have white–cream flesh without orange inclusions [15]. The above claims are not 100% supported by the results obtained, as skin colors (red and yellow) and flesh colors (yellow, orange, and cream) show independent segregation. In addition, it is agreed that there was no recombination frequency between orange skin and white flesh and that between purple skin and yellow, orange, or cream-white flesh, segregation did not occur independently. This may be because the loci involved are located on the same chromosome, making it impossible for them to be randomly passed on to progeny when chromosomes separate during meiosis. This linkage disequilibrium is influenced by many factors, including selection, the rate of genetic recombination, genetic drift, population structure, and linkage. Since the white-fleshed genotypes had only red or yellow skin, it is likely that these colors are dominant over the orange skin color. In addition, the purple-skinned genotypes were only associated with purple flesh and codominant flesh (purple–orange, purple–white), so it can be said that there is a linkage between the purple and flesh skin color. This possible linkage (joint transmission) suggests the proximity between the genes of both traits on the same chromosome. It is possible that different authors obtain dissimilar results in this crop due to its directed evolution (crosses and artificial selection), ploidy level, crossing over during meiosis, allelic dosage for some traits, and polysomal inheritance route.
Crosses between dark-skinned parents produce a large percentage of F1 seedlings with pink or purple skin [41], as occurred in the present investigation. When a cream-skinned parent is crossed with a copper-skinned parent, most of the seedlings are tan or darker. When a copper-skinned parent is crossed with a purple-skinned parent, none of the progeny produced white-skinned roots. Furthermore, in a cross between purple-skinned and pink-skinned parents, 90.1% of the population is purple-skinned, and only 5.9% is pink-skinned, suggesting that the inheritance of skin color may be controlled by the interaction of several genes, probably of complementary action [21,39,43]. The present results support these findings. Since the purple and red traits are incompletely dominant over the light skin colors, it is important to select light-skinned parents if cream- or orange-skinned sweet potatoes are desired, and, thus, it is possible to obtain seedlings with the desired skin color along with other combined traits.
Heritability values of 0.13 have been reported for flesh color [44]. In the present study, the results are different; for flesh color, the estimated broad sense heritability was greater than 0.90 in all cases, indicating that variation in flesh color is of genetic origin and is influenced little by the environment.
By crossing two sweet potato parents, one with yellow skin and creamy flesh and the other parent with purple skin and yellow flesh, the progeny is not affected by the direction of the cross (sex-linked inheritance). For the skin color, progeny was found with values higher or lower than those of either parent. 64% of the genotypes had anthocyanin skin, 18% with white/cream skin, and 18% with orange skin. In the flesh, 62% of the genotypes showed white/cream flesh, while the remaining 38% showed flesh with different intensities of orange color. The continuous distribution of the characters analyzed confirms their quantitative nature. Given the hexaploid nature of the sweet potato, a quantitative variation is also expected even in those characters of a qualitative nature [15].
In sweet potato, the segregation proportions in certain crosses are usually complex but can be simple and Mendelian when a single dominant allele is present. However, because simple proportions are affected by the homozygosity of some genes, inheritance studies often show discrepancies in segregation patterns, which are diverse and complex. When dosage effects occur, segregation is continuous, and discrete proportions are not observed, even when a single locus is responsible for a trait [46].

5. Conclusions

A more precise contribution to the inheritance governing the traits of flesh color, skin color, and tuberous root shape characters, as well as their association, was made by eliminating the difficulty of fractioning segregation frequencies by using morphometric variables. However, for the shape character of the tuberous root, the morphometric variables used (2D scale) had limitations because they did not accurately dissect roots with and without defects on the skin surface. A more precise contribution could be made if this segregation pattern were studied using a professional 3D laser scanner. The high estimates of broad-sense heritability for flesh color indicated that phenotypic differences were due to genotypic differences. There was incomplete dominance of white flesh color and purple color over orange color. Therefore, the best strategy to obtain orange-fleshed genotypes is to cross orange-fleshed parents. There is a possible linkage (joint transmission) between purple skin color and purple and codominant (purple–orange, purple–white) flesh color. In addition, all the traits studied appear to be quantitatively inherited. A genetic model for biparental crosses to improve the flesh color of I. batatas was proposed, as well as a predictive formula for the progeny to be selected. This could lead to more efficient progress (in terms of time and resources) in the genetic improvement of this species to obtain genetically balanced cultivars with the desired characteristics.

Author Contributions

Conceptualization, A.M. and I.J.P.V.; methodology, D.R.d.-S.; software, V.V.C.; validation, O.P. and Y.L.V.; formal analysis, A.M.; investigation, A.M. and D.R.d.-S.; resources, V.V.C.; data curation, A.M.; writing—original draft preparation, A.M. and I.J.P.V.; writing—review and editing, A.M., O.P. and Y.B.G.; visualization, Y.R.G.; supervision, A.J.M.; project administration, A.M.; funding acquisition, I.J.P.V. All authors have read and agreed to the published version of the manuscript.

Funding

This research received no external funding.

Data Availability Statement

The raw data supporting the conclusions of this article will be made available by the authors upon request.

Conflicts of Interest

The authors declare no conflicts of interest.

References

  1. BBC News Mundo. Gregor Mendel: Cómo un Monje con un Jardín de Arvejas Descubrió las leyes de la Herencia Genética. 2021. Available online: https://www.bbc.com/mundo/noticias-56719582 (accessed on 18 August 2024).
  2. Sadurní, J.M. EL MONJE BOTÁNICO. Gregor Mendel, el Padre de la Genética. 2023. Available online: https://historia.nationalgeographic.com.es/a/gregor-mendel-padre-genetica_15509 (accessed on 12 August 2024).
  3. Isobe, S.; Shirasawa, K.; Hirakawa, H. Current status in whole genome sequencing and analysis of Ipomoea spp. Plant Cell Rep. 2019, 38, 1365–1371. [Google Scholar] [CrossRef] [PubMed]
  4. Kriegner, A.; Cervantes, J.C.; Burg, K.; Mwanga, O.M.; Zhang, D. A genetic linkage map of sweetpotato [Ipomoea batatas (L.) Lam.] based on AFLP markers. Mol. Breed. 2003, 11, 169–185. [Google Scholar] [CrossRef]
  5. Mollinari, M.; Olukolu, B.A.; Pereira, D.S.; Khan, A.; Gemenet, D.; Yencho, G.C.; Zeng, Z.B. Unraveling the Hexaploid Sweetpotato Inheritance Using Ultra-Dense Multilocus Mapping. G3 2020, 10, 281–292. [Google Scholar] [CrossRef] [PubMed]
  6. Cervantes, J.C.; Yencho, G.C.; Kriegner, A.; Pecota, K.V.; Faulk, M.A.; Mwanga, R.O.; Sosinski, B.R. Development of a genetic linkage map and identification of homologous linkage groups in sweetpotato using multiple-dose AFLP markers. Mol. Breed. 2008, 21, 511–532. [Google Scholar] [CrossRef]
  7. Jones, A. Theoretical Segregation Ratios of Qualitatively Inherited Characters for Hexaploid Sweetpotato (Ipomoea batatas L.); Technical Bulletin; Agricultural Research Service US: Washington, DC, USA, 1967; p. 1368. [Google Scholar]
  8. Shiotani, I. Sweet Potato Evolution. Sweet Potato Research and Development for Small Farmers. In Sweet Potato Research and Development for Small Farmers; Kennet, T., Manuel, K., Rolinda, T., Eds.; SEAMEO-SEARCA: Santa Cruz, Philippines, 1989; pp. 5–15. [Google Scholar]
  9. Grüneberg, W.J.; Ma, D.; Mwanga, R.; Carey, E.; Huamani, K.; Diaz, F.; Eyzaguirre, R.; Guaf, E.; Jusuf, M.; Karuniawan, A.; et al. Advances in sweet potato breeding from 1992 to 2012. In Potato and Sweetpotato in Africa: Transforming the Value Chains for Food and Nutrition Security; CAB International: Wallingford, UK, 2015; Chapter 1; pp. 3–68. [Google Scholar]
  10. Rangaswami, A.K.; Sampathkumar, R. Inheritance of leaf shape and colour in sweet potato. Indian J. Genet. Plant Breed. 1978, 38, 262–263. [Google Scholar]
  11. Vimala, B.; Sreekanth, A.; Hariprakash, B.; Wolfgang, G. Variation in morphological characters and storage root yield among exotic orange-fleshed sweet potato clones and their seedling population. J. Root Crops 2012, 38, 32–37. [Google Scholar]
  12. Hernandez, T.P. A Study of Some Genetic Characters of the Sweet Potato. Ph.D. Thesis, LSU, Baton Rouge, LA, USA, 1942; p. 66. [Google Scholar]
  13. Harmon, S.A. Genetic Studies and Compatibilities in the Sweet Potato (Ipomoea batatas). Ph.D. Thesis, LSU, Baton Rouge, LA, USA, 1960. [Google Scholar]
  14. Poole, C.F. Sweet Potato Genetic Studies; Technical Bulletin; University of Hawaii: Honolulu, HI, USA, 1955; p. 27. [Google Scholar]
  15. Arizio, C.M.; Manifesto, M.M.; Martí, H.R. Análisis de caracteres relacionados con el color de la raíz engrosada en un cruzamiento de dos clones de Ipomoea batatas L. (Lam.). Hortic. Argent. 2009, 28, 5–13. [Google Scholar]
  16. Wang, A.; Li, R.; Ren, L.; Gao, X.; Zhang, Y.; Ma, Z.; Ma, D.; Luo, Y. A comparative metabolomics study of flavonoids in sweet potato with different flesh colors (Ipomoea batatas (L.) Lam). Food Chem. 2018, 260, 124–134. [Google Scholar] [CrossRef] [PubMed]
  17. Xiao, Y.; Zhu, M.; Gao, S. Genetic and Genomic Research on Sweet Potato for Sustainable Food and Nutritional Security. Genes 2022, 13, 1833. [Google Scholar] [CrossRef] [PubMed]
  18. De Albuquerque, M.R.; Sampaio, K.B.; Souza, E.L. Sweet potato roots: Unrevealing an old food as a source of health promoting bioactive compounds. A review. Trends Food Sci. Technol. 2019, 85, 277–286. [Google Scholar] [CrossRef]
  19. Sagar, N.A.; Pareek, S.; Sharma, S.; Yahia, E.M.; Lobo, M.G. Fruit and Vegetable Waste: Bioactive Compounds, Their Extraction, and Possible Utilization. Compr. Rev. Food Sci. Food Saf. 2018, 17, 512–531. [Google Scholar] [CrossRef] [PubMed]
  20. Minatel, I.O.; Borges, C.V.; Alonzo, H.; Hector, G.; Gomez, C.O.; Pace, G.; Lima, P. Phenolic Compounds: Functional Properties, Impact of Processing and Bioavailability, Phenolic Compounds—Biological Activity; InTech: London, UK, 2017; pp. 1–24. [Google Scholar]
  21. Hernandez, T.P.; Hernandez, T.; Constantin, R.J.; Kakar, R.S. Improved techniques in breeding and inheritance of some of the characters In the sweet potato, Ipomoea batatas L. In Proceedings of the International Symposium on Tropical Root Crops, St. Augustine, Trinidad, 2–8 April 1967; Volume 1, pp. 31–49. [Google Scholar]
  22. Morales, R.A.; Rodríguez, S.D.; Xie, Y.; Guo, X.; Jia, X.; Ma, P.; Bian, X. Self-incompatibility of sweet potato (Ipomoea batatas (L.) Lam.). A review. Rev. Agric. Trop. 2019, 5, 1–8. [Google Scholar]
  23. Arizio, C.M. Marcadores Funcionales Relacionados con la Síntesis de Pigmentos y su Localización en un Mapa de Ligamiento en Ipomoea batatas L. Lam. Ph.D. Thesis, Facultad de Ciencias Exactas y Naturales, Universidad de Buenos Aires, Buenos Aires, Argentina, 2011; p. 267. [Google Scholar]
  24. Schroeder, T. Okinawa Sweet Potato: Japan’s Amazing Purple Superfood! 2021. Available online: https://sakura.co/blog/okinawa-sweet-potato-japans-amazing-purple-superfood (accessed on 11 May 2024).
  25. Morales, R.A.; Rodríguez, S.D.; Rodríguez, M.S.; Rodríguez, G.Y.; Trujillo, O.N.; Jiménez, M.A.; Molina, C.O. Floral biology and phenology of sweet potato (Ipomoea batatas [L.] Lam.) in Cuba: Bases for genetic improvement. Afr. J. Agric. Res. 2023, 19, 1043–1055. [Google Scholar]
  26. Hernández, A.; Pérez, J.; Bosch, D.; Castro, N. Clasificación de los Suelos de Cuba; Ediciones INCA: La Habana, Cuba, 2015; p. 61. [Google Scholar]
  27. Ferreira, T.; Rasband, W. ImageJ User Guide. IJ 1.46, Revised ed.; 2012; p. 198. Available online: https://imagej.net/ij/docs/guide/user-guide.pdf (accessed on 18 August 2024).
  28. X-Rite. Guía para Entender la Comunicación del Color. L10-001-SL 2002, 2, 24. [Google Scholar]
  29. Popat, R.; Patel, R.; Parmar, D. Variability: Genetic Variability Analysis for Plant Breeding Research, R package version 0.1.0. 2020; 7. Available online: https://cran.r-project.org/web/packages/variability/variability.pdf (accessed on 18 August 2024).
  30. Wickham, H. ggplot2: Elegant Graphics for Data Analysis; Springer: Berlin, Germany, 2016; p. 260. [Google Scholar]
  31. Harrower, M.; Brewer, C.A. ColorBrewer.org: An Online Tool for Selecting Colour Schemes for Maps. Cartogr. J. 2003, 40, 27–37. [Google Scholar] [CrossRef]
  32. Garnier, S. Viridis: Default Color Maps from ‘Matplotlib’, R package Version 0.4.0. 2017. Available online: https://CRAN.R-project.org/package=viridis (accessed on 2 August 2024).
  33. Hair, J.F.; Anderson, R.E.; Tatham, R.L.; Black, W.C. Multivariate Data Analysis; MacMillan Publ. Co.: Nueva York, NY, USA, 1992; p. 544. [Google Scholar]
  34. Pla, L.E. Análisis Multivariado: Método de Componentes Principales; Secretaría General de la Organización de los Estados Americanos (OEA): Washington, DC, USA, 1986; p. 95. [Google Scholar]
  35. Reynoso, D.; Huaman, Z.; Aguilar, C. Methods to Determine the Fertility and Compatibility of Sweetpotato; Training Manual; International Potato Center: Lima, Peru, 1998; pp. 133–140. [Google Scholar]
  36. Kambale, H.; Ngugi, K.; Olubayo, F.; Kivuva, B.; Muthomi, J.; Nzuve, F. The Inheritance of Yield Components and Beta Carotene Content in Sweet Potato. J. Agric. Sci. 2018, 10, 2. [Google Scholar]
  37. Lestari, S.U.; Hapsari, R.I.; Basuki, N. Crossing Among Sixteen Sweet Potato Parents for Establishing Base Populations Breeding. AGRIVITA J. Agric. Sci. 2019, 41, 246–255. [Google Scholar] [CrossRef]
  38. Rukarwa, R.J.; Mukasa, S.B.; Sefasi, A.; Ssemakula, G.; Mwanga, O.M.; Ghislain, M. Segregation analysis of cry7Aa1 gene in F1 progenies of transgenic and non-transgenic sweetpotato crosses. J. Plant Breed. Crop Sci. 2013, 5, 209–213. [Google Scholar]
  39. Constantin, R.J. A Study of the Inheritance of Several Characters in the Sweet Potato, (Ipomoea batatas). Ph.D. Thesis, LSU, Baton Rouge, LA, USA, 1964; p. 93. [Google Scholar]
  40. Hernandez, T.P. A Study of the Inheritance of Skin Color, Total Carotenoid Pigments, Dry Matter, and Techniques in Classifying These Characters in Ipomoea batatas. Ph.D. Thesis, La. State University, Baton Rouge, LA, USA, 1963; p. 67. [Google Scholar]
  41. Miller, R.M.; Melampy, J.J.; Hernandez, T.P. Effect of storage on the carotene content of fourteen varieties of sweet potatoes. Proc. Am. Soc. Hortic. Sci. 1949, 54, 399–402. [Google Scholar]
  42. Edmond, J.B. Genetics, breeding behaviour, and development of superior varieties. In Sweet Potatoes: Production, Processing, Marketing; AVI Publishing Co., Inc.: Westport, CT, USA, 1971; pp. 58–80. [Google Scholar]
  43. Hammett, H.L. A Study of the Inheritance of Root Shape, Skin Color, Total Carotenoid Pigments, Dry Matter, Fiber and Baking Quality in the Sweet Potato (Ipomoea batatas). Ph.D. Thesis, LSU, Baton Rouge, LA, USA, 1965; p. 140. [Google Scholar]
  44. Thibodeaux, S.D.; Hernandez, T.P.; Hernandez, T. Breeding techniques, combining aility of parents, heritabilities, insect resistance and other factors affecting sweet potato breeding. In Proceedings of the Third International Symposium on Tropical Root Crops, IITA, Ibadan, Nigeria, 2–9 December 1973; Volume 12, pp. 2–9. [Google Scholar]
  45. Stokdyk, E.A. Selection of sweet potatoes. J. Hered. 1925, 16147–16150. [Google Scholar] [CrossRef]
  46. Franklin, M.; Jones, A. Plant Breeding Reviews; AVI Publishing Co.: Clark, CO, USA, 1986; Volume 4, pp. 313–345. [Google Scholar]
Figure 1. Segregation of flesh color of the progeny resulting from the crossing of a white flesh parent (CEMSA 74-228) with a purple flesh parent (INIVIT BM-90). Scatter plot (A), scatter plot with blue dots representing the codominant trait (B), and contour plot of densities (C).
Horticulturae 10 01032 g001
Figure 2. Segregation of flesh color of the progeny resulting from crossing two purple-fleshed parents (INIVIT BM-90 × INIVIT BM-8). Scatter plot (A), scatter plot with blue dots representing the codominant trait (B), and density contour plot (C).
Horticulturae 10 01032 g002
Figure 3. Segregation of flesh color of progeny resulting from crossing two orange-fleshed parents (INIVIT BS-16 × Spanish). Scatter plot (A) and density contour plot (B).
Horticulturae 10 01032 g003
Figure 4. Segregation of flesh color of the progeny resulting from crossing a white-fleshed parent (CEMSA 78-326) with an orange-fleshed parent (INIVIT BS-16). Scatter plot (A) and density contour plot (B).
Horticulturae 10 01032 g004
Figure 5. Segregation of flesh color of the progeny resulting from crossing an orange-fleshed parent (INIVIT BS-16) with a purple-fleshed parent (INIVIT BM 25-19). Scatter plot (A), scatter plot with blue dots representing the codominant trait (B), and density contour plot (C).
Horticulturae 10 01032 g005
Figure 6. Segregation for tuberous root shape of progeny resulting from crossing two parents with defects in the surface of the tuberous root (CEMSA 74-228 × INIVIT BS-16). Scatter plot of circularity × aspect ratio (A), scatter plot of red dots representing smooth skin genotypes (B), density contour plot (C), and scatter plot of roundness × solidity (D).
Horticulturae 10 01032 g006
Figure 7. Segregation for tuberous root shape of progeny resulting from crossing two smooth-skinned parents (INIVIT BM-90 × ISS-18-004). Circularity × aspect ratio scatter plot (A), red dot scatter plot representing smooth-skinned genotypes (B), density contour plot (C), and roundness × solidity scatter plot (D).
Horticulturae 10 01032 g007
Figure 8. Results of the progeny obtained from crossing two parents with defects on the surface of the tuberous root (CEMSA 74-228 × INIVIT BS-16). Correlation matrix of 11 variables (A), proportion of variance explained by each dimension (B), and distribution of the correlation values of the variables in the first and second dimensions (C).
Horticulturae 10 01032 g008
Figure 9. Results of the progeny obtained from crossing two smooth-skinned parents of tuberous root (INIVIT BM-90 × ISS-18-004). Correlation matrix of 11 variables (A), proportion of variance explained by each dimension (B), and distribution of the correlation values of the variables in the first and second dimensions (C).
Horticulturae 10 01032 g009
Figure 10. Results of the progeny obtained from crossing two parents with defects on the surface of the tuberous root (CEMSA 74-228 × INIVIT BS-16). Alluvial plots of trends between skin color (left vertical axis) and flesh (right vertical axis), flow fields with skin color (A), alluvial plots between flesh color (left vertical axis) and skin type of tuberous root (right vertical axis), and flow fields with flesh color (B).
Horticulturae 10 01032 g010
Figure 11. Results of the progeny obtained from crossing two smooth-skinned parents of tuberous root (INIVIT BM-90 × ISS-18-004). Alluvial plots of trends between skin color (left vertical axis) and flesh (right vertical axis), flow fields with skin color (A), alluvial plots between flesh color (left vertical axis) and skin type of tuberous root (right vertical axis), and flow fields with flesh color (B).
Horticulturae 10 01032 g011
Figure 12. Genetic model of biparental crosses to improve the flesh color of I. batatas.
Horticulturae 10 01032 g012
Table 1. Selected characters and combinations between parents.
Character to Be InvestigatedParents ParentsFamily
Color of the flesh of the tuberous rootINIVIT BM-90
(purple flesh)
×CEMSA 74-228
(white flesh)
ISS-2305
INIVIT BM-90
(purple flesh)
×INIVIT BM-8
(purple flesh)
ISS-2306
INIVIT BS-16
(orange flesh)
×Español
(orange flesh)
ISS-2307
INIVIT BS-16
(orange flesh)
×CEMSA 78-326
(white flesh)
ISS-2308
INIVIT BM-25-19 (purple flesh)×INIVIT BS-16
(orange flesh)
ISS-2309
Shape of tuberous rootINIVIT BS-16
(Skin with horizontal constrictions and longitudinal grooves)
×CEMSA 74-228
(Skin with longitudinal grooves)
ISS-2310
INIVIT BM-90
(smooth skin)
×ISS-18-004
(smooth skin)
ISS-2311
Table 2. Morphometric variables used.
VariablesCodeFormula
CircularityC 4 π × A P 2
Aspect ratioAR E m a E m e
Roundness R 4 × A π × m d 2
Solidity S A A c
LuminosityL*-
a* coordinatea*-
b* coordinateb*-
A: area, P: perimeter, md: maximum diameter, Ac: convex area, Ema: major axis, Eme: best axis.
Table 3. Results of the pollination carried out on parents.
FamilyNo. of PollinationsNo. of CapsulesPositive Pollinations (%)No. of SedesNo. of Seeds/CapsuleSeed Germination (%)No. of Seedlings
ISS-230541627365.73201.1777.5248
ISS-230619113872.472211.6089.4198
ISS-230749722645.532791.2379.2221
ISS-230827318969.352691.4293.2251
ISS-230934315545.063061.9887.6268
ISS-231041919947.483661.8490.8332
ISS-231128018164.432841.5786.7246
Average--58.57-1.5486.34-
Total24191361-2045--1764
Disclaimer/Publisher’s Note: The statements, opinions and data contained in all publications are solely those of the individual author(s) and contributor(s) and not of MDPI and/or the editor(s). MDPI and/or the editor(s) disclaim responsibility for any injury to people or property resulting from any ideas, methods, instructions or products referred to in the content.

