1. Introduction
Magnesium (Mg) is an important element for plant growth, playing a key role in various processes, such as protein synthesis, photosynthesis, enzyme activity, carbohydrate distribution, and lipid metabolism [
1,
2]. Thus, Mg deficiency significantly restricts plant development.
Magnesium deficiency is caused by an excessive use of potassium, phosphorus, and nitrogen fertilizers and the lack of supplementation instead of Mg taken from the soil by the plants [
3]. This situation causes the excessive accumulation of potassium in the soil and magnesium deficiency in plants [
4]. Mg deficiency in plants is less apparent compared to nitrogen (N), phosphorus (P), and potassium (K) [
5]. For that reason, Mg fertilization is often neglected.
Greenhouse tomato cultivation is highly sensitive to nutrient management. Magnesium deficiency is commonly observed in greenhouse tomatoes, particularly when cultivated in calcareous soils [
6]. The main cause of Mg deficiency in calcareous soils is a significant reduction in Mg ion activity, which is attributed to salt accumulation. Efforts to improve tomato yield and quality through the application of high potassium rates have been identified as a major contributing factor to Mg deficiency in greenhouse tomatoes [
6]. On the other hand, high-intensity irrigation in greenhouses leads to the leaching of Mg, resulting in Mg loss [
7].
Today, new-generation hybrid tomato cultivars are bred for various purposes and put on the market by various seed companies. The hybrid cultivars’ macro and micro requirements, and specifically NPK needs are high. Especially in the tomatoes grown in greenhouses, potassic and calcic fertilizers are intensively used in order to obtain high yields and decrease blossom-end rot. This situation affects the tomato plant’s Mg intake from the soil and negatively affects the yield and fruit quality. Previous studies have specified that Mg fertilizers increase the yield and fruit quality of the tomato [
8,
9,
10,
11,
12]. However, most of these studies were conducted in flowerpots, in open fields, or through soilless culture. In particular, studies performed in greenhouses are very few [
3,
13]. Although several studies have investigated the physiological and phenotypic responses of plants to Mg deficiency, the effects of Mg application on tomato plants grown in greenhouses have not been extensively researched. Considering the severe accumulation of NPK, high-intensity irrigation, and calcareous soils, foliar Mg spraying is the recommended application to increase tomato yield in greenhouses.
Tomato (
Solanum lycopersicum L.) is a plant that is rich in vitamins and minerals and significantly contributes to human nutrition. In 2022, 186 million tons of tomatoes were produced worldwide. The Republic of Türkiye, with its tomato production of 13 million tons, ranks as the third country with the highest production in the world [
14]. Like the other plant species, the tomato plant requires macro and micronutrients for high yield and fruit quality and is negatively affected by insufficient fertilization. Insufficient Mg fertilization decreases the market value of tomatoes by negatively affecting the yield and fruit quality. Thus, it is required to perform Mg fertilization at a suitable dose in order to mitigate the negative impacts of Mg. The aim of this study was to investigate the effects of varying doses of foliar magnesium application on agronomic, physiological, biochemical, and antioxidant enzyme activity in greenhouse-grown tomatoes. The results of this study may provide guidance on the effects of foliar magnesium application on yield and fruit quality in greenhouse tomato cultivation.
2. Materials and Methods
2.1. Plant Materials and Experimental Site
This study was carried out in the PE film-coated greenhouse (37°20′22.2″ N, 41°53′55.7″ E) of Şırnak University’s Faculty of Agriculture (İdil, Şırnak, Republic of Türkiye). In the greenhouse, the average temperatures were 25 ± 2 °C during the day and 15 ± 2 °C at night, and the relative humidity was ~50%. The Barbekü F1 (Solanum lycopersicum L.) tomato cultivar used in the experiment had shiny dark red fruits. Barbekü F1 seedlings were procured from the Tarsus seedling company (Tarsus, Mersin, Republic of Türkiye). At the beginning of the experiment, soil samples were taken from a depth of 0–30 cm and analyzed. The soil used in the experiment contained 31.6% clay, 20.0% silt, and 48.4% sand and had a sandy–clayey–loamy structure. The soil’s pH was determined to be 7.6, the CaCO3 content was determined to be 9.6%, electrical conductivity (EC) was determined to be 0.9 dS m−1, and the organic matter content was determined to be 1.6%. The total amount of N was found to be poor at 0.05%, and exchangeable potassium (K) was found to be at a sufficient level at 0.074 kg m2. In addition, the available phosphorus (P) amount was determined to be 0.019 kg m2. In terms of macroelements, calcium (Ca) was determined to be very high at 2.7 mg kg−1, and magnesium (Mg) was determined to be at a medium level at 325.2 mg kg−1. The amounts of other microelements (zinc, iron, and copper) were determined to be at a medium level.
2.2. Experimental Design
The study was performed with four replicates using a randomized blocks experimental design. In the experiment, magnesium sulfate was applied to the plants three weeks after seedling planting at two-week intervals for a total of four applications, both through drip irrigation at a single dose of 0.005 kg m
2 and through foliar application at four doses of 0% (control), 0.25%, 0.5%, and 0.75%. Each treatment consisted of 60 plants (N = 60) divided into 4 replicates. Foliar fertilizer applications were performed with a charged knapsack sprayer of 16 L (HB Garden Tools Hb 16 Liters, Tarim Nalbur, Istanbul, Türkiye). All the cultural practices in the experimental area were performed according to the criteria determined by Vural et al. [
15].
At the harvest stage, samples were taken from the leaves and the fruits. Fruit and leaf samples were collected from a total of 20 plants per treatment, with four biological replicates for the evaluation of agronomic and biochemical assessments.
2.3. Yield Measurement
The average weight of tomato fruits, picked from five plants randomly selected in each treatment in the ripening period, was calculated. The data regarding yield per plant and total yield were collected during the ripening period when 80% of the tomato fruits had ripened.
2.4. Determination of Chlorophyll Content
Leaf chlorophyll content was measured using a SPAD chlorophyll meter (Konica Minolta, model SPAD-502 Plus, Tokyo, Japan) after treatments on ten randomly selected plants in each replicate. SPAD readings were performed on the middle part of the leaflets of each plant.
2.5. Leaf Relative Water Content
Two mature young leaves were picked in each replicate. To measure the fresh weight (FW), the leaves were measured and weighed individually. Then, to determine the turgor weight (TW), the leaves were kept afloat in a plastic vessel. When the leaves reached a constant weight, they were dried with paper tissue and then weighed. In the final stage, to determine the dry weight (DW) of the samples, the leaves were kept in an oven at 65 °C for 48 h. To calculate the leaf’s relative water content, the following formula was used [
16]:
2.6. Fruit Quality Measurement
The color of three fruits randomly selected in each replicate was measured using a colorimeter, and the values read were identified as L*a*b. The fruit color was measured with a colorimeter (PCE-XXM 20 Colour Meter, PCE Instruments, Manchester, United Kingdom) in the color space of L (lightness), a (red-green), and b (yellow-blue). Fruit firmness was measured by a digital penetrometer (AGY-16 brand NO:400713121, Loyka, Istanbul, Türkiye) with an 11 mm tip on three fruits randomly selected from each replicate. The juices of the fruits brought to the laboratory were extracted using a juice extractor (Stor Blender Set Black & Rosie, Fakir Hausgeräte, Vaihingen an der Enz, Germany). pH measurements of the fruit juice were performed with an Adwa AD1000 model pH meter (AD1000, Adwa, Szeged, Hungary). The soluble solids content (SSC) in the fruit juice was measured with a digital refractometer (PAL-1, Atago, Tokyo, Japan) at 25 °C, and the results were expressed as percentages.
2.7. Analysis of Leaf and Fruit Nutrient Concentration
Nutrient analyses were performed using the atomic absorption spectroscopy (AAS) method. Samples were transferred to the Teflon cups of the microwave oven by weighing 0.50 g from each sample with a sensitivity of 0.001 g, and a concentrated 10 mL of Merck nitric acid at 65% was added to each sample. Additionally, 10 mL of nitric acid at 65% was added to an empty Teflon cup. The cover of the Teflon cups was firmly closed and placed in the CEM brand MARS 6 ONE TOUCH (TERRA, Ankara, Türkiye) model microwave digestion system. The temperature increased to 200 °C within 15 min, and the samples were maintained at that temperature for 15 min. The dissolution process was completed with a total of 30 min in the closed system. A calibration graph was created by diluting the AAS single-element standard. The prepared solutions were analyzed using the AAnalyst 800 Atomic Absorption Spectrometer (Bodenseewerk Perkin-Elmer GmbH, Ueberlingen, Germany), starting from the most diluted to the most concentrated solutions. Based on the calibration graph, the results of the samples, diluted to a specific amount, were reported in mg L−1.
2.8. Total Phenolic Content
The total phenolic content of the extract obtained from the sample was determined using the Folin–Ciocâlteu reagent. By modifying the method of Slinkard and Singleton [
17], the phenolic content was expressed as the gallic acid equivalent. For calibration, 50 μL of each concentration of gallic acid was added to separate Eppendorf tubes to form a calibration curve. Then, 950 μL of pure water was added to each tube. Afterward, 250 μL of 0.2 N Folin–Ciocalteu reagent was added to each 2 mL Eppendorf tube and mixed. Following a 3 min incubation at room temperature, 750 μL of the 7.5% Na
2CO
3 solution was added to complete the reaction, and the mixture was kept at room temperature for 2 h to allow the reaction to develop. For sample analysis, 50 μL of the extract was used instead of gallic acid, and the above procedure was repeated. At the end of the incubation period, the absorbance values of the samples and standards were determined using a spectrophotometer at a wavelength of 765 nm. Each sample and standard were analyzed in triplicate, and average values were used. Pure water was used as a blank, and net absorbance values were calculated by subtracting the blank absorbance from the sample absorbance. The total phenolic content of the samples was expressed as μg gallic acid equivalent (GAE) per gram of the extract [
18].
2.9. Determination of Antioxidant Activity
The antioxidant activity of the samples was measured using the DPPH and FRAP assays. In the DPPH method, the antioxidant activity of the samples was determined by modifying the method of Brand-Williams et al. [
19]. For the calibration graph of stock Trolox solution, 10.3 mg of Trolox (6-hydroxy-2,5,7,8-tetrametyl-chroman-2-carboxylic acid) and a compound of 97% purity was weighted. The Trolox obtained was dissolved in 10 mL methanol of HPLC grade and prepared as a 1000 µg mL
−1 main stock solution. For the calibration, various Trolox solution concentrations were prepared. From the main stock solution obtained, standard Trolox solutions of 2 mL were formed by the concentrations of 5 µg mL
−1, 10 µg mL
−1, 20 µg mL
−1, 30 µg mL
−1, 40 µg mL
−1, 50 µg mL
−1, 60 µg mL
−1, and 70 µg mL
−1, respectively. In order to prepare a 10
−4 M DPPH solution of 100 mL, a DPPH (Fluka) compound of 97% purity was weighted as 4.1 mg DPPH. The DPPH obtained was transferred to a volumetric flask of 100 mL, and after being dissolved in methanol of HPLC grade, the solution was formed by completing its volume to 100 mL. For calibration, 100 μL was pipetted from each of the Trolox solutions of different concentrations into different 2 mL tubes, and 900 μL of the 10
−4 M DPPH solution was added to them. For the control, 900 μL of the 10
−4 M DPPH solution was added to 100 μL of ethanol. The mixture was vortexed and then kept for 30 min in the dark and under room temperature. After the referred period, the absorbance values of 517 nm wavelength were measured using a spectrophotometer. Using the absorbance values obtained and the following equation, DPPH % radical removal rates were calculated:
Based on the DPPH % radical removal–concentration relationship, the calibration graph was obtained. Using this graph and the exact equation obtained, the total antioxidant capacity values of the samples, standards, and controls were determined as the µg Trolox equivalent (TE)/g plant. Each sample, standard, and control was analyzed in three replicates [
20].
While determining the antioxidant activity using the FRAP method, the antioxidant activity of the sample was measured using the method developed by Benzie and Strain [
21,
22]. The preparation of the solutions required for the FRAP method is as follows:
I—For the preparation of a 300 mM 1 L acetate buffer (pH = 3.6), 3.1 g sodium acetate trihydrate (C2H3NaO2.3H2O) was weighed with a precision scale and transferred to a 1 L glass volumetric flask. Then, ultrapure water was added to dilute the solution. Afterward, 16 mL of glacial acetic acid was added. The pH of the solution was checked, and if necessary, it was adjusted to 3.6 using a suitable acid or base. Finally, the volume was adjusted to 1 L with ultrapure water.
II—To prepare 15 mL of 10 mM TPTZ solution, 0.0468 g of TPTZ was accurately weighed using a precision scale and dissolved in 15 mL of 40 mM HCl.
III—For the preparation of 15 mL of 20 mM FeCl3.6H2O, 0.0811 g of FeCl3.6H2O was weighed with a precision scale and diluted with 15 mL of ultrapure water.
The FRAP reagent was formed in 250 mL of amber-colored flacon by mixing solutions I, II, and III at a rate of 10:1:1 [
21,
22].
For calibration, Trolox solutions of various concentrations were prepared. The solutions obtained from the main stock were prepared as standard Trolox solutions of 2 mL with the concentrations of 10 µg mL−1, 15 µg mL−1, 20 µg mL−1, 30 µg mL−1, 40 µg mL−1, 50 µg mL−1, and 60 µg mL−1, respectively.
In total, 100 μL of each of the Trolox standard solutions was taken into 2 mL flacons, and 900 μL of freshly prepared FRAP reagent solutions was added to them; it worked at different concentrations, with the Trolox concentration in the reagent solution as 1 µg mL
−1, 2 µg mL
−1, 3 µg mL
−1, 4 µg mL
−1, 5 µg mL
−1, and 6 µg mL
−1, respectively. In total, 100 μL of the Trolox standard was taken into sample tubes, and 900 μL of the ethanol/water (1:1,
v/
v) FRAP solvent was added to it; 100 μL of the methanol/water FRAP solvent was taken into reagent tubes, and 900 μL of the FRAP reagent solution was added to them. Into all the tubes, except the sample tubes, 900 μL of the FRAP reagent was added bit by bit in 30 s intervals, and after vortexing the reagent mixture for 1 min, the reaction was initiated. The absorbance value of the solution in the tube, which was subjected to 40 min, was measured at 593 nm using the V-650 UV/VIS spectrometer (JASCO, Tokyo, Japan) device. Each Trolox standard was analyzed three times, and they were averaged [
21,
22].
2.10. Antioxidant Enzymes Assay
For each sample, 1 g of the homogenate buffer (pH: 7.5, 0 mM K-phosphate) was mixed and homogenized with a pestle in mortar. The mixture obtained was centrifuged at 4 °C and 15.000 rpm for 60 min. By the end of centrifugation, the supernatant remaining on top was used as the enzyme solution (homogenate) [
23].
2.10.1. Catalase (CAT) Activity
For the determination of the catalase (CAT) enzyme activity of the samples, the methods specified by Aebi [
24] were implemented with some modifications. A quartz cuvette (3 mL) containing 50 mM potassium phosphate (KH
2PO
4, pH: 7.0) at 1475 μL and 30 mM H
2O
2 at 1500 μL was prepared, and 25 μL of the homogenate was added. As a blank, a mixture without the enzyme was used. The absorbance decrease at a wavelength of 240 nm was recorded using a UV-Vis spectrophotometer (Thermo Fisher Scientific, Waltham, MA, USA), and the absorbance difference after 1 min was determined. The enzyme activity was calculated in EU/mL as per the following formula.
2.10.2. Peroxidase (POD) Activity
For the determination of the peroxidase (POD) enzyme activity of the samples, the method of Şişecioğlu et al. [
25] was used. Using 100 mM of a potassium phosphate buffer (pH 6.0), 45 mM guaiacol (1 mL), 22.5 mM hydrogen peroxide (1 mL), and 50 μL of the sample homogenate, the mixture was prepared in quartz cuvettes to a final volume of 3 mL. As a blank, a mixture without the enzyme was used. By recording the absorbance increase after each minute for 3 min at a wavelength of 470 nm in a UV-Vis spectrophotometer (Thermo Scientific), the absorbance difference was determined. The enzyme activity was calculated as per the following formula.
Enzyme activity = (μmol * min−1 * mL−1)
(the amount of enzyme transforming 1 micromole substrate per minute to a product).
A = absorbance (absorbance read by the end of 1 min);
b = distance in which the light passes (1 cm);
Vt = volume of reagent sink (mL);
ε = extinction coefficient (5000 M−1 × cm−1);
Vs = sample volume (mL);
Df = dilution coefficient [
25,
26].
2.10.3. Polyphenol Oxidase (PPO) Activity
The determination of the polyphenol oxidase (PPO) enzyme activity of the samples was performed spectrophotometrically by recording the absorbance increase at a wavelength of 420 nm. The extraction buffer (phosphate buffer) used to obtain the crude extract was employed as the buffer solution, while a 0.1 M catechol (1,2-Dihydroxybenzene) solution was used as the substrate solution in enzymatic oxidation studies. To prepare the blank, a 2400 μL buffer solution and 600 μL substrate solution were placed in a 3-milliliter cuvette. For the sample measurement, 2350 μL of the buffer solution, 600 μL of the substrate solution, and 50 μL of the crude extract solution were placed in another cuvette. Absorbance measurements were recorded in a spectrophotometer every 15 s for 1 min at a wavelength of 420 nm.
(Sigma Quality Control Test Procedure, Enzymatic Assay of Tyrosinase (EC 1.14. 18. 1)).
2.10.4. Superoxide Dismutase (SOD) Activity
For the determination of the superoxide dismutase (SOD) enzyme activity of the samples, specified methods [
27] were implemented by making some modifications. A reagent mixture was formed by taking 0.3 mmol L
−1 of a xanthine stock solution at 52 mL (prepared with 400 mmol L
−1 Na
2CO
3), 0.6 mmol L
−1 EDTA at 20 mL, 150 μmol L
−1 NBT at 20 mL, and 1 g L
−1 BSA at 6 mL, and after taking 245 μL from this reagent mixture, 10 μL of the homogenate and 40 μL of distilled water were added to it. Then, 5 μL of a 0.167 EU mL
−1 xanthine oxidase enzyme solution, diluted by a cold/iced 2 mol L
−1 (NH
4)
2SO
4 solution, was added. After being incubated in a water bath for 25 min at room temperature at 25 °C, and after adding 100 μL of 0.8 mmol L
−1 CuCl
2 to it, the reaction was stopped. A reagent mixture was used as a blank. A cuvette without a homogenate was used as a control. Following the stoppage of the reaction, the absorbance values were read at 560 nm on a Multiskan GO (Thermo Fisher Scientific, Waltham, MA, USA) device. The enzyme activity was calculated as per the following formula.
2.11. Total Protein Analysis
Total protein analysis was performed by the Kjeldahl method [
28]. About 1 g was weighed from the homogenized sample. In total, 10 g of catalyzer (salt) was added to the sample prepared. In total, 25 mL of concentrated H
2SO
4 was added slowly in the tubes. The Kjeldahl volumetric flask prepared was placed in the burning set. A blind trial was prepared by placing 10 g of burning salt, 25 mL of concentrated H
2SO
4, and glass beads in another Kjeldahl volumetric flask, and this was placed in the burning set. The samples were burned for 15 min at 200–250 °C and then for 45–60 min at 350–400 °C until no black dot remained. The color was black or dark brown in the beginning but became lighter during the burning process. When the samples were light blue-green or yellowish-green, the burning process was maintained for at least 20–30 min. Then, the burning process was finalized. Wet burning tubes were cooled down to room temperature. The samples were inserted in the UDK 139 semi-automatic distillation device (VELP Scientifica Srl, Usmate, Italy). As a result of the distillation, titration was performed with HCl of 0.2N.
2.12. Organic Acid Content
The organic acid content of the samples was performed by the LC-HRMS (Thermo Fisher Scientific, Waltham, MA, USA) device. In order to make the tomato samples homogenous, they were activated in an ultrasonic bath for 10 min. Then, they were agitated in an orbital agitator for 30 min at 200 rpm. From there, a 25 g tomato sample was weighed into a 50 mL flacon. Afterwards, 25 mL of HPLC-grade methanol was added to it. The mixture, after being activated in an ultrasonic bath for 20 min, was agitated in an orbital agitator for 2 h at 200 rpm. By the end of the referred period, it was centrifuged for 10 min at 4.500 rpm. The supernatant was filtered through a 0.22-micrometer filter using a 25 mm diameter PTFE syringe and stored at +4 °C for preservation. Samples of ground tomato leaves were weighed at 1 g into a 15 mL flacon. Afterwards, 10 mL of HPLC-grade methanol was added to it. The mixture, after being activated in an ultrasonic bath for 20 min, was agitated in an orbital agitator for 2 h at 200 rpm. By the end of the referred period, it was centrifuged for 10 min at 4.500 rpm. The liquid part was filtered through the ordinary filter paper and then passed through a 0.22-micrometer filter with a 25 mm diameter PTFE syringe. In total, 100 µL of the filtrate was taken into a 1.5 mL vial, and a 900 µL water mixture, including 10% methanol and 0.5% acetic acid, was added to it; then, the vial was well agitated by vortex and injected into the device.
2.13. Statistical Analysis
The data obtained as a result of the experiment were subjected to variance analysis using the JUMP statistical software (8 for Windows) package. The differences among the treatments were determined by Tukey’s multiple range test (p < 0.05).
4. Discussion
Mg has vital importance for various physiological and metabolic processes of fruits and vegetables within horticultural crops, and it is an essential macronutrient affecting yield and fruit quality [
29]. In the present study, despite the higher yields (plant yield and total yield) obtained by the 0.25% and 0.50% Mg applications, no significant statistical differences were found among the applications (
Table 1). Quddus et al. [
12] revealed that the tomato plant significantly benefits from Mg applications. In El-Metwaly and Mansour’s [
30] two-year study on potatoes, it was stated that the foliar application of MgSO
4 along with calcium chloride increased the tuber yield by 42%. Jin et al. [
3] reported that the foliar application of 1% magnesium sulfate increased the yield of tomato plants. Similarly, Alrashidi et al. [
31] specified that the foliar application of magnesium increased the yield in tomatoes. The results obtained in the present study differ from those obtained in other works. The differences between our findings and those reported in the literature can be attributed to variations in cultivars, experimental conditions, climate, soil type, and the dose and method of the applied magnesium fertilizer. Indeed, the Mg concentrations in the soil and the plant are affected by a wide range of internal and external factors such as edaphic factors (soil type, pH, countercations, humidity, ventilation, etc.), environmental conditions (temperature, light, etc.), genotype, heterogeneous growth conditions, and anthropogenic effects (fertilization and other cultural practices) [
29].
In the present study, Mg fertilizer applications increased the average fruit weight. Specifically, a 0.50% Mg application resulted in a 26% increase in the average fruit weight. Studies have reported that Mg applications through the soil or the leaf, either alone or in combination with calcium, increase the average fruit weight [
9,
32]. Saleem et al. [
32] reported a 1.63% increase in fruit weight with a 0.4% foliar Mg application. Similarly, Kasinath et al. [
9] reported a 28% increase in fruit weight with RDF (the recommended dose of fertilizer) + 50 kg Mg ha
−1 magnesium sulfate.
Along with a decrease in plants’ chlorophyll content, their color, taste, and nutritional value can be negatively affected [
33,
34,
35]. In the present study, the chlorophyll content increased with Mg applications (
Figure 1). This effect was also positively reflected on the fruit color. Tian et al. [
36] stated that Mg fertilization increased the fruit color in apples. Similarly, Liu et al. [
37] specified that the magnesium application improved the fruit color in oranges (
Citrus sinensis Osb.). These findings are consistent with the results obtained by the present study.
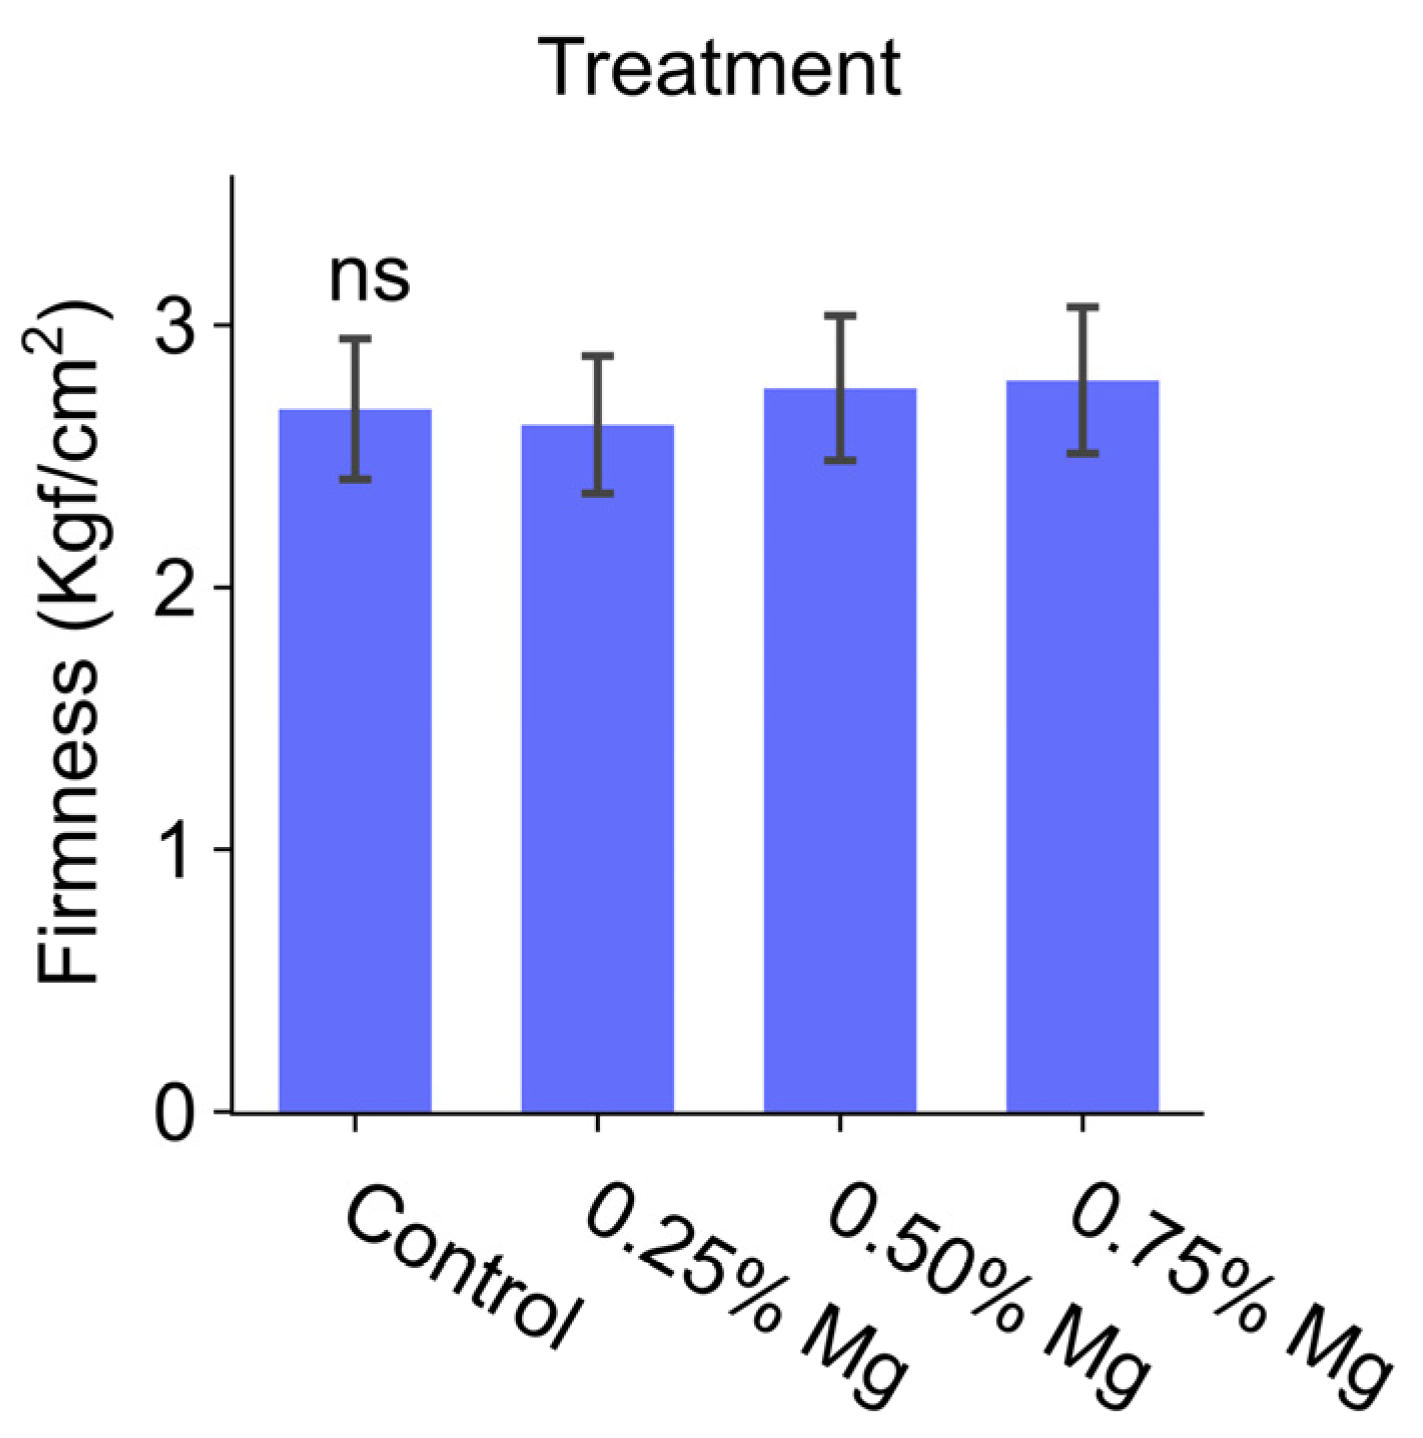
The effect of the applications on the fruit firmness was insignificant. Mg applications did not cause a significant difference in the tomato’s fruit firmness compared to the control (
Figure 2). In previous studies, different results were obtained regarding the effect of Mg on fruit firmness. Quddus et al. [
12] revealed that Mg applications preserved for a longer period fruit firmness in tomato plants. The researchers asserted that this status arises from the effect of Mg on the cell wall’s composition. Noè et al. [
38] stated that Mg fertilization increased fruit firmness in the “Golden Delicious” apple cultivar. In addition, the same researchers specified that the soil’s Mg content exceeded the soil’s K content despite the frequent observation of a Mg deficiency at the testing ground. For this reason, they specified that the increase observed in the firmness values by the Mg application might have been a secondary effect not directly related to Mg. According to the findings obtained by the present study, the lack of Mg’s effect on the firmness of tomatoes does not comply with the information reported in the literature.
In the present study, variable results were obtained regarding the effect of Mg applications on pH. While the 0.25% Mg application increased the pH, the 0.50% Mg and 0.75% Mg applications decreased the pH compared to the control (
Table 4). The pH of tomatoes varies in the range of about 4.0 and 4.7 depending on factors such as cultivar and ripeness [
39]. In general, the pH of the tomato juice, to which acid is not added, is in the range of 4.1 and 4.35, and it is very close to the pH of a non-acid food product [
40]. In the present study, 0.50% and 0.75% Mg applications positively affected the pH values of the fruit juice. While the pH was 4.84 in the control application, it was determined to be 4.81 and 4.79, respectively, in the 0.50% Mg and 0.75% Mg applications (
Table 4). In the studies performed by Mg fertilization, the pH values of the fruit juice varied. For instance, Quddus et al. [
12], in their study on Mg applications on tomato plants applied through the soil for a two-year period, found out that the pH increased in the second year while it decreased in the first year. Winsor and Davies [
41] specified that Mg fertilization on tomatoes applied through the soil did not affect the pH value of fruit juice. Similarly, Ram and Bose [
42], in their study performed on citrus, reported that the foliar application of MgSO
4 did not affect the pH value of fruit juice.
In terms of Brix values, the effect of the applications was found to be insignificant. Von Bennewitz et al. [
43] reported that the MgSO
4 applied on the apple through the soil did not affect the Brix values. Similarly, Ram and Bose [
42] specified that the foliar application of MgSO
4 on citrus did not affect water-soluble Brix values. In addition, Serrano et al. [
44] specified that the foliar application of Mg on peaches and nectarines decreased water-soluble solids. These results are consistent with the findings obtained in the present study. However, Chapagain and Wiesman [
8] stated that the MgCl
2 applied as a substrate on tomato increased soluble solids. Quddus et al. [
12] reported that the Brix value of tomato increased with Mg application through the soil. These results differ from the findings obtained in the present study. This difference might arise from the source of applied Mg, the application dose and time, and the cultivar used. Therefore, as Mg is a mobile element, its effectiveness in soil and plant tissues can vary.
In chlorophyll synthesis, the most significant element is the Mg element. Magnesium is the building block of chlorophyll, and it is directly effective in the actualization of photosynthesis [
45]. The role of Mg in photosynthesis is versatile, and its presence significantly and directly affects plant yield [
46]. Mg ions in the chlorophyll molecule play a vital role in the transfer of energy to plants by catching the photons [
47,
48]. Our results are in conformity with the basics provided in the literature regarding the effect of Mg on the chlorophyll content. Through Mg applications, the tomato’s chlorophyll content showed an increase. Similar results were also obtained from the studies performed by different researchers. Quddus et al. [
12] stated that the Mg applied through the soil increased the chlorophyll content (SPAD) of the tomato plant. In addition, Jin et al. [
3] stated that the Mg applied to the tomato plant through the soil or the leaf increased the chlorophyll content.
In the present study, the leaf’s relative water content decreased in the 0.25% Mg and 0.50% Mg applications (
Table 2). The decrease in the water content in the leaves might have arisen from the decrease in turgor in the cell. Hence, the turgor status in the plants is related to the presence of water within the cell. In the 0.25% Mg and 0.50% Mg applications, the lowness of the LRWC values indicated a decrease in turgor pressure. However, interestingly, the exact opposite status occurred in the 0.75% Mg application. This status might have arisen from the difference in Mg concentrations in randomly taken samples. Hence, the Mg concentrations in the leaves may vary in time because Mg is a very mobile element within the plant [
29].
The presence of high levels of potassium (K) in the soil can interfere with the uptake of magnesium (Mg) by tomato plants. Mg exhibits antagonistic interactions with K, NH
4, Ca, and Na [
49]. Consequently, the foliar application of magnesium can enhance its absorption and accumulation in tomato leaves. In the present study, Mg applications led to an increased leaf Mg content (
Table 5). Although Mg applications did not affect the K and Mg contents of the fruits, they did reduce the Ca and Na contents compared to the control. Previous studies have reported that both soil and foliar applications of Mg positively influence magnesium uptake in tomatoes [
3,
12]. Therefore, the foliar spraying of Mg can help alleviate magnesium deficiency in tomato plants.
Tomato’s total phenolic content and antioxidant compounds are affected by the cultivar, growing conditions, and harvest time. There is limited information regarding the effect of different fertilizer forms on tomatoes’ total phenol content and antioxidant compounds. Especially, there are no data regarding the effect of foliar spraying of Mg on tomato plants’ total phenol content and antioxidant compounds. Our results indicate that the tomato fruits’ total phenol content was not affected by Mg applications, and on the contrary, it was found to be lower compared to the control. Similarly, the fruits’ antioxidant content was also not affected by Mg applications. In a previous study, it was reported that Mg fertilization on potting soil did not affect the total phenol content in tomatoes [
50]. These results tally with the information reported in the literature.
Mg has a vital role in the activation of numerous enzymes. For that reason, it plays a role in many physiological and biochemical processes affecting plant growth [
51]. Our results revealed that Mg applications did not cause significant differences in CAT, POD, PPO, and SOD enzyme activity. This status might have arisen from the fact that the Mg applications increased the Mg content (
Table 5). Hence, in leaves with Mg deficiency, the activities of enzymes such as ascorbate peroxidase and superoxide dismutase were much higher compared to leaves sufficient in terms of Mg [
7,
52]. In the present study, Mg applications increased the leaves’ Mg content compared to the control (
Table 5). For that reason, the unaffectedness of the activity of the antioxidant enzymes might have arisen from the increase in the Mg level in the leaves. Similar results were also observed in the study performed by Shoaib and Awan [
50].
Glucose and organic acids are significant metabolites in the determination of the tomato’s fruit quality. Our results indicate that Mg applications affected the fruits’ malic acid and ascorbic acid contents. In terms of the fruits’ malic acid content, the 0.75% Mg application resulted in the best results. However, in terms of the ascorbic acid content, the 0.25% Mg application resulted in the highest results. In a previous study, it was stated that Mg deficiency in tomato and cucumber plants grown under hydroponic conditions caused organic acid to spread by leakage from the roots [
5]. Through the findings obtained in the present study, the unaffectedness of the oxalic acid, citric acid, quinic acid, and succinic acid contents and the increase in the malic acid and ascorbic acid contents of the fruits indicate that the plants were sufficiently fed by Mg through the soil and the leaf. Hence, the results of the present study indicate that Mg applications increase the leaf Mg content (
Table 5). This indicates that the plants did not suffer from Mg deficiency, and thus, the applications positively affected the fruits’ organic acid content.


