Article

Multivariate Analysis and Optimization of the Relationship between Soil Nutrients and Berry Quality of Vitis vinifera cv. Cabernet Franc Vineyards in the Eastern Foothills of the Helan Mountains, China

1
College of Enology, Northwest A&F University, No. 22 Xi’nong Road, Yangling, Xianyang 712100, China
2
School of Resources, Environment and Chemistry, Chuxiong Normal University, No. 546 Lucheng South Road, Chuxiong 675000, China
3
Grape Industry Management Committee of the Eastern Foothills of the Helan Mountains in Ningxia Autonomous Region, Yinchuan 750004, China
*
Author to whom correspondence should be addressed.
Horticulturae 2024, 10(1), 61; https://doi.org/10.3390/horticulturae10010061
Submission received: 26 November 2023 / Revised: 4 January 2024 / Accepted: 5 January 2024 / Published: 7 January 2024

Abstract

:
The aim of this study is to explore the relationship between soil nutrients and berry quality for the wine grape Vitis vinifera cv. Cabernet Franc in the eastern foothills of the Helan Mountains, and subsequently to optimize soil nutrient conditions for optimal berry quality, thus providing guidance for vineyard soil management. Based on the basic data on soil nutrients and berry quality indicators, a partial least squares regression method was used to screen for major soil nutrient factors affecting the grape quality index. Then, the selected soil nutrient factors were taken as independent variables and the corresponding grape quality indicators were taken as dependent variables and a multilinear regression equation was formulated by the method of multivariate linear regression. Finally, the optimal solution for fruit quality and soil nutrients was solved using linear programming equations. The results showed that there was a lack of total nitrogen, organic matter, nitrate nitrogen, ammonium nitrogen, and available phosphorus in the soil nutrients, and an alkaline soil. There is a significant positive correlation between some soil nutrient indices, and there is also a multivariate linearity problem. Among all berry quality indices, titratable acid, tannin, and anthocyanin were negatively correlated with eleven and ten soil indices, respectively, while other berry quality indices were positively correlated with most soil nutrient indices. The optimal parameters for grape quality were determined using the method of linear programming equations, and the corresponding soil nutrient indicators content were defined.

1. Introduction

The grapevine Vitis vinifera L. is a perennial plant that is widely distributed around the world due to its environmental adaptability and high economic value. China has a long history of grapevine cultivation and is also one of the origins of the Vitis genus, which belongs to the Vitaceae family [1]. After years of rapid development, China has become one of the world’s largest wine producers and consumers [2]. Based on different terroir characteristics, China has formed eleven wine regions with their own styles [3]. Among them, the eastern foothills of the Helan Mountains are an emerging wine region in China and is one of the most promising [4]. Benefiting from excellent terroir conditions, the use of this wine-producing region has resulted in unique, high-quality wines [5].
As one of the most important components of terroir, soil is also a major source of water and nutrients for plants [6]. Soil nutrients are diverse and complex. This is because, on the one hand, there are various types of soil nutrients and, on the other hand, there are synergistic or antagonistic effects between soil nutrients. Regardless of the intrinsic relationship between soil nutrients, they are bound to have an impact on grapevine and grape quality. Many previous studies have shown that different vineyard soil nutrients are different [7,8], and that different soil nutrients have different effects on grape plant growth and grape quality [9,10,11].
To better guide production practices, it is necessary to use quantitative research methods to determine the precise relationship between soil nutrients and grape quality. However, previous studies have mostly consisted of qualitative studies of the relationship between soil nutrients and grape quality. To the author’s knowledge, there have been few quantitative studies of the relationship between the grape quality and soil nutrients [12]. Nevertheless, there are lessons to be learned from related studies on other fruit deciduous trees. For example, Guo et al. [13] used the typical correlation analysis method to screen for the soil nutrient factors affecting the grape quality index of kiwifruit and establish a regression equation between them. Multivariate statistical analysis was used to determine the relationship between grape quality and soil nutrients in the Osbeck orchard [14]. In addition, canonical correlation analysis and linear equations were used to explore the relationship between soil nutrients and grape quality, and then the corresponding recommendations of soil nutrient content recommendations for the optimal apple quality were obtained [15]. These related research methods not only prove that there is a definite relationship between soil nutrients and grape quality, but also provide ideas for our study.
There is no doubt that there is a complex relationship between grape quality and available nutrients in the soil. Understanding how to quantify the internal relationships between them is essential to guiding viticultural practice. In light of this, six Vitis vinifera cv. Cabernet Franc vineyards in the eastern foothills of the Helan Mountains were used as experimental points in this study. Based on the measurements of grape quality and soil nutrient indices in these vineyards, multivariate statistical analysis methods were used to reveal and quantify the complex relationship between grape quality and soil nutrients in the test sites. Finally, the grape quality is optimized by linear programming equations and the corresponding soil nutrient content is obtained, which serves as a reference for soil management in local Vitis vinifera cv. Cabernet Franc vineyards.

2. Materials and Methods

2.1. Experimental Sites

In this study, 6 Vitis vinifera cv. Cabernet Franc vineyards were selected from 4 sub-regions (Shizuishan, Yinchuan, Qingtongxia, Hongsipu) in the eastern foothills of Helan Mountains during the 2021 growing season (Figure 1). Cabernet Franc vines grow from self-seeded seedlings.
The eastern foothills of the Helan Mountains in Ningxia are located between the Yellow River alluvial plain and the alluvial fan plain of Helan Mountains in Ningxia, with the Helan Mountains in the west, the upper reaches of the Yellow River in the east, and the ancient city of Yinchuan in the north, with a total area of 200 × 103 hectares. It has a continental monsoon climate with drought and light rainfall, and excellent light and heat resources. The latitude and longitude of the 6 vineyards are 37°27′33″–38°40′33″ N and 105°55′40″–106°18′40″ E (Table 1). The average elevation of the vineyards is about 1.20 × 10³ m and there are large temperature differences between day and night. The annual cumulative temperature of the area varies from 3.20 × 10³ to 3.35 × 10³ °C, with an average annual sunshine of approximately 1.50 × 10³ h and annual rainfall of 150–240 mm [16].

2.2. Sampling Methods

In each Vitis vinifera cv. Cabernet Franc vineyard of the six wineries, three sampling sites (30.0 m × 30.0 m) were randomly selected. All the vineyard soil samples were taken during the ripening period of the wine grapes, and the soil samples were collected using the S distribution method. Within a single sampling point in the same vineyard, five healthy medium-growth grapevines with medium growth were randomly selected, and each of the two grapevines was more than 5.00 m apart. Three soil collection points were randomly selected at a distance of 30.0 to 40.0 cm from the trunk of each grapevine between rows. To reduce experimental errors, the two trees at the beginning and the end of each row are avoided. A total of 15 soil collection points were selected for each sampling site. After the extraction site was identified, 0.00 to 40.0 cm of soil was drilled with an extraction drill. Plant residues and rocks were manually removed from the borehole soil, and the soil from the 15 sampling points was thoroughly mixed. Approximately 1.00 kg of soil samples were obtained by quartering. Three repetitions were performed. In the end, three soil samples of about 1.00 kg each were taken from each vineyard. The resulting soil samples were wrapped in a self-sealing bag and transported back to the laboratory in an insulated cooler. In these soil samples, a tiny part of the fresh soil (about 100 g for each replicate) was temporarily stored in a refrigerator at 4.0 °C for the determination of the nitrate nitrogen and ammonium nitrogen content, and the rest of the soil samples were stored in a cool place for natural air drying. Subsequently, additional physical and chemical indices of the soil were determined.
Based on the actual condition of each vineyard, mature clusters were collected at commercial maturity for quality analysis. Before harvesting, a professional winemaker tastes the berries to determine the best time to harvest. Harvest conditions can only be achieved when the berry has no green taste, the specific aroma of the variety is established, the flesh and seeds can be easily separated, the tannins of the skin are smooth rather than rough, and the seeds are completely ripe. When the harvest conditions were met, around the soil sampling points, fifteen healthy, disease-free, and insect-free clusters (from both sides of the canopy) were randomly harvested in the single sampling sites. So, in each vineyard, the grape sampling was repeated three times, as was the soil sampling. Finally, a total of 45 clusters of grapes were collected from each sampling site. The grape clusters were immediately packaged and stored in an insulated cooler to be brought back to the laboratory. Then, 6 grape berries from different areas of each cluster were randomly cut with tiny scissors, for a total of 270 grape berries (90 for each replicate) in each winery. These samples were rapidly stored in an ultra-low temperature refrigerator (DW-86L486, Qingdao Haier Biomedical Co., Ltd., Qingdao, China) at −80 °C for subsequent analysis of anthocyanin, flavonol and tannin. A total of 100 grape berries were randomly plucked from the cluster for each replicate to determine the berry mass. After weighing, 100 of the grapes were crushed by a finger press to extract the free-running juice for the subsequent analysis.

2.3. Determination Indices and Methods

The total nitrogen (TN) was determined using the Kjeldahl method [17]; the total phosphorus (TP) and available phosphorus contents were determined by the methods described by Zhang et al. [18]; the total potassium (TK) and available potassium (K) were measured according to Bao [19]; the soil organic matter (OM) was determined following the Walkley–Black method [20]; the nitrate nitrogen (NN) and ammonium nitrogen (AN) were determined using a continuous flow analyzer (AA3, SEAL Analytical GmbH, Norderstedt, Germany) after extraction with 2.00 M Kcl [21]. The contents of available iron (Fe), available manganese (Mn), available copper (Cu) and available zinc (Zn) in the soil were determined using a DTPA-TEA extraction and flame/graphite furnace atomic absorption spectrometer (900T AAS, PerkinElmer Inc., Waltham, MA, USA) [22]. The soil pH was determined using a pH meter (pHS-3C) with a 1.00:2.50 (w/v) soil: water suspension [18]. Three technical replicates were analyzed for each sample.
The single grape berry was weighed on a JY10002 electronic balance (Shanghai Hengping Instrument Co., Ltd., Shanghai, China); yield per plant was weighed using an ES-200 KT electronic balance (Changsha Xiangping Technology Development Co., Ltd., Changsha, China); the soluble solid content was determined using a handheld digital glycometer (PAL-1, Atago, Japan); the reducing sugar content (SSC) was determined using direct titrimetric method [23]; the titratable acid (TA) was measured using an Easyplus Titration System (Mettler Toledo, Columbus, OH, USA); the pH value was determined with a PHS-3 C pH meter (Precision Science Instruments Co., Ltd., Shanghai, China). Ten grapevines were randomly selected near the soil sampling points in each vineyard, and the total weight of the all grape clusters on each grapevine were weighed. The average value was taken as the yield per plant. Anthocyanin and flavonol from the grape skins were extracted and measured according to a previously published method [24]; extraction and determination of tannins from grape peels following Kennedy and Jones [25] with slight modifications. Briefly, skin samples of skin from 80 berries were hand-separated, dried and crushed into a fine powder. The powder samples were lyophilized in a vacuum freeze dryer (FD5-series; GOLD SIM International Group, Miami, FL, USA). Then, the dry tissues were weighed (0.05 g) and extracted in acetone/water (2.00:1.00, v/v) for 24 h with agitation. The solids were filtered through Whatman #1 filters and the acetone was removed by rotary evaporation at 38.0 °C. The residues were dissolved with 1 mL methanol, and stored at −80.0 °C to avoid light for further analysis. A Shimadzu LC-20AT HPLC system fitted with 2 Chromolith RP-18e (100 mm × 4.60 mm) columns and a photodiode array detector (Shimadzu Corporation, Kyoto, Japan). The mobile phases include phase A: glacial acetic acid/water, 1.00:99.0, v/v and phase B: glacial acetic acid/acetonitrile, 1.00:99.0, v/v. The temperature of column was 30.0 °C, and the column flow rate was 3.00 mL·min−1. The eluting gradient was as follows: 0.00–4.00 min, 3.00% B; 4.00–14.0 min, 18.0% B; and 16.0–18.0 min 3.00% B. Detection was performed at 280 nm, and the injection volume of the sample was 20.0 μL. An external standard method with (−)-epicatechin for quantitative determination of tannins. All analyses were performed in triplicate.

2.4. Method of Screening of Soil Nutrient Factors Affecting the Berry Quality and Establishing the Regression Equation

First, the partial least squares method was used to screen for soil nutrient factors affecting grape quality. This approach is a reference to Wang et al. [26]. Briefly, the partial least squares method extension module is pre-installed in the SPSS 25.0 software, including SPSS Statistics Essentials for Python, the NumPy library, and the SciPy library. Then, the original data were input, and the menu bar “Analysis → Regression → Partial Least Squares” was clicked in turn to enter the interface of partial least squares regression analysis. The default settings were maintained, and after clicking “OK”, SPSS would automatically give the analysis results. The results of the latent factor weighting were used to compute standardized regression coefficients for different soil nutrient indicators. Based on the absolute values of these regression coefficients, soil nutrient indicators with large absolute values of the regression coefficients and strong correlations with the corresponding grape quality indicators were screened. Finally, the multivariate linear regression equations were established by the “input” method for the screened soil nutrient indicators, and the significance of differences was tested. The construction of these regression equations will form the basis for the later application of linear programming equations.

2.5. Statistical Analysis of Data

First, TN, TP, TK, OM, NN, AN, available P, available K, available Cu, available Zn, available Fe, available Mn and soil pH were obtained from the soil of the six vineyards; Berry weight, yield per plant, soluble solids content, reducing sugars, titratable acidity, juice pH, tannin, anthocyanin, flavonol were measured from the ripened grape berries. Then, the raw data were then subjected to feature extraction and data normalization. Classical descriptors such as mean, minimum, maximum, coefficient of variation (CV), and standard deviation (SD) were determined by using Microsoft Office Excel 2016. At the same time, we normalized the data by the Z-score method to keep the data in the range from 0 to 1 with the same scale. The equation is as follows:
Z = x μ σ
where Z was the standard score, x was the original measurement data, μ was the mean of all values in corresponding indicator, σ was the standard deviation.
SPSS software 25.0 was used to calculate the simple Pearson correlation coefficient between soil indicators and berry indicators. The formulation of the multiple linear regression model is represented by the following equality:
Yi = β0 + β1X1 + β2X2 + β3X3 + …… + βnXn + εi
where Yi is the predicted variable (berry quality parameter), β0n are the coefficients of regression, X1~Xn are the input variables (soil nutrient indicators), and εi is the error associated with the ith observation.
Multiple linear regression analysis was performed by using SPSS 25.0, the method for variance of analysis tested by F-test, p < 0.05 or p < 0.01. To perform a valid inference from a multiple linear regression model, assumptions need to be made, such as the independent variables are independent of each other, there is no multicollinearity between the independent variables, and the error terms are normally distributed. Sample independence was checked using Durbin–Watson (DW) statistics. Variance inflation factor (VIF) values were used to test for multicollinearity among the independent variables. The residual normality distribution can be determined from normalized residual error histograms and the normal P–P plots. The SPSS software automatically provides these data and graphs for statistical hypothesis testing.
Microsoft Office Excel 2016 software was used for data statistical analysis, IBM SPSS Statistics 25.0 software (IBM, Chicago, IL, USA) was used for partial least squares regression and multiple linear regression analysis, Origin 2023 software was used for the correlation mapping, and LINGO 18.0 software was used to find the soil nutrient optimization solution.

3. Results

3.1. Soil Nutrition and Berry Quality of Vitis vinifera cv. Cabernet Franc Vineyard

3.1.1. Soil Nutrition

The analysis of soil-nutrient related indicators can provide data support for nutrient diagnostics in vineyards. The results of the statistical analysis of soil nutrients in the Vitis vinifera cv. Cabernet Franc vineyard in the eastern foothills of Helan Mountains are shown in Table 2, and the appropriate levels of soil nutrients were obtained from the data presented in the nutrient classification standard of the second soil survey in China [27]. In six vineyards, the frequency of deficiencies in TN, OM, NN, and available P in the soil was 83.3%, and the absence of AN reached 100%. Meanwhile, the proportion of soil with a TP content below 0.60 g·kg−1 was 66.7%. These data indicate that there TN, OM, NN, available P, AN and TP are deficient in the soil. The optimum frequency of TK, available K, available Cu, available Fe, and available Mn was greater than or equal to 66.7%, and the available Mn reached 100%. Nevertheless, with respect to the contents of the soil OM, NN, AN and pH value, none of the vineyards were within the optimum range. In total, 83.3% of the vineyards had an available Zn content over 1.00 mg·kg−1. Notably, all the vineyards surveyed had alkaline soils with pH values above 7.50, with the highest reaching 8.32. This means that it is necessary to lower the pH value of the soil through soil improvement to make it more suitable for grape growth and development.
The coefficients of variation (CV) for the soil nutrition indicators varied considerably (Table 2). The CV of OM and NN were particularly elevated, meaning that the contents of OM and NN varied highly from vineyard to vineyard. However, the CV of TK and soil pH are relatively low. This suggests that there is a slight difference between vineyards in the TK and soil pH.

3.1.2. Berry Quality

Descriptive statistics for the global data set of berry quality parameters for Vitis vinifera cv. Cabernet Franc are given in Table 3. From the grape quality measurements, the values of the two yield indicators, i.e., the weight and yield per plant, were 1.40 g and 3.77 kg, respectively. The others are the chemical indices. Among them, the values for the soluble solid content, reducing sugar, titratable acidity and juice pH were 27.8%, 255 g·L−1, 3.47 g·L−1 and 3.70, respectively. Tannin, anthocyanin, and flavonol belong to the flavonoids, and their average values were 23.3 g·L−1, 52.0 g·L−1 and 6.76 g·L−1, respectively. Meanwhile, there was a great difference between the vineyards regarding the indicators relating to the yield per plant and the content of titratable acidity (TA), tannin, and anthocyanin; meanwhile, the other indicators differ relatively less.

3.2. Internal Correlation of Soil Nutrients and Relationship between Berry Quality in Vineyards

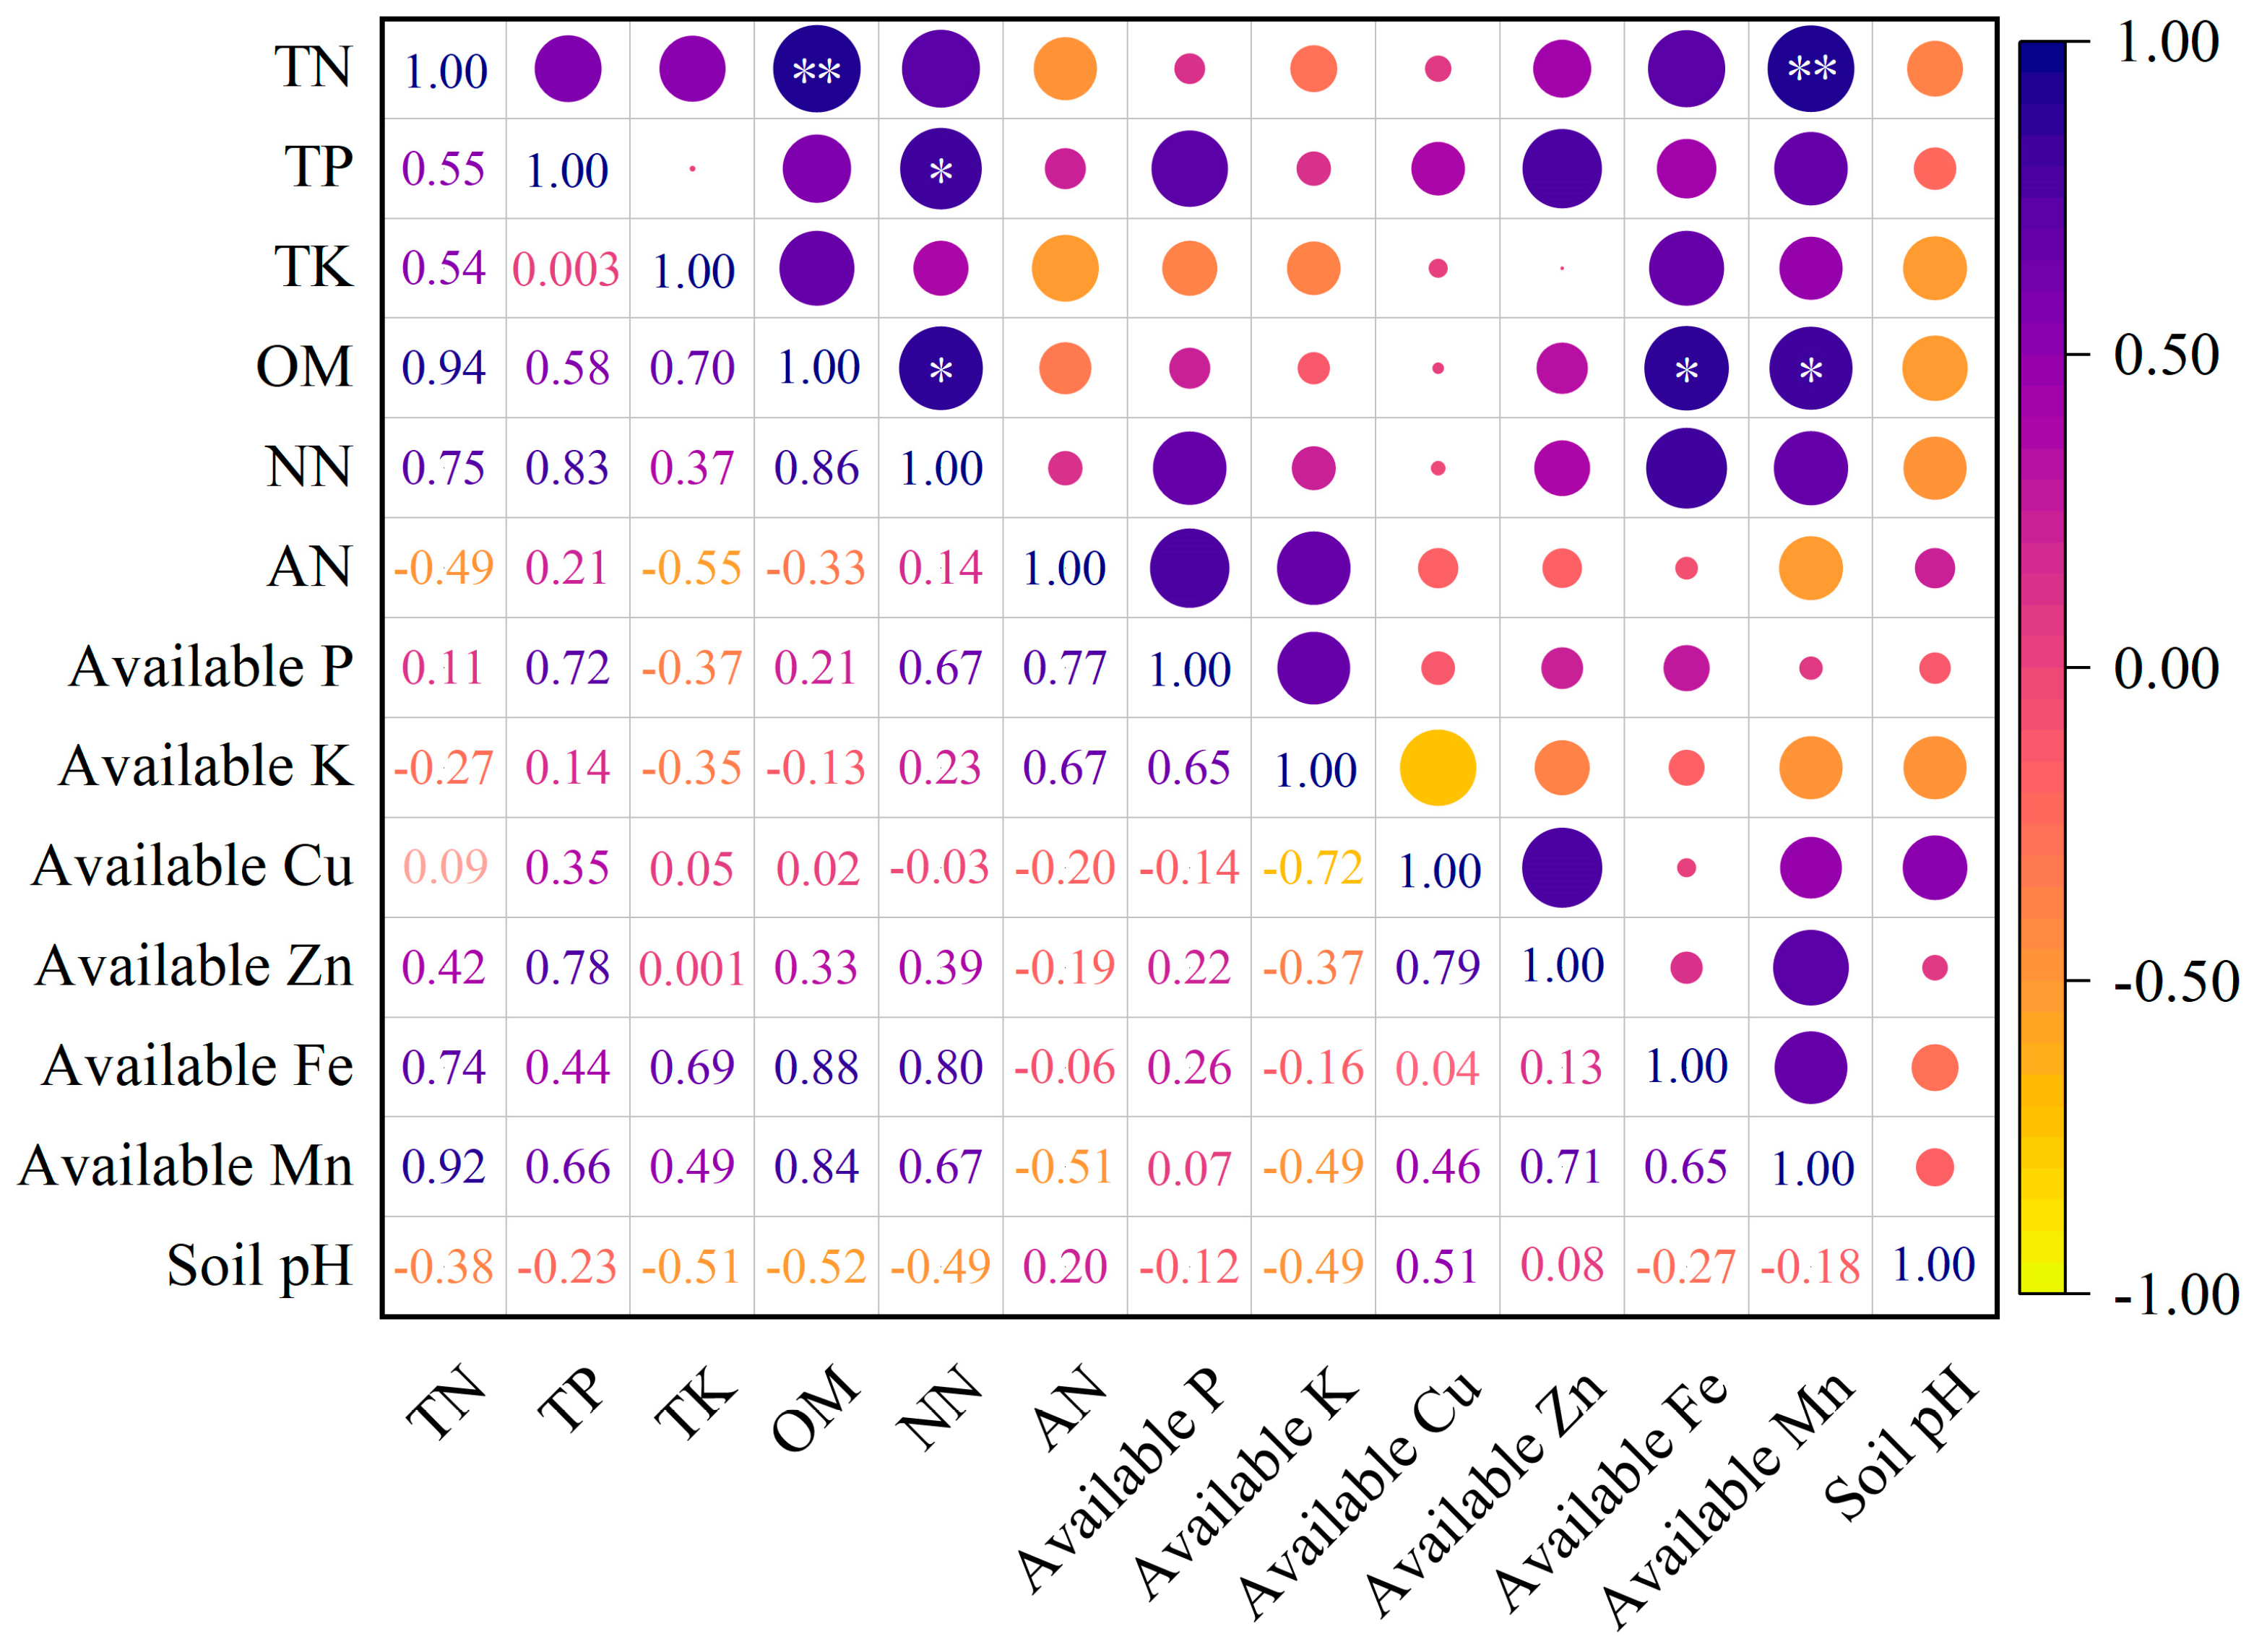
3.2.1. Correlation Coefficients among Soil Nutrients

The relationships among soil nutrients in vineyards are complex and can be synergistic or antagonistic. The correlation coefficient for soil nutrients is shown in Figure 2. It can be seen from Figure 2 that, except for AN, available K, and soil pH, the TN is positively correlated with other indices, and that the indices with relatively large correlation coefficients are OM (0.94**), NN (0.75), available Fe (0.75), and available Mn (0.92**). In addition to the soil pH, it is clear that TP is positively correlated with other soil nutrient indices, and that the correlation between TP and NN reached a significant level (0.83*). There is a significant correlation between organic matter and TN, NN, available Fe and available Mn, suggesting that increasing the amount of OM increases the content of TN, NN, available Fe and available Mn in the soil. Soil pH is negatively correlated with most soil nutrient indicators, but not to a significant level.

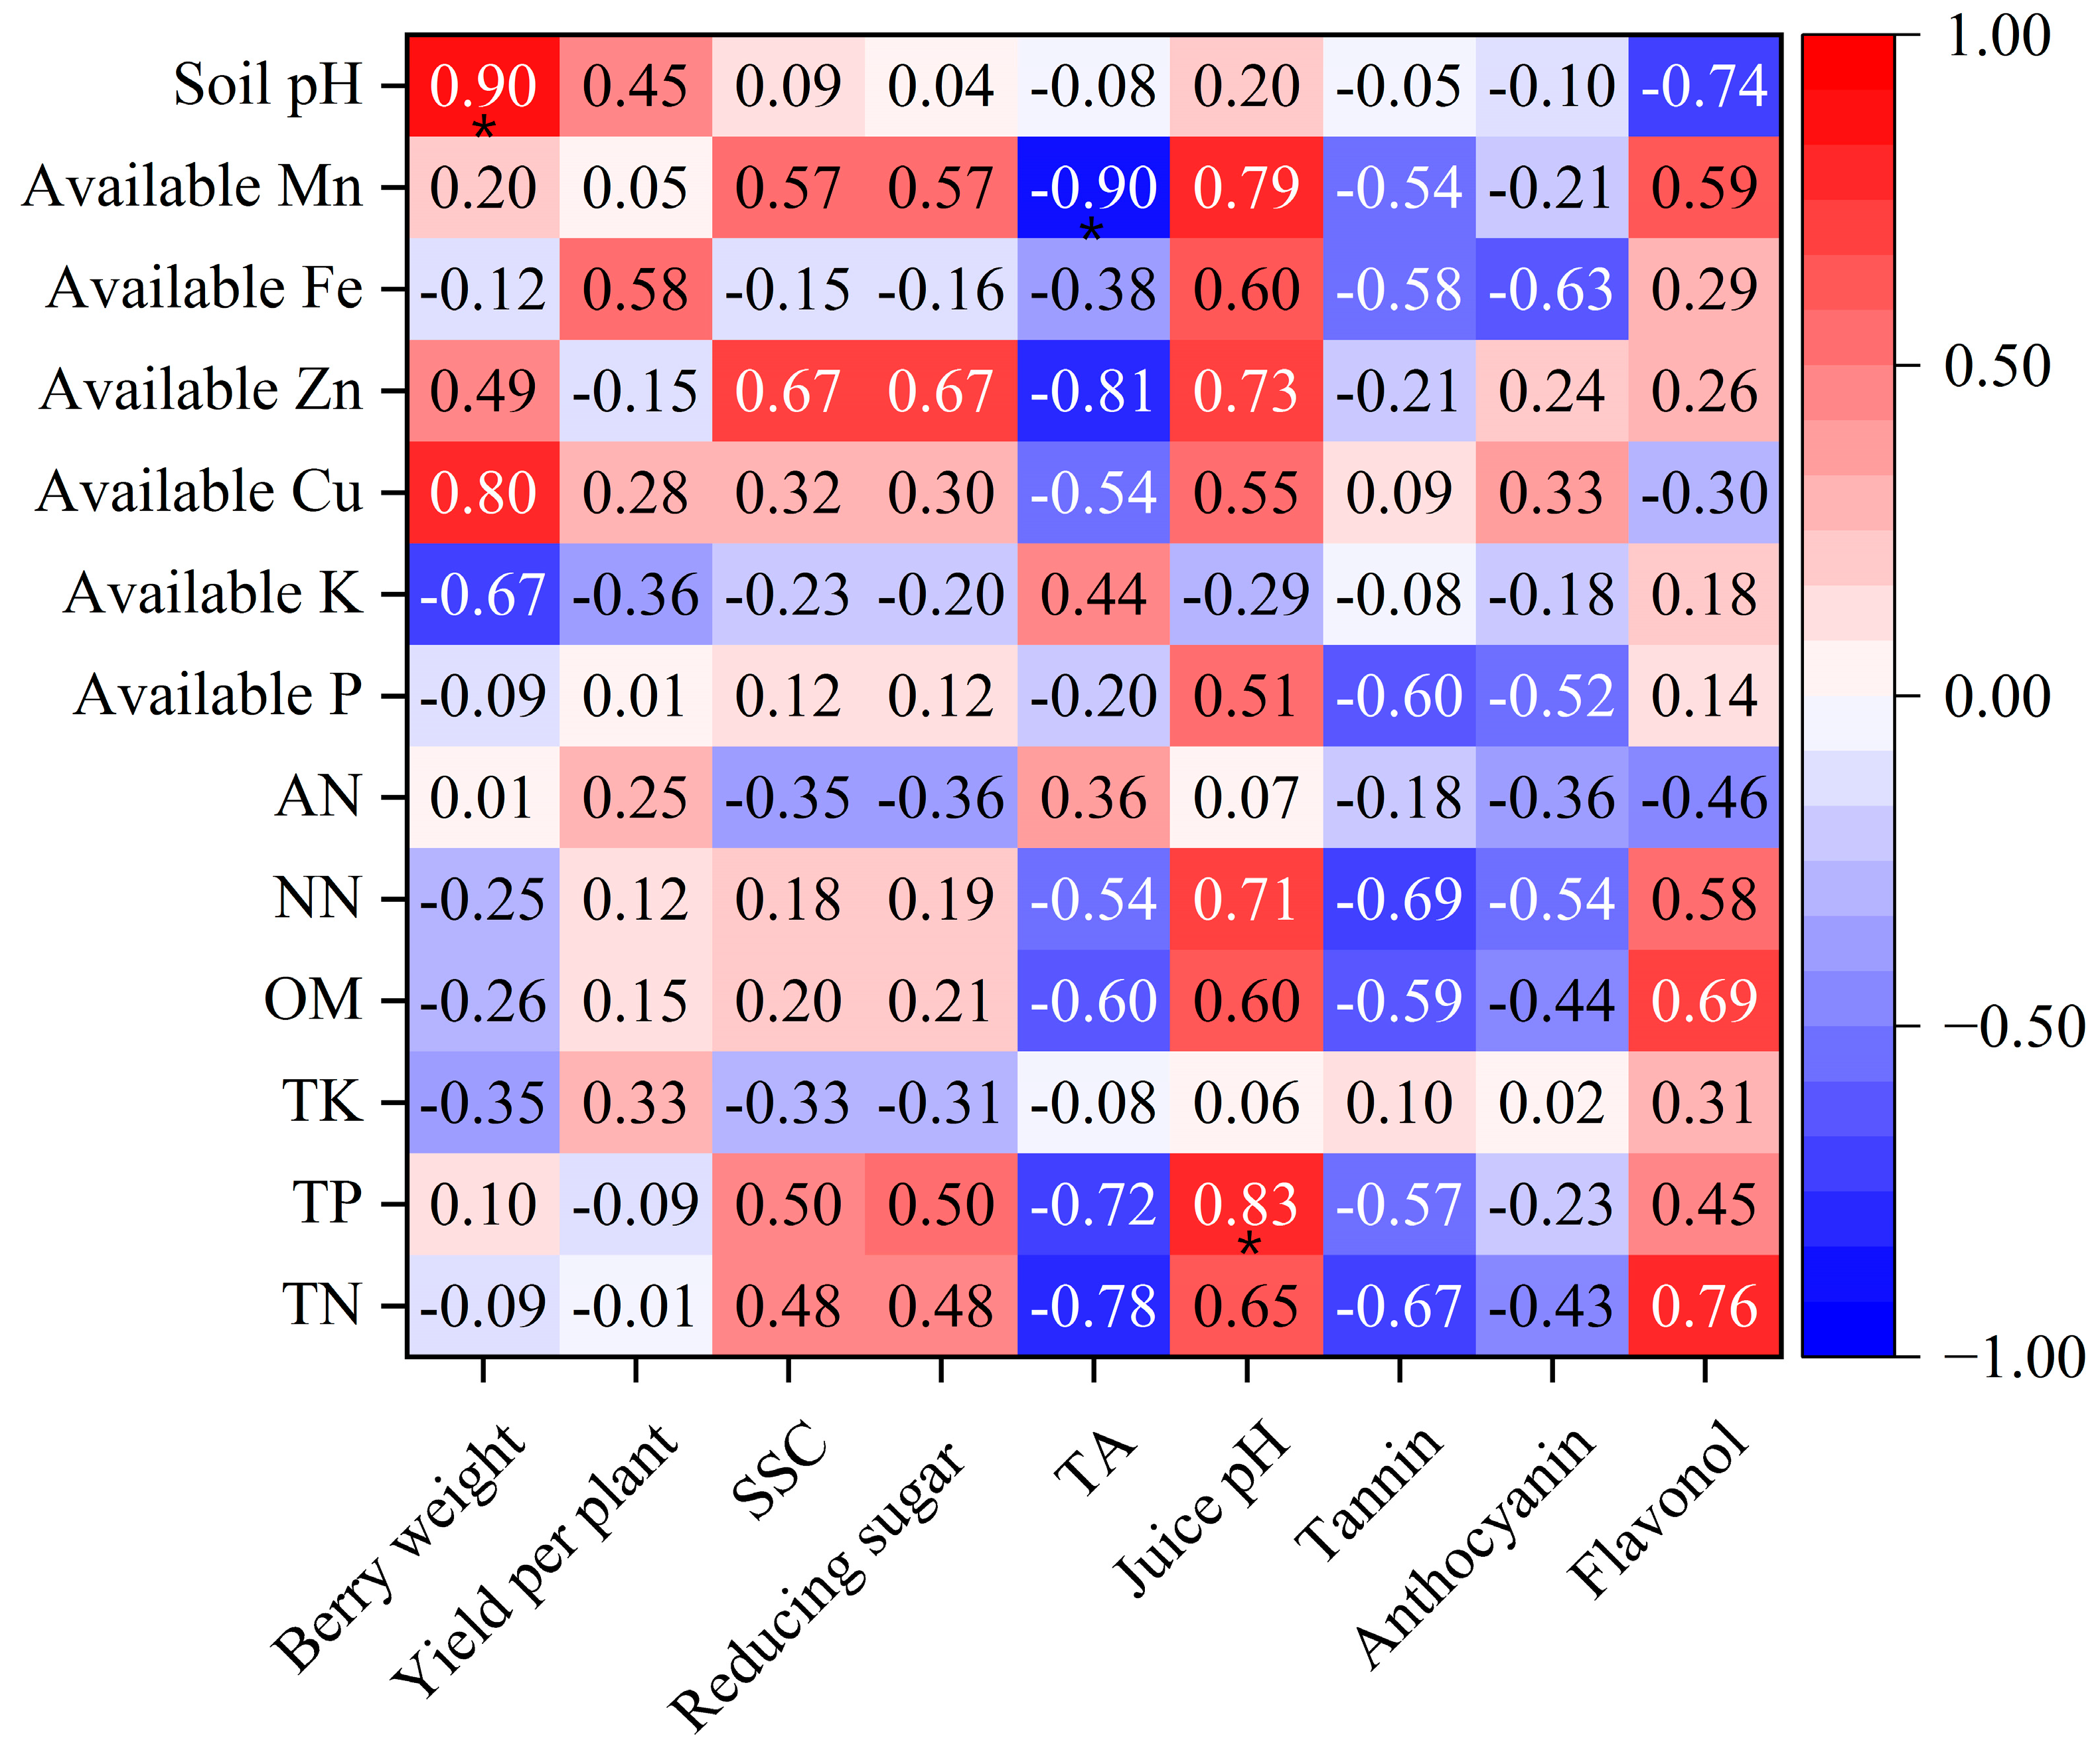
3.2.2. Correlation between Berry Quality and Soil Nutrients

Soil nutrients are an important material basis for the formation of grape quality, and the type and content of soil nutrients have a crucial effect on grape quality. The effect of different soil nutrient indices on grape quality can be revealed simply by correlation analysis. The correlation coefficients between grape quality and soil nutrients and their significance are shown in Figure 3. As a representative indicator of output, the berry weight and yield per plant showed little correlation with most soil nutrient indicators. However, there was a strong correlation between berry weight and available copper and soil pH, with a significant level of correlation with the latter. The relationship between the soluble solid content (SSC), reducing sugar and soil nutrient indices was very consistent, but the correlation was also not strong. In addition to ammonium nitrogen and available potassium, the titratable acid was negatively correlated with other soil nutrient indicators, with a significant level of correlation with available manganese. The relationship between the juice pH and soil nutrient indicators is opposite to that of titratable acid, which is positively correlated with most soil nutrient indicators, except for available potassium. Tannins, anthocyanins, and flavonols are all flavonoid substances, but there are clear differences between them and the soil nutrient indices. Tannins and anthocyanins were negatively correlated with most soil nutrient indicators, while flavonols were positively correlated with most soil nutrient indicators, but the correlation was not significant. It can be seen that there is a complex correlation between the grape quality indicators and soil nutrient indicators. Overall, the correlation between the two indicator groups is not strong. Simple bivariate correlation analysis does not fully explain the complex relationship between grape quality and soil nutrients; Therefore, in order to obtain a more in-depth and comprehensive understanding of the internal correlation between the two, it is necessary to further explore this issue using multivariate statistical analysis.

3.3. Screening for Soil Nutrient Factors Affecting Grape Quality and Establishing of the Regression Equations

Grape quality is subject to a combination of soil-nutrient related indicators and is complex and variable. Soil nutrients and grape quality in vineyards are two different indicator systems. They belong to the relation between multivariate independent variables and multivariate dependent variables. Therefore, simple correlations alone do not fully reflect the mechanism of nutrient action and a multivariate analysis is therefore necessary. In this study, there were multiple collinearity relationships among the soil nutrient indices, so it was necessary to employ the partial least squares method for analysis using IBM SPSS Statistics 25 software, combined with professional knowledge, to screen out the main soil nutrient factors that affected a certain grape quality index. Detailed methods was described in Section 2.4 above.
Then, the soil nutrient factors screened by the above method were taken as independent variables and the corresponding grape quality factors were taken as dependent variables to construct a multivariate linear regression equation. The results are shown in Table 4. A significance test of the regression equation was conducted, and the results showed that the established equation reached the level of significant difference, indicating that the established equation was stable and reliable. From Table 4, the berry weight was mainly affected by NN, the available Cu, and soil pH. The yield per plant was more affected by TN, AN, available Fe, and the soil pH. TN, TP, and OM were the main soil nutrient factors affecting SSC. TN, TK, the available Fe, and available Mn mainly affect the content of reducing sugar content. TA and the juice pH are influenced by different soil nutrient factors; the former are mainly affected by TN, TK, and the available Cu, while the latter are mainly affected by TP, the available P, and available K. All three flavonoid components are also affected by different soil nutrient factors; among these, tannin is primarily affected by TN, available K, available Zn, and the soil pH; anthocyanin are mainly affected by TP, the available P, and available Mn; and flavonol is mainly affected by TN, OM, and the soil pH.
In summary, there are six and four grape berry quality indicators affected by TN and pH, respectively. However, the two soil nutrient factors had qualitatively different effects on the included grape quality indicators. For example, from Table 4, it can be seen that TN is negatively correlated with the yield per plant, TA and tannin, but positively correlated with the SSC, reducing sugar and flavonol. The soil pH was negatively correlated with tannin and flavonol, but positively correlated with berry weight and the yield per plant. The same is true for other soil indicators. It could be seen that, for the overall quality of wine grapes, it was not the case that the soil nutrient index values were better the larger or smaller they were, but that there may be some appropriate interval (or value) that ensures the optimal overall quality of wine grapes. Of course, determining such an optimal interval (or value) requires the use of linear programming methods.

3.4. Optimization Scheme for Soil Nutrient Content in Vineyards

In order to study the suitable range of soil nutrient contents corresponding to the optimal grape quality of wine grapes, this study took the maximum (or minimum) value of a certain grape quality indicator as the objective function, and the other grape quality indices and soil nutrient factors as the constraint conditions. It then establishes the linear programming equations for determining the optimal grape quality index. In determining the optimal grape quality factor for a given wine grape, it is necessary to ensure that the other grape quality indicators are optimized simultaneously and to give a certain bound on the soil nutrient factor. The upper and lower bounds on the constrained values of the wine grape quality index in this study can be divided into two cases. It is better when the grape quality index is large, and the average value of this index is the lower limit. It is better when the grape quality index is small, and the average value of this index is the upper limit for the vineyards surveyed in this study. The constrained value of the soil nutrient factor was the maximum value for the vineyards surveyed. This was used as the upper limit, and the average value of the vineyards surveyed was used as the lower limit. The range of soil pH suitable for grape production was found to be 6.50–7.50.
Limited by the length of this paper, this study only took berry weight (Y1min) (the smaller the better) as an example in order to demonstrate the establishment and solution of the linear programming equations between the grape berry quality and soil nutrients. The specific equations are as follows.
Y1min = −4.69 + (5.58 × 10−4)X5 + (2.54 × 10−1)X9 + (7.30 × 10−1)X13 <= 1.40,
−50.2 − 6.37X1 − (2.41 × 10−1)X6 + 1.94X11 + 5.96X13 >= 3.77,
20.3 + 12.6X1 + 4.67X2 − (3.19 × 10−1)X4 >= 27.8,
316 + 37.9X1 − 4.81X3 − 8.48X11 + 3.84X12 >= 255,
1.92 − 2.93X1 + (2.82 × 10−1)X3 − 1.56X9 >= 3.47,
3.66 + (2.46 × 10−1)X2 + (3.65 × 10−2)X7 − (2.58 × 10−3)X8 <= 3.70,
560 − 42.9X1 − (2.08 × 10−1)X8 + 1.10X10− 59.6X13 >= 23.3
155 + 266X2 − 14.6X7 − 12.7X12 >= 52.0,
41.6 + 5.56X1 − (1.12 × 10−1)X4 − 4.63X13 >= 6.76,
where 0.71 ≤ X1 ≤ 1.30, 0.48 ≤ X2 ≤ 0.72, 16.47 ≤ X3 ≤ 19.0, 11.5 ≤ X4 ≤ 36.9, 41.3 ≤ X5 ≤ 104, 3.25 ≤ X6 ≤ 6.96, 6.86 ≤ X7 ≤ 11.5, 127 ≤ X8 ≤ 208, 0.65 ≤ X9 ≤ 1.11, 1.73 ≤ X10≤ 3.29, 5.67 ≤ X11 ≤ 8.61, 10.3 ≤ X12 ≤ 14.6, 6.50 ≤ X13 ≤ 7.50.
Using the same method, linear programming equations could be established to solve the maximum yield per plant (Y2max), maximum SSC (Y3max), maximum reducing sugar (Y4max), maximum TA (Y5max), minimum juice pH (Y6min), maximum tannin (Y7max), maximum anthocyanin (Y8max), and maximum flavonol (Y9max) of the grape berry quality indices. Then, with the help of LINGO 18.0 software, the optimal solution of the grape berry quality indices and the corresponding range (or value) of soil nutrient factors could be obtained. The results are presented in Table 5. As can be seen in Table 5, the last row showed the optimal value of the grape quality indicators. The last column gave the values or ranges of the soil nutrient factors corresponding to the optimal grape quality indicators conditions.
It should be noted that the linear programming solutions obtained in Table 5 are closely related to the regression equations in Table 4, specifically, the constant terms and the regression coefficients of the regression equations in Table 4. In this study, to ensure consistency between the former and the latter, the constant terms and the regression coefficients of the regression equations are retained with three significant digits on the basis of the exact values. As a result, the linear programming solutions for some of the indicators in Table 5 differ from the exact values. For example, the values of yield per plant (Y2), soluble solids content (Y3), titratable acid (Y5), juice pH (Y6), tannin (Y7), anthocyanin (Y8), TK, available K, available Fe and available Mn in Table 5 differ, but the differences are not large overall. To obtain more accurate optimization results, it is necessary to retain more accurate constant terms and regression coefficients (for example, accurate to three decimal places) for the regression equations in Table 4, and then establish linear programming equations and solve them to obtain more accurate results.

4. Discussion

From the short study above, it appears that the soil in the eastern foothills of Helan Mountains are comparatively poor, especially in the absence of TN, TP, OM, AN, NN and available P. This may have much to do with the local soil characteristics. Because the wine-grape-producing areas in the eastern foothills of Helan Mountains comprise mostly sandy loam soil and gravelly sandy soil, the soil texture is coarse and rich in gravel, the soil structure is weak, the fertilizer retention capacity is poor, and the nutrient content is lacking [28]. These findings are consistent with those reported by Wang et al. [29] and Qi et al. [5]. In addition, the vineyard soil is alkaline, which is also one of the common characteristics of the local soil [30,31,32,33]. Considering the adaptation of grape plants to a wide range of pH levels and the results of this study, it is recommended that local vineyard soil pH be reasonably intervened. Soil is a complex mixture with complex relationships among the nutrients in it; this has not only synergistic but also antagonistic effects. This complex relationship varies according to the study area and plant growth stage [34,35].
Theoretically, the nutrient content of vineyard soil and the quality of the berries are involved in a dynamic shift process. Strictly speaking, the nutrient content of the soil and the quality of berries change throughout the grape growing season. Therefore, determining when to sample in such a dynamic process can undoubtedly be a tricky issue. Fortunately, previous research provides a guide [5,36,37]. Samples were taken during the ripening period, when grape quality tends to be stable and the soil nutrients do not fluctuate much. In this study, only the internal relationship between grape quality and soil nutrients at the grape ripening stage was analyzed, and the related exploration of soil nutrient optimization was carried out. Therefore, in order to explore the relationship between soil nutrients and grape quality formation, it is necessary to evaluate evaluations from a more macroscopic and systematic perspective. Limited by current analytical methods, such a complex problem cannot be solved provisionally; therefore, this study is only a preliminary exploration and more detailed studies are still needed.
Regarding the quality of the berries, as shown by the results of this study, there is a large difference in quality between different wineries. With consistent vineyard management and slight differences in climatic conditions, the vineyard soil nutrients become a key factor affecting in grape quality. Pearson correlation analysis is a common method used to analyze the internal relationship between quality and soil nutrients [38,39]. However, considering the multivariate collinearity of soil nutrients, a more complex multivariate statistical analysis method is needed, such as canonical correlation analysis [12,40], principal component analysis [41], partial least squares regression [14], and so on. In a specific study, the methods that need to be employed must be combined with the actual situation. This method was chosen for critical soil nutrient factors that affect berry quality, as partial least squares regression can better address the problem of multilinearity.
It is important to note that there are some differences between the soil nutrient optimization results obtained through multivariate statistical analysis and the range of soil nutrient issues shown in Table 2. This is because the appropriate ranges in Table 2 are the recommended value for common crops given by the National Soil Census Office, combined with the actual soil conditions in China. Therefore, there is bound to be a difference between different crops. For the results obtained and shown in Table 5, some are numerical values and some are numerical ranges. The reason for this situation is that when solving different soil nutrient indices, the software automatically computes the corresponding independent variable values within the range of independent variables, with the aim of fulfilling the optimal quality index. During this process, the values of some independent variables are more consistent, while the values of some independent variables are somewhat different. In order to consider different berry quality indicators to achieve the optimal conditions, soil nutrient intervention needs to be close to the target value (or within the target range).
On a deeper level, it should be noted that there are numerous external factors affecting the grape quality of wine grapes, in addition to soil nutrients, but also including soil type [42], light [43], temperature [44], irrigation [45], cluster thinning [46], leaf curtain management [47], cover crop [48], and so on. Thus, it can be established that the final formation of the quality of the wine grape is the result of a combination of external influences. The content of this study is only one aspect of grape quality, and it was carried out under conditions in which differences in the external environment were small. Based on this, the best way to get a more accurate picture of the relationship between soil nutrients and grape quality is through a combination of site-specific and quantitative (increment/decrement) studies. In general terms, the results of this study were obtained only from the analysis of available field soil nutrient and grape quality data, which has certain limitations. In the next step, this research team will carry out more detailed studies and improvements in individual nutrient quantification, multi-factor interactions, quality response molecular mechanism, etc.

5. Conclusions

This study showed significant differences in soil nutrients between different Vitis vinifera cv. Cabernet Franc vineyards in the eastern foothills of Helan Mountains. In general, the soil is relatively poor, especially lacking TN, OM, NN, AN, and AP, and the soil is typically alkaline. There were both synergistic and antagonistic effects in the soil nutrient index. At the same time, there are multiple collinearity issues. There are also some differences in the berry quality of Vitis vinifera cv. Cabernet Franc corresponding to vineyards with different soil nutrient content. In terms of the Pearson correlation coefficient, it was found that titratable acids, tannins, and anthocyanins were negatively correlated with most soil nutrient indicators, while other berry quality indicators were inversely correlated. Based on the results of this study, it is feasible to use multivariate statistical analysis to screen for major soil nutrient deficiencies affecting berry quality. In addition, equations to optimize soil nutrients are expected. The results show that when the soil nutrient indicators are as follows: TN, 0.71~0.74 g·kg−1; TP, 0.67~0.72 g·kg−1; TK, 16.5~16.8 g·kg−1; OM, 11.5 g·kg−1; NN, 41.3 mg·kg−1; AN, 3.25 mg·kg−1; Available P, 6.86 mg·kg−1; Available K, 127~208 mg·kg−1; Available Cu, 0.65 mg·kg−1; Available Zn, 3.29 mg·kg−1; Available Fe, 7.49~7.64 mg·kg−1; Available Mn, 14.3~14.6 mg·kg−1; Soil pH, 7.46~7.50, the grape quality indicators can reach the optimal value.: berry weight, 0.95 g; Yield per plant, 4.04 kg; SSC, 29.4 °Brix; Reducing sugar, 256 g·L−1; TA, 3.54 g·L−1; Juice pH, 3.45; Tannin, 62.6 mg·g−1; Anthocyanin. 64.6 mg·g−1; Flavonol, 9.72 mg·g−1.

Author Contributions

Conceptualization, Y.L. and X.L.; Software, Y.L. and Y.Y.; Formal analysis, L.N. and C.X.; Investigation, J.X. and Y.Y.; Resources, W.L. and P.C.; Data curation, J.X. and Y.L.; Writing—original draft preparation, Y.L.; Writing—review and editing, Y.L. and X.L.; Visualization, Y.L. and W.L.; Supervision, J.X.; Project administration, X.L.; Funding acquisition, X.L. All authors have read and agreed to the published version of the manuscript.

Funding

This research was funded by the Ningxia Autonomous Region key research and development project (2021BEF02017, 2022BBF02014), Shaanxi Province key research and development plan project (2022NY-118), and the major science and technology project of Shaanxi Agricultural Collaborative Innovation and Promotion Alliance (LMZD202105).

Institutional Review Board Statement

Not applicable.

Informed Consent Statement

Not applicable.

Data Availability Statement

Upon request, the data will be provided.

Conflicts of Interest

The authors declare no conflicts of interest.

References

  1. Ding, Q.; Zhang, X.Y.; Li, Q.; Sha, H.M.; Qiao, Y.F.; Hu, Z.H. The best fruit loads for the cold resistance of wine grape (Vitis Vinifera L.) in the eastern foothills of Helan Mountain, China. Bangl. J. Bot. 2022, 51, 263–270. [Google Scholar] [CrossRef]
  2. Yang, C.L.; Song, R.; Ding, Y.T.; Zhang, L.; Wang, H.; Li, H. Review on legal supervision system of the Chinese wine industry. Horticulturae 2022, 8, 432. [Google Scholar] [CrossRef]
  3. Li, H.; Wang, H. Overview of Wine in China; Science Press: Beijing, China, 2020. [Google Scholar]
  4. Wang, L.; Liu, J.M.; Wang, L.E.; Zhu, H.; Lin, J. Tourism resource assessment and spatial analysis of wine tourism development: A case study of the eastern foothills of China’s Helan Mountains. J. Mt. Sci. 2018, 15, 645–656. [Google Scholar] [CrossRef]
  5. Qi, Y.; Wang, R.; Qin, Q.; Sun, Q. Soil affected the variations in grape and wine properties along the eastern foot of Helan Mountain, China. Acta Agric. Scand. Sect. B-Soil Plant Sci. 2019, 69, 494–502. [Google Scholar] [CrossRef]
  6. Van Leeuwen, C.; Roby, J.P.; De Resseguier, L. Soil-related terroir factors: A review. Oeno One 2018, 52, 173–188. [Google Scholar] [CrossRef]
  7. Unamunzaga, O.; Besga, G.; Castellón, A.; Usón, M.A.; Chéry, P.; Gallejones, P.; Aizpurua, A. Spatial and vertical analysis of soil properties in a Mediterranean vineyard soil. Soil Use Manag. 2014, 30, 285–296. [Google Scholar] [CrossRef]
  8. Jiang, T.T.; Yan, P.K.; Ma, T.H.; Wang, R. Nutritional requirements and precise fertilization of wine grapes in the eastern foothills of Helan Mountain. Int. J. Agric. Biol. Eng. 2022, 15, 147–153. [Google Scholar] [CrossRef]
  9. De Santis, D.; Frangipane, M.T.; Brunori, E.; Cirigliano, P.; Biasi, R. Biochemical markers for oenological potentiality in a grapevine aromatic variety under different soil types. Am. J. Enol. Vitic. 2016, 68, 15123. [Google Scholar]
  10. Pérez-Álvarez, E.P.; Martínez-Vidaurre, J.M.; Garde-Cerdán, T. Anthocyanin composition of grapes from three different soil types in cv. Tempranillo A.O.C. Rioja vineyards. J. Sci. Food Agric. 2019, 99, 4833–4841. [Google Scholar]
  11. Zhu, Q.; Xie, X.; Xu, Y. Fertilization regulates grape yield and quality in by altering soil nutrients and the microbial community. Sustainability 2022, 14, 10857. [Google Scholar] [CrossRef]
  12. Arnó, J.; Rosell, J.R.; Blanco, R.; Ramos, M.C.; Martínez-Casasnovas, J.A. Spatial variability in grape yield and quality influenced by soil and crop nutrition characteristics. Precis. Agric. 2012, 13, 393–410. [Google Scholar] [CrossRef]
  13. Guo, K.B.; Guo, Z.; Guo, Y.; Qiao, G. The effects of soil nutrient on fruit quality of ‘Hayward’ kiwifruit (Actinidia chinensis) in Northwest China. Eur. J. Hortic. Sci. 2020, 85, 471–476. [Google Scholar] [CrossRef]
  14. Cao, S.; Zhou, W.; Liu, P.; Tan, J.; Song, B. Multivariate analysis and optimization of relationship between soil nutrients and fruit quality in C. sinensis (L.) osbeck orchard. Soils 2021, 53, 97–104. [Google Scholar]
  15. Zhang, Q.; Wei, Q.P.; Liu, H.P.; Jiang, R.S.; Liu, X.D.; Wang, X.W. Multivariate analysis and optimum proposals of the relationship between soil nutrients and fruit qualities in apple orchard. Sci. Agric. Sin. 2011, 44, 1654–1661. [Google Scholar]
  16. Ren, Y.Z. ‘Terroir’ of Wine Region at Eastern Foothills of Helan Mountain Based on Soil and Climate Property; Northwest A&F University: Xianyang, China, 2021. [Google Scholar]
  17. Bremner, J.M.; Mulvaney, C.S. Nitrogen total. In Methods of Soil Analysis. Part 2. Chemical and Microbiological Properties; Page, A.L., Miller, R.H., Keeney, D.R., Eds.; ASA-SSSA: Madison, WI, USA, 1982. [Google Scholar]
  18. Zhang, M.; Dong, L.G.; Wang, Y.; Bai, X.X.; Ma, Z.T.; Yu, X.; Zhao, Z. The response of soil microbial communities to soil erodibility depends on the plant and soil properties in semiarid regions. Land Degrad. Dev. 2021, 32, 3180–3193. [Google Scholar] [CrossRef]
  19. Bao, S.D. Agrochemical Analysis of Soil, 3rd ed.; China Agricultural Publishing: Beijing, China, 2000. [Google Scholar]
  20. Walkley, A.; Black, I.A. An examination of the Degtjareff method for determining soil organic matter, and a proposed modification of the chromic acid titration method. Soil Sci. 1934, 37, 29–38. [Google Scholar] [CrossRef]
  21. Zhang, C.; Liu, G.B.; Xue, S.; Wang, G.L. Soil bacterial community dynamics reflect changes in plant community and soil properties during the secondary succession of abandoned farmland in the Loess Plateau. Soil Biol. Biochem. 2016, 97, 40–49. [Google Scholar] [CrossRef]
  22. Lindsay, W.L.; Norvell, W.A. Development of a DTPA soil test for Zn, Fe, Mn and Cu. Soil Sci. Soc. Am. J. 1978, 42, 421–428. [Google Scholar] [CrossRef]
  23. Wang, H. Wine Analysis and Inspection; China Agricultural Publishing: Beijing, China, 2011. [Google Scholar]
  24. Downey, M.O.; Rochfort, S. Simultaneous separation by reversed-phase high-performance liquid chromatography and mass spectral identification of anthocyanins and flavonols in Shiraz grape skin. J. Chromatogr. A 2008, 1201, 43–47. [Google Scholar] [CrossRef]
  25. Kennedy, J.A.; Jones, G.P. Analysis of proanthocyanidin cleavage products following acid-catalysis in the presence of excess phloroglucinol. J. Agric. Food Chem. 2001, 49, 1740–1746. [Google Scholar] [CrossRef]
  26. Wang, G.H.; Zhang, H.; Wei, Y.S. Implementation of partial least squares regression in SPSS software. Stat. Decis. 2017, 7, 67–71. [Google Scholar]
  27. National Soil Census Office. Soil Census Technology in China; Agriculture Press: Beijing, China, 1992.
  28. Zhang, X.J.; Wu, X.D.; Guo, J.; Sun, Q.; Wang, R.; Wang, Z.P.; Si, H.L. Effect of potassium application rate on wine grape in eastern foot of Helan Mountain. Acta Agric. Boreali-Occident. Sin. 2013, 22, 144–150. [Google Scholar]
  29. Wang, R.; Sun, Q.; Chang, Q. Soil types effect on grape and wine composition in Helan Mountain Area of Ningxia. PLoS ONE 2015, 10, e0116690. [Google Scholar] [CrossRef] [PubMed]
  30. Wei, C.F.; Liu, S.T.; Li, Q.; He, J.; Sun, Z.J.; Pan, X.Y. Diversity analysis of vineyards soil bacterial community in different planting years at eastern foot of Helan Mountain, Ningxia. Rhizosphere 2023, 25, 100650. [Google Scholar] [CrossRef]
  31. Ma, T.H.; Hui, Y.R.; Zhang, L.; Su, B.F.; Wang, R. Foliar application of chelated sugar alcohol calcium fertilizer for regulating the growth and quality of wine grapes. Int. J. Agric. Biol. Eng. 2022, 15, 153–158. [Google Scholar] [CrossRef]
  32. Li, Z.H.; Liu, B.R.; Chen, Z.F.; Mao, D.C.; Jiang, X.S. Re-vegetation Improves soil quality by decreasing soil conductivity and altering soil microbial communities: A case study of an opencast coal mine in the Helan Mountains. Front. Microbiol. 2022, 13, 833711. [Google Scholar] [CrossRef]
  33. Wu, M.Y.; Pang, D.B.; Lin, C.; Li, X.B.; Liu, L.Z.; Liu, B.; Li, J.Y.; Wang, J.F.; Ma, L.L. Chemical composition of soil organic carbon and aggregate stability along an elevation gradient in Helan Mountains, northwest China. Ecol. Indic. 2021, 131, 108228. [Google Scholar] [CrossRef]
  34. Su, B.W.; Zhao, G.X.; Dong, C. Spatiotemporal variability of soil nutrients and the responses of growth during growth stages of winter wheat in northern China. PLoS ONE 2018, 13, e0203509. [Google Scholar] [CrossRef]
  35. Yan, P.; Lin, K.R.; Yu, C.X.; Tu, X.J. Spatial variability of soil phosphorus and potassium and its influencing factors in the fragile red beds ecosystem in southern China. Pol. J. Environ. Stud. 2021, 30, 5307–5315. [Google Scholar] [CrossRef]
  36. Li, Y.; Han, M.Q.; Lin, F.; Ten, Y.; Lin, J.; Zhu, D.H.; Guo, P.; Weng, Y.B.; Chen, L.S. Soil chemical properties, ‘Guanximiyou’ pummelo leaf mineral nutrient status and fruit quality in the southern region of Fujian province, China. J. Soil Sci. Plant Nutr. 2015, 15, 615–628. [Google Scholar] [CrossRef]
  37. Michopoulos, P.; Solomou, A. Effects of conventional and organic (manure) fertilization on soil, plant tissue nutrients and berry yields in vineyards. The use of the original native soil as a control. J. Plant Nutr. 2019, 42, 2287–2298. [Google Scholar] [CrossRef]
  38. Wu, W.J.; Lin, Z.; Zhu, X.P.; Li, G.Y.; Zhang, W.J.; Chen, Y.J.; Ren, L.; Luo, S.W.; Lin, H.H.; Zhou, H.K.; et al. Improved tomato yield and quality by altering soil physicochemical properties and nitrification processes in the combined use of organic-inorganic fertilizers. Eur. J. Soil Biol. 2022, 109, 103384. [Google Scholar] [CrossRef]
  39. Takahashi, H.; Yoshida, C.; Takeda, T. Sugar composition in asparagus spears and its relationship to soil chemical properties. J. Appl. Glycosci. 2019, 66, 47–50. [Google Scholar] [CrossRef]
  40. Rekik, F.; Van Es, H.; Hernandez-Aguilera, J.N.; Gómez, M.I. Linking coffee to soil: Can soil health increase coffee cup quality in Colombia? Soil Sci. 2019, 184, 25–33. [Google Scholar] [CrossRef]
  41. Mazzei, P.; Francesca, N.; Moschetti, G.; Piccolo, A. NMR spectroscopy evaluation of direct relationship between soils and molecular composition of red wines from Aglianico grapes. Anal. Chim. Acta 2010, 673, 167–172. [Google Scholar] [CrossRef] [PubMed]
  42. Gómez-Míguez, M.J.; Gómez-Míguez, M.; Vicario, I.M.; Heredia, F.J. Assessment of colour and aroma in white wines vinifications:: Effects of grape maturity and soil type. J. Food Eng. 2007, 79, 758–764. [Google Scholar] [CrossRef]
  43. Zhou, L.F.; Yang, Y.X.; Feng, H. Colored plastic film mulching regulates light quality and sucrose mtabolism in wine grape in an arid desert oasis. J. Plant Growth Regul. 2023, 42, 7705–7714. [Google Scholar] [CrossRef]
  44. Gouot, J.C.; Smith, J.P.; Holzapfel, B.P.; Walker, A.R.; Barril, C. Grape berry flavonoids: A review of their biochemical responses to high and extreme high temperatures. J. Exp. Bot. 2019, 70, 397–423. [Google Scholar] [CrossRef]
  45. Kang, C.C.; Diverres, G.; Karkee, M.; Zhang, Q.; Keller, M. Decision-support system for precision regulated deficit irrigation management for wine grapes. Comput. Electron. Agric. 2023, 208, 107777. [Google Scholar] [CrossRef]
  46. Wang, W.; Liang, Y.Y.; Quan, G.R.; Wang, X.F.; Xi, Z.M. Thinning of cluster improves berry composition and sugar accumulation in Syrah grapes. Sci. Hortic. 2022, 297, 110966. [Google Scholar] [CrossRef]
  47. Drenjančević, M.; Jukić, V.; Zmaić, K.; Kujundžić, T.; Rastija, V. Effects of early leaf removal on grape yield, chemical characteristics, and antioxidant activity of grape variety Cabernet Sauvignon and wine from eastern Croatia. Acta Agric. Scand. Sect. B-Soil Plant Sci. 2017, 67, 705–711. [Google Scholar] [CrossRef]
  48. Xi, Z.M.; Zhang, Z.W.; Cheng, Y.F.; Li, H. The effect of vineyard cover crop on main monomeric phenols of grape berry and wine in Vitis viniferal L. cv. Cabernet Sauvignon. Agric. Sci. China 2010, 9, 440–448. [Google Scholar] [CrossRef]
Figure 1. The location of the study sites. Note: The DEM in Figure 1 is an abbreviation of Digital Elevation Model.
Horticulturae 10 00061 g001
Figure 2. Correlation coefficients among soil nutrients in Vitis vinifera cv. Cabernet Franc vineyards. Note: n = 6; ** and * indicate that the correlation reached significant levels of p < 0.01 and p < 0.05, respectively (Pearson correlation analysis), as shown in the following figure and table; TN, TP, TK, OM, NN, AN, P, K, Cu, Zn, Fe and Mn are abbreviations for total nitrogen, total phosphorus, total potassium, organic matter, nitrate nitrogen, ammonium nitrogen, phosphorus, potassium, copper, zinc, iron, and manganese, respectively.
Horticulturae 10 00061 g002
Figure 3. Correlation coefficient between grape quality parameters and soil nutrients. Note: n = 6; TN, TP, TK, OM, NN, AN, P, K, Cu, Zn, Fe, Mn, SSC, and TA are abbreviations for total nitrogen, total phosphorus, total potassium, organic matter, nitrate nitrogen, ammonium nitrogen, phosphorus, potassium, copper, zinc, iron manganese, soluble solid content, and titratable acid, respectively; * indicate that the correlation reached significant levels of p < 0.05.
Horticulturae 10 00061 g003
Table 1. Basic situation of the sample vineyards of the six representative wineries.
Sub-RegionsWineryLongitudeLatitudeAltitude (m)Slope Gradient (°)Row/within-Row Spaces (m)
ShizuishanHedong106°18′40″ E38°36′49″ N1.07 × 1031.983.24 × 1.51
YinchuanWoerfeng106°03′45″ E38°40′33″ N1.16 × 1032.113.47 × 0.82
Xinhuibin106°01′24″ E38°17′28″ N1.16 × 1032.273.53 × 0.78
QingtongxiaXige105°55′40″ E38°04′08″ N1.14 × 1033.063.01 × 1.04
HongsibuPengsheng106°04′22″ E37°27′33″ N1.37 × 1033.433.95 × 0.80
Huida106°04′49″ E37°27′56″ N1.32 × 1033.823.45 × 0.53
Table 2. Statistics of soil nutrient status in Vitis vinifera cv. Cabernet Franc vineyards.
IndicatorsRangeMean ± SDCV (%)Suitable RangeDeficiency Frequency (%)Optimum Frequency (%)Excess Frequency (%)
TN (g·kg−1)0.44~1.300.71 ± 0.3042.31.00~1.5083.316.70.00
TP (g·kg−1)0.25~0.720.48 ± 0.1735.40.60~0.8066.733.30.00
TK (g·kg−1)14.9~19.016.5 ± 1.499.0515.0~20.016.783.30.00
OM (g·kg−1)2.59~36.911.5 ± 11.510120.0~30.083.30.0016.7
NN (mg·kg−1)3.86~10441.3 ± 33.881.867.5~90.083.30.0016.7
AN (mg·kg−1)1.48~6.963.25 ± 1.9158.822.5~30.01000.000.00
Available P (mg·kg−1)3.81~11.56.86 ± 2.7540.110.0~20.083.316.70.00
Available K (mg·kg−1)80.1~208127 ± 41.032.4100~15016.766.716.7
Available Cu (mg·kg−1)0.28~1.110.65 ± 0.2640.00.20~1.000.0083.316.7
Available Zn (mg·kg−1)0.89~3.291.73 ± 0.8247.40.50~1.000.0016.783.3
Available Fe (mg·kg−1)4.39~8.615.67 ± 1.4024.74.50~10.016.783.30.00
Available Mn (mg·kg−1)7.36~14.610.3 ± 2.4624.05.00~15.00.001000.00
Soil pH7.87~8.328.09 ± 0.161.986.50~7.500.000.00100
Note: TN, TP, TK, OM, NN, AN, P, K, Cu, Zn, Fe and Mn are abbreviations for total nitrogen, total phosphorus, total potassium, organic matter, nitrate nitrogen, ammonium nitrogen, phosphorus, potassium, copper, zinc, iron and manganese, respectively. SD and CV refer to the standard deviation and coefficient of variation, respectively. The same applies in the following.
Table 3. Descriptive statistics for the overall data set of berry quality parameters for Vitis vinifera cv. Cabernet Franc.
IndicatorsRangeMean ± SDCV (%)
Berry Weight/g1.17~1.591.40 ± 0.1611.4
Yield per Plant/kg1.53~7.153.77 ± 1.8950.1
SSC/%25.8~30.227.8 ± 1.505.39
Reducing Sugar/(g·L−1)234~278255 ± 14.95.86
TA/(g·L−1)2.49~4.473.47 ± 0.8725.1
Juice pH3.49~3.853.70 ± 0.123.24
Tannin/(g·L−1)12.1~39.723.3 ± 9.4540.5
Anthocyanin/(g·L−1)32.5~80.252.0 ± 17.333.2
Flavonol/(g·L−1)5.03~7.966.76 ± 0.9313.8
Note: SSC and TA are short for soluble solids content and titratable acidity, respectively.
Table 4. Screening of soil nutrient factors affecting the berry quality and establishment of the regression equations.
IndicatorsSoil FactorsRegression EquationsF Valuep Value
Berry weight (Y1)X5, X9, X13Y1 = −4.69 + (5.58 × 10−4)X5 + (2.54 × 10−1)X9 + (7.30 × 10−1)X1330.10.03
Yield per plant (Y2)X1, X6, X11, X13Y2 = −50.2 − 6.37X1 − (2.41 × 10−1)X6 + 1.94X11 + 5.96X137.50 × 1038.66 × 10−3
SSC (Y3)X1, X2, X4Y3 = 20.3 + 12.6X1 + 4.67X2 − (3.19 × 10−1)X422.50.04
Reducing sugar (Y4)X1, X3, X11, X12Y4 = 316 + 37.9X1 − 4.81X3 − 8.48X11 + 3.84X122674.59 × 10−2
TA (Y5)X1, X3, X9Y5 = 1.92 − 2.93X1 + (2.82 × 10−1)X3 − 1.56X91099.11 × 10−3
Juice pH (Y6)X2, X7, X8Y6 = 3.66 + (2.46 × 10−1)X2 + (3.65 × 10−2)X7 − (2.58 × 10−3)X823.00.04
Tannin (Y7)X1, X8, X10, X13Y7 = 560 − 42.9X1 − (2.08 × 10−1)X8 + 1.10X10 − 59.6X138020.03
Anthocyanin (Y8)X2, X7, X12Y8 = 155.077 + 266X2 − 14.6X7 − 12.7X1240.80.02
Flavonol (Y9)X1, X4, X13Y9 = 41.6 + 5.56X1 − (1.12 × 10−1)X4 − 4.63X1333.90.03
Note: n = 6; X1: TN (g·kg−1), X2: TP (g·kg−1), X3: TK (g·kg−1), X4: OM (g·kg−1), X5: NN (mg·kg−1), X6: AN (mg·kg−1), X7: available P (mg·kg−1), X8: available K (mg·kg−1), X9: available Cu (mg·kg−1), X10: available Zn (mg·kg−1), X11: available Fe (mg·kg−1), X12: available Mn (mg·kg−1), X13: soil pH.
Table 5. The optimum values of the berry quality index and its corresponding range (or value) of soil nutrient factors.
Soil Nutrient FactorsY1 Berry Weight (g)Y2 Yield per Plant (kg)Y3 SSC (ºBrix)Y4 Reducing Sugar (g·L−1)Y5 TA (g·L−1)Y6 Juice pHY7 Tannin (mg·g−1)Y8 Anthocyanin (mg·g−1)Y9 Flavonol (mg·g−1)X Optimum Value (or Range)
TN (g·kg−1)0.710.710.740.710.710.710.710.710.710.71~0.74
TP (g·kg−1)0.690.690.720.690.690.670.690.720.690.67~0.72
TK (g·kg−1)16.516.516.716.516.716.516.516.516.516.5~16.7
OM (g·kg−1)11.511.511.511.511.511.511.511.511.511.5
NN (mg·kg−1)41.341.341.341.341.341.341.341.341.341.3
AN (mg·kg−1)3.253.253.253.253.253.253.253.253.253.25
Available P (mg·kg−1)6.866.866.866.866.866.866.866.866.866.86
Available K (mg·kg−1)147147150147147208147150147147~208
Available Cu (mg·kg−1)0.650.650.650.650.650.650.650.650.650.65
Available Zn (mg·kg−1)3.293.293.293.293.293.293.293.293.293.29
Available Fe (mg·kg−1)7.637.637.607.527.517.527.627.527.637.51~7.63
Available Mn (mg·kg−1)14.614.614.614.614.614.414.614.414.614.4~14.6
Soil pH7.467.507.507.507.507.507.477.507.467.46~7.50
Y optimum value0.953.9829.32563.533.5457.664.09.72——
Note: TN, TP, TK, OM, NN, AN, P, K, Cu, Zn, Fe, Mn, SSC and TA are abbreviations for total nitrogen, total phosphorus, total potassium, organic matter, nitrate nitrogen, ammonium nitrogen, phosphorus, potassium, copper, zinc, iron, manganese, soluble solids content and titratable acidity, respectively.
Disclaimer/Publisher’s Note: The statements, opinions and data contained in all publications are solely those of the individual author(s) and contributor(s) and not of MDPI and/or the editor(s). MDPI and/or the editor(s) disclaim responsibility for any injury to people or property resulting from any ideas, methods, instructions or products referred to in the content.

