Abstract
Understanding the impact of pre-treatment methods on the phytochemical composition of grapes is essential for optimizing grape quality and producing raisins with desirable characteristics. Therefore, this study meticulously analyzed the impact of two distinct pre-treatment methods, oak ash and potassium carbonate (K2CO3), on the composition of essential phytochemical components in grapes. This research encompassed phenolic compounds, anthocyanins, phenolic acids, flavonoids, and phytoalexins. This study investigates the impact of pre-treatment methods, oak ash and K2CO3, on the phytochemical composition of grapes. Significant differences were observed in anthocyanins, flavonoids, phytoalexins, and phenolic acids between the treatments. Oak ash exhibited advantages in preserving specific compounds, including higher levels of anthocyanins, flavonols, flavones, flavanones, catechins, resveratrol, pterostilbene, and viniferin, compared to K2CO3. Notably, the delphinidin-3-O-glycoside content was significantly higher in the oak ash treatment. An analysis of phenolic compounds revealed distinctions in hydroxycinnamic acids, hydroxybenzoic acids, benzaldehyde, and phenylacetaldehyde. Additionally, gallic acid, vanillic acid, trans-caffeic acid, trans-p-coumaric acid, and (-)-epicatechin were significantly more prevalent in the K2CO3 treatment, while ferulic acid and quercetin were more prevalent in the oak ash treatment. These findings underscore the pivotal role of pre-treatment methods in shaping the phytochemical content of grapes, thus holding critical implications for grape-derived products’ quality and potential health benefits.
1. Introduction
Grapes are a diverse and versatile fruit of considerable importance, and they belong to the Vitis genus and come in various colors, including green, red, and purple/black [1]. Grapes are not only enjoyed fresh but are also used to produce a wide range of products, most notably wines [2,3,4]. Grapes are rich in essential nutrients, such as vitamins (particularly vitamin C and vitamin K), minerals (like potassium and copper), and dietary fiber, contributing to a healthy diet [5]. Raisins have gained recognition for their remarkable antioxidant content, enriched with vital phenolic compounds, namely flavonoids, resveratrol, and quercetin. These antioxidants play a pivotal role in combatting oxidative stress, thus reducing the risk of age-related ailments and promoting overall well-being [6]. Additionally, raisins stand out for their high dietary fiber content, facilitating digestion and offering sustained energy [7]. Notably, they are abundant in polyphenolic compounds such as quercetin and catechins, renowned for their potent antioxidant properties. In contrast, raisins, being dried grapes, not only contribute to robust bone health due to their calcium content but also provide a concentrated source of the same essential nutrients found in fresh grapes, enriched by the drying process [6].
Considering the esteemed status of grapes in our diet, it is noteworthy that they encompass a diverse array of secondary metabolites, referred to as phenolic compounds. These compounds are not exclusive to grapes but are also prevalent in raisins and various plant species, underscoring their significance [7,8]. This protective capacity has far-reaching implications for human health, reducing the risk of chronic diseases and fortifying our overall well-being [9]. Raisins have earned their reputation for harboring potent antioxidants, effectively shielding our cells from the detrimental effects of free radicals. Their well-established antioxidant and anti-inflammatory attributes play a pivotal role in curbing the risk of chronic conditions like diabetes and neurodegenerative disorders [10]. Within this category of phenolic compounds, flavonoids stand out as a prominent subgroup, displaying a substantial presence in both grapes and raisins. Another facet worth mentioning is the role of anthocyanins, a subgroup of flavonoid compounds; in addition to their contribution to coloration, they possess potent antioxidant and anti-inflammatory properties and are responsible for the vibrant red, purple, and blue hues seen in grapes and various other fruits. Beyond their aesthetic value, anthocyanins offer tangible benefits to cardiovascular health by enhancing blood vessel function and diminishing the risk of heart disease [11]. Furthermore, resveratrol, a widely recognized phytoalexin present in grapes, has garnered substantial attention due to its promising health advantages. Its associations with cardiovascular protection, cancer prevention, and potential longevity enhancement have been a subject of considerable research interest [12]. Phytoalexins, which are bioactive compounds produced by plants, including grapes, in response to environmental stressors like pathogens and UV radiation, are equally intriguing. Additionally, phenolic acids constitute a subclass of phenolic compounds found in grapes and raisins, and are celebrated for their anti-inflammatory and antioxidant effects. These attributes have been correlated with the prevention of various chronic diseases, including cancer and cardiovascular disorders [13]. In the realm of viticulture, on the other hand, the application of K2CO3 and oak ash for drying grapes introduces an intriguing dimension of sustainability, with potential implications for grape quality and secondary metabolite composition. Scientific investigations into the environmental impact, resource efficiency, and long-term effects on grapevine health resulting from these drying methods are essential for advancing sustainable viticultural practices. Understanding the sustainability of grape drying techniques not only aligns with the broader discourse on responsible agricultural practices but also holds the key to preserving the diverse array of phenolic compounds discussed in this paragraph, thereby ensuring the continued provision of the health benefits associated with grapes in a manner harmonious with ecological considerations.
The grape drying process, which can be accomplished naturally by mechanically or sun drying in specialized drying facilities, concentrates the natural sugars within the grapes, enhancing their flavor and sweetness [7,8]. Drying grapes is a traditional food preservation method that involves the removal of moisture from grapes, ultimately transforming them into the delectable dried fruit known as raisins [14]. As the grapes lose moisture, they shrink and become darker in color, resulting in the recognizable wrinkled appearance of raisins. Raisins are a popular and nutritious snack enjoyed worldwide and are also widely used in baking and cooking, adding natural sweetness and texture to a variety of dishes [15]. In this regard, dipping grapes in various solutions such as K2CO3 and oak ash is a technique employed in food science and culinary experimentation. Drying fresh grapes after dipping them in solutions of K2CO3 and oak ash is a captivating process that combines traditional and modern culinary techniques [16]. In historical contexts, the preservation of grapes through dipping processes in Asia Minor was characterized by the use of solutions composed of olive oil and wood ash. Subsequently, a shift occurred, with the adoption of specially formulated K2CO3 in combination with olive oil replacing wood ash [7,8]. Modern commercial cold dip solutions often comprise ethyl esters of fatty acids and K2CO3 as active components, applied using unheated water. Nevertheless, wood ash remains favored due to its organic nature. Notably, the “Hot Dipping Technique” extensively employed in Hadim, Konya, involves immersing grape clusters in solutions consisting of both K2CO3–olive oil blends and oak ash solutions, typically reaching temperatures of 70–90 °C for brief durations, preserving grapes under shaded conditions and imparting a distinctive emerald green hue. Moreover, the sustainability of grapes dried through the application of K2CO3 and oak ash in viticulture hinges on understanding the environmental impact and resource efficiency associated with these diverse dipping techniques. Scientific scrutiny of the ecological footprint, energy consumption, and long-term effects on grape quality and phenolic compound composition is imperative for advancing sustainable viticultural practices. Aligning with the organic preference for wood ash in cold dip solutions, investigating the sustainability of grape drying methods not only addresses agricultural practices but also underscores the importance of preserving traditional techniques, such as the “Hot Dipping Technique”, that contribute to the distinctive qualities of grapes and their environmental compatibility.
While there is a theoretical proposition suggesting that shade drying in raisins could potentially result in superior quality products with enhanced biochemical constituents like phenolic compounds, anthocyanin, phenolic acids, flavonoids, and phytoalexins, empirical evidence supporting this hypothesis specifically in the context of cv. Gök Üzüm raisins is lacking in existing studies. Therefore, the aim of this study is to explore the influence of pre-treatment methods, specifically oak ash and K2CO3, on some phytochemical components of cv. Gök Üzüm berries through the process of shade drying.
2. Materials and Methods
2.1. Plant Material
The cv. Gök Üzüm was procured from vineyards situated in Konya–Karaman, encompassing both the Karaman and Hadim Bozkir regions (37°16′36″ N 32°11′55″ E 1288 m asl). The grapes were harvested on September 10. This study adopted a randomized complete block design, comprising four replicates, each containing six vines. The experiment was carried out in a single vineyard and the clusters were taken from the vineyard in which the experiment was carried out. The vineyards were meticulously maintained with uniform practices for fertilization, disease control, and pruning. In the context of irrigation, drip irrigation lines were strategically placed along the central axis of the crop rows. These lines were equipped with pressure-compensating emitters, each delivering a consistent 2.5 L/h output, spaced at intervals of 1.0 m (with one emitter per vine positioned between adjacent vines). The irrigation system comprised two lines with emitters spaced 2.0 m apart. Notably, each line served a specific set of vines and operated independently. This deliberate positioning ensured the presence of an emitter between every two adjacent vines, facilitating an alternating supply of water to each side of the root system. This alternating water supply regimen was implemented on a bi-weekly basis. The grapevines, aged between 15 and 20 years, exhibited a planting density ranging from 1100 to 1150 vines per hectare, adhering to a precise vine spacing protocol of 3 m within rows and 3 m between rows. Notably, all the vines were meticulously grafted onto Kober 5BB rootstocks, and their growth was managed through the Goblet training system, ensuring consistency and comparability in the study’s vineyard environment.
2.2. Grape Sampling
In this research endeavor, cv. Gök Üzüm grapes, characterized by a ripeness ranging between 20 and 21°Brix, were meticulously hand-harvested from their primary production areas located in Hadim, Turkey, during the year 2020. Following the harvest, clusters underwent careful trimming, involving the removal of damaged, undersized, infected, and immature berries, a process performed with precision using scissors. The sampling methodology remained consistent, involving the selection of 24 vines at random. Approximately 20 kg of fresh grapes were thoughtfully collected from the lower, middle, and upper segments of the clusters, ensuring optimal maturity representation. Each replicate consisted of 5 kg of grape samples from six vines, adding up to a total of 20 kg collected from the 24 vines involved in the study.
2.3. Preparation for the Drying Process
Specific pre-treatments were applied to the fresh grape clusters. To expedite the drying of the grapes, they were immersed in solutions of either oak ash or K2CO3 at elevated temperatures, ranging from 70 to 90 °C, for durations of 5 to 10 s. The oak ash solution consisted of an equal volume mixture of oak ash and water, devoid of any additional chemical additives. In contrast, the K2CO3 solution was composed of 5 to 6% K2CO3, 0.5 to 1% olive oil, and water. Subsequently, the treated grape clusters were arranged in shaded attics, featuring strategically designed walls that facilitated the free circulation of warm breezes within the attics. In this conducive drying environment, the grapes underwent the drying process over a period of approximately 3 to 4 weeks, concluding when their moisture content reached approximately 15% (Figure 1). The study design followed a randomized complete block setup with four replicates, with each replication involving three bags, each containing 300 g of grapes. Consequently, a total of 900 g of raisin samples were extracted from each replication, adding up to 3600 g collected from 24 vines. Following the conclusion of the drying process, the recorded values for the average temperature and relative humidity (RH) were 20 °C and 60%, respectively, and the raisin samples were carefully placed in polyethylene bags, partitioned into twelve separate 300 g portions, securely sealed, and stored at a constant temperature of 20 °C until they were ready for analysis.
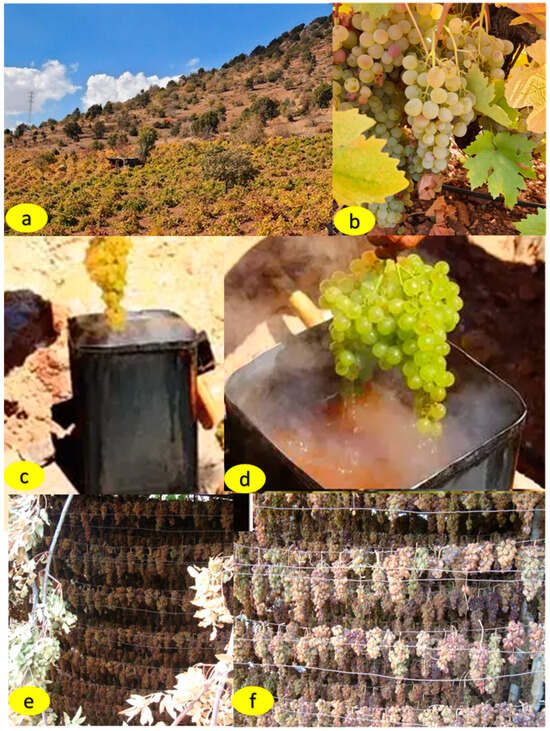
Figure 1.
Vineyard area and cluster of cv. Gök Üzüm (a,b), application of oak ash and potassium sulfate solutions (c,d), grapes dried with exposure to K2CO3 (e) and wood ash (f).
2.4. Analytical Methods for Phenolic Compounds
The mass concentration of the polymer forms of phenolic substances was determined utilizing a colorimetric method, employing the Folin–Ciocalteu reagent by slightly modifying the method developed by Vendramin et al. [17]. The grape berries were subjected to homogenization, with approximately 20 g diluted in 100 mL of deionized water. Subsequently, 5 mL of the homogenized solution was measured into a 20 mL headspace vial, crimped, and maintained at 50 °C for 15 min for the analysis of benzaldehyde. A Solid-Phase Microextraction (SPME) fiber was introduced into the headspace, allowing for the sampling of compounds over a period of 35 min. Following this, the fiber was inserted into the injector port of a gas chromatograph and desorbed for 10 min. The procedure for aliphatic aldehydes followed a similar protocol, with the exception that they were sampled at room temperature (25 °C) for a duration of 15 min. A solution with an initial concentration of 1 g/L, obtained through the dilution of the extract, underwent oxidation by Folin–Ciocalteu reagent (125 mL). Subsequently, the oxidized solution was neutralized using sodium carbonate at a concentration of 20% w/v. The separation of hydroxycinnamic acids was carried out using a C18 Lichrospher column (4 × 250 mm, 5 µm, Agilent Technologies Italia, Milan, Italy) in conjunction with a 1525 Binary Pump (Waters, Milan, Italy) and a 2487 Dual Band Absorbance Detector (Waters, Milan, Italy). The analysis involved freshly prepared verjuice that underwent centrifugation and filtration (0.2 μm) prior to injection (10 μL) and subsequent examination, following the method proposed by Vanzo et al. [17] with certain modifications. The mobile phase composition remained consistent with the original method suggested by the authors, while adjustments were made to the flow rate (0.6 mL/min) and gradient as follows: (A) Milli-Q water and 0.5% of formic acid v/v, and (B) gradient-grade methanol and 2.0% of formic acid v/v. The gradient program unfolded as follows: 0 min, 16% B; 7 min, 50% B; 8 min, 100% B; 8–12 min, 100% B; 13 min, 18% B; and 13–18 min, 18% B. The column temperature was maintained at 40 °C. Detection of hydroxycinnamic acids and esters occurred at a wavelength of 280 nm for purity determination and 330 nm for HCAs quantification. Peak areas were analyzed using Breeze Version 3.3 software (Waters, Milan, Italy).
2.5. Analytical Methods for the Anthocyanin Content
Anthocyanin analysis was conducted using a method that involved slight modifications of Yousef et al.’s [18] approach. The assessment of anthocyanins in grape berries was carried out using a high-performance liquid chromatography (HPLC) system, specifically the Agilent 1100 Series system, manufactured by Agilent in Waldbronn, Germany. This HPLC system was equipped with a diode array detector (DAD) (model G1315B) and coupled to an LC/MSD Trap VL (model G2445C VL) ESI-MS/MS system. Data processing was handled through the Agilent ChemStation (version B.01.03) data processing station. Mass spectral data were further analyzed using the Agilent LC/MS Trap software (version 5.3). For the analysis, anthocyanin extracts were injected at precise volumes of 10 μL onto a reversed-phase column known as Zorbax Eclipse XDB-C18 (2.1 mm × 150 mm; 3.5 μm particle; Agilent, Germany). The column temperature was consistently maintained at 40 °C. The separation method was based on a previously established technique, with minor adjustments made to optimize the separation of the detected anthocyanins. The mobile phase utilized for separation was a mixture of water, acetonitrile, and formic acid, consisting of two solvent compositions: 88.5% water, 3% acetonitrile, and 8.5% formic acid (solvent A); and 41.5% water, 50% acetonitrile, and 8.5% formic acid (solvent B). The separation gradient proceeded as follows: 97% A and 3% B for 8 min; 70% A and 30% B over 20 min; 50% A and 50% B for 6 min; 0% A and 100% B for 4 min, maintained for 2 min, followed by a return to the initial condition over 6 min. An 8 min conditioning period was incorporated between injections. The flow rate was set at 0.19 mL/min. To determine the concentrations of anthocyanin, a comparative approach was adopted using external standards. Calibration standards, including Rutin (Quercetin-rutinoside), Quercetin (Quercetin-rhamnoside), Isoquercitin (Quercetin glucoside), and Cyanidin-3-O-glucoside obtained from Sigma–Aldrich Fluka in Madrid, Spain, as well as malvidin-3-O-glucoside (Oenin), Isorhamnetin glucoside, and Procyanidin B1 from Extrasynthese in Genay, France, were employed for this purpose.
2.6. Analytical Methods for Phenolic Acids
The determination of phenolic acids involved a methodology with slight adjustments, building upon the method developed by Pantelić et al. [19]. An ultra-high-performance liquid chromatography (UHPLC) system, specifically the Dionex Ultimate 3000 UHPLC, equipped with a diode array detector (DAD) and complemented by a mass spectrometer (TSQ Quantum Access Max triple-quadrupole with heated electrospray ionization (HESI)) from ThermoFisher Scientific in Basel, Switzerland, was employed for this purpose. The chromatographic separation was achieved using a Syncronis C18 column sourced from ThermoFisher Scientific in Bremen, Germany. The mobile phase for gradient elution comprised two components: a 0.1% aqueous formic acid solution (A) and 100% acetonitrile (B). The elution process followed a well-defined gradient pattern: commencing at 5% B for 2.0 min, it gradually increased from 5% to 95% B over the next 10 min (spanning from 2.0 to 12.0 min). Subsequently, there was a rapid transition from 95% to 5% B in just 0.1 min (from 12.0 to 12.1 min), and the mobile phase was maintained at 5% B for the ensuing 3 min. To quantify each individual phenolic compound, a direct comparison was made with commercially available standards. The results of the analysis were expressed in terms of concentrations, measured in milligrams per kilogram (mg/kg), of the berry samples under examination.
2.7. Analytical Methods for Flavonoids
The analysis of flavonoids such as anthocyanidins, flavonols, flavones, flavanones, and catechins extracted from the berries was conducted following a methodology originally outlined by Brossa et al. [20], with specific modifications. In brief, each filtered extract, amounting to 10 μL, was introduced into a liquid chromatography (LC) system, specifically the Acquity UPLC manufactured by Waters in Milford, MA, USA. Chromatographic separation was executed using a C18 column (3.5 μm; 100 × 2.1, Waters, Milford, MA, USA) maintained at a constant temperature of 42 °C, with its flow rate set at 0.3 mL/min. For the detection and quantification of flavonoids, the Electrospray Ionization (ESI) mode was applied, with positive ionization (UPLC-(ESI+)-MS/MS) for anthocyanins and negative ionization (UPLC-(ESI-)-MS/MS) for all other flavonoids. Spectra were recorded within a range spanning from 100 to 900 atomic mass units per charge (amu/z). Additionally, UV/visible light detection was carried out at 365 nm for flavonols and 520 nm for anthocyanins.
2.8. Analytical Methods for the Phytoalexins
Phytoalexin content was assessed with a modified version of the method developed by Jeandet et al. [21]. Initially, samples were finely ground with sand in a mortar, and 30 mL of a methanol–water mixture (8:2, v/v) was employed for extraction. Following this step, the resulting mixture underwent centrifugation at 10,000× g for 15 min, which effectively separated the supernatant for subsequent processing. Subsequently, a purification step was executed on the supernatant using a Sep-Pak C18 cartridge (Waters, Milford, MA). Elution was carried out with a 30 mL methanol–water mixture (8:2, v/v), and the eluate obtained was evaporated to dryness while ensuring that the temperature did not exceed 40 °C. To prepare the berry extracts for analysis, the dried eluate was reconstituted in methanol at a ratio of 10 mL per gram of fresh weight, and then meticulously filtered. During high-performance liquid chromatography (HPLC) analysis, precisely 10 μL of each sample, equivalent to 1 mg of fresh weight, was injected into the system for examination and quantification.
2.9. Statistical Analysis
Statistical analyses in this study were conducted using the integrated statistical package within R Studio. To comprehensively evaluate the impact of K2CO3 and oak ash, and their potential influences on the concentrations of phenolic compounds, anthocyanin content, phenolic acids, flavonoids, and phytoalexins, a rigorous analysis of variance (ANOVA) was performed, making use of the statistical package in R Studio. The statistical model encompassed both main effects and interaction effects, with subsequent assessments to confirm adherence to normality assumptions. Four distinct models were meticulously constructed to assess the primary effects of K2CO3 and oak ash on the concentrations of phenolic compounds, anthocyanin content, phenolic acids, flavonoids, and phytoalexins. When statistical significance was identified through the ANOVA, post hoc analysis was conducted using Tukey’s test, a well-established method for exploring differences among multiple groups comprehensively [22]. To gain deeper insights and visualize the relationships among various variables, PCAs for phenolic compounds, anthocyanin content, phenolic acids, flavonoids, and phytoalexins were plotted using ggplot2 within R Studio [23]. PCA is a valuable analytical technique for reducing multidimensional data into a more interpretable format, facilitating the identification of underlying patterns and trends within complex datasets. The heatmap was produced utilizing the pheatmap package in R Studio [24].
3. Results
The content of anthocyanidins was significantly higher in the oak ash treatment (215 mg/kg) compared to the K2CO3 one (154.0 mg/kg), with a p-value of 0.001. The flavonols’ content exhibited a significant difference, with oak ash (68.0 mg/kg) displaying higher levels than K2CO3 (50 mg/kg). The flavones’ content was significantly higher in the oak ash treatment (92.6 mg/kg) compared to the K2CO3 one (66.0 mg/kg), with a p-value of 0.007. The flavanones’ content displayed a significant variance, with oak ash (15.1 mg/kg) having higher levels compared to K2CO3 (11.0 mg/kg), and a p-value of 0.001. The catechins’ content was significantly higher in the oak ash treatment (61.6) compared to the K2CO3 one (39.8 mg/kg), with a p-value of 0.005. On the other hand, the resveratrol content showed a significant difference, with oak ash (33.8 mg/kg) having higher levels compared to K2CO3 (23.2 mg/kg), with a very low p-value of 1.120. The content of pterostilbene was significantly higher in the oak ash treatment (4.65 mg/kg) compared to the K2CO3 one (3.77 mg/kg).
Piceid content exhibited a significant difference, with oak ash (3.04) showing lower levels compared to K2CO3 (3.43 mg/kg), at a p-value of 0.003. Viniferin content was significantly higher in the oak ash treatment (29.2 mg/kg) compared to K2CO3 (21.4 mg/kg). The comparison of flavonoids and phytoalexins between the oak ash and K2CO3 treatments revealed substantial differences in the composition of these compounds (Table 1 and Supplementary Table S1).

Table 1.
Flavonoids (mg/kg) and phytoalexins (mg/kg) of the raisin grapes produced from cv. Gök Üzüm that had undergone treatment with the oak ash or K2CO3 dipping solutions.
The comparative analysis of anthocyanin content and phenolic acids between the oak ash and K2CO3 treatments yielded substantial findings. While malvidin-3-O-glycoside content showed no significant difference between the two treatments, other anthocyanins exhibited noteworthy distinctions. The content of delphinidin-3-O-glycoside was significantly higher in the oak ash treatment, indicating its potential as a beneficial pre-treatment choice. The quantitative analysis of phenolic compounds in grape extracts revealed significant variations between different glycoside forms. Malvidin-3-O-glycoside exhibited comparable values of 165.0 and 171.0, with a p-value of 0.514, indicating a non-significant difference (ns). In contrast, Delphinidin-3-glycoside demonstrated a statistically significant decrease from 21.5 to 19.1 (p = 0.047). Similarly, cyanidin-3-O-glycoside and petunidin-3-glycoside both exhibited significant reductions from 8.26 to 6.52 (p = 0.022) and from 32.3 to 24.8 (p = 0.004), respectively. Peonidin-3-O-glycoside showed a substantial decline from 29.9 to 21.9 (p = 0.0016). Furthermore, malvidin-3-O-glucoside experienced a significant reduction from 22.7 to 17.9 (p = 0.003). Additionally, malvidin-3-O-glycoside acetyl demonstrated a noteworthy decrease from 226 to 143 (p = 0.010). Conversely, peonidin-3-glycoside acetyl did not exhibit a statistically significant difference, with values of 312.0 and 273.0 (p = 0.081). Notably, malvidin-3-O-glycoside-p-coumaryl displayed a reversal in values, with an increase from 273.0 to 299.0 (p = 0.030). The analysis of the phenolic acids in the samples yielded notable differences in the concentrations of specific compounds. Hydroxycinnamic acids exhibited a statistically significant decrease from 12.5 to 11.0 (p = 0.036). Hydroxybenzoic acids did not demonstrate a statistically significant difference, maintaining values of 14.0 and 13.2 (p = 0.131), indicated as ns (non-significant). Similarly, benzaldehyde did not exhibit a significant difference, with concentrations of 148.0 and 103.0 (p = 0.291), marked as ns. In contrast, phenylacetaldehyde displayed a significant reduction from 115.7 to 82.3 (p = 0.048) (Table 2 and Supplementary Table S2).
Table 2.
The anthocyanin content (%) and phenolic acids (peak/IS ratio) of the raisin grapes produced from cv. Gök Üzüm that had undergone treatment with oak ash or K2CO3 dipping solutions.
The analysis of phenolic compounds revealed noteworthy distinctions between the oak ash and K2CO3 treatments. Gallic acid content was significantly higher in the oak ash treatment (12.9 µg/L) compared to the K2CO3 treatment (11.0 µg/L), denoted by a p-value of 0.0182. Similarly, vanillic acid content displayed a substantial variance, with the oak ash treatment (19.5 µg/L) exhibiting higher levels in contrast to the K2CO3 treatment (16.5), with a p-value of 0.004. Trans-caffeic acid content was notably elevated in the oak ash treatment (14.6 µg/L) compared to the K2CO3 treatment (11.7 µg/L), as evidenced by a p-value of 0.008. Trans-p-coumaric acid content also demonstrated a significant distinction, with the oak ash treatment (15.4 µg/L) revealing higher levels than the K2CO3 treatment (12.1 µg/L), resulting in a p-value of 0.000. Furthermore, the ferulic acid content was markedly different between the two treatments, with the oak ash treatment (2.9 µg/L) displaying lower levels compared to the K2CO3 treatment (4.2 µg/L), as indicated by a p-value of 0.000. In general, the contents of gallic acid, vanillic acid, trans-caffeic acid, trans-p-coumaric acid, and (-)-epicatechin were significantly greater after the K2CO3 treatment compared to the oak ash treatment, while ferulic acid and quercetin demonstrated greater contents after the oak ash treatment than the K2CO3 one; however, there were no differences in tyrosol, kaftaric acid, rutin catechin, and myricetin phenolic compounds between the applied treatments (Table 3 and Supplementary Materials Table S2).
Table 3.
Phenolic compounds (µg/L) of the raisin grapes produced from the Gök Uzüm cultivar with oak ash and K2CO3 dipping solution treatments applied.
Principal Component Analyses (PCAs) have been instrumental in unraveling the relationships and alterations within the various components of phenolic compounds, anthocyanins, phenolic acids, flavonoids, and phytoalexins. These PCAs reveal vital insights into the variance within these components. The findings indicate that Dim1 and Dim2 collectively explain 70% and 14.7% of the variance, respectively, shedding light on the distribution and interplay of these compounds. Phenolic compounds, including gallic acid and catechin, are widely distributed in the PCA (Figure 2A). Focusing on anthocyanin content, Dim1 and Dim2 account for 71.5% and 14.9% of the variance, respectively. Anthocyanins like malvidin-3-glycoside and malvidin-3-O-glycoside-p-coumaryl are positioned on the positive side of Dim1, while others reside on the negative side (Figure 2B). Turning to phenolic acids, Dim1 and Dim2 elucidate 61.7% and 24.5% of the variance, respectively. The dominant phenolic acids, hydroxycinnamic acids and hydroxybenzoic acids, exhibit distinct positions in the PCA. The former gravitates toward the positive side of Dim1, while the latter is closer to the positive side of Dim2 (Figure 2C). In the realm of flavonoids, Dim1 captures 93.3% of the variance, whereas Dim2 explains 5.6%. Compounds like anthocyanidin, flavones, flavonols, and catechins are prominently clustered on the negative side of Dim1, signifying the robust relationships among them. This is corroborated by the high cos2 values, further emphasizing their importance in the PCA (Figure 2D). Examining phytoalexins, the primary PC (Dim1) clarifies 93.2% of the variance, while the secondary (Dim2) accounts for 4.1%. Key components, including pterostilbene, viniferin, and resveratrol, gravitate towards the positive end of Dim2, with piceid aligned with the positive end of Dim1. The high cos2 values underpin the robust relationships depicted in this principal component (Figure 2E).
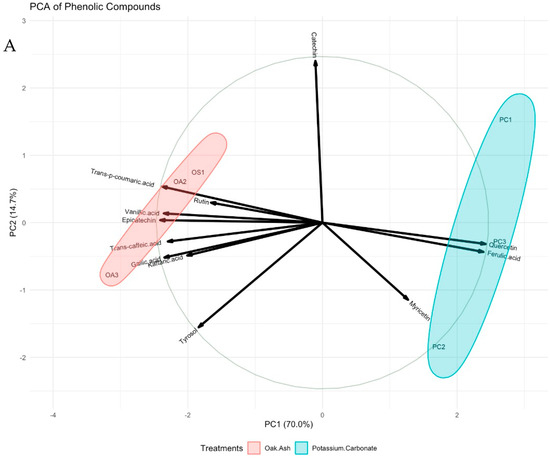
Figure 2.
PCA biplots of berries colored by treatments. All phenolic compounds (A), anthocyanin (B), phenolic acids (C), flavonoids (D), and phytoalexins (E) are displayed. Cos2: the quality of the representation of the variables of the principal components. Data size of each parameter was used to construct the current graphs (n: 9).
Figure 3 presents a hierarchical heatmap that delineates the relative quantities of various phytochemical components within the grape samples, such as phenolic compounds, anthocyanin, phenolic acids, flavonoids, phytoalexins, and phenolic acids. The X axis clusters these components, revealing the similarities and differences among them. Notably, two distinct groups are discernible from right to left, spanning from viniferin to peonidin-3-glycoside acetyl and from rutin to Pterostilbene. It becomes evident that oak ash and K2CO3 treatments partition these groups along the Y axis, signifying the treatments’ influence on phytochemical compositions, with malvidin-3-O-glycoside and anthocyanidins emerging as deep purple patches in the heatmap, indicative of their high concentration levels (Figure 3).
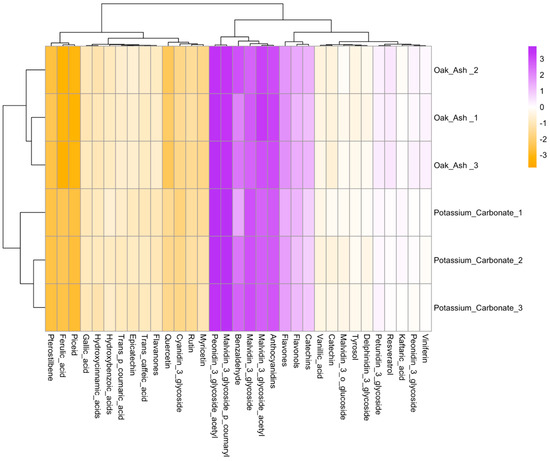
Figure 3.
A heatmap analysis that scrutinizes numerous components, from phenolic compounds and anthocyanin to phenolic acids, flavonoids, and phytoalexins. The cos2- meaning of the bar in the top right is the quality of the representation of the variables of the principal components. Data size for each parameter was used to construct the current graph (n: 9).
4. Discussion
The comparative analysis of phenolic compounds in the grape samples revealed significant differences between the oak ash and K2CO3 solutions. In general, the results of this comprehensive analysis demonstrate the substantial impact of pre-treatment methods, specifically oak ash and K2CO3, on the composition of phenolic compounds, anthocyanins, phenolic acids, flavonoids, and phytoalexins in grapes. These findings underscore the critical role of pre-treatment selection in shaping the phytochemical profile of grapes, with profound implications for the quality and potential health benefits of grape-derived products. The substantial difference in the flavanones’ content, with K2CO3 surpassing oak ash, indicates the preference for oak ash in preserving these compounds, likely attributed to the unique characteristics of this treatment method. A comparison of phytoalexins and flavonoids between the K2CO3 and oak ash solutions also yielded notable insights. The significantly higher anthocyanidins content in the oak ash solution underscores the promise of this pre-treatment method in enhancing these compounds, aligning with the findings of Ünal et al. [25]. The elevated catechins content in the oak ash solution highlights its potential as a preferred choice for enriching these compounds, known for their antioxidant properties [26,27]. Furthermore, the notably higher flavones content in the oak ash solution suggests its efficacy in conserving these compounds, which is significant considering the potential health benefits associated with flavones [28,29]. The significant variance in the flavanols’ content, with K2CO3 surpassing oak ash, is in line with a previous study indicating the sensitivity of flavanols to different pre-treatment techniques [25]. Similarly, the notably higher pterostilbene content in the oak ash treatment emphasizes its potential positive impact on this phytoalexin. In contrast, the lower piceid content in oak ash compared to K2CO3 suggests the sensitivity of this compound to different pre-treatment methods [3,7,14]. Additionally, the significantly higher resveratrol content in the oak ash treatment underscores its efficacy in preserving this compound, highly regarded for its potential health benefits [30]. The greater viniferin content in the oak ash treatment also suggests its potential as a preferred pre-treatment choice for influencing this specific phytoalexin.
The gallic acid content was significantly higher in the oak ash treatment, highlighting its potential health benefits [27]. The K2CO3 treatment exhibited higher a ferulic acid content, indicating that different treatments can indeed exert varying effects on specific phenolic acids [26]. Furthermore, the oak ash treatment demonstrated elevated levels of trans-caffeic acid and trans-p-coumaric acid, suggesting its efficacy in preserving these compounds, possibly attributed to the unique properties of oak ash. The notably higher vanillic acid content in the oak ash treatment may also be a result of oak ash’s distinct characteristics, with vanillic acid holding importance due to its antioxidant and antimicrobial properties, rendering it a valuable component of grape products [31]. Collectively, these results highlight the substantial influence of pre-treatment choice on the composition of the phenolic compounds in grapes, aligning with prior research that emphasizes the impact of pre-treatment methods on grape phenolics [3,7,8,14,32].
The substantially higher malvidin-3-O-glycoside acetyl and delphinidin-3-O-glycoside content in the oak ash treatment emphasizes its importance as a pre-treatment choice for influencing this specific anthocyanin, consistent with previous studies underscoring the role of pre-treatment in shaping the anthocyanin profile in grapes [25]. The analysis of the anthocyanin content revealed intriguing disparities between the K2CO3 and oak ash treatments, aligning with prior studies highlighting the impact of pre-treatments on anthocyanin content modulation [33]. Similarly, the significantly higher malvidin-3-o-glucoside and peonidin-3-O-glycoside content in the oak ash treatment underscore the potential benefits of this treatment for enhancing the retention of these anthocyanins. Petunidin-3-glycoside and cyanidin-3-O-glycoside contents were notably elevated in the oak ash treatment, reinforcing the idea that different pre-treatment methods can exert varying influences on anthocyanins. These anthocyanins, known for their role in color and their potential health benefits, further underscore the importance of pre-treatment selection [34,35]. On the other hand, the notably higher phenylacetaldehyde content in the oak ash treatment indicates its potential positive impact on this phenolic acid. The higher hydroxycinnamic acids content in the oak ash treatment for phenolic acids’ enhancement suggests its potential as a preferred choice for enhancing this specific compound. Taken together, these findings emphasize the substantial influence of pre-treatment selection on the anthocyanin content and phenolic acid composition in grapes, consistent with previous research highlighting the role of pre-treatment methods in shaping these components [28,36]. On the other hand, research on grape harvests, even when conducted over a single year, provides valuable insights, enabling an understanding of the unique characteristics of that specific year. While it highlights the specific environmental factors of that year, it paves the way for acknowledging the need to consider broader variations that may occur annually. For instance, studying the quality parameters of the Gök Üzüm cultivar in a single year can reveal how it responds to specific weather patterns, soil fertility, and other climatic conditions of that year, offering a snapshot of its potential variability. Additionally, recognizing that changes in the characteristics of grapes can influence the raisining process is insightful.
5. Conclusions
Our findings highlight the differential impact of pre-treatment methods, specifically oak ash and K2CO3, on the preservation of distinct compounds within grapes. On the one hand, K2CO3 excels in maintaining the content of ferulic acid and quercetin within the grapes. The comparative analysis between the oak ash and K2CO3 treatments revealed substantial differences in the content of anthocyanins, phenolic compounds, and phenolic acids in the grape extracts. Oak ash demonstrated a significant advantage in preserving specific compounds, including anthocyanins, flavonoids, and phytoalexins. Notably, the higher content of malvidin-3-O-glycoside acetyl, flavonols, and flavones in the oak ash treatment underscores its efficacy as a pre-treatment method. The analysis of phenolic compounds further emphasized their nuanced variations, with oak ash and K2CO3 treatments exhibiting distinct impacts on specific phenolic acids. These findings contribute valuable insights into the role of pre-treatment in shaping the phytochemical profile of grapes, offering potential applications for tailored grape-derived products. However, the transformation of grapes into raisins is intricately linked to the grapes’ quality and condition. Factors like sugar content, acidity, and moisture levels, which might vary each year, are crucial to determining the quality of the final raisin product. Hence, conducting research over multiple years is vital to thoroughly understand these interactions and to innovate more effective and flexible raisin production techniques. This multi-year approach is instrumental in gaining a comprehensive perspective on how annual variations in grape characteristics can enrich the raisining process and enhance the quality of the end product. Nevertheless, further research is essential to delve into the underlying mechanisms behind these variations and explore their implications for the quality and functionality of grape-based products, considering their diverse applications in the food and pharmaceutical industries.
Supplementary Materials
The following are available online at https://www.mdpi.com/article/10.3390/horticulturae10010095/s1, Table S1: Phenolic compounds (µg/L) of the raisin grapes produced from the Gök Uzüm cultivar applied the treatments Oak ash and K2CO3 dipping solutions; Table S2: The anthocyanin content (%) and phenolic acids (peak/IS ratio) of the raisin grapes produced from the Gök Üzüm cultivar applied the treatments Oak ash and K2CO3 dipping solutions; Table S3: Flavonoids (mg/kg) and Phytoalexins (mg/kg) of the raisin grapes produced from the Gök Üzüm cultivar applied the treatments Oak ash and K2CO3 dipping solutions.
Author Contributions
O.K. conceived and designed the experiments; O.K. and H.D. performed the experiments; T.Y., H.D., O.K., M.S., N.K. and F.A. analyzed the data. O.K. wrote and proofread the final paper. All authors have read and agreed to the published version of the manuscript.
Funding
This research received no external funding.
Institutional Review Board Statement
No ethics approval or consent to participate was required for this study.
Informed Consent Statement
Not applicable.
Data Availability Statement
Data are contained within the article and Supplementary Materials.
Conflicts of Interest
The authors declare no conflicts of interest.
References
- Keskin, N.; Kunter, B.; Çelik, H.; Kaya, O.; Keskin, S. ANOM approach for the statistical evaluation of organic acid contents of clones of the grape variety ‘Kalecik Karası’. Mitteilungen Klosterneubg. 2021, 71, 126–138. [Google Scholar]
- Ates, F.; Kaya, O.; Keskin, N.; Turan, M. Bi ogenic amines in raisins of one vintage year: In fluence of two chemical pre-treatments (dipping in oak ash solution or potassium carbonate solution). Mitteilungen Klosterneubg. 2022, 72, 51–59. [Google Scholar]
- Keskin, N.; Kunter, B.; Celik, H.; Kaya, O.; Keskin, S. Evaluation of Clonal Variability of Berry Phenolics in Vitis vinifera L. Cv. Kalecik Karası. Erwerbs-Obstbau 2022, 64 (Suppl. S1), 65–72. [Google Scholar] [CrossRef]
- Kalkan, N.N.; Karadoğan, B.; Kadioğlu, Z.; Esmek, İ.; Albayrak, S.; Kaya, O. Response of Karaerik Grape Cultivar (Vitis vinifera L.) to Two Training Systems and Three Trunk Heights. Erwerbs-Obstbau 2022, 64 (Suppl. S1), 119–127. [Google Scholar] [CrossRef]
- World Health Organization. Fruit and Vegetable Promotion Initiative. 2022. Available online: https://www.who.int/dietphysicalactivity/publications/trs916/intro/en/ (accessed on 20 May 2022).
- Kaliora, A.C.; Kountouri, A.M.; Karathanos, V.T.; Andrikopoulos, N.K. Vitamin C content in grapes, fresh and dried, and in products made from them. J. Food Compos. Anal. 2016, 46, 30–37. [Google Scholar]
- Karakus, S.; Ates, F.; Keskin, N.; Turan, M.; Kaya, O. Comparison of contents of sugars, organic acids and free amino acids in raisins obtained from Gök Üzüm (Vitis vinifera L.). Mitteilungen Klosterneubg. 2023, 73, 98–113. [Google Scholar]
- Karakus, S.; Kaya, O.; Hajizadeh, H.S.; Gutiérrez-Gamboa, G.; Ates, F.; Turan, M.; Araya-Alman, M. Characterization of volatile compounds of Gök Üzüm raisins produced from grapes pre-treated with different dipping solutions. Chem. Biol. Technol. Agric. 2023, 10, 55. [Google Scholar] [CrossRef]
- Nile, S.H.; Park, S.W. Edible Oil. Inhibitory effects of anthocyanins and fruit extracts from Vitis coignetiae on melanin formation in B16F10 cells. Int. J. Mol. Sci. 2014, 15, 21930–21947. [Google Scholar]
- González-Gallego, J.; García-Mediavilla, M.V.; Sánchez-Campos, S.; Tuñón, M.J. Fruit polyphenols, immunity and inflammation. Br. J. Nutr. 2010, 104 (Suppl. S3), S15–S27. [Google Scholar] [CrossRef]
- Tsuda, T. Dietary anthocyanin-rich plants: Biochemical basis and recent progress in health benefits studies. Mol. Nutr. Food Res. 2012, 56, 159–170. [Google Scholar] [CrossRef]
- Nunes, T.; Almeida, L.; Rocha, J.F.; Laranjinha, J.; Barbosa, R.M. Inhibition of human in vitro osteoclastogenesis by anthocyanin-rich açai extract. Inflammopharmacology 2017, 25, 261–268. [Google Scholar]
- Chukwumah, Y.; Walker, L.; Verghese, M. Peanut skin color: A biomarker for total polyphenolic content and antioxidative capacities of peanut cultivars. Int. J. Mol. Sci. 2009, 10, 4941–4952. [Google Scholar] [CrossRef] [PubMed]
- Keskin, N.; Kaya, O.; Ates, F.; Turan, M.; Gutiérrez-Gamboa, G. Drying grapes after the application of different dipping solutions: Effects on hormones, minerals, vitamins, and antioxidant enzymes in Gök Üzüm (Vitis vinifera L.) raisins. Plants 2022, 11, 529. [Google Scholar] [CrossRef]
- USDA. Statistical Data. 2022. Available online: https://apps.fas.usda.gov/psdonline/circulars/Raisins.pdf (accessed on 20 October 2023).
- Kaya, O.; Ates, F.; Kara, Z.; Turan, M.; Gutiérrez-Gamboa, G. Study of Primary and Secondary Metabolites of Stenospermocarpic, Parthenocarpic and Seeded Raisin Varieties. Horticulturae 2022, 8, 1030. [Google Scholar] [CrossRef]
- Vendramin, V.; Viel, A.; Vincenzi, S. Caftaric Acid Isolation from Unripe Grape: A “Green” Alternative for Hydroxycinnamic Acids Recovery. Molecules 2021, 26, 1148. [Google Scholar] [CrossRef] [PubMed]
- Yousef, G.G.; Brown, A.F.; Funakoshi, Y.; Mbeunkui, F.; Grace, M.H.; Ballington, J.R.; Loraine, A.; Lila, M.A. Efficient quantification of the health-relevant anthocyanin and phenolic acid profiles in commercial cultivars and breeding selections of blueberries (Vaccinium spp.). J. Agric. Food Chem. 2013, 61, 4806–4815. [Google Scholar] [CrossRef]
- Pantelić, M.M.; Zagorac, D.Č.D.; Ćirić, I.Ž.; Pergal, M.V.; Relić, D.J.; Todić, S.R.; Natić, M.M. Phenolic profiles, antioxidant activity and minerals in leaves of different grapevine varieties grown in Serbia. J. Food Compos. Anal. 2017, 62, 76–83. [Google Scholar] [CrossRef]
- Brossa, R.; Casals, I.; Pintó-Marijuan, M.; Fleck, I. Leaf flavonoid content in Quercus ilex L. resprouts and its seasonal variation. Trees 2009, 23, 401–408. [Google Scholar] [CrossRef]
- Jeandet, P.; Breuil, A.C.; Adrian, M.; Weston, L.A.; Debord, S.; Meunier, P.; Maume, G.; Bessis, R. HPLC analysis of grapevine phytoalexins coupling photodiode array detection and fluorometry. Sci. Hortic. 1997, 183, 115–126. [Google Scholar] [CrossRef]
- R Core Team. R: A Language and Environment for Statistical Computing; R Foundation for Statistical Computing: Vienna, Austria, 2013; Available online: http://www.R-project.org/ (accessed on 8 August 2022).
- Wickham, H.; Wickham, H. Data Analysis; Springer International Publishing: Cham, Switzerland, 2016; pp. 189–201. [Google Scholar]
- Kolde, R. Pheatmap: Pretty Heatmaps_.R Package Version 1.0.12. 2019. Available online: https://rdrr.io/cran/pheatmap/ (accessed on 25 February 2022).
- Ünal, M.S.; Güler, E.; Yaman, M. Changes in Antioxidant and Color Properties of Raisins According to Variety and Drying Method. Horticulturae 2023, 9, 771. [Google Scholar] [CrossRef]
- Teixeira, A.; Eiras-Dias, J.; Castellarin, S.D.; Gerós, H. Berry phenolics of grapevine under challenging environments. Int. J. Mol. Sci. 2013, 14, 18711–18739. [Google Scholar] [CrossRef]
- Badhani, B.; Sharma, N.; Kakkar, R. Gallic acid: A versatile antioxidant with promising therapeutic and industrial applications. RSC Adv. 2015, 5, 27540–27557. [Google Scholar] [CrossRef]
- Williamson, G.; Carughi, A. Polyphenol content and health benefits of raisins. Nutr. Res. 2010, 30, 511–519. [Google Scholar] [CrossRef] [PubMed]
- Olmo-Cunillera, A.; Escobar-Avello, D.; Pérez, A.J.; Marhuenda-Muñoz, M.; Lamuela-Raventós, R.M.; Vallverdú-Queralt, A. Is eating raisins healthy? Nutrients 2019, 12, 54. [Google Scholar] [CrossRef] [PubMed]
- Thiruchelvi, R.; Jayashree, P.; Nayik, G.A.; Gull, A.; Ahad, T.; Thakur, M.; Shah, T.R.; Paray, M.A.; Haq, R.U. Raisin. In Antioxidants in Vegetables and Nuts-Properties and Health Benefits; Springer: Berlin/Heidelberg, Germany, 2020; pp. 523–537. [Google Scholar]
- Sabel, A.; Bredefeld, S.; Schlander, M.; Claus, H. Wine phenolic compounds: Antimicrobial properties against yeasts, lactic acid and acetic acid bacteria. Beverages 2017, 3, 29. [Google Scholar] [CrossRef]
- Campos, F.; Peixoto, A.F.; Fernandes, P.A.; Coimbra, M.A.; Mateus, N.; de Freitas, V.; Fernandes, I.; Fernandes, A. The antidiabetic effect of grape pomace polysaccharide-polyphenol complexes. Nutrients 2021, 13, 4495. [Google Scholar] [CrossRef] [PubMed]
- Squadrito, M.; Corona, O.; Ansaldi, G.; Di Stefano, R. Evolution of anthocyanin profile from grape to wine. Oeno One 2010, 44, 167–177. [Google Scholar] [CrossRef]
- Karadeniz, F.; Durst, R.W.; Wrolstad, R.E. Polyphenolic composition of raisins. J. Agric. Food Chem. 2000, 48, 5343–5350. [Google Scholar] [CrossRef]
- Kalkan, N.N.; Bozkurt, A.; Gecim, T.; Karadogan, B.; Bahar, E.; Kaya, O. Influence of pruning severity in the table grape variety ‘Karaerik’ (Vitis vinifera L.). Mitteilungen Klosterneubg. 2022, 72, 137–145. [Google Scholar]
- Kelebek, H.; Jourdes, M.; Selli, S.; Teissedre, P.L. Comparative evaluation of the phenolic content and antioxidant capacity of sun-dried raisins. J. Sci. Food Agric. 2013, 93, 2963–2972. [Google Scholar] [CrossRef]
Disclaimer/Publisher’s Note: The statements, opinions and data contained in all publications are solely those of the individual author(s) and contributor(s) and not of MDPI and/or the editor(s). MDPI and/or the editor(s) disclaim responsibility for any injury to people or property resulting from any ideas, methods, instructions or products referred to in the content. |
© 2024 by the authors. Licensee MDPI, Basel, Switzerland. This article is an open access article distributed under the terms and conditions of the Creative Commons Attribution (CC BY) license (https://creativecommons.org/licenses/by/4.0/).