Article

Silver Nanoparticles and Biostimulants Affect Chemical Constituents, Total Phenolics, Antioxidants, and Potential Antimicrobial Activities of Santolina chamaecyparissus

by
Ezz Al-Dein Al-Ramamneh
1,*,
Khalid Y. Alsharafa
2,
Taha Rababah
3,
Razan J. Rahahleh
4,
Fuad Al-Rimawi
5,
Ashok K. Shakya
6,
Ayoup M. Ghrair
7,
Muhammad H. Alu’datt
8 and
Moayad K. Alnawafleh
9
1
Department of Plant Production and Protection, Faculty of Agricultural Technology, Al-Balqa Applied University, Al-Salt 19117, Jordan
2
Department of Biological Sciences, Faculty of Science, Mutah University, Mutah 61710, Jordan
3
Department of Nutrition and Food Technology, Faculty of Agriculture, Jordan University of Science and Technology, Irbid 22110, Jordan
4
Department of Diet Therapy Technology and Dietetics, Faculty of Allied Medical Sciences, Zarqa University, Al-Zarqa 13110, Jordan
5
Department of Chemistry and Chemical Technology, College of Science and Technology, Al-Quds University, Jerusalem P144, Palestine
6
Pharmacological and Diagnostic Research Center, Department of Pharmaceutical Sciences, Faculty of Pharmacy, Al-Ahliyya Amman University, Amman 19328, Jordan
7
Department of Water Resources and Environmental Management, Faculty of Agricultural Technology, Al-Balqa Applied University, Al-Salt 19117, Jordan
8
Department of Food Science & Nutrition, College of Life Sciences, Kuwait University, P.O. Box 5969, Safat 13060, Kuwait
9
Ministry of Agriculture, Petra Agriculture Directorate, Ministry of Agriculture, Petra, Jordan
*
Author to whom correspondence should be addressed.
Horticulturae 2024, 10(1), 26; https://doi.org/10.3390/horticulturae10010026
Submission received: 31 October 2023 / Revised: 5 December 2023 / Accepted: 7 December 2023 / Published: 27 December 2023

Abstract

:
The beneficial application of silver nanoparticles and biostimulants to increase crop yield and quality is a long-term strategy to achieve desired agricultural productions that are resilient to various biotic and abiotic challenges. This project aimed to evaluate the individual effects of silver nanoparticles (AgNPs), Ascophyllum nodosum (SEW), and Spirulina platensis (SP) on the growth and physiological responses of Santolina chamaecyparissus. S. chamaecyparissus plants were exposed to AgNPs (20, 40, and 60 mg L−1), SWE (0.5% and 1%), and SP (1%, 2%, and 3%). The finding indicates that the light-harvesting efficiency and plant photochemical capacity are not affected by most treatments except for 60 mg L−1 AgNPs. Furthermore, the pattern of H2O2 levels in leaves was significantly higher after AgNP, SP, and SEW treatments. In parallel, total phenolic production was at least accompanied by a burst in H2O2 levels. However, higher antioxidant activity compared to the control, is shown by the higher free-DPPH-radical inhibition that goes completely smoothly with lower H2O2 levels. Thus, the results of the present study showed that biostimulants overall improved the antioxidant activity of S. chamaecyparissus and induced variable detectable amounts of phenolic compounds in response to the concentrations of each biostimulant.

1. Introduction

Santolina chamaecyparissus is a dense and attractive dwarf shrub native to the Mediterranean region and a member of the family Asteraceae. The greyish foliage and yellowish flowers of the plant make it attractive as an ornamental presence in gardens [1,2]. The pharmaceutical uses of the plant include its potential use as an anticancer, antioxidant, antidiabetic, antimicrobial, and anti-inflammatory agent [3,4,5,6]. The biological activities of S. chamaecyparissus can be attributed to its chemical constituents, which have been analyzed in flowers, leaves, and shoots of wild-grown and micro-propagated plants [2,3,7,8]. Essential oils from aerial parts of Saudi S. chamaecyparissus were particularly rich in curcumene, alpha-bisabolol during spring, and caryophllene oxide and limonene diepoxide during the summer season [2]. Analyses of the ethyl acetate extract of S. chamaecyparissus showed that 44 compounds were identified, of which tetrapentacontane constituted the main compound, 27.15% [3]. Essential oils from the foliage of S. chamaecyparissus plantlets grown in vitro were harvested using a Clevenger-type apparatus and then collected in benzene to analyze their major constituents [8]. According to that study, 25 compounds were identified, of which monoterpene hydrocarbons, oxygenated monoterpenes, sesquiterpene hydrocarbons, and oxygenated sesquiterpenes were the main groups of phytoconstituents. The antioxidant activity of the essential oils of S. chamaecyparissus, in particular, led researchers to incorporate it into the chocolate industry to improve its nutritional value and to provide a new acceptable aroma and sensory qualities of dark chocolate [9]. Coatings that confer enhanced antifungal protection for Manchego cheese were developed containing industrial residues of S. chamaecyparissus [10]. Hence, the biological activities of the phytoconstituents in herbs such as S. chamaecyparissus made them good candidates for the production of functional foods [11].
Biostimulants and biotechnological tools have recently gained more attention to increase plant growth, introduce high-value crops, and secure more environmentally safe food that has more nutritional value and/or more metabolite content [12,13,14]. Natural bio-stimulants include microorganisms as well as a variety of substances such as humic acids, protein hydrolysates, and fulvic acid that can improve physiological processes of the plant, nutrient absorption and defense mechanisms against stress conditions, and thus enhance plant growth and development [15,16]. Other categories of biostimulants that are worth testing further include seaweed extracts (SEWs), which are a group of macroalgae, and Spirulina platensis (SP), which is a cyanobacterium [16,17]. Biotechnological applications have been expanding recently to include the green synthesis of metallic nanoparticles as well as the synthesis of Ag nanomaterials from plant extracts [18]. Nanoparticles were reported to enhance growth, leaf health and greenness, pigmentation, antioxidant enzymes, and the vase-life of flowers [19,20]. Therefore, the objective of the study was to explore the effects of using different concentrations of SEW and SP extracts and green-synthesized silver nanoparticles on the phytochemical constituents and potential biological activities of S. chamaecyparissus, including antioxidant and antimicrobial effects.

2. Materials and Methods

2.1. Plant Material and Growth Conditions

S. chamaecyparissus samples were grown under controlled conditions (14 h under ~80 µE light at 21 °C/10 h in the dark at 20 °C; 55–60% relative humidity) in soil culture of 2/1/1 (v/v/v) mixture of peat moss, perlite, and vermiculite. After two weeks of growth, the plants were either irrigated with one of the biostimulants for the next 10 days or kept in the plant growth chamber under previously specified controlled conditions as control experiments.

2.2. Biostimulants Treatments

Treatment with biostimulants included Ascophyllum nodosum, seaweed extracts (SEWs) (0.5, 1%), Spirulina platensis (SP) (1, 2, and 3%), AgNPs (20, 40, and 60 mgL−1). S. chamaecyparissus plant samples were irrigated three times per week for up to 10 days with each specific plant biostimulant. Control samples were irrigated with tap water three times a week for up to 10 days under controlled growth conditions. At the end of each specific plant biostimulant treatment, leaves collected from the treated plants were directly frozen in liquid nitrogen and stored at −80 °C until a further analysis of H2O2, chlorophylls and carotenoids, total phenolics, and antioxidant activity. Untreated control plants were grown in parallel with treated plants.
The remaining plants from each treatment were transplanted into 15 cm pots containing a peat moss/perlite mixture in a 2:1 ratio and grown for up to 3 months under greenhouse conditions. The established mother plants were acclimatized for up to 2 weeks and then received the same corresponding treatment to which they were assigned in the plant growth chamber. Each plant was treated four times at 15-day intervals with 100 mL of the corresponding initial treatment. At the end of the 3-month growing period in the greenhouse, the leaves were collected and stored as mentioned above, and the extracts were tested against selected pathogens.

2.3. Quantifying Hydrogen Peroxide (H2O2) Levels

The H2O2 content in leaf samples was determined as described by [21]. Frozen leaf material (~0.1 g) was homogenized in 0.1% trichloroacetic acid (TCA) on ice, followed by centrifugation at 15,000× g for 15 min at 4 °C. The supernatant (0.5 mL) was mixed with 0.5 mL of pH 7.0 potassium phosphate buffer and 1 mL of 1 M KI. The assay mixture’s absorbance was read at 390 nm, and H2O2 content was calculated from a standard curve.

2.4. Quantification of Chlorophylls and Carotenoids

Chlorophyll and carotenoid measurement, following [22], involved grinding 20 mg of leaf samples in 1 mL of 80% acetone, incubating for 1 h in darkness, and centrifuging at 13,000 rpm for 10 min at 4 °C. The supernatant was read at 646.6 and 663.6 nm.

2.5. Antibacterial Activity

The following microorganisms were used in bioactivity assays
OrganismAccession Number
Gram-negative bacteria
Escherichia coliATCC 25922
Pseudomonas aeruoginosaATCC 27853
Gram-positive bacteria
Bacillus subtilisATCC 6633
Staphylococcus aureusATCC 43300
Bacillus cereusATCC 11778
The antibacterial activities of crude extracts from different parts of the plant were evaluated by agar diffusion tests according to the guidelines of the Institute of Clinical and Laboratory Standards (CLSI, 2012). Mueller-Hinton agar plates were seeded with overnight cultured test bacterial strains at a cell density of 106 bacterial cells/mL. Different concentrations of the tested extracts were applied to sterile blank discs (6 mm) which were placed on the surface of seeded Mueller Hinton agar plates. Antibacterial activities were determined by measuring the inhibition zones produced after the plates had been incubated for 24 h at the required temperature. The experiment was performed in triplicate, and the results represented the mean value.

2.6. Sample Preparation for Antioxidant Determination

The sample was weighed and dried in the oven at a temperature of 60 °C overnight, then weighed and ground with a food mill, and for every 1 g 25 mL of methanol was placed in a shaker water bath for an hour at a temperature of 60 °C. After that, the solution was filtered, and the supernatant was kept for further analysis.

2.7. Determination of Total Phenolic Content

The phenolic content is determined with the Folin–Ciocalteu method [23] with minor modifications. In total, 0.1 mL of the sample is mixed with 8.4 mL of distilled water and 0.5 mL of the Folin–Ciocalteu reagent, vortexed for 4 min. Then, 1 mL of a 5% sodium carbonate solution is added, and the mixture is left for 1 h in the dark. Absorbance is measured at 725 nm using a UV spectrophotometer (UV 1800, Biotech Engineering Management Co., Ltd., UK). Phenolic content is expressed as mg of gallic acid equivalents per gram of dry matter (mg GAE/g), with gallic acid stock at concentrations of 0, 0.25, 0.50, 0.75, and 1.0 mg mL−1.

2.8. Determination of Antioxidant Activity

Antioxidant activity (A.A) was determined with the DPPH (1,1-diphenyl-2-Picryl-Hydrazyl radical) method which is described by [24]. Where, 3.9 mL of 6 × 10⁻⁵ mol L−1 of DPPH solution which was prepared by (2.4 mg of DPPH in 100 mL of methanol) was mixed with 0.1 mL of the extracted sample, after the mixture was set in a dark place for 30 min at room temperature, the absorbance (A) of the color was measured at 515 nm using a spectrophotometer (Spectrophotometer-UV 1800, Biotech Engineering Management Co., Ltd., UK), at time 0 and 30 min. Antioxidant activity was calculated according to the following equation:
% antioxidant activity = (1 − [(Abs of sample t = 30)A/(Abs of control t = 0)B]) × 100.
A: is the absorbance of the sample at 30 min.
B: is the absorbance of the control at 0 min.

2.9. Reverse Phase High-Performance Liquid Chromatography (RP-HPLC) Analysis for Phenolic Compounds

Phenolic extracts were dried under a stream of nitrogen and then dissolved in 1 mL of methanol and stored at −18 °C for the RP-HPLC analysis. Standards of phenolics (5 μg) were dissolved in 1 mL of methanol and stored at −18 °C. The RP-HPLC analysis was performed according to a modified procedure of [25,26] with a UHPLC (Thermo Scientific Ultimate 3000, USA), liquid chromatography equipped with a Programmable Solvent Module for high-pressure solvent delivery, an autosampler model (WPS-3000), a column oven model (TCC-3000), a pump model (LPG-3400SD), and a programmable diode array detector (DAD). Spectral and chromatograph analyses were analyzed with the Chromeleon software (c) Dionex Version 7.2.10.23925, translated into PRN format for the manipulation of Microsoft Excel, and stored on a disc. For chromatographic separation, 20 μl of the sample described in the section was injected into a reversed phase Phenolic Venusil SCX-C-18 column (pore size of 5 μm, 250 × 4.6 mm i.d, USA) operated at room temperature. The sample was eluted at a flow rate of 0.75 mL/min with the following two-buffer gradient system: solvent A, 0.2% TFA in water (v/v); solvent B, 100% methanol (with a linear gradient starting at 5% to 80% methanol in 58 min, and the initial conditions were then re-established over 10 min). The phenolic compounds in the extract were monitored at 280 nm. The identification and quantification of phenolic compounds were determined by comparing the retention time of the prepared standard phenolic compound solutions with the retention time from the collected data for the samples after each run.

2.10. Statistical Analysis

For all experiments, samples were analyzed and all assays were carried out in three independent replicates (n = 3). Results were expressed as mean ± SD. The SAS software was used to perform analyses of variance (ANOVA) on the data, and the Tukey-Kramer range test was used to compare the treatment means at the 0.05 significance levels. (p ≤ 0.05). The principal component analysis (PCA) was performed using JMP version 9.0 (SAS Institute Inc., USA).

3. Results

3.1. Chlorophylls and Carotenoids Content of S. chamaecyparissus Leaves

The application of different biostimulants resulted in a reduction in total chlorophyll content, in particular, at Chl a content rather than Chl b content in response to an increased AgNP dose and SP at 2% and 3% treatments (Figure 1). Nevertheless, the ratio of Chl a/Chl b even reflects a slight reduction in comparison to the control and still keeps a high ratio except for plants treated with 60 mg L−1 of AgNPs, which significantly recorded the lowest ratio at all treatments (Table 1). In contrast, carotenoid content was reduced in response to the treatment of mainly an increased AgNP dose (Figure 2). However, the Chl/Car showed the least reduction compared to the control content in response to SP at 2% and 3% treatments (Table 1).

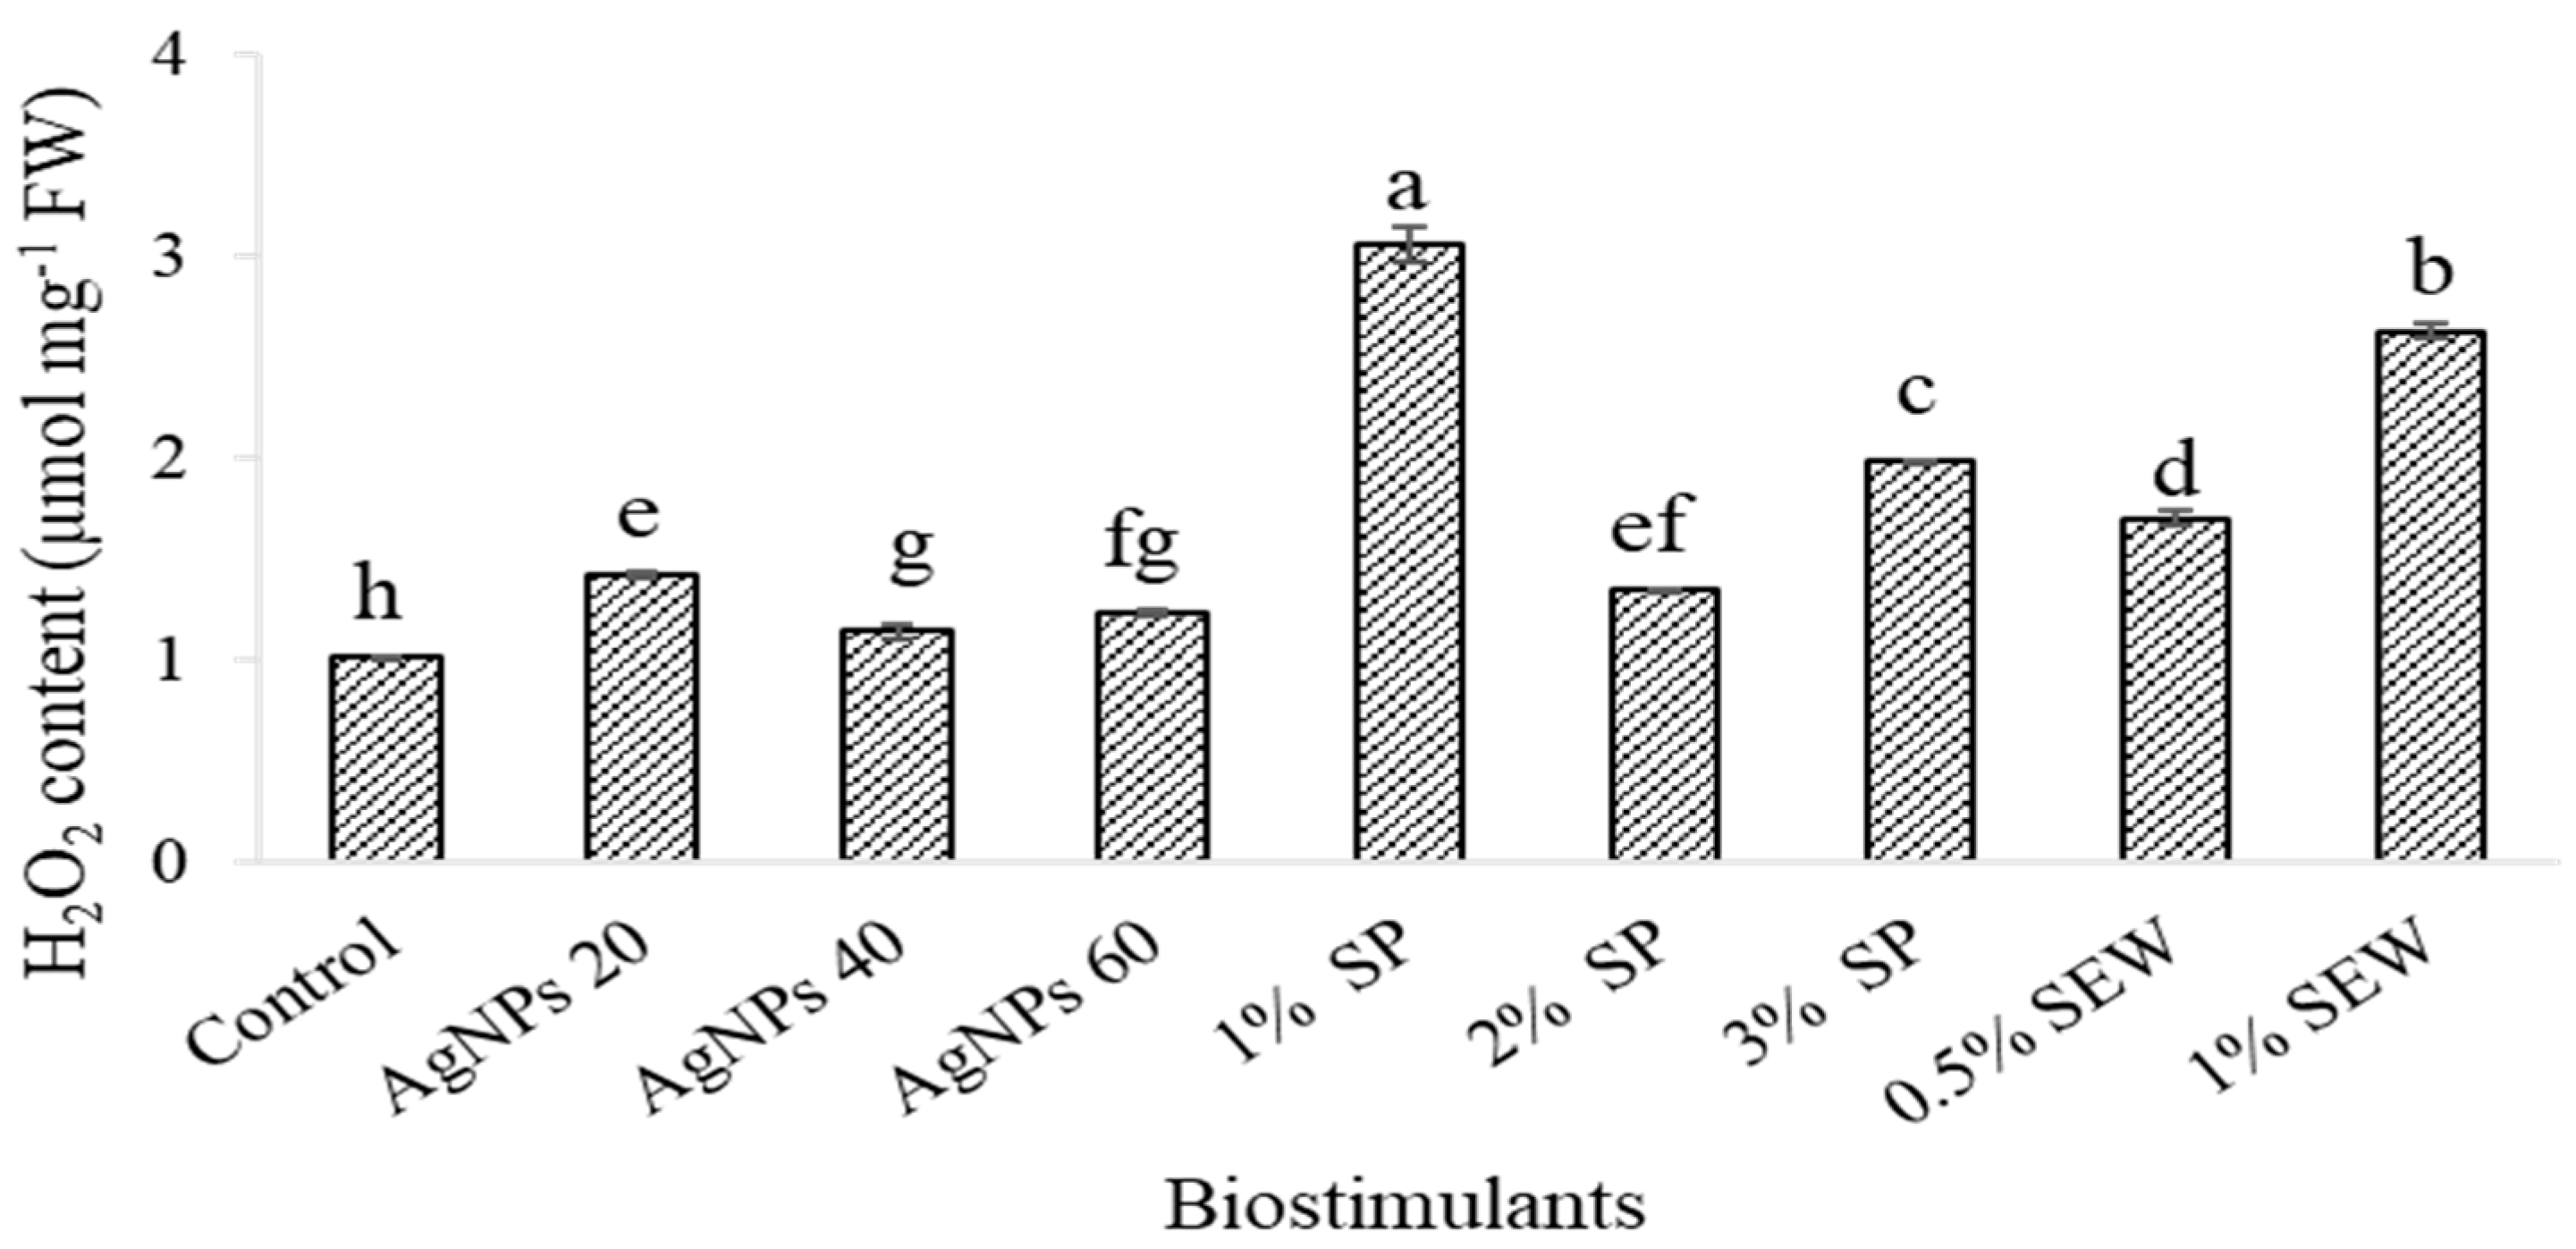
3.2. H2O2 Content in Leaves of S. chamaecyparissus

Figure 3 shows the effects of different biostimulant treatments on H2O2 content in the examined leaves of S. chamaecyparissus. H2O2 levels in leaves increased depending on the type of biostimulant treatment. The pattern of H2O2 levels was significantly higher following AgNPs, SP, and SEW treatments. The H2O2 levels in AgNPs-treated plants were 1.4-, 1.1-, and 1.2-fold higher than those in untreated plants after 20, 40, and 60 mg L−1 of treatment, respectively. However, significant changes in H2O2 production after SP at 1%, 2%, and 3% treatment were observed. The H2O2 level peaked and was 3-, 1.3-, and 2-fold higher than the H2O2 level in control plants respectively. H2O2 levels increased in SEW treated plants by 1.7-fold and 2.6-fold compared to H2O2 levels in control plants after 0.5% and 1% treatment, respectively.

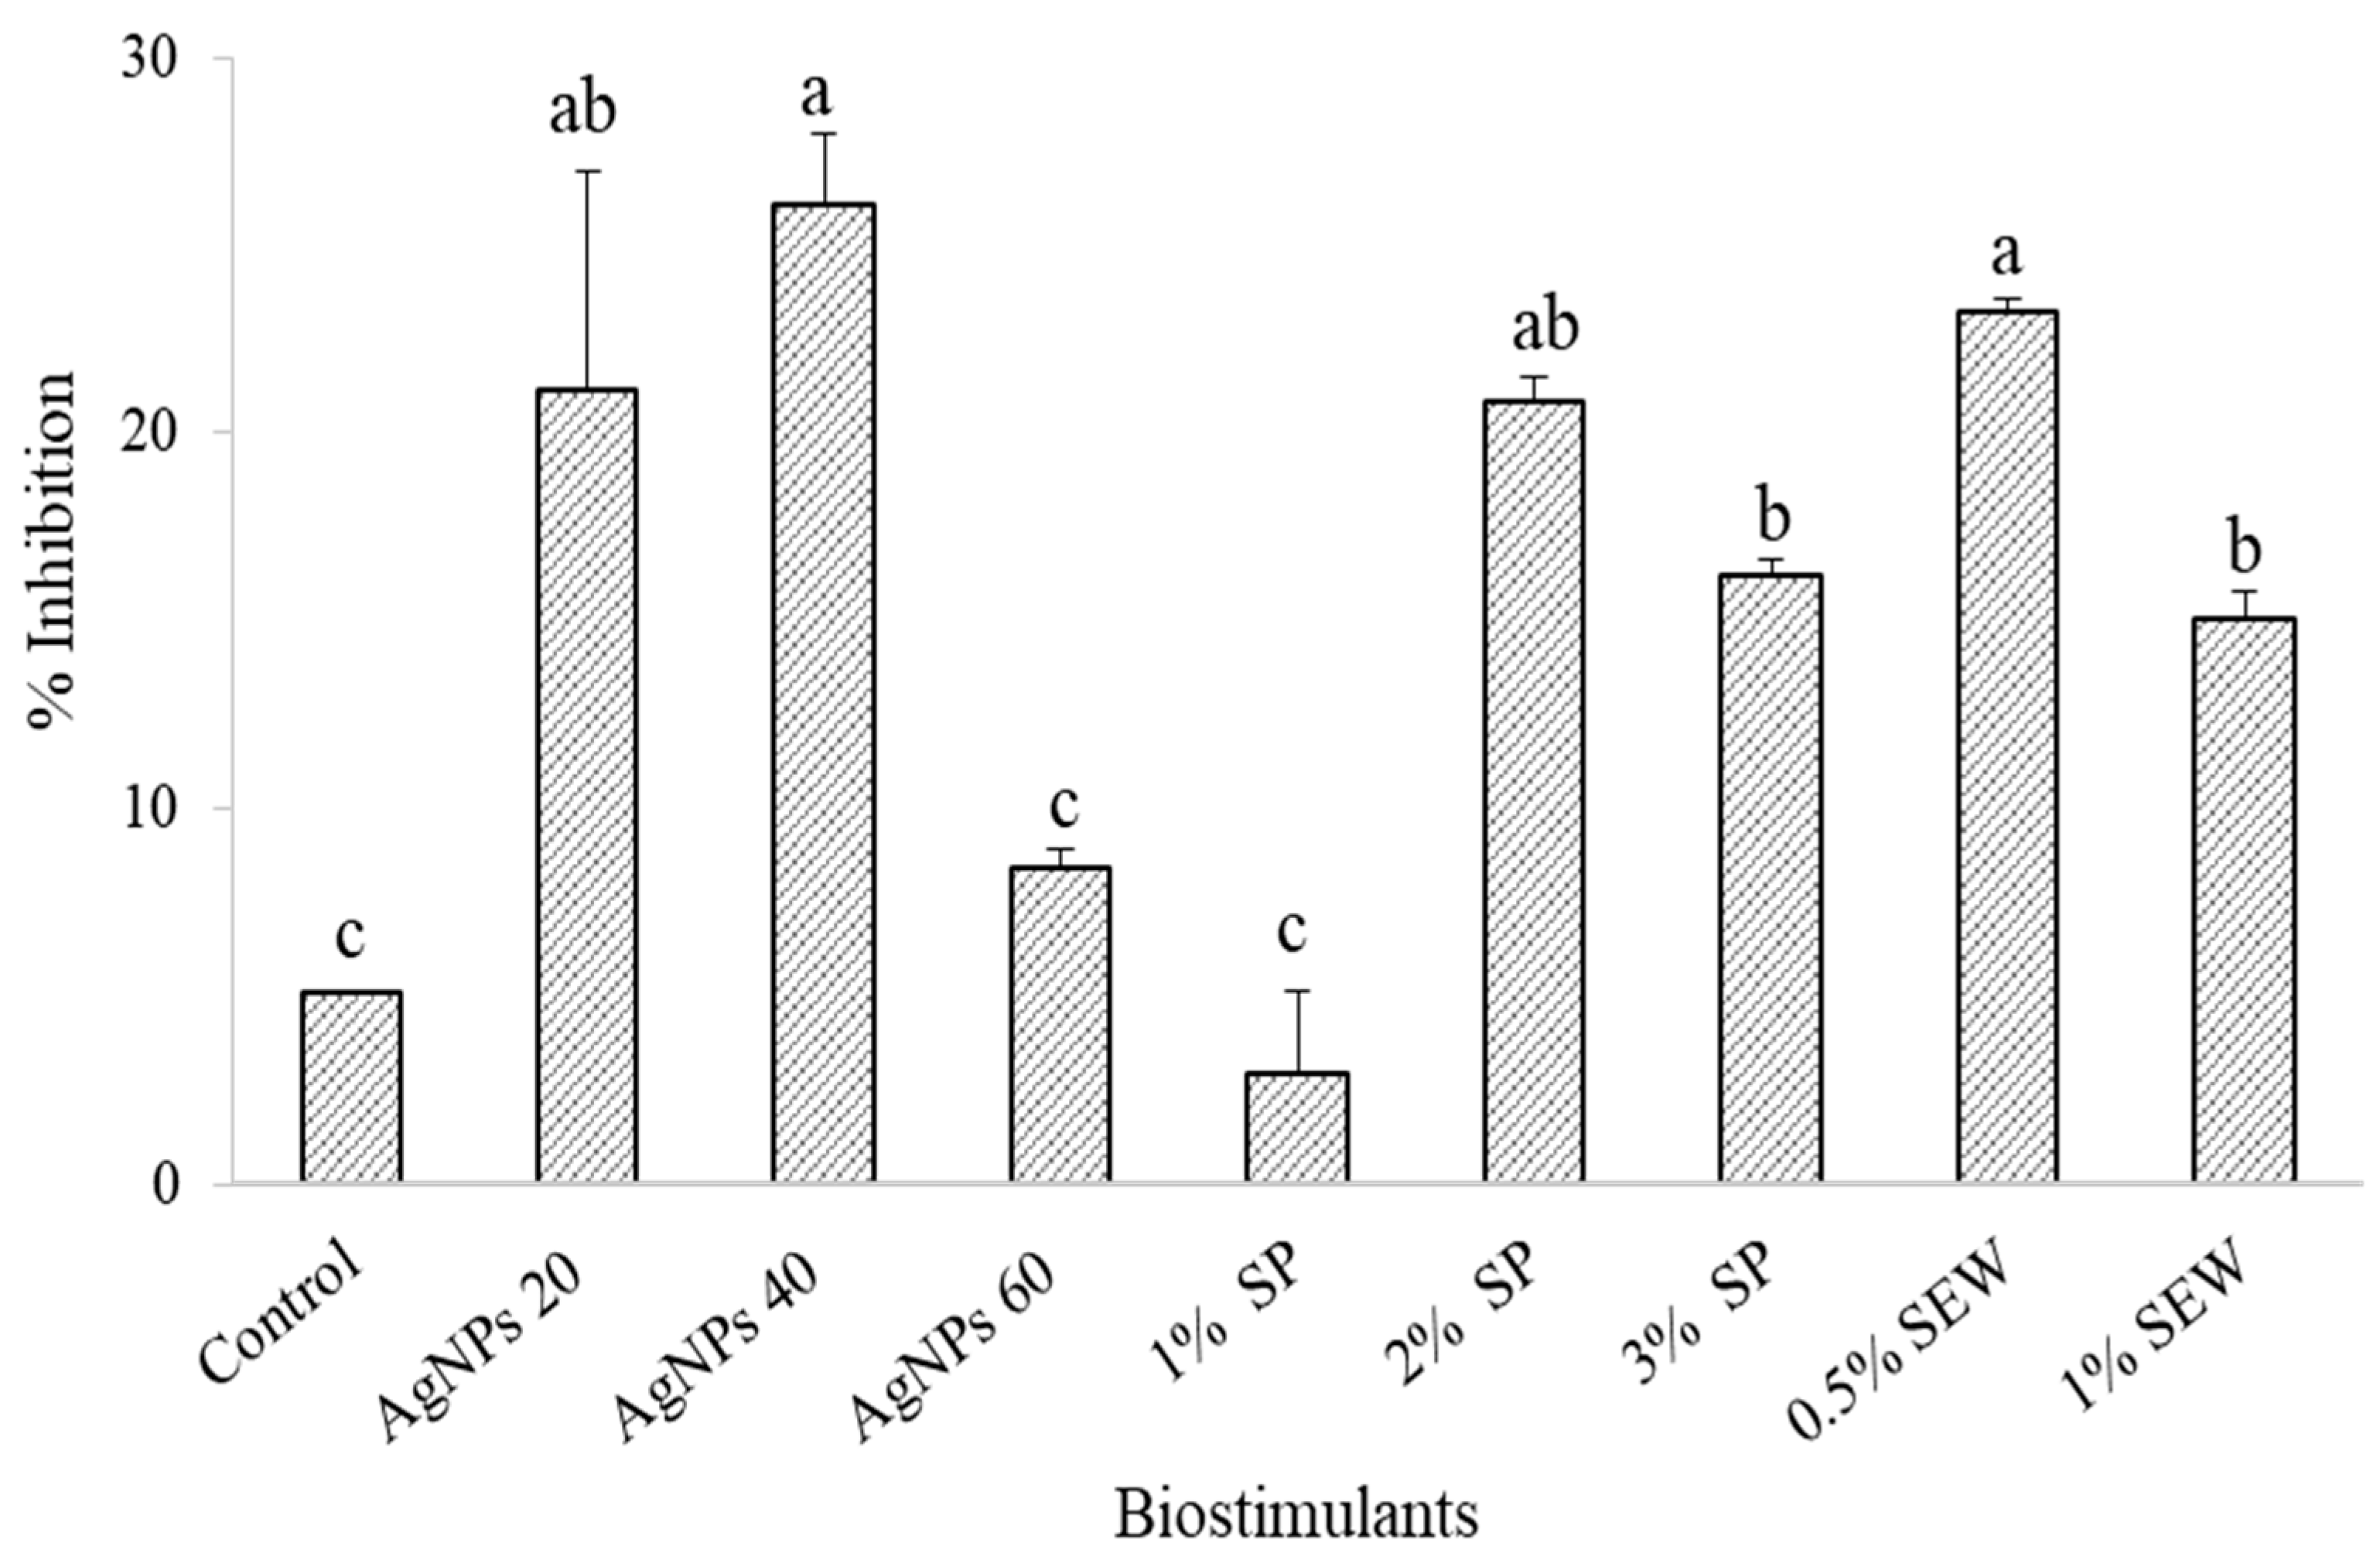
3.3. Chemical Profile and Biological Activity

Except for SEW at 0.5%, the production of total phenolics in the nontreated control plants significantly out-yielded the various biostimulant treatments (1273.2 and 1322.2 mg GA 100 g−1 in the control and 0.5%-SEW-treated plants, respectively) (Figure 4). Plants treated with 60 mg L−1 of AgNPs, SEW at 1%, and SP at 1% significantly recorded the lowest phenolic content (397.4, 812.4, and 907.2 mg GA 100 g−1) (Figure 4). AgNPs at 20 and 40 mg L−1 significantly resulted in higher antioxidant activity compared to the control, as shown by the higher inhibition (21.1%, 26.1%, and 5%, respectively) (Figure 5). Results also showed that SP at 2% and 3%, but not at 1%, and SEW at 0.5% and 1% triggered a significantly higher free radical inhibition compared to the control (20.8, 16.2, 23.2, 15.0, and 5.1% corresponding to SP2%, SP3%, SEW0.5%, SEW1%, and control, respectively) (Figure 5). Inhibition of free DPPH radicals and antioxidant activities followed a relatively similar trend within the various levels of each biostimulant, where the lowest phenolic contents and antioxidant activity resulted from plants treated with 60 mg L−1 of AgNPs, SP at 1%, and SEW at 1% (Figure 4 and Figure 5). Phenolic compounds using the specified standards in this study clearly demonstrated the effects of biostimulants applied on the plant biochemical profile of S. chamaecyparissus (Table 2). Of the phytoconstituents screened in the present study, those that can be detected using the HPLC technique in the control plants were gallic acid, quercetin, and thymol. In total, 20 and 40 mg L−1 of AgNPs hardly affected the levels of compounds in the treated plants where only an amount of 13.1 μg g−1 of thymol was detectable among the screened standards in response to 40 mg L−1 of AgNPs. The rest of the treatments (60 mg L−1 of AgNPs, SP at 1%, 2%, and 3%, and SEW at 0.5% and 1%) were more responsive to induce detectable amounts of variable magnitudes of the screened compounds. However, gallic acid, catechin, chlorogenic acid, epicatechin, syringic acid, and sinapic acid were not detected in plants treated with SEW at 0.5% and 1% (Table 2).
The concentration of phenolic compounds peaked in the leaves of plants using different treatments: gallic acid, 14.2 μg g−1 using 60 mg L−1 of AgNPs; 2,3-dihydroxyphethyl alcohol, 63.2 μg g−1 using SP at 3%; catechin, 49.2 μg g−1 using 60 mg L−1 of AgNPs; 2-hydroxyphenethyl alcohol, 37.7 μg g−1 using SP at 3%; chlorogenic acid, 29.6 μg g−1 using SP at 3%; vanillic acid, 18.0 μg g−1 using SP at 3%; epicatechin, 36.4 μg g−1 using SP at 3%; caffeic acid, 23.3 μg g−1 using SP at 2%; syringic acid, 6.7 μg g−1 using SP at 3%; p-coumaric acid, 38.8 μg g−1 using SP at 3%; sinaptic acid, only produced using SP at 1%, 45.0 μg g−1; Ferulic acid, 32.1 μg g−1 using SP at 3%; rutin, 263.2 μg g−1 using SP at 2%; rosmarinic acid, 65.7 μg g−1 using 60 mg L−1 of AgNPs; quercetin, 187.3 μg g−1 using SP at 3%; and thymol, 208.6 μg g−1 using SP at 3% (Table 2).

3.4. Potential Antimicrobial Effects

The bacteria strains showed variable responses to the plant extracts of S. chamaecyparissus treated with various doses of the biostimulants (Table 3). B. subtilis, S. aureus, and P. aeruginosa did not exhibit activity in response to plant extracts derived from the three types of plants treated with biostimulants. On the other hand, the Gram-positive B. cereus responded to plants derived from 40 and 60 mg−1 L of AgNPs with a smaller zone of inhibition than in the Gram-negative E. coli. The highest response was obtained using 500 µg−1 mL of S. chamaecyparissus leaf extracts derived from plants subjected to 60 mg−1 L of AgNPs (23.3 and 28.3 mm corresponding to B. cereus and E. coli, respectively). For E. coli, inhibition was also induced by leaf extracts of the control and plants treated with a SEW at 1%, with a higher inhibition zone using the 500 rather than 300 µg−1 mL extract. SP was effective in the inhibition of B. cereus at 1% more than at 2%, with a higher response being observed at the 500 than at the 300 µg−1 mL extract.

3.5. Principal Component Analysis (PCA)

PC 1 accounted for 60.5% and PC 2 accounted for 31.6% of the variation (Figure 6, Supplementary File). Treatments B and C were clustered very close to control (A), indicating that low levels of Ag have minimal effects on our phenolic compounds. On the other hand, plants that were treated with higher levels of Ag (D) clustered far from the control, indicating significant effects on our plant phenolic compounds. Plants treated with higher levels of Ag were higher in most phenolic compounds compared to control (A). The plants treated with SP3 (i) clustered at the right top of the biplot and were higher in most phenolic compounds, especially quercetin and thymol (Supplementary File). On the other hand, plants treated with SP2 (H) clustered at the left top of the biplot and were dramatically higher in rutin (Supplementary File). Treatments G, F, and E were also separated from the controls and clustered in the middle of the PCA plot, indicating that they were different from the controls.

4. Discussion

The application of biostimulants (SEW and SP) and AgNPs as growth stimulators enhanced various plant growth parameters, metabolites, phytohormones, and photosynthetic pigment content and improved resilience to abiotic stress in several crops. These positive effects were achieved when biostimulants were introduced as foliar applications at very low concentrations (SEW, <0.3%; SP, <0.9%; and AgNPs, <10 ppm %) [27,28,29,30]. The soil applications of this study with high concentrations reflect the reduction in photosynthetic pigment contents. However, our detection of the pigment ratio indicates the evaluation of the Chl a/Chl b ratio, and also the total chlorophyll to total carotenoid ratio, which is an indicator of the light harvesting efficiency and indicated that the photochemical capacity was not affected in most treatments except for 60 mg L−1 of AgNPs. Moreover, the levels of carotenoids are regarded to participate in suppressing the oxidation caused by treatments that lead to oxidative stress [18].
H2O2 levels in leaves of S. chamaecyparissus changed variably depending on the type of biostimulant treatment (Figure 3). Treating plants with AgNPs, SP, and SEW caused significantly higher H2O2 levels than in control plants with the highest response being observed at 1% SP and 1% SEW. According to reports, variable plant species exposed to AgNPs experienced dose-dependent increases in H2O2 levels [31,32,33]. Our findings, however, show a minor change in H2O2 levels in the relevant dosages of AgNPs that do not manifest a toxic effect or cause oxidative stress, which may be attributed to various phytochemicals present in the plant.
The treatment with SP at 3% was notably beneficial in obtaining the highest magnitude for 10 compounds out of the 16 phenolic compounds screened (Table 2). Many of the standards screened in leaf methanolic extracts in the present investigation were not detected in the control probably because determination involved using HPLC analyses in the current investigation, which is less sensitive than using GC-MS or HPLC-tandem mass spectrometry. However, our method was successful in elucidating the influence of the use of biostimulants on the enhancement of phenolic and antioxidant compound production in the current study. Previous studies showed that extracts of essential oil of this plant or prepared by dissolving in organic solvents were found to be a rich source of phytochemicals. The main constituents of the essential oil were mono- and sesquiterpene [34] analyzed the ethyl acetate extracts of the leaves of S. chamaecyparissus and found that major bio-constituents were tetrapentacontane (27.15%), eicosyl acetate (8.40%), 2-methylhexacosane (6.87%), and n-pentadecanol (5.44%) [3].
The favorable effects of biostimulants on plant physiology are well documented. Ascophyllum nodosum caused an increase in antioxidant activity, phenolics, chlorophyll, and flavonoid content of spinach plants in vitro [35]. Foliar spray of Spirulina platensis when combined with compost affected oil bioconstituents from fennel plants [36]. Cardoon plants were sprayed with various concentrations of algal extracts, of which S. platensis exhibited an enhanced growth, and a modified chemical profile: more carbohydrates and total flavonoids, and higher antioxidant activity [37]. Phenolic compounds, vanillic, chlorogenic, and caffeic acid, responded positively in the above-mentioned study to algal extracts of Chlorella vulgaris and Amphora coffeaeformis at 2 to 3 g L−1, whereas in partial agreement, S. chamaecyparissus leaves in the present study contained the highest amounts of the three phenolics in response to the only algal extract used, S. platensis at 2–3%. Nanomaterials have been reported to modify the environment of plants by provoking antioxidant enzymes, enhancing leaf health (photosynthetic pigments), total phenolics, proteins, and proline content [38]. The present results showed that phenolics contributed to the antioxidant activity of the biostimulants, though they were not correlated, but it was controversial for the control plants, where high phenol content, low inhibition of free DPPH radicals (Figure 4 and Figure 5), and high carotenoid content were observed. Non-measured secondary metabolites in the current study such as flavonoids, ascorbic acid, and anthocyanins may provide more explanations for this gap if investigated in future studies. The authors of [39] designed models to analyze the contribution of designated polyphenolics to the antioxidant activity in wine and found that similar constitutes to the present study as vanillic acid, catechin, quercetin, syringic acid, and gallic acid were correlated to antioxidant activity. The remaining compounds in that study did not correlate to the antioxidant potential. In fact, the polarity and structure of phytoconstituents in a plant extract will affect their synergetic influence and thus their part in the antioxidant potency [40,41]. Thus, the results of the present study showed that biostimulants improved overall the antioxidant activity of S. chamaecyparissus and induced variable detectable amounts of phenolic compounds in response to the concentrations of each biostimulant, a result that can be further exploited by examining their potential biological activity as microbial agents.
Plant extracts of S. chamaecyparissus treated with various doses of the biostimulants induced variable responses on bacterial strains (Table 3). While B. subtilis, S. aureus, and P. aeruginosa showed no activity in response to the plant-derived extracts, AgNP-derived plant extracts at 40 and 60 mg−1 L had antimicrobial activity against B. cereus and E. coli, and SEW at 1% had activity against E.coli. The deleterious effects of AgNPs at the same concentration on E. coli compared to on B. cereus can be explained by the thinner cell wall of the Gram-negative compared to the Gram-positive bacteria [42].

5. Conclusions

In the present study, the impact of different concentrations of SEW, SP, and green-synthesized AgNPs on the phytochemical components and potential biological activities of S. chamaecyparissus was examined. Our findings revealed a dose-dependent improvement in H2O2 content, staying below toxic levels and not inducing oxidative stress. This can be attributed to the diverse phytochemicals present in the plant. Concentrations of biostimulants and AgNP treatments influenced antioxidant activity, with the 3% SP treatment notably increasing content for 10 out of 16 phenolic compounds. Overall, biostimulant treatment enhanced S. chamaecyparissus antioxidant activity and induced phenolic compounds based on each treatment’s concentration. Extracts from biostimulant-treated plants showed limited inhibition of bacterial growth, especially in B. subtilis, S. aureus, and P. aeruginosa, while B. cereus responded with a smaller inhibition zone than E. coli to 40 and 60 mgL−1 of AgNPs. The most significant response was observed with 500 µgmL−1 of S. chamaecyparissus leaf extracts from plants treated with 60 mgL−1 of AgNPs. These results underscore the therapeutic potential of S. chamaecyparissus and the positive impact of biostimulants on its biological properties, influenced by treatment concentrations.

Supplementary Materials

The following supporting information can be downloaded at: https://www.mdpi.com/article/10.3390/horticulturae10010026/s1, Figure S1: Principal Component Analysis (PCA) and its associated biplot showing the distribution of 314 phenolic compounds using different biostimulants. The following labels were used for the treat- 315 ments: a for control, b for AgNPs 20, c for AgNPs 40, d for AgNPs 60, e for 0.5% SEW, f for 1% SEW, 316 g for SP1, h for SP2, and i for SP3.

Author Contributions

Conceptualization, E.A.-D.A.-R. and K.Y.A.; methodology, E.A.-D.A.-R., K.Y.A., T.R., A.M.G. and M.H.A.; software, K.Y.A. and F.A.-R.; validation, E.A.-D.A.-R. and K.Y.A.; formal analysis, K.Y.A. and T.R.; investigation, E.A.-D.A.-R. and K.Y.A.; resources, K.Y.A., T.R., R.J.R., A.M.G. and M.H.A.; data curation, E.A.-D.A.-R. and K.Y.A.; writing—original draft preparation, E.A.-D.A.-R. and K.Y.A.; writing—review and editing, R.J.R., F.A.-R., A.K.S., M.H.A. and M.K.A.; visualization, E.A.-D.A.-R. and K.Y.A.; supervision, E.A.-D.A.-R. and K.Y.A.; project administration, E.A.-D.A.-R. and K.Y.A. All authors have read and agreed to the published version of the manuscript.

Funding

This research received no external funding and was conducted using available resources supplied by Al-Balqa Applied University, Mutah; university: Jordan University of Science and Technology.

Data Availability Statement

The data used are included in the manuscript.

Conflicts of Interest

The authors declare no conflict of interest.

References

  1. Akerreta, S.; Cavero, R.Y.; López, V.; Calvo, M.I. Analyzing factors that influence the folk use and phytonomy of 18 medicinal plants in Navarra. J. Ethnobiol. Ethnomed. 2007, 3, 16. [Google Scholar] [CrossRef] [PubMed]
  2. Elsharkawy, E.R. Anticancer effect and seasonal variation in oil constituents of Santolina chamaecyparissu. Chem. Mater. Res. 2014, 6, 85–91. [Google Scholar]
  3. Ali, A.; Ali, A.; Warsi, M.H.; Ahmad, W.; Tahir, A. Chemical characterization, antidiabetic and anticancer activities of Santolina chamaecyparissus. Saudi J. Biol. Sci. 2021, 28, 4575–4580. [Google Scholar] [CrossRef] [PubMed]
  4. Ahmed, N.; Tahar, D.; Soumia, K.; Dahmane, D.; Mohamed, T.; Lamari, L.; Chabane, C.; Farida, R. Chemical composition, antioxidant and antimicrobial activities of the essential oil of Santolina chamaecyparissus L. of Algeria. J. Coast. Life Med. 2015, 3, 220–227. [Google Scholar]
  5. Bouriche, H.; Moussaoui, S.; Meziti, H.; Senator, A. Anti-inflammatory activity of methanolic extract of Santolina chamaecyparissus. Acta Hortic. 2013, 1098, 23–30. [Google Scholar] [CrossRef]
  6. Djeddi, S.; Djebile, K.; Hadjbourega, G.; Achour, Z.; Argyropoulou, C.; Skaltsa, H. In vitro Antimicrobial Properties and Chemical Composition of Santolina chamaecyparissus Essential Oil from Algeria. Nat. Prod. Commun. 2012, 7, 937–940. [Google Scholar] [CrossRef]
  7. Niu, L.L.; Qin, Q.P.; Wang, L.T.; Gai, Q.Y.; Jiao, J.; Zhao, C.J.; Fu, Y.J. Chemical profiling of volatile components of micropropagated Santolina chamaecyparissus L. Ind. Crops Prod. 2019, 137, 162–170. [Google Scholar] [CrossRef]
  8. Ahuja, A.; Bakshi, S.K.; Sharma, K.S.; Thappa, R.K.; Agarwal, S.G.; Kichlu, S.K.; Paul, R.; Kaul, M.K. Production of volatile terpenes by proliferating shoots and micropropagated plants of Santolina chamaecyparissus L. (cotton lavender). Flavour Fragr. J. 2005, 20, 403–406. [Google Scholar] [CrossRef]
  9. Bölek, S.; Tosya, F.; Akçura, S. Effects of Santolina chamaecyparissus essential oil on rheological, thermal and antioxidative properties of dark chocolate. Int. J. Gastron. Food Sci. 2022, 27, 100481. [Google Scholar] [CrossRef]
  10. de Elguea-Culebras, G.O.; Bourbon, A.I.; Costa, M.J.; Muñoz-Tebar, N.; Carmona, M.; Molina, A.; Sánchez-Vioque, R.; Isabel Berruga, M.; Vicente Vicente, A.A. Optimization of a chitosan solution as potential carrier for the incorporation of Santolina chamaecyparissus L. solid by-product in an edible vegetal coating on ‘Manchego’cheese. Food Hydrocoll. 2019, 89, 272–282. [Google Scholar] [CrossRef]
  11. Azevedo, T.; Faustino-Rocha, A.I.; Barros, L.; Finimundy, T.C.; Matos, M.; Oliveira, P.A. Santolina chamaecyparissus L.: A Brief Overview of Its Medicinal Properties. Med. Sci. Forum 2023, 21, 8. [Google Scholar] [CrossRef]
  12. Yang, Q.; Zhang, A.H.; Miao, J.H.; Sun, H.; Han, Y.; Yan, G.L.; Wu, F.F.; Wang, X.J. Metabolomics biotechnology, applications, and future trends: A systematic review. RSC Adv. 2019, 9, 37245–37257. [Google Scholar] [CrossRef] [PubMed]
  13. Hefferon, K.L. Crops With Improved Nutritional Content Though Agricultural Biotechnology. In Plant Micronutrient Use Efficiency-Molecular and Genomic Perspectives in Crop Plants; Hossain, A.M., Kamiya, T., Burritt, D.J., Tran, L.-S.P., Fujiwara, T., Eds.; Academic Press: Cambridge, MA, USA, 2018; pp. 279–294. [Google Scholar] [CrossRef]
  14. Rouphael, Y.; Colla, G. Toward a Sustainable Agriculture Through Plant Biostimulants: From Experimental Data to Practical Applications. Agronomy 2020, 10, 1461. [Google Scholar] [CrossRef]
  15. Drobek, M.; Frąc, M.; Cybulska, J. Plant Biostimulants: Importance of the Quality and Yield of Horticultural Crops and the Improvement of Plant Tolerance to Abiotic Stress—A Review. Agronomy 2019, 9, 335. [Google Scholar] [CrossRef]
  16. Rouphael, Y.; Colla, G. Biostimulants in agriculture. Front. Plant Sci. 2020, 11, 40. [Google Scholar] [CrossRef] [PubMed]
  17. Godlewska, K.; Michalak, I.; Pacyga, P.; Baśladyńska, S.; Chojnacka, K. Potential applications of cyanobacteria: Spirulina platensis filtrates and homogenates in agriculture. World J. Microbiol. Biotechnol. 2019, 35, 80. [Google Scholar] [CrossRef]
  18. Al-Ramamneh, E.A.-D.M.; Ghrair, A.M.; Shakya, A.K.; Alsharafa, K.Y.; Al-Ismail, K.; Al-Qaraleh, S.Y.; Mojski, J.; Naik, R.R. Efficacy of Sterculia diversifolia Leaf Extracts: Volatile Compounds, Antioxidant and Anti-Inflammatory Activity, and Green Synthesis of Potential Antibacterial Silver Nanoparticles. Plants 2022, 11, 2492. [Google Scholar] [CrossRef]
  19. Salachna, P.; Byczyńska, A.; Zawadzińska, A.; Piechocki, R.; Mizielińska, M. Stimulatory Effect of Silver Nanoparticles on the Growth and Flowering of Potted Oriental Lilies. Agronomy 2019, 9, 610. [Google Scholar] [CrossRef]
  20. Rabiza-Świder, J.; Skutnik, E.; Jędrzejuk, A.; Rochala-Wojciechowska, J. Nanosilver and sucrose delay the senescence of cut snapdragon flowers. Postharvest Biol. Technol. 2020, 165, 111165. [Google Scholar] [CrossRef]
  21. Christou, A.; Manganaris, G.A.; Papadopoulos, I.; Fotopoulos, V. Hydrogen sulfide induces systemic tolerance to salinity and non-ionic osmotic stress in strawberry plants through modification of reactive species biosynthesis and transcriptional regulation of multiple defence pathways. J. Exp. Bot. 2013, 64, 1953–1966. [Google Scholar] [CrossRef]
  22. Porra, R.J. The chequered history of the development and use of simultaneous equations for the accurate determination of chlorophylls a and b. Photosynth Res. 2002, 73, 149–156. [Google Scholar] [CrossRef] [PubMed]
  23. Roy, S.; Hazra, B.; Mandal, N.; Chaudhuri, T.K. Assessment of the antioxidant and free radical scavenging activities of methanolic extract of Diplazium esculentum. Int. J. Food Prop. 2013, 16, 1351–1370. [Google Scholar] [CrossRef]
  24. Brand-Williams, W.; Cuvelier, M.E.; Berset, C.L.W.T. Use of a free radical method to evaluate antioxidant activity. LWT Food Sci. Technol. 1995, 28, 25–30. [Google Scholar] [CrossRef]
  25. Alu’datt, M.H.; Alli, I.; Ereifej, K.; Alhamad, M.; Al-Tawaha, A.R.; Rababah, T. Optimisation, characterisation and quantification of phenolic compounds in olive cake. Food Chem. 2010, 123, 117–122. [Google Scholar] [CrossRef]
  26. Alu’datt, M.H.; Rababah, T.; Alhamad, M.N.; Al-Rabadi, G.J.; Tranchant, C.C.; Almajwal, A.; Alli, I. Occurrence, types, properties and interactions of phenolic compounds with other food constituents in oil-bearing plants. Crit. Rev. Food Sci. Nutr. 2018, 58, 3209–3218. [Google Scholar] [CrossRef] [PubMed]
  27. Mehmood, A. Brief overview of the application of silver nanoparticles to improve growth of crop plants. IET Nanobiotechnology 2018, 12, 701–705. [Google Scholar] [CrossRef] [PubMed]
  28. Arahou, F.; Lijassi, I.; Wahby, A.; Rhazi, L.; Arahou, M.; Wahby, I. Spirulina-Based Biostimulants for Sustainable Agriculture: Yield Improvement and Market Trends. BioEnergy Res. 2022, 16, 1401–1416. [Google Scholar] [CrossRef]
  29. Asadi, M.; Rasouli, F.; Amini, T.; Hassanpouraghdam, M.B.; Souri, S.; Skrovankova, S.; Mlcek, J.; Ercisli, S. Improvement of Photosynthetic Pigment Characteristics, Mineral Content, and Antioxidant Activity of Lettuce (Lactuca sativa L.) by Arbuscular Mycorrhizal Fungus and Seaweed Extract Foliar Application. Agronomy 2022, 12, 1943. [Google Scholar] [CrossRef]
  30. Deolu-Ajayi, A.O.; van der Meer, I.M.; Van der Werf, A.; Karlova, R. The power of seaweeds as plant biostimulants to boost crop production under abiotic stress. Plant Cell Environ. 2022, 45, 2537–2553. [Google Scholar] [CrossRef]
  31. Nair, P.M.G.; Chung, I.M. Physiological and molecular level effects of silver nanoparticles exposure in rice (Oryza sativa L.) seedlings. Chemosphere 2014, 112, 105–113. [Google Scholar] [CrossRef]
  32. Yan, A.; Chen, Z. Impacts of Silver Nanoparticles on Plants: A Focus on the Phytotoxicity and Underlying Mechanism. Int. J. Mol. Sci. 2019, 20, 1003. [Google Scholar] [CrossRef] [PubMed]
  33. Wu, J.; Wang, G.; Vijver, M.G.; Bosker, T.; Peijnenburg, W.J. Foliar versus root exposure of AgNPs to lettuce: Phytotoxicity, antioxidant responses and internal translocation. Environ. Pollut. 2020, 261, 114117. [Google Scholar] [CrossRef] [PubMed]
  34. Garg, S.N.; Gupta, D.; Mehta, V.K.; Kumar, S. Volatile constituents of the essential oil of Santolina chamaecyparissus Linn. from the southern hills of India. J. Essent. Oil Res. 2001, 13, 234–235. [Google Scholar] [CrossRef]
  35. Fan, D.; Hodges, D.M.; Critchley, A.T.; Prithiviraj, B. A commercial extract of brown macroalga (Ascophyllum nodosum) affects yield and the nutritional quality of spinach in vitro. Commun. Soil Sci. Plant Anal. 2013, 44, 1873–1884. [Google Scholar] [CrossRef]
  36. Wafaa, A.E.A.; Hendawy, S.F.; Hamed, E.S.; Toaima, W.I.M. Effect of planting dates, organic fertilization and foliar spray of algae extract on productivity of Dutch fennel plants under Sinai conditions. J. Med. Plants Stud. 2017, 5, 327–334. [Google Scholar]
  37. Amer, H.M.; Marrez, D.A.; Salama, A.B.; Wahba, H.E.; Khalid, K.A. Growth and chemical constituents of cardoon plant in response to foliar application of various algal extracts. Biocatal. Agric. Biotechnol. 2019, 21, 101336. [Google Scholar] [CrossRef]
  38. Maswada, H.F.; Mazrou, Y.S.; Elzaawely, A.A.; Eldein, S.M.A. Nanomaterials. Effective tools for field and horticultural crops to cope with drought stress: A review. Span. J. Agric. Res. 2020, 18, 15. [Google Scholar] [CrossRef]
  39. Soleas, G.J.; Tomlinson, G.; Diamandis, E.P.; Goldberg, D.M. Relative contributions of polyphenolic constituents to the antioxidant status of wines: Development of a predictive model. J. Agric. Food Chem. 1997, 45, 3995–4003. [Google Scholar] [CrossRef]
  40. Farag, M.A.; Abou Zeid, A.H.; Hamed, M.A.; Kandeel, Z.; El-Rafie, H.M.; El-Akad, R.H. Metabolomic fingerprint classification of Brachychiton acerifolius organs via UPLC-qTOF-PDA-MS analysis and chemometrics. Nat. Prod. Res. 2015, 29, 116–124. [Google Scholar] [CrossRef]
  41. Irawaty, W.; Ayucitra, A. Assessment on antioxidant and in vitro antidiabetes activities of different fractions of Citrus hystrix peel. Int. Food Res. J. 2018, 25, 2467–2477. [Google Scholar]
  42. Shrivastava, S.; Bera, T.; Roy, A.; Singh, G.; Ramachandrarao, P.; Dash, D. Characterization of enhanced antibacterial effects of novel silver nanoparticles. Nanotechnology 2007, 18, 225103. [Google Scholar] [CrossRef] [PubMed]
Figure 1. Chlorophyll content (a and b) of S. chamaecyparissus leaves subjected to different biostimulants compared with that of plants grown without any additions (control). Data represent mean values ± SD, n = 3. Different letters denote statistically different means (Tukey’s test; p ≤ 0.05).
Horticulturae 10 00026 g001
Figure 2. Carotenoid content in leaves of S. chamaecyparissus subjected to different biostimulants compared to that of plants grown without any additions (control). The effect with different concentrations of biostimulants in comparison with control. Data represents mean values ± SD, n = 3. Different letters denote statistically different means (Tukey’s test; p ≤ 0.05).
Horticulturae 10 00026 g002
Figure 3. Hydrogen peroxide (H2O2) content of S. chamaecyparissus leaves subjected to different biostimulants compared with that of plants grown without any additions (control). The effect with different concentrations of biostimulants in comparison with control. Data represent mean values ± SD, n = 3. Different letters denote statistically different means (Tukey’s test; p ≤ 0.05).
Horticulturae 10 00026 g003
Figure 4. The phenolic content of S. chamaecyparissus leaves subjected to different biostimulants compared to the plants grown without any additions (control). The effect with different concentrations of biostimulants in comparison with control. Data represent mean values ± SD, n = 3. Different letters denote statistically different means (Tukey’s test; p ≤ 0.05).
Horticulturae 10 00026 g004
Figure 5. Antioxidant activity of the S. chamaecyparissus leaves subjected to different biostimulants compared to that of plants grown without any additions (control). The effect with different concentrations of biostimulants in comparison with control. Data represent mean values ± SD, n = 3. Different letters denote statistically different means (Tukey’s test; p ≤ 0.05).
Horticulturae 10 00026 g005
Figure 6. Principal Component Analysis (PCA) and its associated biplot showing the distribution of phenolic compounds using different biostimulants. The following labels were used for the treatments: a for control, b for AgNPs 20, c for AgNPs 40, d for AgNPs 60, e for 0.5% SEW, f for 1% SEW, g for SP1, h for SP2, and i for SP3.
Horticulturae 10 00026 g006
Table 1. Chlorophyll and Carotenoid ratio of S. chamaecyparissus leaves subjected to different biostimulants in comparison with control. Data represent mean values ± SD, n = 3.
ControlAgNPs, 20 AgNPs, 40AgNPs, 60 1% SP2% SP3% SP0.5% SEW1% SEW
Chl a/Chl b3.51 ± 0.282.56 ± 0.062.24 ± 0.151.67 ± 0.052.25 ± 0.1210.56 ± 1.863.14 ± 0.092.06 ± 0.212.87 ± 0.16
Chl/Caro4.52 ± 0.464.02 ± 0.124.09 ± 0.134.66 ± 0.204.49 ± 0.123.50 ± 0.192.71 ± 0.054.03 ± 0.374.09 ± 0.08
Table 2. Changes in the phenolic compounds of S. chamaecyparissus leaves subjected to different biostimulants quantified by High-Performance Liquid Chromatography (RP-HPLC). Data represent mean values ± SD, n = 3. ND; Not Detected.
Standard/SampleControlAgNPs, 20AgNPs, 40AgNPs, 601% SP2% SP3% SP0.5% SEW1% SEW
Gallic acid14.06 ± 1.12NDND14.16 ± 0.1710.09 ± 0.012.74 ± 0.0812.87 ± 0.22NDND
3,4-Dihydroxyphethyl alcoholNDNDNDND10.09 ± 0.00435.99 ± 0.4663.25 ± 0.7450.34 ± 1.4246.42 ± 5.54
CatechinNDNDND49.24 ± 0.24ND19.78 ± 0.4838.16 ± 0.22NDND
2-Hydroxyphenethyl alcoholNDNDND24.20 ± 0.4714.31 ± 0.627.44 ± 0.1737.73 ± 1.1118.52 ± 1.6018.11 ± 1.59
Chlorogenic acidNDNDNDNDND14.35 ± 0.2629.59 ± 0.42NDND
Vanillic acidNDNDNDNDNDND18.03 ± 0.40ND5.61 ± 1.64
EpicatechinNDNDND14.89 ± 0.19ND9.89 ± 0.2436.36 ± 0.68NDND
Caffeic acidNDNDND17.87 ± 0.09ND23.26 ± 0.2117.14 ± 0.4113.07 ± 2.09ND
Syringic acidNDNDNDNDND1.13 ± 0.076.74 ± 0.21NDND
P-coumaric acidNDNDND24.42 ± 0.3115.95 ± 1.2515.74 ± 0.1438.83 ± 0.8418.66 ± 0.0018.24 ± 1.64
Sinapic acidNDNDNDND45.03 ± 0.23NDNDNDND
Ferulic acidNDNDND16.27 ± 0.1216.27 ± 0.753.07 ± 0.0932.11 ± 1.1014.44± 1.5316.19 ± 1.71
RutinNDNDNDND22.71 ± 2.05263.22 ± 0.12NDND18.77 ± 0.00
Rosmarinic acidNDNDND65.72 ± 0.3855.82 ± 1.15ND37.99 ± 0.66ND57.58 ± 2.06
Quercetin3.87 ± 1.13NDND121.92 ± 0.1747.15 ± 0.742.66 ± 0.09187.26 ± 0.66105.25 ± 1.6349.651 ± 2.06
Thymol23.62 ± 0.94ND13.11 ± 0.11106.74 ± 0.3876.55 ± 0.742.66 ± 0.10208.65 ± 0.4391.82 ± 2.0485.39 ± 1.64
Table 3. Zone of inhibition (mm) of S. chamaecyparissus extract leaves subjected to different biostimulants using disc diffusion method against the tested isolates. NA: No activity.
Conc. (µg/mL)B. cereusB. subtilisS. aureusE. coliP. aeruginosa
Control300NANANA11.33 ± 0.94NA
500NANANA19.33 ± 1.25NA
AgNPs, 20300NANANANANA
500NANANANANA
AgNPs, 4030010.67 ± 1.15NANA20.33 ± 2.05NA
50013.0 ± 0.00NANA24.67 ± 1.69NA
AgNPs, 6030020.0 ± 2.00NANA22± 0NA
50023.33 ± 1.15NANA28.33 ± 1.69NA
1% SP30025.66 ± 0.57NANANANA
50028.0 ± 0.00NANANANA
2% SP30016 ± 2.00NANANANA
50020.33 ± 1.15NANANANA
3% SP300NANANANANA
500NANANANANA
0.5% SEW300NANANANANA
500NANANANANA
1% SEW300NANANA17.66 ± 0.94NA
500NANANA21.33 ± 0.94NA
Disclaimer/Publisher’s Note: The statements, opinions and data contained in all publications are solely those of the individual author(s) and contributor(s) and not of MDPI and/or the editor(s). MDPI and/or the editor(s) disclaim responsibility for any injury to people or property resulting from any ideas, methods, instructions or products referred to in the content.

