Abstract
Bruising is a common occurrence in apples that can lead to gradual fruit decay and substantial economic losses. Due to the lack of visible external features, the detection of early-stage bruising (occurring within 0.5 h) is difficult. Moreover, the identification of stems and calyxes is also important. Here, we studied the use of the short-wave infrared (SWIR) camera and the Faster RCNN model to enable the identification of bruises on apples. To evaluate the effectiveness of early bruise detection by SWIR bands compared to the visible/near-infrared (Vis/NIR) bands, a hybrid dataset with images from two cameras with different bands was used for validation. To improve the accuracy of the model in detecting apple bruises, calyxes, and stems, several improvements are implemented. Firstly, the Feature Pyramid Network (FPN) structure was integrated into the ResNet50 feature extraction network. Additionally, the Normalization-based Attention Module (NAM) was incorporated into the residual network, serving to bolster the attention of model towards detection targets while effectively mitigating the impact of irrelevant features. To reduce false positives and negatives, the Intersection over Union (IoU) metric was replaced with the Complete-IoU (CIoU). Comparison of the detection performance of the Faster RCNN model, YOLOv4P model, YOLOv5s model, and the improved Faster RCNN model, showed that the improved model had the best evaluation indicators. It achieved a mean Average Precision (mAP) of 97.4% and F1 score of 0.87. The results of research indicate that it is possible to accurately and effectively identify early bruises, calyxes, and stems on apples using SWIR cameras and deep learning models. This provides new ideas for real-time online sorting of apples for the presence of bruises.
1. Introduction
Apples, renowned for their high content of vitamins and trace elements, are beloved by people worldwide [1,2]. However, it is well known that apples can sustain surface damage from various impacts during harvesting, transportation, and storage processes. Generally, apples without bruises closely resemble those with bruises in color and texture, especially during the early stages of bruising. This damage occurs the surface of apple, making it challenging to discern with the naked eye. Over time, the injured tissue in apples becomes black and soft, and dries out due to oxidation. If the bruise issues of the apple remain undetected, extensive rot will occur, which not only affects the appearance and flavor of apple, but also risks infecting other healthy apples [3,4], resulting in millions of Euro in loss annually (for example, 10–25% loss in the apple industry of Belgium during transportation) [5,6]. Severe bruising can be identified through manual inspection or machine vision technology [7,8,9]. Due to the lack of visible external features, the detection of early-stage bruising (occurring within 0.5 h) is difficult to detect. Hence, there is a pressing need to develop a precise, convenient, and non-destructive method for early-stage bruise detection of apples.
In recent years, many imaging techniques have been applied to the non-destructive detection of bruises in fruits and vegetables, such as nuclear magnetic resonance (NMR) [10], X-ray imaging technology [11,12,13], and hyperspectral techniques [14,15,16,17,18]. However, the NMR has not been widely used due to its high cost. Additionally, there is some radiation risk in X-ray imaging technology [1]. In contrast, hyperspectral/multispectral imaging technology(H/MSI) [19,20] has gained widespread research attention in bruise detection for fruits and vegetables by simultaneously providing both image information and spectral information. Therefore, HSI can be combined with traditional image processing and machine learning or deep learning methods to achieve bruise detection in apples. Many scholars use hyperspectral imaging techniques in the range of 400–1000 nm, encompassing both the visible and near-infrared spectra. Pan et al. [21] proposed the use of Vis/NIR hyperspectral imaging (400–1000 nm) to classify the bruise time of apples. They studied hyperspectral images of apples during seven bruise stages (0–72 h, at 12 h intervals), selecting feature wavelengths mostly between 700–1000 nm. Then, they employed a random forest (RF) model to identify bruised areas with an accuracy of 92.86%. Ferrari et al. [22] investigated two apple varieties “Golden Delicious” and “Pink Lady” in hyperspectral imaging (400–1000 nm) to detect early bruising and achieved detection rates of 92.42% and 94.04%, respectively. Gai et al. [23] classified apple bruise regions using the improved CNN model with a hyperspectral imaging system (400–1000 nm), achieving a classification accuracy better than 90%. Tian et al. [24] utilized Vis/NIR hyperspectral images to detect apple bruising. They created an improved watershed algorithm for damage point identification, achieving recognition rates better than 92%. In recent years, deep learning-based target detection techniques [25] have gradually been applied to defect detection in fruits and vegetables due to their high accuracy and fast speed. Fan et al. [26] proposed a pruned YOLOv4, called YOLOv4P (You Only Look Once version 4 Pruned) for bruise detection. The results showed that the mAP of YOLOv4P reached 93.9% for apple defects. Yuan et al. [27] used a combination of near-infrared cameras and deep learning object-detection models to detect early bruising in apples. The results showed that the accuracy of YOLOv5s in detecting bruises with different degrees of damage was more than 96%. The results meet the requirements of online real-time detection. In the case of industrial assembly line sorting of apples, it may be sufficient to know whether the apples are damaged or not, without knowing the shape and size of each bruise. For quality control of apples, object detection may provide enough information. Therefore, the object detection model is used to detect apple bruises in this study.
The above research findings of different scholars on apple bruise detection using HSI of wavelengths in the range of 400–1000 nm with machine learning or deep learning algorithms, achieved promising research results. In addition, significant progress has been made in SWIR spectral bands, particularly beyond 1000 nm [28]. Keresztes et al. [29] used a hyperspectral imaging system (1000–2500 nm) to monitor apples within 1 to 36 h after damage under five different impact forces. They selected images at 1082 nm to be templates for region segmentation, where the average spectrum had the strongest contrast to the background, allowing them to distinguish between undamaged and bruised apple regions. They achieved an average classification accuracy of 90.1%. Siedliska et al. [30] constructed a study to determine bruising in five apple varieties using short-wave infrared hyperspectral imaging technology, and attained a successful classification ratebetter than 93%. Many researchers investigating food quality using the SWIR spectral range have achieved good results in other fruits and vegetables, such as peaches [31], loquats [32], strawberries [33], and potatoes [34]. Therefore, it is also worthwhile to explore early bruise detection in the short-wave infrared spectral range, especially for events that occur within half an hour.
The research mentioned above primarily focused on studying the equatorial surface of apples, without considering the interference caused by the apple’s calyx and stem in the actual production process for detection [18]. This may lead to a decrease in the accuracy of bruise detection in apples. Therefore, the assistance of fast and highly accurate deep learning models could be helpful for bruise detection in apples. Additionally, detecting apple bruising in both the Vis/NIR and SWIR spectra is feasible. However, high-spectral imaging techniques still suffer from disadvantages, such as bulky and expensive equipment and relatively complex data analysis. In contrast, Vis/NIR cameras and SWIR cameras have the advantages of lower cost and less data processing, making them more accessible. Moreover, bruising in apples is relatively sensitive to infrared light, enhancing the ability of both cameras to reveal bruising. Building upon the research conducted by the scholars mentioned above, this study uses a visible/ near-infrared camera with bands ranging from 300 to 1100 nm and a short-wave infrared camera with bands from 950 to 1700 nm to capture images of early apple bruising at different locations (occurring within 0.5 h) for subsequent experimental analysis.
Based on the discussion above, this paper proposes combining Vis/NIR imaging and SWIR imaging techniques with an object detection model for detecting early apple bruising. The main objectives include: (1) An impact device is used to create the bruises on “Red Fuji” apples located near the equator, stem, and calyx regions, then visible/near-infrared and short-wave infrared cameras are used to acquire an early bruise dataset of the apples; (2) A hybrid dataset and the Faster RCNN model are used to assess and validate the effectiveness of SWIR bands in apple bruise detection, comparing it to the performance of Vis/NIR bands; (3) To improve the accuracy of early apple bruise, calyx, and stem detection with the SWIR dataset and the improved model. The improvements, encompassing the Feature Pyramid Network (FPN) structure and Normalization-based Attention Module (NAM), were incorporated into the ResNet50 network, and IoU Loss was replaced by CIoU Loss. and the comparison metrics are original Faster RCNN model, YOLOv4P model, and YOLOv5s model.
2. Materials and Methods
2.1. Experimental Materials
All apples in this study were sourced from a fruit market in Harbin, Heilongjiang, China. Firstly, about 60 “Red Fuji” apples, with 6–8 cm diameter, no noticeable damage, and no insect holes on the surface, were manually selected. Then, all apples were cleaned to remove surface dust and placed in an environment with 25 °C and 75% humidity [23].
2.2. Imaging Systems
The image acquisition system used in the experiment consists of a short-wave infrared camera (BV-C2901-GE, Blue Vision, Yokohama, Japan, 950–1700 nm), a visible/ near-infrared industrial camera (MER-530-20GM-P NIR, DAHENG Imaging, Beijing, China, 300–1100 nm), a light source (four halogen lamps of 60 W), a dark room, a sample carrier, and a computer. A light-blocking cloth with 100% opacity was used to cover the perimeter of the frame, such that light was prevented from affecting image acquisition. The image system configuration, as illustrated in Figure 1, involved manual camera switching throughout the process. To minimize the interference of reflected light on image quality, both the sample mounting platform and the background were made of materials that did not reflect any light.
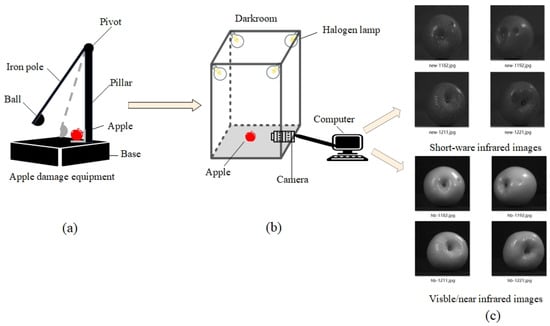
Figure 1.
Flowchart of image acquisition. (a) Impact device; (b) Image acquisition system; (c) Dataset folder.
Before image acquisition, an impact device was used to strike the apples, as shown in Figure 1a, to simulate mechanical damage that apples may incur during harvesting or transportation. The device was composed of a base, a pillar, a pivot, an iron pole, and a ball. The iron pole is 80 cm long and has a mass of 230 g, which can be rotated around a pivot axis. At the end of the iron pole, an iron ball with a diameter of 1.6 cm and a mass of 22 g was fixed.
The bruise operation is as follows: The iron pole was pulled to an angle of either 25°, 40°, or 57° and then was released to strike the apple [21]. The heights of the iron ball from the ground were 7.5 cm, 18.7 cm, and 36.4 cm, respectively. As shown in Figure 2c–e, the impacts at different angles formed circular bruise areas on the apple surface with diameters of 0.5 cm, 0.8 cm, and 1.2 cm, respectively. The area of the bruise is calculated to be about 0.2 cm2, 0.5 cm2, and 1.1 cm2. The “Apple Grade Specification (NY/T 1793-2009)” issued by the Chinese Ministry of Agriculture, was used to classify the bruises as small, medium, and large [27]. According to the formula of the kinetic energy theorem, we obtained the impact energy suffered by the apple at different angles of impact as 0.016 J, 0.040 J, and 0.079 J approximately [35].

Figure 2.
Different apple bruise images. (a) Bruise near the stem; (b) Bruise near the calyx; (c) Small bruise; (d) Medium bruise; (e) Large bruise.
The dataset contains bruises at different locations and different sizes on the apple to diversify the sample, as shown in Figure 2 (captured by the short-wave infrared camera). After the apple was hit, bruise images of the apple were immediately collected. The image collection process was completed by two cameras with different bands, and the dataset was completed through the above operations. Two sets of images were acquired for each apple, encompassing the undamaged surface, distinct regions of the bruised surface (excluding stems and calyxes), stem against the healthy surface, stem against the bruised surface, calyx against the healthy surface, and calyx against the bruised surface. Photographic data were captured from diverse perspectives by altering the shooting angles of the apples. Consequently, a total of 1200 images were obtained for each of the two image sets, contributing to a comprehensive dataset for analysis and evaluation.
Table 1 shows the sum of the number of individual object categories in all of the SWIR dataset counted, with the images taking into account the location of bruises near the equatorial region of the apple, as well as the presence of bruises near the stems and calyxes of the apple.

Table 1.
Number of all categories in the SWIR dataset.
All bruises created in this experiment were early bruises occurring within half an hour, as shown in Figure 3, images of an apple taken by different cameras, with blue boxes marking the locations of the bruises. As shown in Figure 3a, the bruise was practically invisible to the naked eye and indistinguishable from sound tissue. However, in Figure 3b,c, the locations of bruise become distinctly visible.

Figure 3.
Different bruise images on the same apple. (a) RGB image from the CCD camera; (b) Vis/NIR image from the Vis/NIR camera; (c) SWIR figure from the SWIR camera.
The average gray-scale histogram of the 100 SWIR image (selected randomly) of an apple with early bruises is shown in Figure 4. The low gray-scale area is background, the region of the bruise, calyx, and stem has a relatively higher gray value than the background, the normal region occupies the majority of the apple body with the highest number of pixels, and the bright spot region has a grayscale value higher than the sound region. There is a clear distinction between the sound regions and the region of the bruise, calyx, and stem. However, identifying the pixel values corresponding to mixed regions (bruises, stems, and calyxes) within all SWIR images is crucial for detecting early-stage bruises on apples.
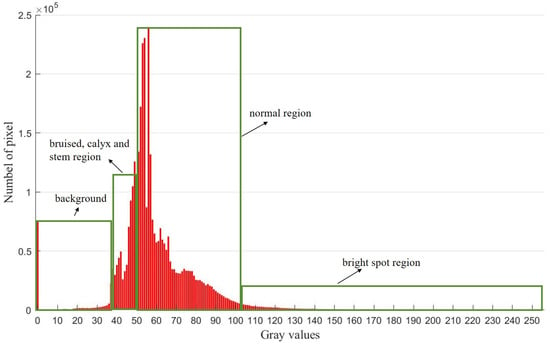
Figure 4.
Gray-scale histogram of the SWIR image of apple with early bruises.
The gray values of the SWIR image (as shown in Figure 3c) and the extracted three component values of RGB image (as shown in Figure 3a) were normalized. Then the gray mean values of the bruised region and the healthy region were calculated to determine the difference values. The above operation was repeated by six groups of apple images and the results are shown in Figure 5. It can be seen that the difference value between the gray values of the bruised region and the normal region of the SWIR images is significantly higher than that of the R, G, and B components, which, side by side, confirms that the RGB images are not suitable for this study.
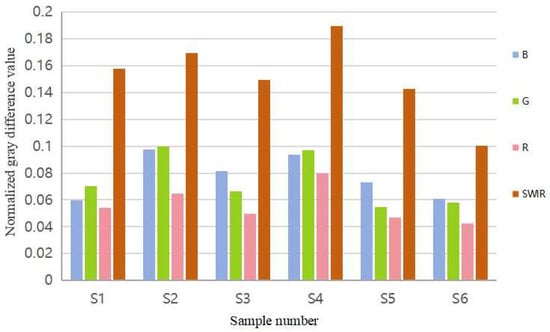
Figure 5.
Normalized gray difference between healthy and bruised areas of apples in different bands.
2.3. Dataset
The dataset consists of two parts: short-wave infrared images (dataset A) captured by the SWIR camera, and Vis/NIR images (dataset B) taken by the Vis/NIR camera. Before detection, the dataset was labeled, including categories such as, stem, calyx, and bruise. This annotation is important for the model to learn effectively. LabelImg was used to annotate both datasets consistently. After annotation, XML files, containing location information and category names for bruise, calyx, and stem in the images, were obtained. This was the preparatory work before model training. To validate the effectiveness of the spectral bands for early detection of bruises on apples, a hybrid dataset approach was used in this experiment.
2.4. Model and Evaluation
In order to rapidly and accurately detect bruises, calyxes, and stems on apples, a Faster RCNN model [36] was established in this experiment. Model optimization was achieved through modifications to the structure of the backbone feature extraction network and loss functions.
Given an input image, the Faster RCNN model resizes the image and extracts features using a feature extraction network. Then, these features are fed into the Region Proposal Network (RPN), which generates anchor boxes for object detection. The anchor boxes are correlated with the feature map to form a feature matrix. Finally, the feature matrix is pooled and passed to the regression and classification module to perform object detection.
The model training process was implemented using a computer with the Windows 10 operating system and a graphics card model NVIDIA GeForce RTX 3060 with 6 GB of video memory. The programming software used was PyCharm Community Edition 2022.2.2, the programming language was Python 3.7.17, and the training framework was PyTorch 1.7.1.
The parameters of the model were set as follows. The optimization algorithm chosen was the SGD algorithm with a momentum of 0.9, weight decay of 0.0001, model confidence of 0.5, non-maximal suppression (nms-IoU) of 0.3, learning rate of 0.005, and batch size of 4.
To evaluate the performance of this model, the following metrics were employed. The loss function is a crucial metric that measures the stability and effectiveness of a model. It quantifies the discrepancy between predicted values and actual values.
The loss function of Faster RCNN consists of classification loss and regression loss functions as shown in Equation (1):
where i is the number of candidate box, pi is the probability of candidate box classification, is 1 when the candidate box is a positive sample and 0 when it is a negative sample, ti is the 4-parameter coordinates of the predicted bounding box, and is the 4-parameter coordinates of the real bounding box.
Lcls(, ) denotes the classification loss that distinguishes between foreground and background with the following Equation (2):
Lreg(, ) denotes the bounding box regression loss with the following equation:
where smoothL1 is formulated as follows:
In this experiment, the AP, mAP, and F1 score were used as the evaluation indexes of the model. Some of these formulas are as follows:
where TP is the number of positive samples predicted to be positive, FP is the number of negative samples predicted to be positive, and TP + FP is the number of samples predicted to be positive, and FN denotes the number of samples in which negative samples were predicted incorrectly. The F1 score is to consider both P and R metrics at the same time, which can evaluate the performance of a classifier more scientifically.
2.5. Improved Faster RCNN
2.5.1. FPN
In deep convolutional neural networks, the features extracted from the shallow network include larger size, rich geometric information, and weaker semantic information. Although this is beneficial for target localization, it hinders target classification. On the other hand, due to pooling operations, the features extracted from higher layers are high-level features with smaller dimensions, less geometric information, and richer semantic content, which is beneficial for target classification. However, these features may not work well in detecting small targets. Traditional image pyramids construct multi-scale features by inputting images of different scales. Starting from an input image, images of different scales are obtained through preprocessing, creating an image pyramid. While this approach can improve the detection accuracy of algorithms, it requires feature extraction and other operations for each input image, resulting in high computational cost and low efficiency. Convolutional neural networks produce feature maps with decreasing dimensions. The FPN module [37] takes advantage of this characteristic to construct a multi-scale feature pyramid. This allows the Region Proposed Network (RPN) and detection network to predict targets at different scales. For example, the area of bruising on an apple is relatively small compared to the entire apple surface, which is unfavorable for model detection. By integrating the FPN structure, the model is better able to detect small targets, which greatly improves the detection accuracy of the model.
The FPN multi-scale detection module consists of two parts: a bottom-up process, and a top-down and lateral connection fusion process. The schematic diagram of the Faster RCNN model with the FPN module is illustrated in Figure 6.
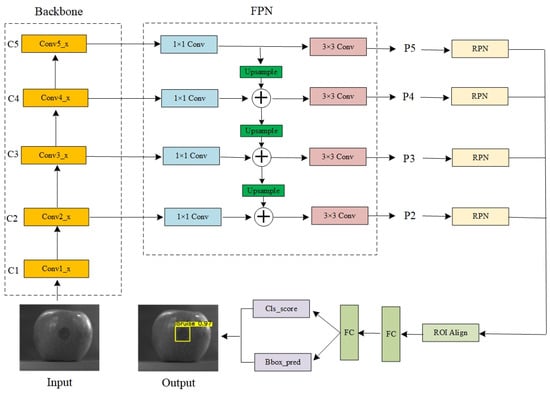
Figure 6.
Structure of the improved Faster RCNN model.
The leftmost backbone network represents the bottom-up convolution process of ResNet50. Each stage corresponds to a level of the feature pyramid, and the output features of the last residual block of each stage serve as the input features for the corresponding level in the FPN multi-scale detection module. Due to the excessive semantic information in the lower levels, the extracted features are generally discarded. The top-down process involves up-sampling the small feature maps from the top layer to match the size of the feature maps from the previous stage. This approach allows for the utilization of the strong semantic features for classification from the top layer and the rich geometric information for localization from the bottom layers. To combine high-level semantic features with the precise localization capabilities of the lower layers, a lateral connection structure is employed. The employment of lateral connection structures involves the addition and fusion of up-sampled features from the preceding layer with the features of the current layer. This process results in a feature matrix that contains information about both large and small objects in the image. This fused feature matrix is then fed into the RPN for anchor box determination in the subsequent steps. This approach enhances the detection accuracy for objects of various sizes.
2.5.2. NAM Normalization-Based Attention Module
Apples are objects with a quasi-spherical nature, and when light is projected onto the samples, it often results in uneven illumination, making it difficult for the model to distinguish objects. Additionally, the grayscale values of apple bruises can sometimes be very close to the grayscale values of stems or calyxes, leading to potential misclassifications by the model [38]. To bolster the attention of the model towards detection targets while effectively mitigating the impact of irrelevant features, this study introduced the NAM [39] mechanism into the main feature extraction network. Since the feature extraction network in this paper is based on the ResNet50 residual network structure, where the fundamental residual block (as shown in Figure 7) takes input x, after passing through three convolutional layers of varying sizes, outputs H(x) = x + F(x), the paper chose to incorporate the NAM based on normalization after each residual block. This addition is represented by the dashed boxes in Figure 7, transforming the output into H(x) = x + N(x). The purpose of NAM is to improve the attention mechanism using contribution factors of weights. This module is characterized by being lightweight and efficient. It employs the scale factor of batch normalization, which represents the importance of weights through the standard deviation. This operation mitigates the issue of increased network complexity caused by the inclusion of fully connected layers and convolutional layers, as observed in attention mechanisms such as SE (Squeeze-and-Excitation Networks) [40] and CBAM (Convolutional Block Attention Module) [41]. Moreover, it leverages weight information to further suppress interference from less significant channels or pixels. This is accomplished while preserving both spatial and channel correlations, leading to enhanced computational efficiency and heightened detection accuracy.
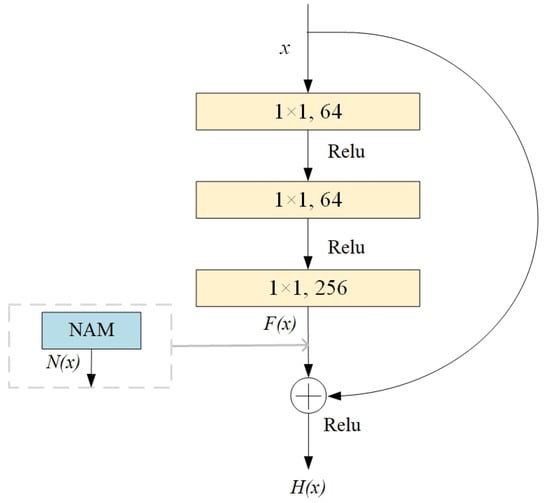
Figure 7.
Schematic diagram of the location of the attention mechanism.
2.5.3. Complete-IoU
The metric used to filter candidate boxes is the IoU. When using smoothL1 as the regression loss function, multiple different detection boxes may have the same loss of the same magnitude, but their IoU values can vary significantly. This can result in deviate or overlap of the predicted boxes, leading to missed detections and false positives. In order to solve this problem, this experiment uses CIoU [42] instead of smoothL1 as the bounding box regression loss function. This adjustment allows the model to filter out prediction boxes more accurately. The process of CIoU Loss is as follows:
where B is the prediction frame, Bgt is the true frame, and R (B, Bgt) is the penalty term for the prediction and true frames. The CIoU penalty term is calculated using Equation (11).
As shown in Figure 8, where b and bgt denote the centroids of the predicted frame (the blue rectangular box) and real frame (the red rectangular box), p denotes the Euclidean distance, c is the diagonal distance of the smallest rectangle (the dashed rectangular box) covering the predicted and real frames, α denotes the equilibrium scale parameter, and v denotes the congruence of the aspect ratio of the predicted and real frames.
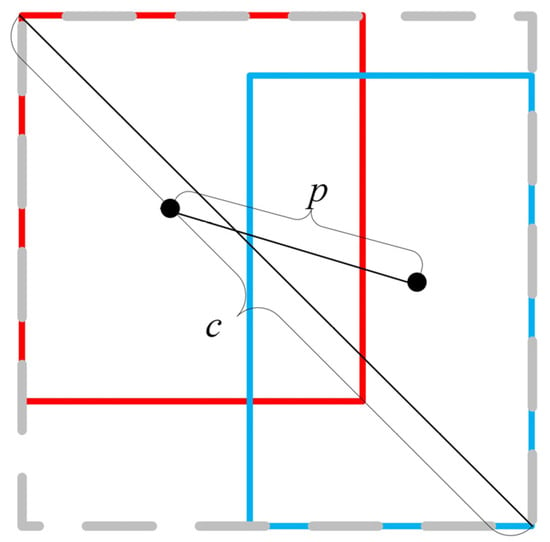
Figure 8.
CIoU construction diagram.
The CIoU loss function is expressed as:
Compared with the use of smoothL1 as a loss function, CIoU can directly minimize the distance between the predicted boxes and ground truth boxes. To avoid overlapping two bounding boxes, CIoU combines with three geometric metrics: the overlap area, center point distance, and aspect ratio consistency. This can reduce the occurrence of missed detections or false positives, enabling the prediction boxes to regress quickly within a limited range while maximizing the accuracy of the predicted bounding boxes. As a result, the loss function converges effectively, further enhancing the accuracy of object detection.
3. Results and Discussion
3.1. Validation Based on Hybrid Datasets
In order to validate the experimental results that demonstrate the superior detection performance of the SWIR band over the Vis/NIR band for early apple bruise detection, a hybrid dataset [43] was prepared. Of the 1200 images that were captured in the training set, the ratio of the SWIR images to Vis/NIR images was 1:1, 2:1, and 3:1, incrementally increasing the proportion of SWIR images in the dataset. In Model 1, the ratio of the number of dataset A to dataset B in the training set was 1:1. In Model 2, the ratio of the number of dataset A to dataset B in the training set was 2:1. In Model 3, the ratio of the number of dataset A to dataset B in the training set was 3:1. This step was taken to assess the effectiveness of the SWIR band in early apple bruise detection. The test dataset comprised a total of 300 images, evenly divided between the two datasets, and these images remain consistent throughout the validation process. Different detection ratios were compared using evaluation metrics on both test datasets. The ResNet50 residual network was used as the backbone feature extraction network for the Faster RCNN model. Transfer learning was employed to apply the weight information obtained from pre-training on the Pascal VOC dataset [44] to a Faster RCNN model. This transfer learning operation accelerated the convergence speed of the model, allowing it to learn the features of the dataset more rapidly. Bruises were not classified as large or small, only bruises, stems, and calyxes were identified.
In Figure 9, the results of testing with the three different training dataset ratios of the models (Model 1, Model 2, Model 3) are presented. The number above the box represents the confidence level of detecting it as a category, a value between 0 and 1. An increase in the proportion of the SWIR images in the training dataset resulted in consistent detection of bruises, accurate location of the bruise, and demonstration of a gradual increase in confidence. This demonstrates that using SWIR images for detection is feasible and effective.
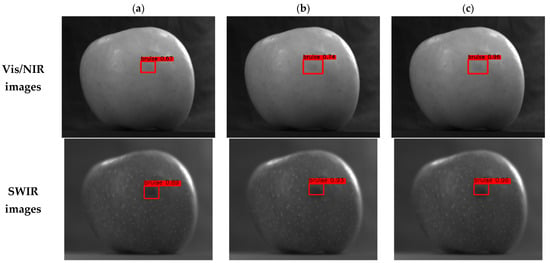
Figure 9.
Testing results for different training set ratios (dataset A: dataset B): (a) Model 1; (b) Model 2; (c) Model 3.
As shown in Figure 10, the loss function is demonstrated for three models (Model 1, Model 2, Model 3) of the training set with 200 rounds of training for the above model.
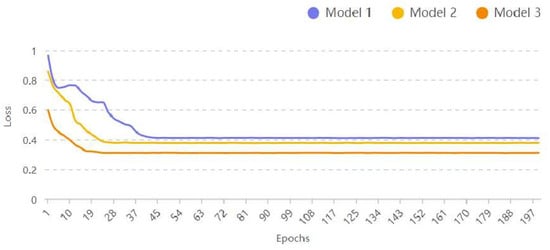
Figure 10.
Loss function results for three scaled training sets.
From Figure 10, it can be observed that the numerical values of the loss curves for all three scenarios stabilized with approximately 45 iterations after applying transfer learning. However, the loss curve for Model 3 exhibits both lower values and greater stability. This indirectly suggests that when it comes to detecting apple bruises, a higher proportion of SWIR images leads to more pronounced bruise detection and improved recognition performance.
As shown in Table 2, the evaluation metrics for the training models are presented and the test dataset remained consistent throughout. The AP reported in the table represents the accuracy for the bruise alone, excluding the stem and calyx.

Table 2.
Results of bruise detection.
From Table 2, it can be observed that as the proportion of the SWIR images (dataset A) in the training dataset increases, both indicators of the three test sets for bruise detection (AP and F1 score) gradually rise. This suggests that the role of the SWIR images in the training dataset becomes more significant as the proportion increases. Simultaneously, for both types of test datasets (dataset A and dataset B), although both indicators show an increase for the Vis/NIR images, the growth is relatively modest. This indicates that Vis/NIR images are less effective than the SWIR segment for bruise detection. In the SWIR test dataset, the AP value for bruise detection increased from 77.89% to 86.75%, improving about 8.86%. Similarly, the F1 score increased from 0.714 to 0.786, improving by 0.072. For dataset A + B in test, both the AP and F1 metrics are steadily increasing as the proportion of SWIR images in the training set increases, but the test results are consistently better than Vis/NIR test set and the metrics of the SWIR test set. Based on the above experimental results, the SWIR bands proved to be superior to the Vis/NIR spectrum in apple bruise detection.
3.2. Comparison of Model Results
After the validation experiment, the dataset for the next experiment exclusively comprises SWIR images. To enhance the precision of bruise detection in SWIR images, a SWIR dataset was employed. This expanded dataset, in addition to the SWIR images obtained in the preliminary experiments, adequately meets the dataset requirements stipulated by the target detection model. The ratio of the training set, test set, and validation set was 8:1:1.
To improve the accuracy of object detection, this study implemented an enhanced model structure. Specifically, the FPN structure was integrated into the ResNet50 backbone network. This enhanced bruise (small object) detection efficiency. Additionally, the NAM was introduced to eliminate irrelevant information related to the targets, capture finer details, and improve the efficiency of calyx and stem detection. The loss function was modified to CIoU to improve the accuracy of the predicted bounding boxes of the model. Furthermore, ROI pooling was replaced with ROI Align for feature mapping to avoid errors caused by quantization and improve detection speed. Additionally, the original anchors, initially sized at 128 × 128, 256 × 256, and 512 × 512 pixels, were expanded by 32 × 32 and 64 × 64 pixels. The number of anchors increased from 9 to 15. This enlargement of the receptive field range aimed to enhance the detection range for small targets.
To further illustrate the superiority of the improved Faster RCNN network, we compared our results with similar research. Using the pruned YOLOv4 model (YOLOv4P) by Fan et al. [26], and the YOLOv5s model by Yuan et al. [27], and under consistent experimental conditions, the performance of these networks was compared with that of the network in this experiment using our dataset.
Figure 11 presents the detection results of the four models, based on the SWIR dataset, for apple bruises near the calyxes and stems. The number above each box represents the confidence level of detecting the bruise as a category with a value between 0 and 1, Different categories use different color systems. Each model can accurately determine the location of bruises, stems, and calyxes, but the improved model has the best detection confidence level for each category.
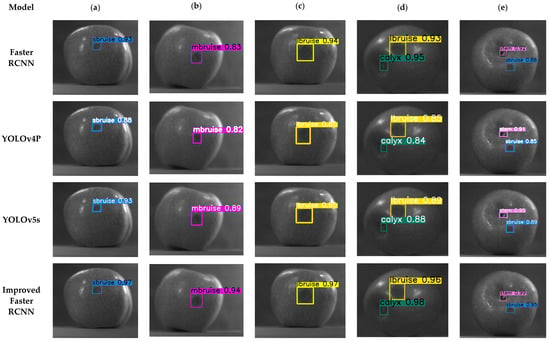
Figure 11.
The results of different models using SWIR images. (a) Small bruise test result; (b) Medium bruise test result; (c) Large bruise test result; (d) Bruise and calyx test result; (e) Bruise and stem test result. The color of confidence level for sbruise, mbruise, lbruise, calyx, and stem are blue, purple, yellow, green, and pink, respectively.
The following is a comparison of the results between the improved, Faster RCNN, YOLOv4P, and YOLOv5s models, all trained for 150 epochs.
From Figure 12, it was found that as the number of iterations gradually increased, the improved Faster RCNN model gradually converged, and the loss value became smaller and smaller. When the model was iterated 40 times, the loss value was basically stable, dropping to near 0, and the network basically converged. Compared with the original Faster RCNN, YOLOv4P, and YOLOv5s models, the improved model is faster and more accurate, which proves the effectiveness of the model.
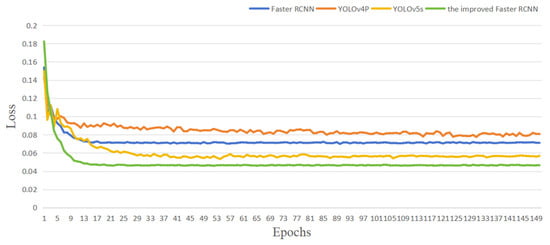
Figure 12.
Results of loss curves for each model.
The performance comparison of different object detection models is shown in Table 3. The results show that the improved Faster RCNN model outperforms the other three models, achieving a mAP of 97.4% and an F1 score of 0.870. When detecting large-area bruises, the improved model achieved the highest AP value of 97.6%. YOLOv5s and YOLOv4P are relatively better at large bruise detection, but their AP values are not as good as that of the improved Faster RCNN. The improved Faster RCNN performed relatively weakly in the detection of medium-area defects, and its AP value in this category was lower than that of the other categories. All the models achieved better performance in detecting small bruises, but the improved Faster RCNN was the best with an AP value of 96.4%. In the tasks of stem and calyx detection, the original Faster RCNN performed stably, but was slightly inferior to the improved Faster RCNN. YOLOv5s performed better in calyx detection, not as good as the improved Faster RCNN, but better than YOLOv4P and the original Faster RCNN. The comparison results indicated that the proposed improved Faster RCNN model performs best in the object detection tasks of apple bruises, stems, and calyxes.

Table 3.
Comparison of performance of different detection algorithms.
By repeatedly (1000 times) testing the inference time of the test set of SWIR images, the improved Faster RCNN model took only about 60 ms to detect a single image, which is in line with real-time detection [45].
While keeping the experimental condition consistent, this study trained the following Faster RCNN models with ResNet50 as the backbone network. Model Ⅰ: the Faster RCNN model; Model Ⅱ: the FPN structure of the Faster RCNN model; Model Ⅲ: the NAM of the Faster RCNN model; Model Ⅳ: the CIoU Loss of the Faster RCNN model; Model Ⅴ: the FPN structure and the NAM of the Faster RCNN model; Model Ⅵ: the NAM and the CIoU Loss of the Faster RCNN model; Model Ⅶ: the FPN structure and the CIoU Loss of the Faster RCNN model; Model Ⅷ: the FPN structure, the NAM and the CIoU Loss of the Faster RCNN model. To highlight the impact of each architecture on performance improvement, various types of Faster RCNN models were evaluated by performance metrics. The results are presented in Table 4.

Table 4.
Comparison of performance of different Faster RCNN models.
According to the evaluation metrics listed in Table 4, each improved Faster RCNN model performed better than the original network. Specifically, adding the FPN, NAM, and CIoU loss individually into the Faster RCNN network results in significant improvements in various class AP values and F1 scores. The FPN structure enhanced the detection performance for objects of different sizes by fusing features from different scales, leading to an increase of 3.5% in mAP and 0.023 in F1 score. The addition of attention mechanisms improved mAP by 2.3%, indicating a heightened focus on object features, especially improvement in the AP values for calyxes and stems.
Furthermore, the CIoU loss offers a more comprehensive and robust IoU calculation to enhance the accuracy of each object. When combining FPN, NAM, and CIoU loss in the Faster RCNN network simultaneously, the model achieved an increase of 6.1% in mAP and 0.037 in F1 score. These results show that introducing FPN, adding the NAM, and replacing the CIoU loss function can significantly improve the ability of the Faster RCNN model to detect apple bruises of different sizes, calyxes, and stems.
4. Conclusions
Deep learning methods have provided new insights into the early detection of bruises on apples. This study successfully investigated the feasibility of early detection of bruises on apples using a short-wave infrared camera and the deep learning object detection model—Faster RCNN. An effective imaging system was established using both short-wave infrared cameras (950–1700 nm) and visible near-infrared cameras (300–1100 nm) to capture images of early apple bruises in two spectral bands. The model was used with a hybrid dataset approach to confirm that bruise detection is better in the SWIR bands than in the Vis/NIR bands. To improve the accuracy of bruise detection, the SWIR dataset was used to build object detection models using the Faster RCNN network, YOLOv4P, YOLOv5s, and improved models. Ablation experiments were used to demonstrate the effectiveness of the improved model components. The results showed that the improved model had the best performance in detecting bruises. It achieved a mAP of 97.4% and an F1 score of 0.87 for detection of early apple bruises, stems, and calyxes. Experimental results demonstrated that the improved model enhanced the accuracy of early apple bruise detection and exhibited good detection precision for stems and calyxes. The results of this study can be applied to the sorting of early bruised apples on factory assembly lines to help terminals provide the exact location of bruises for the next step in the processing of bruised areas of apples.
The proposed method can help end-users, without specialized knowledge, to build an effective inspection network in expectation of high-precision of detection of early bruises in apples. Our future research focuses on the discrimination of apple bruises (time of damage) using spectral information of images and deep learning methods to enrich the non-destructive inspection of fruits and vegetables.
Author Contributions
Conceptualization, J.H. and H.B.; methodology, J.H.; software, J.H.; validation, J.H., Y.F. and Y.C.; resources, H.B. and L.S.; data curation, J.H., Y.C. and Y.F.; writing—original draft preparation, J.H.; writing—review and editing, J.H., H.B., Y.F. and Y.C.; funding acquisition, H.B. and L.S. All authors have read and agreed to the published version of the manuscript.
Funding
National Natural Science Foundation of China (62341503); Natural Science Foundation of Heilongjiang Province (SS2021C005); Key Research and Development Program of Heilongjiang (GZ20220121, 2022ZX03A06); University Nursing Program for Young Scholar with Creative Talents in Heilongjiang Province (UNPYSCT-2018012) and Fundamental Research Funds for the Heilongjiang Provincial Universities (2022-KYYWF-1048).
Data Availability Statement
Data are contained within the article.
Conflicts of Interest
The authors declare no conflicts of interest.
References
- Du, Z.J.; Zeng, X.Q.; Li, X.X.; Ding, X.M.; Cao, J.K.; Jiang, W.B. Recent advances in imaging techniques for bruise detection in fruits and vegetables. Trends Food Sci. Technol. 2020, 99, 133–141. [Google Scholar] [CrossRef]
- Milajerdi, A.; Ebrahimi-Daryani, N.; Dieleman, L.A.; Larijani, B.; Esmaillzadeh, A. Association of Dietary Fiber, Fruit, and Vegetable Consumption with Risk of Inflammatory Bowel Disease: A Systematic Review and Meta-Analysis. Adv. Nutr. 2021, 12, 735–743. [Google Scholar] [CrossRef]
- Opara, U.L.; Pathare, P.B. Bruise damage measurement and analysis of fresh horticultural produce-A review. Postharvest Biol. Technol. 2014, 91, 9–24. [Google Scholar] [CrossRef]
- Komarnicki, P.; Stopa, R.; Szyjewicz, D.; Kuta, A.; Klimza, T. Influence of Contact Surface Type on the Mechanical Damages of Apples Under Impact Loads. Food Bioprocess Technol. 2017, 10, 1479–1494. [Google Scholar] [CrossRef][Green Version]
- Wani, N.A.; Mishra, U. An integrated circular economic model with controllable carbon emission and deterioration from an apple orchard. J. Clean. Prod. 2022, 374, 133962. [Google Scholar] [CrossRef]
- Springael, J.; Paternoster, A.; Braet, J. Reducing postharvest losses of apples: Optimal transport routing (while minimizing total costs). Comput. Electron. Agric. 2018, 146, 136–144. [Google Scholar] [CrossRef]
- Arango, J.D.; Staar, B.; Baig, A.M.; Freitag, M. Quality control of apples by means of convolutional neural networks—Comparison of bruise detection by color images and near-infrared images. Procedia CIRP 2021, 99, 290–294. [Google Scholar] [CrossRef]
- Leemans, V.; Destain, M.F. A real-time grading method of apples based on features extracted from defects. J. Food Eng. 2004, 61, 83–89. [Google Scholar] [CrossRef]
- Moscetti, R.; Haff, R.P.; Monarca, D.; Cecchini, M.; Massantini, R. Near-infrared spectroscopy for detection of hailstorm damage on olive fruit. Postharvest Biol. Technol. 2016, 120, 204–212. [Google Scholar] [CrossRef]
- Defraeye, T.; Lehmann, V.; Gross, D.; Holat, C.; Herremans, E.; Verboven, P.; Verlinden, B.E.; Nicolai, B.M. Application of MRI for tissue characterisation of ‘Braeburn’ apple. Postharvest Biol. Technol. 2013, 75, 96–105. [Google Scholar] [CrossRef]
- Diels, E.; van Dael, M.; Keresztes, J.; Vanmaercke, S.; Verboven, P.; Nicolai, B.; Saeys, W.; Ramon, H.; Smeets, B. Assessment of bruise volumes in apples using X-ray computed tomography. Postharvest Biol. Technol. 2017, 128, 24–32. [Google Scholar] [CrossRef]
- Mahanti, N.K.; Pandiselvam, R.; Kothakota, A.; Ishwarya, S.P.; Chakraborty, S.K.; Kumar, M.; Cozzolino, D. Emerging non-destructive imaging techniques for fruit damage detection: Image processing and analysis. Trends Food Sci. Technol. 2021, 120, 418–438. [Google Scholar] [CrossRef]
- Azadbakht, M.; Torshizi, M.V.; Mahmoodi, M.J. The use of CT scan imaging technique to determine pear bruise level due to external loads. Food Sci. Nutr. 2019, 7, 273–280. [Google Scholar] [CrossRef] [PubMed]
- Baranowski, P.; Mazurek, W.; Pastuszka-Wozniak, J. Supervised classification of bruised apples with respect to the time after bruising on the basis of hyperspectral imaging data. Postharvest Biol. Technol. 2013, 86, 249–258. [Google Scholar] [CrossRef]
- Pandiselvam, R.; Mayookha, V.P.; Kothakota, A.; Ramesh, S.V.; Thirumdas, R.; Juvvi, P. Biospeckle laser technique-A novel non-destructive approach for food quality and safety detection. Trends Food Sci. Technol. 2020, 97, 1–13. [Google Scholar] [CrossRef]
- Liu, N.L.; Chen, X.; Liu, Y.; Ding, C.Z.; Tan, Z.J. Deep learning approach for early detection of sub-surface bruises in fruits using single snapshot spatial frequency domain imaging. J. Food Meas. Charact. 2022, 16, 3888–3896. [Google Scholar] [CrossRef]
- Unay, D. Deep learning based automatic grading of bi-colored apples using multispectral images. Multimed. Tools Appl. 2022, 81, 38237–38252. [Google Scholar] [CrossRef]
- Hekim, M.; Comert, O.; Adem, K. A hybrid model based on the convolutional neural network model and artificial bee colony or particle swarm optimization-based iterative thresholding for detection of bruised apples. Turk. J. Electr. Eng. Comput. Sci. 2020, 28, 61–79. [Google Scholar] [CrossRef]
- Zhu, X.L.; Li, G.H. Rapid detection and visualization of slight bruise on apples using hyperspectral imaging. Int. J. Food Prop. 2019, 22, 1709–1719. [Google Scholar] [CrossRef]
- Luo, W.; Zhang, H.L.; Liu, X.M. Hyperspectral/multispectral reflectance imaging combining with watershed segmentation algorithm for detection of early bruises on apples with different peel colors. Food Anal. Methods 2019, 12, 1218–1228. [Google Scholar] [CrossRef]
- Pan, X.Y.; Sun, L.J.; Li, Y.S.; Che, W.K.; Ji, Y.M.; Li, J.L.; Li, J.; Xie, X.; Xu, Y.T. Non-destructive classification of apple bruising time based on visible and near-infrared hyperspectral imaging. J. Sci. Food Agric. 2019, 99, 1709–1718. [Google Scholar] [CrossRef] [PubMed]
- Ferrari, C.; Foca, G.; Calvini, R.; Ulrici, A. Fast exploration and classification of large hyperspectral image datasets for early bruise detection on apples. Chemom. Intell. Lab. Syst. 2015, 146, 108–119. [Google Scholar] [CrossRef]
- Gai, Z.D.; Sun, L.J.; Bai, H.Y.; Li, X.X.; Wang, J.Y.; Bai, S.N. Convolutional neural network for apple bruise detection based on hyperspectral. Spectrochim. Acta Part A Mol. Biomol. Spectrosc. 2022, 279, 121432. [Google Scholar] [CrossRef] [PubMed]
- Tian, X.; Liu, X.F.; He, X.; Zhang, C.; Li, J.B.; Huang, W. Detection of early bruises on apples using hyperspectral reflectance imaging coupled with optimal wavelengths selection and improved watershed segmentation algorithm. J. Sci. Food Agric. 2023, 103, 6689–6705. [Google Scholar] [CrossRef] [PubMed]
- Pang, Q.; Huang, W.Q.; Fan, S.X.; Zhou, Q.; Wang, Z.L.; Tian, X. Detection of early bruises on apples using hyperspectral imaging combining with YOLOv3 deep learning algorithm. J. Process Eng. 2022, 45, 13952. [Google Scholar] [CrossRef]
- Fan, S.X.; Liang, X.T.; Huang, W.Q.; Zhang, V.J.; Pang, Q.; He, X.; Li, L.J.; Zhang, C. Real-time defects detection for apple sorting using NIR cameras with pruning-based YOLOV4 network. Comput. Electron. Agric. 2022, 193, 106715. [Google Scholar] [CrossRef]
- Yuan, Y.H.; Yang, Z.R.; Liu, H.B.; Wang, H.B.; Li, J.H.; Zhao, L.L. Detection of early bruise in apple using near-infrared camera imaging technology combined with deep learning. Infrared Phys. Technol. 2022, 127, 104442. [Google Scholar] [CrossRef]
- Yang, Z.R.; Yuan, Y.H.; Zheng, J.H.; Wang, H.B.; Li, J.H.; Zhao, L.L. Early apply bruise recognition based on near-infrared imaging and grayscale gradient images. J. Food Meas. Charact. 2023, 17, 2841–2849. [Google Scholar] [CrossRef]
- Keresztes, J.C.; Diels, E.; Goodarzi, M.; Nguyen-Do-Trong, N.; Goos, P.; Nicolai, B.; Saeys, W. Glare based apple sorting and iterative algorithm for bruise region detection using shortwave infrared hyperspectral imaging. Postharvest Biol. Technol. 2017, 130, 103–115. [Google Scholar] [CrossRef]
- Siedliska, A.; Baranowski, P.; Mazurek, W. Classification models of bruise and cultivar detection on the basis of hyperspectral imaging data. Comput. Electron. Agric. 2014, 106, 66–74. [Google Scholar] [CrossRef]
- Li, X.; Liu, Y.D.; Yan, Y.J.; Wang, G.T. Detection of early bruises in honey peaches using shortwave infrared hyperspectral imaging. Spectroscopy 2022, 37, 33–41,48. [Google Scholar] [CrossRef]
- Han, Z.Y.; Li, B.; Wang, Q.; Yang, A.K.; Liu, Y.D. Detection storage time of mild bruise’s loquats using hyperspectral imaging. J. Spectrosc. 2022, 2022, 9989002. [Google Scholar] [CrossRef]
- Zhou, X.; Ampatzidis, Y.; Lee, W.S.; Zhou, C.L.; Agehara, S.; Schueller, J.K. Deep learning-based postharvest strawberry bruise detection under UV and incandescent light. J. Chemom. 2022, 202, 107389. [Google Scholar]
- Lopez-Maestresalas, A.; Keresztes, J.C.; Goodarzi, M.; Arazuri, S.; Jaren, C.; Saeys, W. Non-destructive detection of blackspot in potatoes by Vis-NIR and SWIR hyperspectral imaging. Food Contral 2016, 70, 229–241. [Google Scholar] [CrossRef]
- Zhu, Q.B.; Guan, J.Y.; Huang, M.; Lu, R.F.; Mendoza, F. Predicting bruise susceptibility of ‘Golden Delicious’ apples using hyperspectral scattering technique. Postharvest Biol. Technol. 2016, 114, 86–94. [Google Scholar] [CrossRef]
- Xi, R.; Hou, J.; Lou, W. Potato Bud detection with improved Faster R-CNN. Trans. ASABE 2020, 63, 557–569. [Google Scholar] [CrossRef]
- Li, Y.C.; Zhou, S.L.; Chen, H. Attention-based fusion factor in FPN for object detection. Appl. Intell. 2022, 52, 15547–15556. [Google Scholar] [CrossRef]
- Wu, A.; Zhu, J.H.; Ren, T.Y. Detection of apple defect using laser-induced light backscattering imaging and convolutional neural network. Comput. Electr. Eng. 2020, 81, 106454. [Google Scholar] [CrossRef]
- Liu, Y.C.; Shao, Z.R.; Teng, Y.Y. NAM: Normalization-based Attention Module. arXiv 2021, arXiv:2111.12419. [Google Scholar]
- Zhang, T.W.; Zhang, X.L. Squeeze-and-Excitation Laplacian Pyramid Network with Dual-Polarization Feature Fusion for Ship Classification in SAR Images. IEEE Geosci. Remote Sens. Lett. 2022, 19, 4019905. [Google Scholar] [CrossRef]
- Wang, W.; Tan, X.A.; Zhang, P.; Wang, X. A CBAM Based Multiscale Transformer Fusion Approach for Remote Sensing Image Change Detection. IEEE J. Sel. Top. Appl. Earth Obs. Remote Sens. 2022, 15, 6817–6825. [Google Scholar] [CrossRef]
- Zheng, Z.H.; Wang, P.; Ren, D.W.; Liu, W.; Ye, R.G.; Hu, Q.H.; Zuo, W.M. Enhancing Geometric Factors in Model Learning and Inference for Object Detection and Instance Segmentation. IEEE Trans. Cybern. 2021, 52, 8574–8586. [Google Scholar] [CrossRef] [PubMed]
- Anzidei, M.; Di Martino, M.; Sacconi, B.; Saba, L.; Boni, F.; Zaccagna, F.; Geiger, D.; Kirchin, M.A.; Napoli, A.; Bezzi, M. Evaluation of image quality, radiation dose and diagnostic performance of dual-energy CT datasets in patients with hepatocellular carcinoma. Clin. Radiol. 2015, 70, 966–973. [Google Scholar] [CrossRef] [PubMed]
- Zhang, X.; Zhao, C.; Luo, H.Z.; Zhao, W.Q.; Zhong, S.; Tang, L.; Peng, J.Y.; Fan, J.P. Automatic learning for object detection. Neurocomputing 2022, 484, 260–272. [Google Scholar] [CrossRef]
- Yao, J.; Qi, J.M.; Zhang, J.; Shao, H.M.; Yang, J.; Li, X. A Real-Time Detection Algorithm for Kiwifruit Defects Based on YOLOv5. Electronics 2021, 10, 1711. [Google Scholar] [CrossRef]
Disclaimer/Publisher’s Note: The statements, opinions and data contained in all publications are solely those of the individual author(s) and contributor(s) and not of MDPI and/or the editor(s). MDPI and/or the editor(s) disclaim responsibility for any injury to people or property resulting from any ideas, methods, instructions or products referred to in the content. |
© 2024 by the authors. Licensee MDPI, Basel, Switzerland. This article is an open access article distributed under the terms and conditions of the Creative Commons Attribution (CC BY) license (https://creativecommons.org/licenses/by/4.0/).