Article

Evaluation of the Enzymatic Production and Prebiotic Activity of Galactomannan Oligosaccharides Derived from Gleditsia microphylla

1
Jiangsu Co-Innovation Center of Efficient Processing and Utilization of Forest Resources, College of Chemical Engineering, Nanjing Forestry University, Nanjing 210037, China
2
School of Pharmacy & School of Biological and Food Engineering, Changzhou University, Changzhou 213164, China
3
Key Laboratory of Forestry Genetics & Biotechnology (Nanjing Forestry University), Ministry of Education, Nanjing 210037, China
*
Author to whom correspondence should be addressed.
Fermentation 2023, 9(7), 632; https://doi.org/10.3390/fermentation9070632
Submission received: 29 May 2023 / Revised: 30 June 2023 / Accepted: 1 July 2023 / Published: 4 July 2023
(This article belongs to the Special Issue Lignocellulosic Biomass Decomposition and Bioconversion)

Abstract

:
Oligosaccharides have received considerable attention as prebiotics because they exhibit potential health benefits related to their ability to modulate intestinal bacterial composition. This study evaluated the effects of galactomannan oligosaccharides (GMOS) derived from Gleditsia microphylla as a prebiotic on human intestinal bacteria. The β-mannanase used for the enzymatic hydrolysis of GMOS was produced by Trichoderma reesei Rut C-30. The enzymatic hydrolysis of GMOS was found to occur under optimal conditions at 50 °C, pH 5, 20 U/g-GM, and 20 g/L, and resulted in a yield of 70.78% ± 1.34%. The purity of GMOS after purification was 81.50%. Upon performing in vitro human fecal fermentation using GMOS as a carbon source, it was observed that GMOS effectively promoted the proliferation of intestinal bacteria, and the utilization efficiency of GMOS by intestinal bacteria was found to be at 98.40%. In addition, GMOS were found to have a stabilizing effect on intestinal pH. Additionally, 16S rRNA sequencing of GMOS revealed that GMOS significantly affected the diversity of gut microbiota. Specifically, GMOS exhibited a significant inhibitory effect on Fusobacteria at the phyla and genus level, and demonstrated a significant inhibitory effect on Fusobacterium. Moreover, the results for the prediction of metabolic function analysis showed that GMOS had a significant effect on the level two metabolism of carbohydrates, cofactors, and vitamins. Furthermore, during level three metabolism, the lipoic acid metabolism was significantly affected by GMOS. These results provide a theoretical basis for the potential use of galactomannan oligosaccharides from Gleditsia microphylla as prebiotics for regulating human intestinal bacteria.

1. Introduction

The continual progress in technology and the ever-increasing drive towards enhanced productivity and contemporary dietary patterns have resulted in the prioritization of green and healthy foods that provide optimal nutrient composition. Consequently, food items rich in prebiotics, such as vegetables and fruits, have gained significant consumer attention. Gleditsia microphylla, a leguminous plant distributed widely throughout several provinces in China, contains galactomannan (GM) in its seed endosperm [1]. GM is a high-polymer polysaccharide with a mannose backbone and several branched galactose chains. Although the prebiotic activity associated with GM derived from other plants has been well documented [2,3], only a limited number of studies have explored the prebiotic activity of GM derived from Gleditsia microphylla.
GM is typically formed through linkages formed between β-D-pyranose-mannose units via β-1,4-glycosidic bonds, which result in a mannose backbone. Additionally, α-d-pyranose-galactose units were randomly attached to the mannose units through α-1,6-glycosidic bonds [4]. The high molecular weight of galactomannan as a prebiotic reduces the efficiency of its utilization by intestinal bacteria, whereas galactomannan oligosaccharides (GMOS) are more easily utilized by intestinal microbes and have several beneficial effects on intestinal bacteria [5].
Oligosaccharides can be obtained through the degradation of polysaccharides. Common methods for the degradation of oligosaccharides include acid hydrolysis [6,7], synthesis [8], and enzymatic hydrolysis [9,10]. For instance, the products obtained from the enzymatic hydrolysis of xylo-oligosaccharides have the ability to proliferate Bifidobacterium adolescentis and then produce organic acids, such as acetate, propionate, butyrate, and lactate [11,12]. Furthermore, as reports have shown, the hemicellulose also causes the proliferation of beneficial bacteria in the intestinal flora. The ethanolic precipitate obtained from softwood hemicellulose by hydrolysis could stimulate the growth of Bifidobacterium adolescentis, proliferate the phylum Bacteroides, and reduce the abundance of the phylum Proteobacteria [13]. Xylo-oligosaccharide has been much studied in recent years, and it can be prepared by the same methods described above. In particular, enzymatic hydrolysis is the preferred method used by researchers and enterprises, owing to its mild reaction conditions, high specificity, and environmental friendliness. However, the structure of the enzyme system determines the efficiency of the enzymatic preparation of oligosaccharides, as well as other hemicellulose-derived oligosaccharides. As an example, during the enzymatic preparation of GMOS, GM can be degraded to GMOS through β-mannanase and β-mannosidase [14]. β-mannanase can result in the breakdown of the mannose backbone and production of mannan with a low molecular weight, which can then be further degraded by β-mannosidase to mannose. Thus, it is essential to minimize β-mannosidase activity during the enzymatic preparation of galactomannan to reduce mannose generation and improve GMOS yield.
Plant-derived oligosaccharides are increasingly being recognized as safe and stable polysaccharides that selectively promote the proliferation of beneficial intestinal bacteria while inhibiting harmful intestinal bacteria. In addition, they regulate the structure of intestinal microbial populations, reduce the secretion of toxic factors, and improve host immunity [15]. Consequently, plant-derived GMOS can create a protective barrier for the intestine, and they exhibit several advantageous biological functions, including the regulation of gastrointestinal function, lowering blood sugar, and the regulation of blood lipids [16].
In this study, we produced Gleditsia microphylla GMOS using β-mannanase and purified it for use during the in vitro fermentation of human feces to evaluate its prebiotic activity. The results of this study provide crucial evidence of the effects of Gleditsia microphylla GMOS on intestinal bacteria and their metabolic functions.

2. Materials and Methods

2.1. Materials and Reagents

Gleditsia microphylla seeds were purchased from a farm in Guizhou Province, China. Crude enzyme was prepared by Trichoderma reesei Rut C-30 in the laboratory (Institute of Biochemistry, Nanjing Forestry University) according to our previous study [5]. The activity of β-mannanase, β-mannosidase, and α-galactosidase in the crude enzyme from Trichoderma reesei Rut C-30 were 3.11 U/mL, 0.01 U/mL, and 0.10 U/mL, respectively. Standard sugars (arabinose, galactose, glucose, mannose, and xylose) and chromatography-grade organic acid standards (lactic, acetic, propionic, and butyric acid) were purchased from Sigma-Aldrich (Saint Louis, MO, USA).

2.2. Preparation of Gleditsia microphylla Galactomannans

In a 2 L beaker, 100 g of Gleditsia microphylla seed endosperms were immersed in 1 L of hot water (1:100, w/v) for 12 h. Subsequently, the mixture of endosperms with 1 L of water was centrifuged at 10,000 rpm for 5 min, and the supernatant obtained was subjected to ethanol precipitation using 65% ethanol. The sediment was preserved and washed three times before freeze drying.

2.3. Component Analysis of Gleditsia microphylla Galactomannans

Component analysis was performed as described by Tao et al. [17]. Galactomannan content (SGM content) was calculated as follows:
S GM   content   % = ( C gal + C man )   ×   0.9   ×   0.087   L original   dry   sample ( g )   ×   100 %
  • Cgal: Concentration of galactose.
  • Cman: Concentration of mannose.

2.4. Quantification of Gleditsia microphylla Galactomannan Oligosaccharides

According to the method described by Tao et al., anhydrous ethanol was added into the obtained enzymatic supernatant (50 °C, pH 5, 20 g/L substrate concentration, 20 U/g enzyme loading) until the ethanol concentration reached 65 wt.%. After centrifugation, the ethanol in the supernatant was evaporated. The supernatant was freeze dried and the molecular weight was determined.

2.5. Preparation of Gleditsia microphylla Galactomannan Oligosaccharides

During the enzymatic process, pretreated Gleditsia microphylla seeds were employed as a substrate with β-mannanase. At the end of the enzymatic process, the enzymatic solution in the conical flask was placed in boiling water for 7 min to inactivate the enzyme, and the suspension was centrifuged at 8000 rpm for 10 min to obtain the supernatant. Then, GMOS were obtained in the supernatant according to the method described in Section 2.4. After optimizing the substrate concentration, enzyme loading, reaction temperature, and pH in a 50 mL enzymatic hydrolysis system, the batch production process was performed. The equation for determining the yield of GMOS was as follows:
GM   % = C Sgal + C Sman C Sgal + C Sman   ×   100 %
  • YieldGM: yield of galactomannan.
  • CSgal: supernatant galactose concentration.
  • CSman: supernatant mannose concentration.
  • C′Sgal: substrate galactose concentration.
  • C′Sman: substrate galactose concentration.

2.6. Purification of Gleditsia microphylla Galactomannan Oligosaccharides

2.6.1. Removal of Pigment

Pigment adsorption was performed using XAD16N resin (Sinopharm Chemical Reagent Co., Ltd., Shanghai, China), which was filled into a column and connected to a peristaltic pump. The supernatant was pumped into the resin column at a rate of 20 rpm, and the filtrate was collected. The absorbance of the filtrate was measured at 420 nm and compared to that of the unfiltered solution to determine the completion of pigment adsorption.

2.6.2. Monosaccharide Removal

Dialysis was conducted using a 200 Da dialysis bag (Hunan Yibo Biotechnology Co., Hunan, China) through a process that lasted for two days, with water changed three times per day, after which the fluid in the bag was collected. The fluid was filtered with a 0.22 μm nylon Acrodisc syringe filter, after which 20 μL was injected into a Dionex ICS-5000 system (Thermo Fisher, Waltham, MA, USA); the conditions used in the system were the same as those in Section 2.3. A galactose and mannose concentration of 0 indicated the complete removal of monosaccharides.
Using a 200 Da dialysis bag, the dialysis process was conducted for two days in double-distilled water, which was changed three times per day, after which the fluid in the bag was collected. The fluid was filtered through a 0.22 μm nylon Acrodisc syringe filter, and then 20 μL of fluid was injected into a Dionex ICS-5000 system; the system conditions were the same as those described in Section 2.3. The completion of monosaccharide removal was performed to ensure the absence of galactose and mannose.

2.7. In Vitro Fermentation of Gleditsia microphylla Galactomannan Oligosaccharides

2.7.1. Collection of Human Fecal Matter and In Vitro Batch Fermentation of GMOS

Fecal samples were donated by three healthy volunteers (two males and one female, aged 22–27 years) who had not taken any antibiotic products in the past 3 months and had no intestinal diseases. The mixture of the freshly collected fecal samples and 0.1 mol/L PBS buffer (1:9, 30 mL total) was centrifuged at a low speed (500 rpm, 5 min) and the fecal suspension was extracted for the next step of the experiment. In vitro fermentation was carried out in a Dugbox anaerobic workstation (Ruskin Life Sciences, UK) at 37 °C for 0, 6, 12, 24, and 48 h. The original group was treated for 0 h, and all experiments were independently performed 5 times.

2.7.2. Basic Medium

The basic medium consisted of a carbon source (5.00 g/L), peptone (2.00 g/L), NaCl (0.10 g/L), KH2PO4 (0.04 g/L), MgSO4 7H2O (0.01 g/L), K2HPO4 (0.04 g/L), NaHCO3 (2.00 g/L), bile salt (0.5 g/L, resazurin (1 mL/L), heme chloride (0.02 g/L), Tween 80 (2 mL/L), vitamin K1 (10 μL/L), and L-cysteine hydrochloride (0.5 g/L). The medium was neutralized to a pH of 7.0 with 0.1 mol/L HCl solution, where the carbon sources were 0.5 g GM (positive control) and GMOS, which were mixed with 4 mL of basic medium and 0.5 mL of fecal suspension. The control consisted of a mixture of 0.5 mL distilled water, 4 mL basic medium, and 0.5 mL fecal suspension. The experimental groups were replaced with distilled water containing an equal volume of carbon source.

2.7.3. OD600 of Intestinal Bacteria

Homogeneous fermentation broth (1 mL), fermented for 48 h, was placed in a 2 mL centrifuge tube for centrifugation (2000 rpm, 5 min), and the supernatant was removed. The precipitate was rinsed with physiological saline and centrifuged under the same conditions. This process was repeated thrice, and precipitates were collected. Finally, the precipitate was mixed with 1 mL of physiological saline and placed in a UV spectrophotometer (Shanghai Precision Scientific Instruments Co., Shanghai, China) for analysis at 600 nm.

2.7.4. Analysis of Short-Chain Fatty Acids

The supernatant, comprising 1 mL of centrifuged intestinal bacterial suspension (2000 rpm, 5 min), was filtered through a 0.25 μm membrane for the measurement of acetic acid, propionic acid, butyric acid, and lactic acid levels via HPLC 1260 (Agilent, Santa Clara, CA, USA). The measurement conditions for short-chain fatty acids were as follows: Bio-Rad Aminex HPX-87H (7.8 mm × 300 mm); column temperature: 55 °C; mobile phase: 5 mmol/L H2SO4; flow rate: 0.6 mL/min; injection volume: 10 μL; detector: refractive index detector.

2.7.5. Analysis of Human Intestinal Bacteria during In Vitro Fermentation

Gut microbial DNA was extracted using a HiPure Soil DNA Kit (Magen, Guangzhou, China) according to the manufacturer’s protocol. With the primers 341F: CCTACGGGNGGCWGCAG and 806R: GGACTACHVGGGTATCTAAT, the 16S rDNA V3-V4 region of the ribosomal RNA gene was amplified by PCR (conditions of PCR: 94 °C for 2 min, followed by 30 cycles at 98 °C for 10 s, 62 °C for 30 s, and 68 °C for 30 s, and a final extension at 68 °C for 5 min). According to the manufacturer’s instructions, the amplicons extracted from 2% agarose gels were purified using the AxyPrep DNA Gel Extraction Kit (Axygen Biosciences, Union City, CA, USA) and quantified using the ABI StepOnePlus Real-Time PCR System (Life Technologies, Foster City, CA, USA). Purified amplicons were pooled at equimolar concentrations and paired-end sequenced (2 × 250) on an Illumina platform according to standard protocols. Raw data from the Illumina platform for ineligible reads were filtered using FASTP software (version 0.18.0). Stitching was performed using FLASH (version 1.2.11), and ineligible sequences were filtered using QIIME (version 1.9.1). Finally, the sequences were clustered into OTUs (operational taxonomic units) by ≥97% similarity using UPARSE (version 9.2.64). The sequence with the highest abundance was selected as the representative sequence for each OTU. Intergroup-specific OTUs were analyzed using the R language VennDiagram package (version 1.6.16) and the UpSetR package (version 1.3.3) for Venn and upset graph analyses, respectively. Non-metric multi-dimensional scaling (NMDS) of (Un)-weighted UniFrac, Jaccard, and Bray–Curtis distances was generated in the R project Vegan package (version 2.5.3) and plotted in the R project ggplot2 package (version 2.2.1). To predict these functions, Kyoto Encyclopedia of Genes and Genomes (KEGG) pathway analysis of the OTUs was performed using PICRUSt (version 2.1.4).

2.8. Utilization of GMOS by Intestinal Bacteria

The anaerobic fermentation solution (1 mL) was centrifuged (2000 rpm, 5 min), and an equal volume of 8% H2SO4 was added to the supernatant. The acid digestion process was carried out in a sterilizer at 121 °C for 1 h. When the reaction was complete, the digested solution was moved out and cooled to room temperature. Then, 40 μL was added to 1 mL of the digested solution. The digested solution was analyzed using the Dionex ICS-5000 system under the same conditions as described in Section 2.3. The following equations were used:
Utilization   % = C OS     C FS C OS   ×   100 %
  • COS: original sugar concentration.
  • CFS: final sugar concentration.

2.9. Statistical Analysis

SPSS (2008) statistical software (Ver. 16.0 for Windows, SPSS Inc., Chicago, IL, USA) was used to analyze the data by ANOVA. Tukey’s multiple range test was used to separate differences in means between treatment groups. p values below 0.05 were considered statistically significant.

3. Results and Discussion

3.1. Optimization of Enzymatic Hydrolysis Conditions for GMOS Production

To optimize the enzymatic hydrolysis of GMOS, Gleditsia microphylla seeds with a GM content of 28.9% were used as the substrate during the enzymatic hydrolysis of GMOS. Seeds were chosen instead of GM to avoid the extraction of GM and to maintain the low viscosity of the enzymatic system. The optimization of the enzymatic hydrolysis conditions was performed during the investigation of temperature, pH, enzyme loading, and substrate loading.
To investigate the effect of reaction temperature on the GMOS yield obtained from Gleditsia microphylla as well as the monosaccharide yield and enzyme selectivity toward the substrate, enzymatic hydrolysis reactions were conducted at a pH of 5 with an enzyme loading of 20 U/g-GM and a substrate loading of 20 g/L. The results are shown in Figure 1a. The results reveal that the temperature used during enzymatic hydrolysis had a significant impact on the GMOS yield. Specifically, the GMOS yield increased from 22.9% to 50.7% as the hydrolysis temperature increased from 30 °C to 50 °C, but then it decreased to 46.5% when the temperature was raised to 80 °C. Meanwhile, the enzyme selectivity decreased from 90.1% at 30 °C to 81.6% at 50 °C, and then increased to 93.2% at 70 °C, and finally dropped to 92.4%. Moreover, the highest monosaccharide yield of 11.4% was achieved at 50 °C.
To further investigate enzymatic hydrolysis optimization, an enzyme loading of 20 U/g-GM and substrate loading of 20 g/L were used with a temperature of 50 °C. The effect of pH on the GMOS yield was evaluated, and the results are shown in Figure 1b. As the pH increased from 3 to 8, the GMOS yield increased from 39.5% (pH 3.0) to 51.4% (pH 5.0) and then decreased to 42.6% (pH 8.0). Additionally, the enzyme selectivity for the substrate increased from 79.7% to 83.9% as the pH increased from 3 to 6. However, when the pH was increased to 8, the enzyme selectivity for the substrate decreased to 81.6%. The monosaccharide yield ranged from 8.9% (pH 6) to 10.9% (pH 5).
The impact of enzyme loading on GMOS yield was evaluated, as shown in Figure 1c, and the results indicated that as enzyme loading increased from 5 to 20 U/g-GM, the GMOS yield increased from 12.7% to 59.1%, respectively. However, when the enzyme loading was further increased to 30 U/g GM, the GMOS yield increased only slightly to 60.1%. Moreover, enzyme selectivity towards the substrate increased from 55.4% at 5 U/g-GM to 81.4% at 20 U/g-GM before declining to 77.5% at 30 U/g-GM. Therefore, 20 U/g GM was determined to be the optimal amount for enzyme loading.
Finally, the impact of substrate loading on GMOS yield was examined. As shown in Figure 1d, as the substrate loading increased from 10 to 40 g/L, the GMOS yield increased from 53.0% to 72.8%. However, at a substrate loading of 60 g/L, GMOS yield decreased to 19.9%. Moreover, the monosaccharide yield increased from 10.5% (10 g/L) to 22.3% (50 g/L) before declining to 20.8% at a substrate loading of 60 g/L, whereas the enzyme selectivity dropped from 83.4% (10 g/L) to 48.8% (60 g/L) because of changes in the monosaccharide yield.
In summary, under these optimal conditions, i.e., 50 °C, pH 5, 20 U/g-GM, and 40 g/L, the GMOS yield was 72.8%, the enzyme selectivity to the substrate was 82.3%, and the number-average degree of polymerization of GMOS was 7.27.

3.2. Effect of GMOS on the Physiological Activity of Intestinal Bacteria

Ethanol precipitation of the enzymatic digests was performed to remove impurities, followed by centrifugation. Subsequently, the supernatant containing ethanol was evaporated at low temperatures until the ethanol was removed, and the supernatant was freeze dried to form solid GMOS. The obtained GMOS were purified until they were 85.0% pure, and they were used as a carbon source to evaluate in vitro intestinal bacterial fermentation for 48 h.
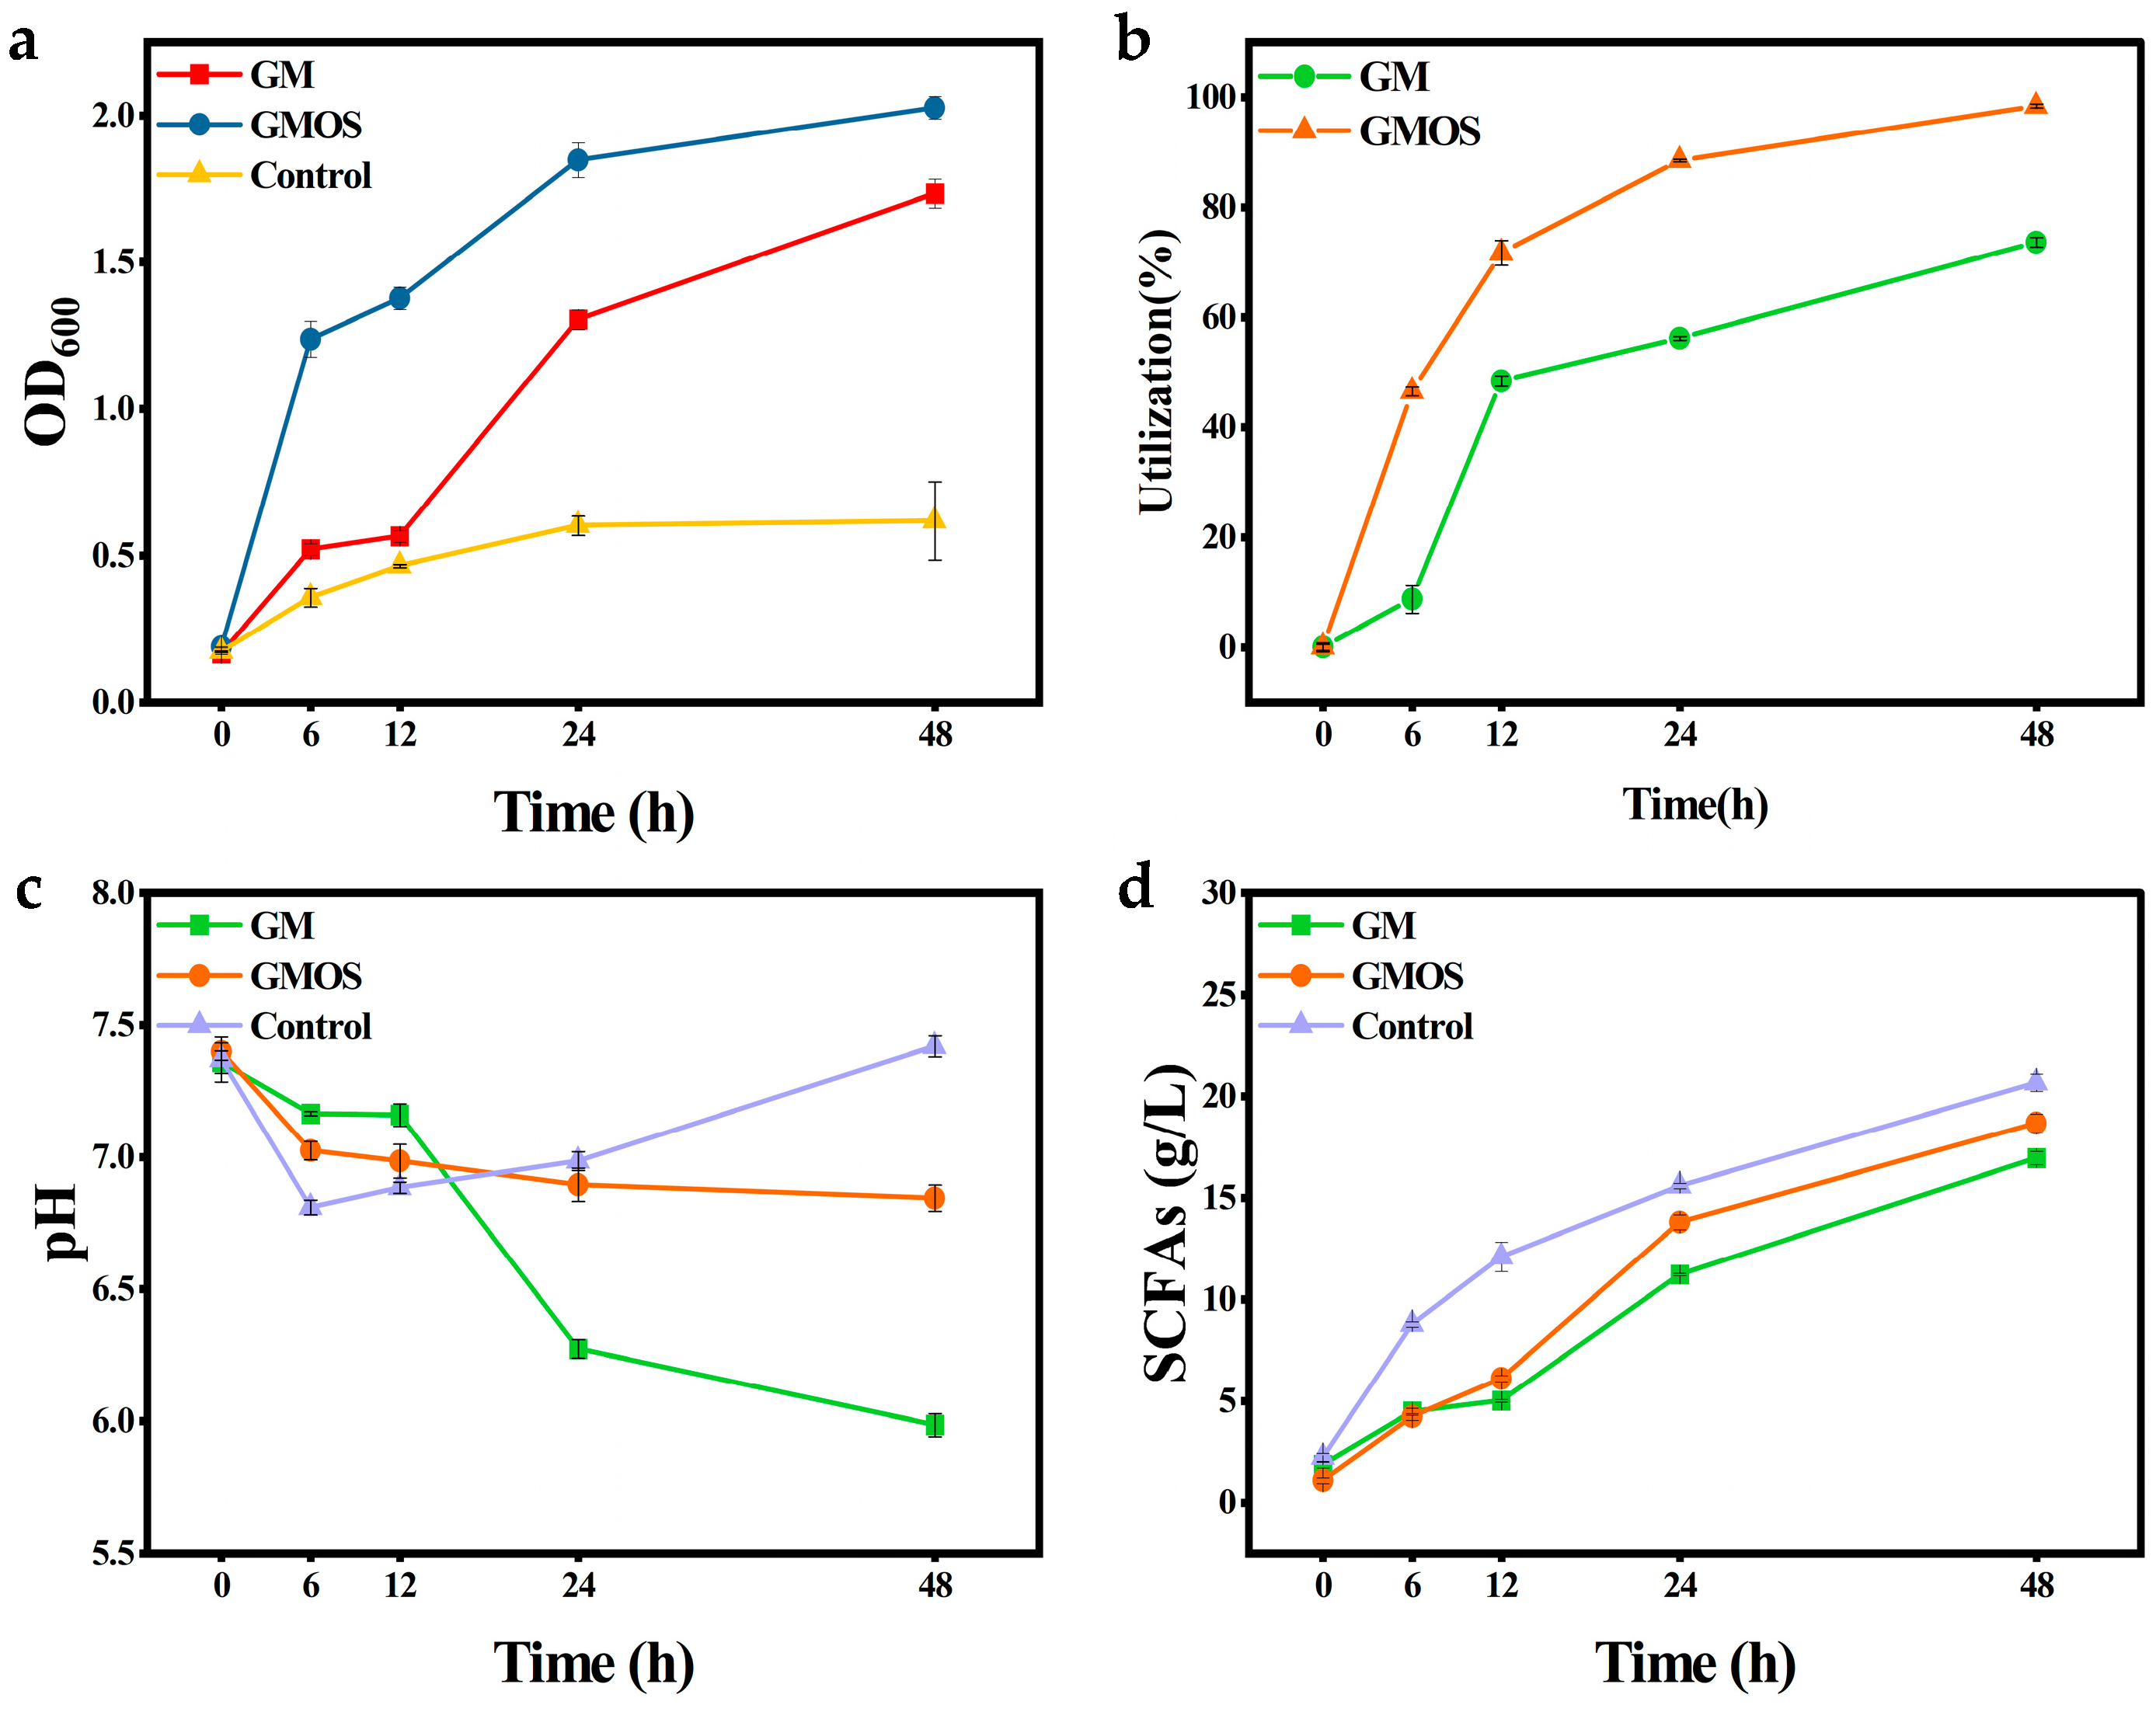
As shown in Figure 2a, a significant increase in gut microbial density was observed, with over a nine-fold increase, compared to the original density (p < 0.05). The superior absorption ability of GMOS was further demonstrated by the OD600 value, which was 16.9% higher than that of GM at 48 h, compared to that observed with GM. Meanwhile, the utilization of GMOS by intestinal bacteria reached 98.4% (48 h), owing to the effective absorption of GMOS. The level of GMOS absorption was 24.8% higher than that of GM (Figure 2b, p < 0.05). Intestinal bacteria produced SCFAs after consuming carbon sources, which altered the pH of the environment (Figure 2c, p < 0.05). However, in this study, the SCFA concentration in the control group was the highest among all groups during the entire fermentation process (Figure 2d, p < 0.05). Meanwhile, the pH of the control decreased to 6.8 (6 h) and then increased to 7.4 (48 h), and the pH of the GM and GMOS groups decreased to 5.9 (48 h) and 6.8 (48 h), respectively.
Following the completion of fermentation, the concentration of short-chain fatty acids (SCFAs) and lactic acid in the fermentation broth was quantified, and the findings are summarized in Table 1. Among the SCFAs, propionic acid emerged as the predominant component in the fermentation broth, exhibiting a higher concentration than acetic acid and butyric acid, with lactic acid demonstrating the lowest concentration. Specifically, the utilization of GMOS as the carbon source led to an elevated proportion of propionic acid, constituting 43.45%, as opposed to 38.13% when GM was utilized as the carbon source. However, it is noteworthy that the overall concentration of SCFAs was comparatively lower in both the GM and GMOS experimental groups in contrast to the control group.

3.3. Diversity Analysis of Human Intestinal Bacteria

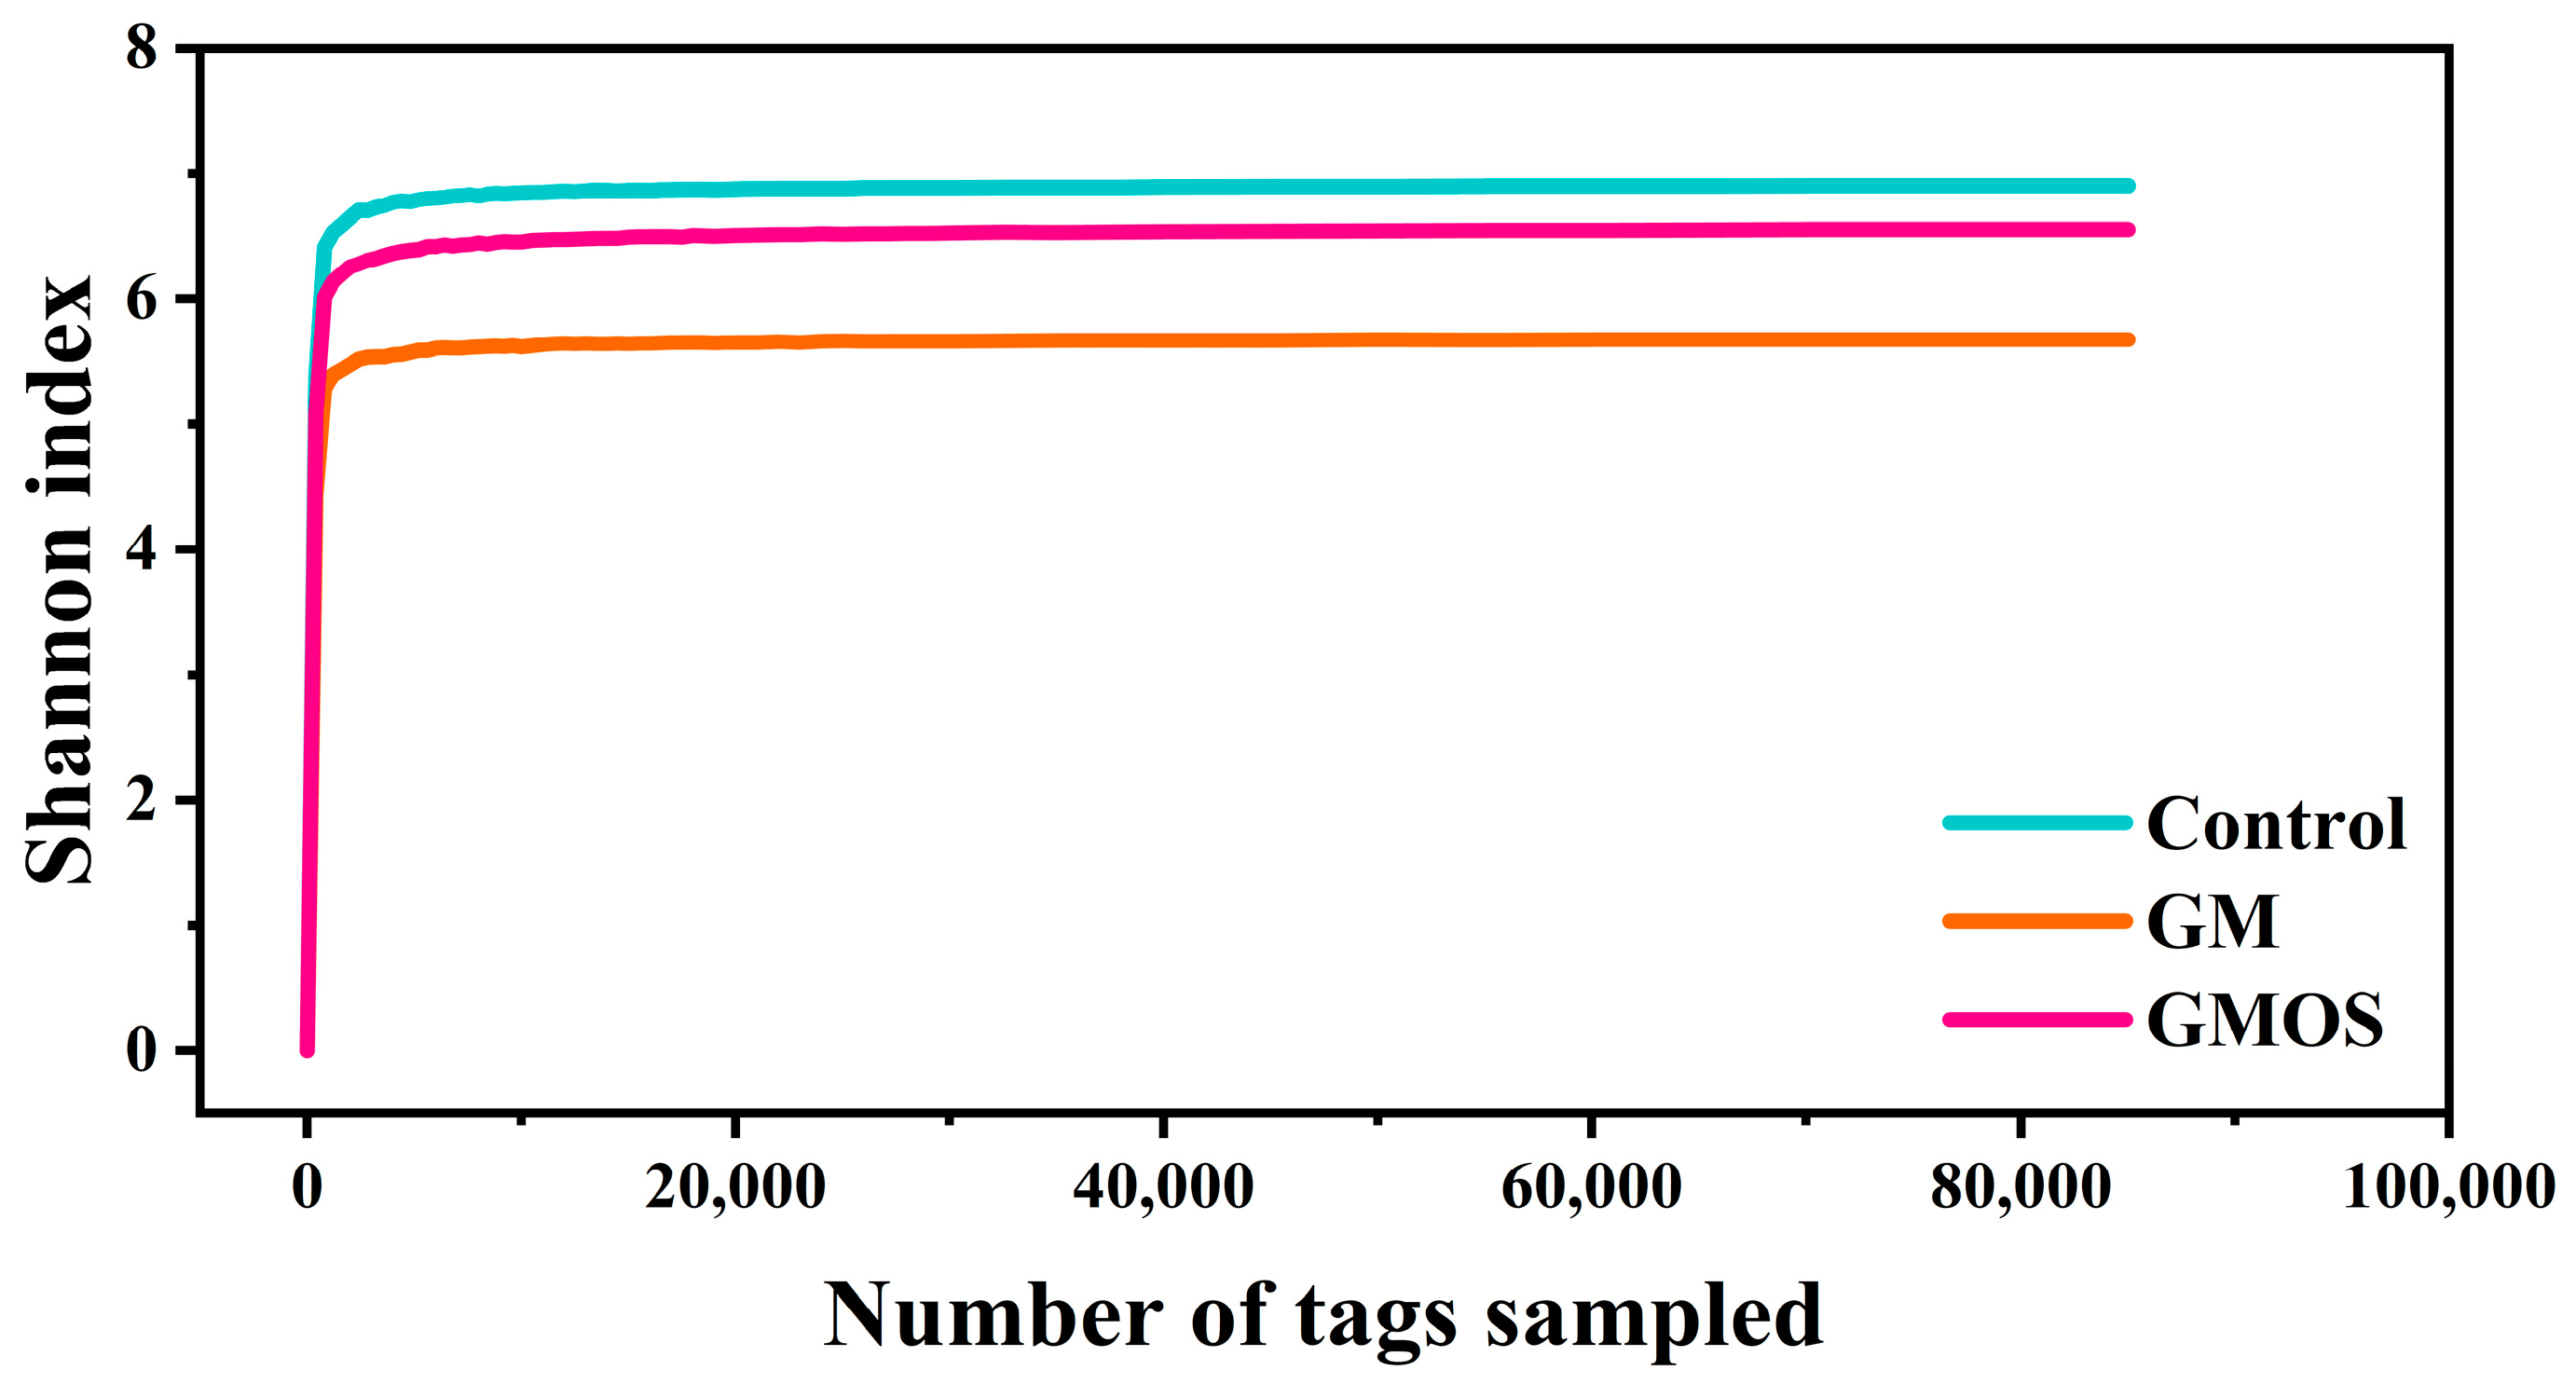
To investigate the effects of GM and GMOS on the gut microbiota structure, 16s rRNA sequencing was performed on both the GM and GMOS groups. Figure 3 shows the rarefaction curve based on the Shannon index, which considers both the number of species and their evenness in the samples. It is generally assumed that an increase in the sequencing depth has no effect on species diversity when the curve tends to flatten. The results shown in Figure 2 indicate that the sequencing depth was adequate for analysis.

3.3.1. NMDS and Venn Analysis of 16S rRNA Sequencing Data

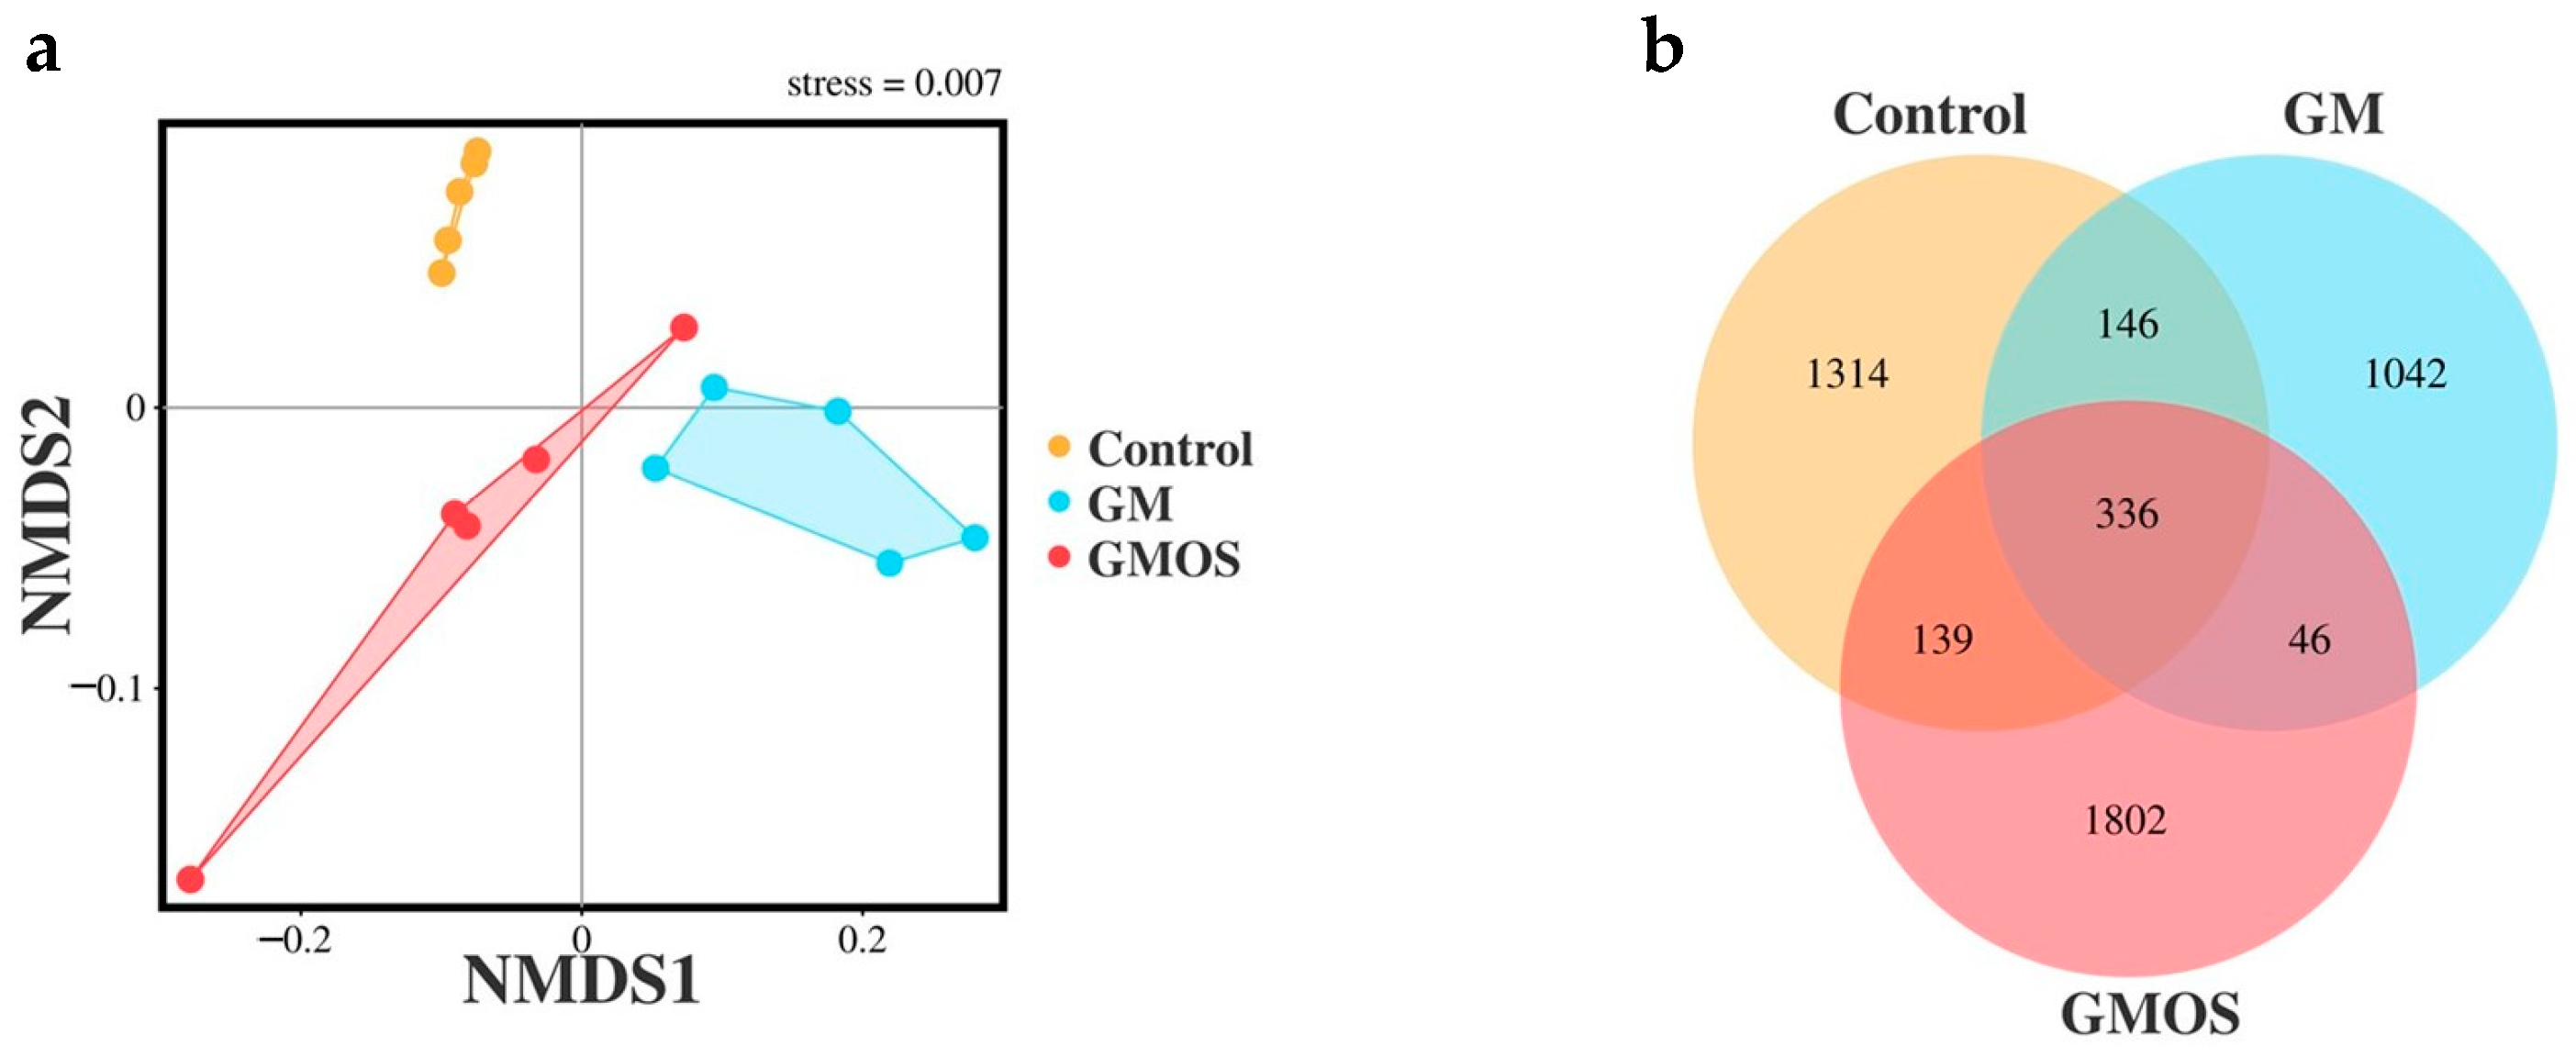
To investigate the effects of GMOS on the composition of intestinal bacteria during in vitro human fecal fermentation, we performed 16S rRNA sequencing. The resulting OTU data were evaluated by NMDS analysis (Figure 4a). Our results revealed a significant difference in the composition of intestinal bacteria between the control (without added sugars), GM, and GMOS groups, indicating that the addition of GMOS resulted in a distinct change in the composition of intestinal bacteria (stress < 0.05). In addition, the Venn diagram (Figure 4b) depicts the distribution of OTUs among the three groups and shows that 1848 OTUs in the GMOS group and 1088 OTUs in the GM group were different from those in the control group when GMOS or GM were used as the carbon source during fermentation, which is in accordance with the results of the NMDS analysis.

3.3.2. Alpha Diversity of Human Intestinal Bacteria

The Sobs, Shannon, and Simpson indices were calculated to analyze the alpha diversity of the samples (Table 2). The Sobs index indicated that the GMOS group had significantly higher scores than the control and GM groups (p < 0.05). The Shannon index (p < 0.05) revealed that the diversity of the gut microbiota decreased with the addition of GM and GMOS. However, the Simpson index revealed only a slight difference between the GM and control groups, and no difference between the GMOS and control groups.

3.3.3. Changes in the Composition of Intestinal Bacteria

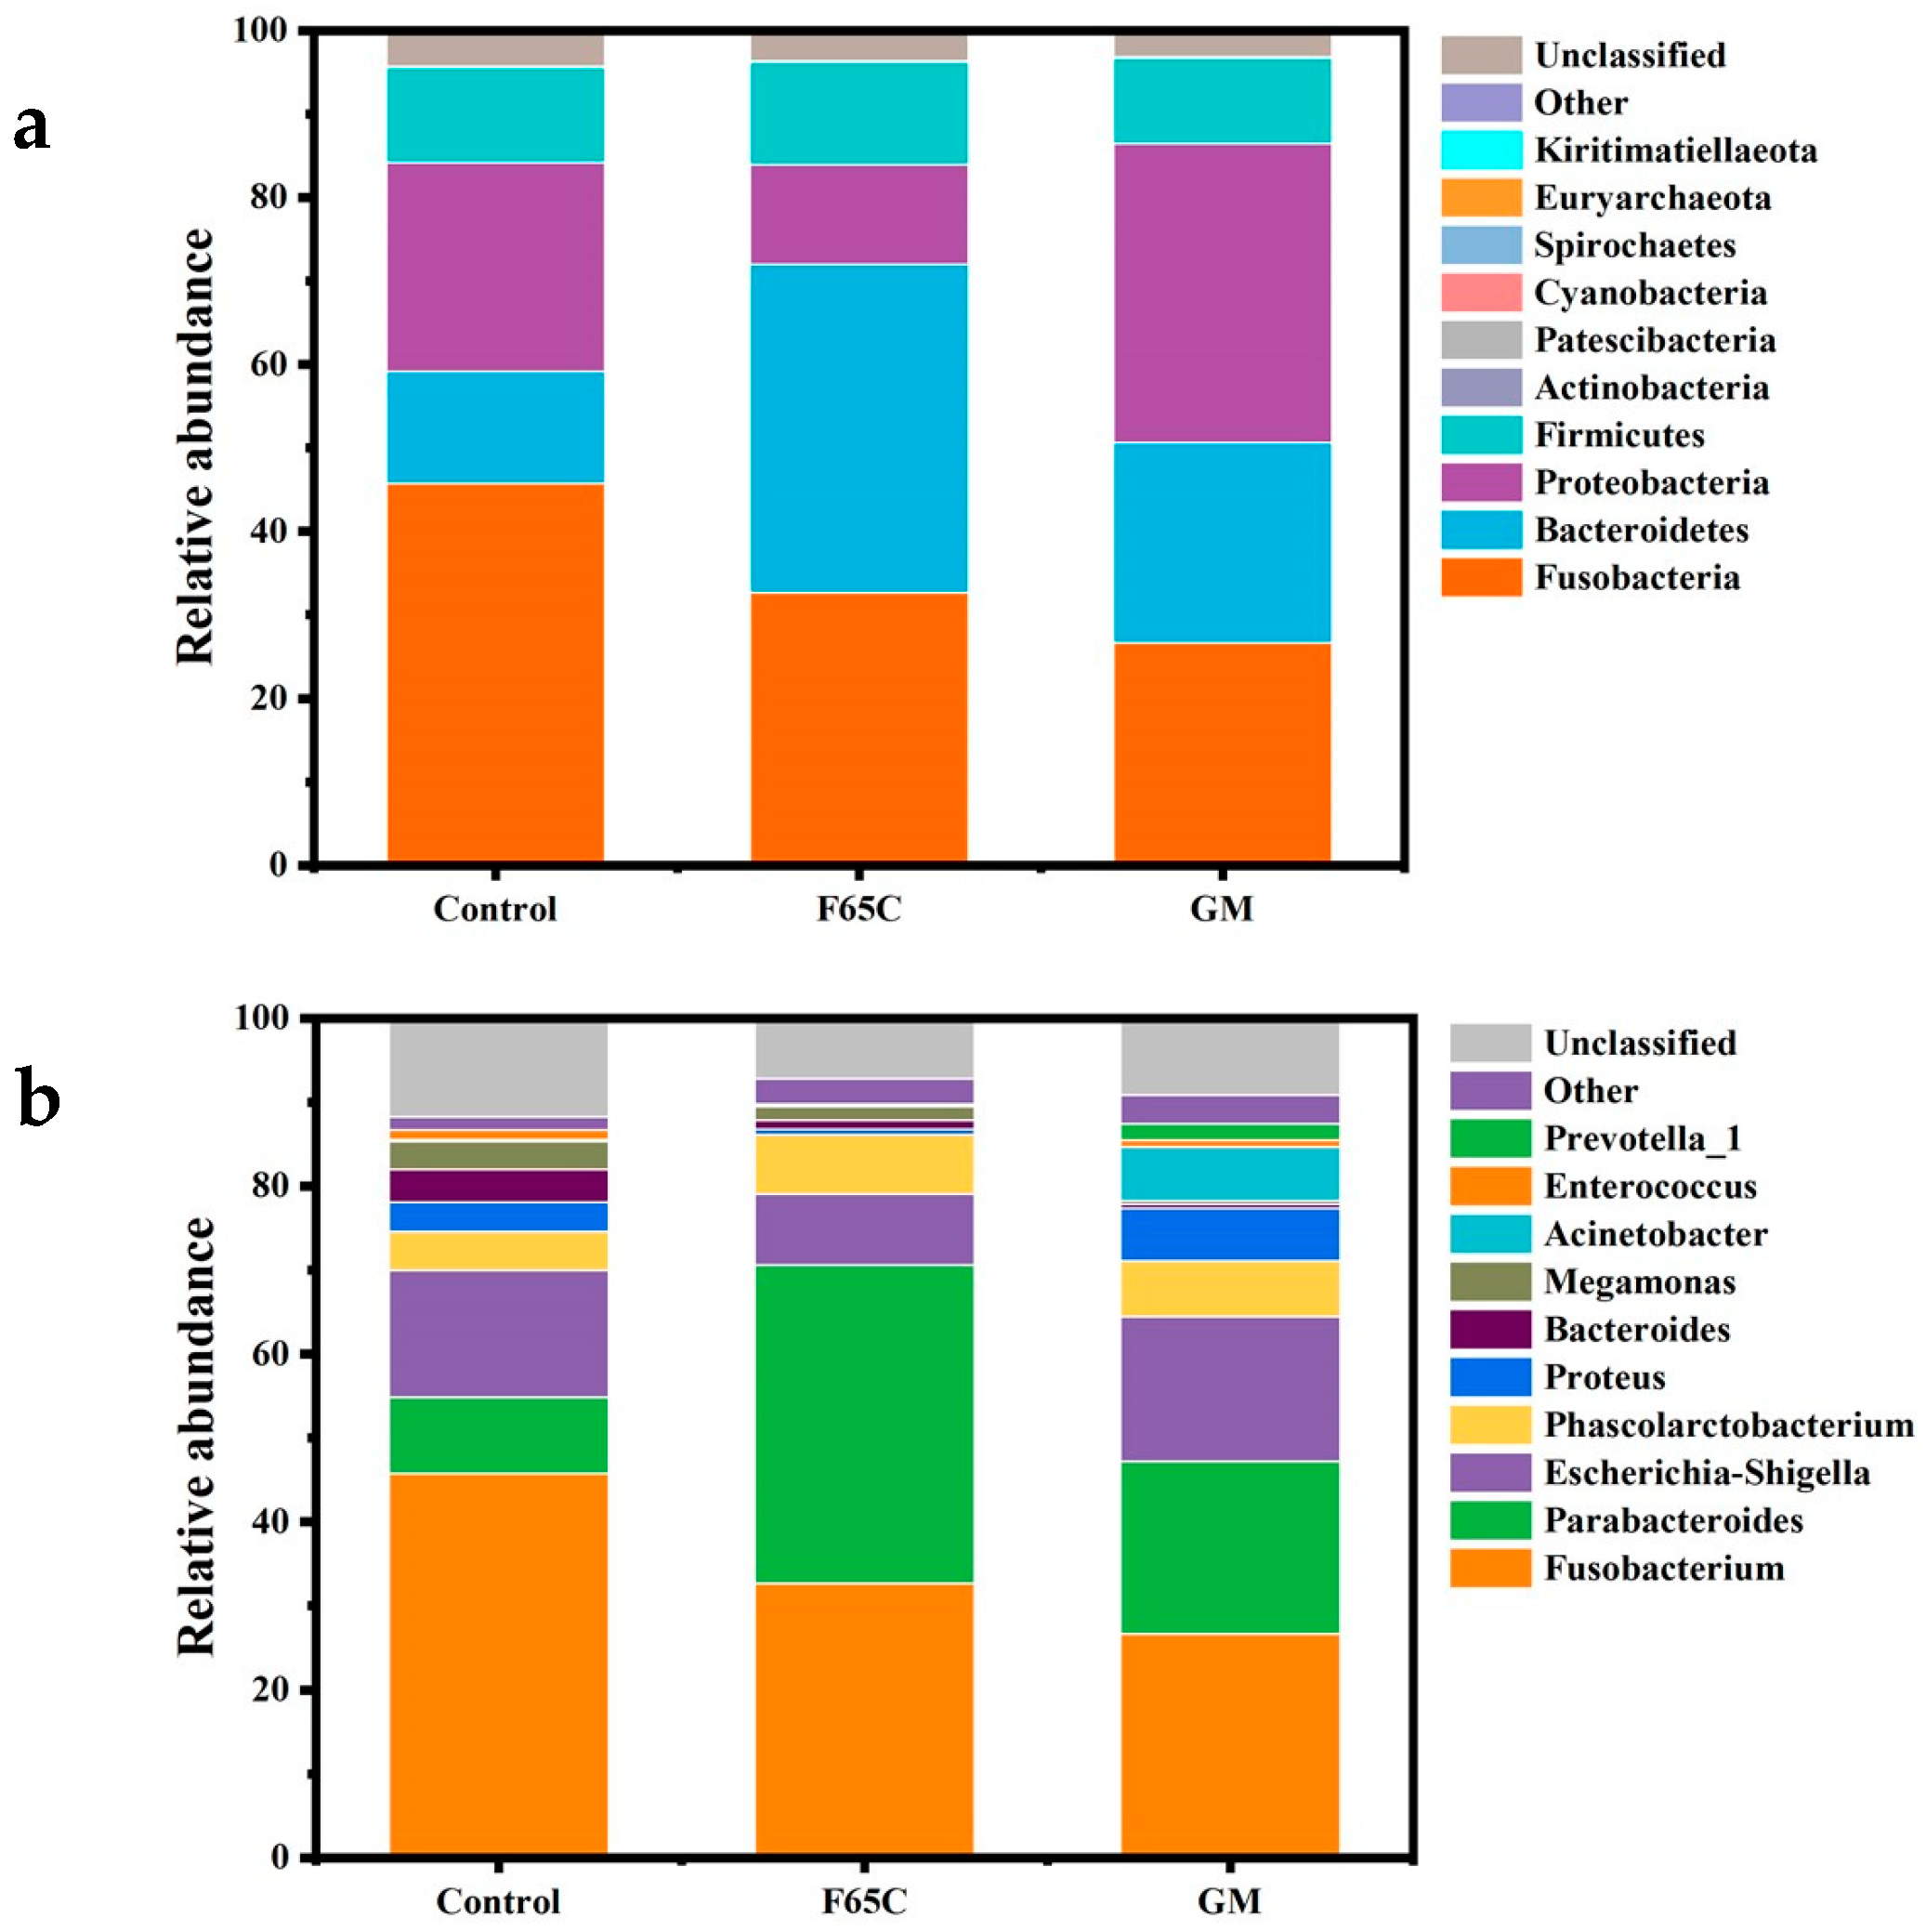
To investigate the effects of GM and GMOS on human intestinal bacteria, we analyzed differences at the phylum level (Figure 5a). Intestinal bacteria primarily belong to phyla such as Fusobacteria, Bacteroidetes, Proteobacteria, and Firmicutes. Compared with the control group, the relative abundance of the phylum Fusobacteria was significantly decreased in both the GM and GMOS groups (p < 0.05), from 45.82% to 13.12% and 19.13%, respectively. The relative abundance of the phylum Bacteroidetes varied between the GM and GMOS groups; it increased from 13.38% in the control group to 39.31% in the GM group (p < 0.05) and to 23.96% in the GMOS group. The relative abundance of Proteobacteria significantly increased in the GMOS group compared to the control group (p < 0.05), from 25.05% to 35.82%, and decreased from 25.05% to 11.98% in the GM group. However, GM and GMOS did not have a significant effect on the phyla Firmicutes.
We analyzed the composition of intestinal bacteria at the genus level (Figure 5b). In the control group (p < 0.05), classifiable sequences were mainly composed of Parabacteroides (9.11%), Fusobacterium (45.82%), Escherichia-Shigella (15.12%), and Phascolarctobacterium (4.61%). These species composed 37.92%, 32.70%, 8.47%, and 7.07% of the sequences in the GM group (p < 0.05), respectively. Compared to the control group, the relative abundance levels of Parabacteroides, Phascolarctobacterium, and Escherichia-Shigella increased to 20.53%, 6.69%, and 17.25%, respectively, and the abundance level of Fusobacterium declined to 26.69% in the GMOS group (p < 0.05). Based on these results, GM was found to exhibit a significant effect on Parabacteroides, while GMOS had a significant impact on Fusobacterium.

3.4. Functional Analysis of Intestinal Bacteria Affected by GMOS

Based on the 16S rRNA sequencing results, the PICRUSt2 method was used to predict the effects of intestinal bacteria on the metabolic function. As shown in Figure 6a, at level 2, the GMOS group was significantly affected by genetic information processing, replication and repair, carbohydrate metabolism, metabolism of cofactors and vitamins, metabolism of other amino acids, and energy metabolism. At level 3, 10 metabolic (as shown in Figure 6b) pathways were promoted, resulting in lipoic acid metabolism being affected the most.

4. Discussion

An increase in the reaction temperature during enzymatic hydrolysis increases the activation energy of GM molecules [18] and improves the fluidity of the GM solution [19]. An increase in the temperature and pH within the optimal range for the reaction temperature and pH resulted in an increase in the activity of β-mannanase [20], which in turn increased the GMOS yield. However, when the temperature and pH exceeded the optimal range, β-mannanase activity decreased, leading to a decrease in the GMOS yield. In addition, the GMOS yield was related to the enzyme loading process. However, the GMOS yield improved by only 1.0% when enzyme loading was further increased to 30 U/g GM. This is attributable to the limited GM release rate of Gleditsia microphylla seed powder [21,22] and the limited number of binding sites between β-mannanase and GM in the enzymatic system [23,24]. Therefore, when the substrate loading increased to 40 g/L, the GMOS yield increased to 72.8%. However, the GMOS yield decreased when substrate loading was increased to 50 and 60 g/L, owing to the absorbent solution containing Gleditsia microphylla seed powder. The rapid decrease in the solution volume made it difficult to achieve the stirring of the enzyme system containing β-mannanase and GM. Eventually, the GMOS level and the enzyme selectivity to the substrate decreased [25].
GM and GMOS were used as carbon sources for the in vitro fermentation of human fecal matter. The level of proliferation of the gut microbes in the GMOS group was higher than that in the GM group (Figure 2a). This was attributable to the utilization of GMOS by intestinal bacteria being higher than that of GM [26]. It has been reported that a negative correlation exists between the pH and SCFA concentration [27]. During fermentation, the OD600 value of the control group was the lowest, and the intestinal bacteria consumed SCFAs, [28] causing the SCFA concentration in the GM and GMOS groups to be lower than that of the control group. Nevertheless, it was found that the GMOS was better in promoting the production of SCFAs, therefore, the reduction in polymerization did provide a beneficial effect on the prebiotic activity of GMOS. In addition, in this study, the GMOS added were oligosaccharide blends and the results showed that xylo-disaccharide and xylo-triose had better prebiotic activity [7]. Hence, we believe that further screening of GMOS with low polymerization will improve GMOS prebiotic activity.
At the phylum level, Fusobacteria were significantly inhibited in the GMOS group, and their effects were higher than those of the GM group. Polysaccharides with different molecular weights had varied effects on intestinal bacteria [29], and polysaccharides with lower molecular weights were utilized by intestinal bacteria more easily (Figure 2b). The inhibition of harmful bacteria by functional oligosaccharides occurs mainly through the proliferation of beneficial bacteria and improvement of the competitiveness between beneficial bacteria during the growth process, thus achieving the effect of inhibiting harmful bacteria [30]. The relative abundance of fusobacteria is positively associated with colon cancer [31]. The proliferation of Bacteroidetes was significantly higher in the GM group than in the GMOS group. The phylum Bacteroidetes can degrade polysaccharides [32] and contribute to the digestion of dietary fibers to produce propionic acid [33]. The relative abundance of Bacteroidetes in the GM group was higher than that in the GMOS group because GM must be degraded before it can be utilized by the gut microbiota [26]. GM increases the proliferation of Bacteroidetes.
At the genus level, there was a remarkable decrease in the relative abundance of Fusobacterium. It had been reported that the relative abundance of Fusobacterium was associated with the occurrence of colorectal cancer. The abundance of Fusobacterium was higher in the tumors of patients with colorectal carcinoma than in the healthy colon [34]. The effect of GM on Parabacteroides was greater than that on GMOS. Parabacteroides have the ability to metabolize carbohydrates and produce SCFAs [35], and have beneficial effects on metabolic disorders [36,37]. However, it is debatable whether Parabacteroides are beneficial or pathogenic. P. distasonis, a species belonging to the genus Parabacteroides, is thought to result in the fermentation and production of methane, which is associated with the pathogenesis of colon cancer. P. distasonis exhibits significant drug resistance [38]. Therefore, an assessment of the effects of GM and GMOS on Parabacteroides has not been conducted till date.
GMOS had maximal effects on lipoic acid metabolism. Lipoic acid, also known as alpha-lipoic acid (ALA), is a naturally occurring compound capable of reducing oxidative damage to deoxyribonucleic acids, proteins, and lipids in cell membranes [39], and directly scavenging reactive oxygen and nitrogen species [40]. In addition, ALA inhibited the proliferation of lung cancer cells in vitro and cancer growth in vivo by inducing mTOR-mediated inhibition of autophagy [41].

5. Conclusions

In this investigation, GMOS were produced through enzymatic degradation of GM using β-mannanase enzyme under controlled conditions of 50 °C, pH 5, 20 U/g-GM, and 40 g/L, thereby attaining a notable yield of 72.8%. Subsequent in vitro fermentation experiments employing GMOS as a carbon source demonstrated profound transformations in the composition of the human gut microbiota, and these alterations were statistically significant. Notably, GMOS exhibited a substantial proliferation of the phylum Bacteroidetes, alongside a discernible inhibitory effect on the phylum Fusobacteria. Furthermore, the impact of GMOS extended to the regulation of lipoic acid metabolism and other metabolic activities, which are intrinsically associated with mitochondrial health and result in compelling anti-inflammatory effects. Consequently, these functions are associated with mitochondrial health and result in anti-inflammatory effects. These findings suggest that GMOS can be used as a dietary supplement to improve gut health and to prevent or treat certain diseases.

Author Contributions

Investigation, H.W., R.T.; Supervision, Q.Y.; Writing—original draft, H.W.; Writing—review and editing, C.L., Y.T. and M.Z. All authors have read and agreed to the published version of the manuscript.

Funding

This study was funded by the National Key R&D Program of China (2022YFD2200804).

Institutional Review Board Statement

Not applicable.

Informed Consent Statement

Not applicable.

Data Availability Statement

Not applicable.

Conflicts of Interest

The authors declare that this study was conducted in the absence of any commercial or financial relationships that could be construed as potential conflict of interest.

References

  1. Jiang, J.; Zhang, W.; Zhu, L.; Li, X. Exploitation and Distribution of Gleditsia microphylla Resources. Chin. Wild Plant Resour. 2015, 22–23+33. [Google Scholar]
  2. Takagi, T.; Ducros, V.M.-A.; Flint, J.E.; Roberts, S.M.; Morland, C.; Zechel, D.L.; Smith, N.; Bjørnvad, M.E.; Borchert, T.V.; Wilson, K.S.; et al. Partially hydrolysed guar gum ameliorates murine intestinal inflammation in association with modulating luminal microbiota and SCFA. Br. J. Nutr. 2016, 116, 1199–1205. [Google Scholar] [CrossRef] [Green Version]
  3. Zhou, M.; Tao, Y.; Wang, T.; Wang, R.; Yong, Q. Assessing the in vitro digestion of Sesbania gum, a galactomannan from S. cannabina, and subsequent impact on the fecal microbiota. J. Funct. Foods 2021, 87, 104766. [Google Scholar] [CrossRef]
  4. Mathur, N.K. Industrial Galactomannan Polysaccharides; CRC Press: Boca Raton, FL, USA, 2011. [Google Scholar]
  5. Tao, Y.; Wang, T.; Huang, C.; Lai, C.; Ling, Z.; Zhou, Y.; Yong, Q. Incomplete degradation products of galactomannan from Sesbania cannabina modulated the cecal microbial community of laying hens. J. Anim. Sci. 2022, 100, skac087. [Google Scholar] [CrossRef] [PubMed]
  6. Jana, U.K.; Kango, N.; Pletschke, B. Hemicellulose-Derived Oligosaccharides: Emerging Prebiotics in Disease Alleviation. Front. Nutr. 2021, 8, 670817. [Google Scholar] [CrossRef] [PubMed]
  7. Ganter, J.L.M.; Heyraud, A.; Petkowicz, C.L.; Rinaudo, M.; Reicher, F. Galactomannans from Brazilian seeds: Characterization of the oligosaccharides produced by mild acid hydrolysis. Int. J. Biol. Macromol. 1995, 17, 13–19. [Google Scholar] [CrossRef] [PubMed]
  8. Liao, J.; Pan, B.; Liao, G.; Zhao, Q.; Gao, Y.; Chai, X.; Zhuo, X.; Wu, Q.; Jiao, B.; Pan, W.; et al. Synthesis and immunological studies of β-1, 2-mannan-peptide conjugates as antifungal vaccines. Eur. J. Med. Chem. 2019, 173, 250–260. [Google Scholar] [CrossRef]
  9. Bhattacharya, A.; Wiemann, M.; Stålbrand, H. β-Mannanase BoMan26B from Bacteroides ovatus produces mannan-oligosaccharides with prebiotic potential from galactomannan and softwood β-mannans. Lebensm.-Wiss. Technol. 2021, 151, 112215. [Google Scholar] [CrossRef]
  10. Moura, P.; Barata, R.; Carvalheiro, F.; Gírio, F.; Loureiro-Dias, M.C.; Esteves, M.P. In vitro fermentation of xylo-oligosaccharides from corn cobs autohydrolysis by Bifidobacterium and Lactobacillus strains. LWT-Food Sci. Technol. 2007, 40, 963–972. [Google Scholar] [CrossRef]
  11. Ahmad, N.; Zakaria, M.R. Chapter 8-Oligosaccharide From Hemicellulose. In Lignocellulose for Future Bioeconomy; Ariffin, H., Sapuan, S.M., Hassan, M.A., Eds.; Elsevier: Amsterdam, The Netherlands, 2019; pp. 135–152. [Google Scholar] [CrossRef]
  12. Huang, C.; Yu, Y.; Li, Z.; Yan, B.; Pei, W.; Wu, H. The preparation technology and application of xylo-oligosaccharide as prebiotics in different fields: A review. Front. Nutr. 2022, 9, 996811. [Google Scholar] [CrossRef]
  13. Deloule, V.; Boisset, C.; Hannani, D.; Suau, A.; Le Gouellec, A.; Chroboczek, J.; Botté, C.; Yamaryo-Botté, Y.; Chirat, C.; Toussaint, B. Prebiotic role of softwood hemicellulose in healthy mice model. J. Funct. Foods 2020, 64, 103688. [Google Scholar] [CrossRef]
  14. Pangsri, P.; Piwpankaew, Y.; Ingkakul, A.; Nitisinprasert, S.; Keawsompong, S. Characterization of mannanase from Bacillus circulans NT 6.7 and its application in mannooligosaccharides preparation as prebiotic. Springerplus 2015, 4, 771. [Google Scholar] [CrossRef] [PubMed] [Green Version]
  15. Andrés-Barranco, S.; Vico, J.P.; Grilló, M.J.; Mainar-Jaime, R.C. Reduction of subclinical Salmonella infection in fattening pigs after dietary supplementation with a ß-galactomannan oligosaccharide. J. Appl. Microbiol. 2015, 118, 284–294. [Google Scholar] [CrossRef] [PubMed] [Green Version]
  16. Singh, S.; Ghosh, A.; Goyal, A. Manno-oligosaccharides as prebiotic-valued products from agro-waste. In Biosynthetic Technology and Environmental Challenges; Varjani, S.J., Parameswaran, B., Kumar, S., Khare, S.K., Eds.; Springer: Singapore, 2018; pp. 205–221. [Google Scholar] [CrossRef]
  17. Tao, Y.; Ma, J.; Huang, C.; Lai, C.; Ling, Z.; Yong, Q. The immunomodulatory activity of degradation products of Sesbania cannabina galactomannan with different molecular weights. Int. J. Biol. Macromol. 2022, 205, 530–538. [Google Scholar] [CrossRef]
  18. Piskulich, Z.A.; Mesele, O.O.; Thompson, W.H. Activation energies and beyond. J. Phys. Chem. A 2019, 123, 7185–7194. [Google Scholar] [CrossRef] [Green Version]
  19. Gadkari, P.V.; Reaney, M.J.T.; Ghosh, S. Assessment of gelation behaviour of fenugreek gum and other galactomannans by dynamic viscoelasticity, fractal analysis and temperature cycle. Int. J. Biol. Macromol. 2019, 126, 337–344. [Google Scholar] [CrossRef]
  20. Yang, L.; Shi, G.; Tao, Y.; Lai, C.; Li, X.; Zhou, M.; Yong, Q. The increase of incomplete degradation products of galactomannan production by synergetic hydrolysis of β-Mannanase and α-galactosidase. Appl. Biochem. Biotechnol. 2021, 193, 405–416. [Google Scholar] [CrossRef]
  21. Gaisford, S.E.; Harding, S.; Mitchell, J.; Bradley, T. A comparison between the hot and cold water soluble fractions of two locust bean gum samples. Carbohydr. Polym. 1986, 6, 423–442. [Google Scholar] [CrossRef]
  22. Whistler, R.L.; BeMiller, J.N. Industrial Gums: Polysaccharides and Their Derivatives; Academic Press: Cambridge, MA, USA, 1993. [Google Scholar]
  23. Malgas, S.; van Dyk, J.S.; Pletschke, B.I. A review of the enzymatic hydrolysis of mannans and synergistic interactions between β-mannanase, β-mannosidase and α-galactosidase. World J. Microbiol. Biotechnol. 2015, 31, 1167–1175. [Google Scholar] [CrossRef]
  24. Tailford, L.E.; Ducros, V.M.A.; Flint, J.E.; Roberts, S.M.; Morland, C.; Zechel, D.L.; Smith, N.; Bjornvad, M.E.; Borchert, T.V.; Wilson, K.S.; et al. Understanding how diverse β-mannanases recognize heterogeneous substrates. Biochemistry 2009, 48, 7009–7018. [Google Scholar] [CrossRef]
  25. Yan, B.; Tao, Y.; Huang, C.; Lai, C.; Yong, Q. Using One-pot Fermentation Technology to Prepare Enzyme Cocktail to Sustainably Produce Low Molecular Weight Galactomannans from Sesbania cannabina Seeds. Appl. Biochem. Biotechnol. 2022, 194, 3016–3030. [Google Scholar] [CrossRef] [PubMed]
  26. Tingirikari, J.M.R. Microbiota-accessible pectic poly- and oligosaccharides in gut health. Food Funct. 2018, 9, 5059–5073. [Google Scholar] [CrossRef] [PubMed]
  27. Munch Roager, H.; Vogt, J.K.; Kristensen, M.; Hansen, L.B.S.; Ibrügger, S.; Mærkedahl, R.B.; Bahl, M.I.; Lind, M.V.; Nielsen, R.L.; Frøkiær, H.; et al. Whole grain-rich diet reduces body weight and systemic low-grade inflammation without inducing major changes of the gut microbiome: A randomised cross-over trial. Gut 2019, 68, 83–93. [Google Scholar] [CrossRef] [Green Version]
  28. Wang, M.; Huang, H.; Wang, L.; Yang, H.; He, S.; Liu, F.; Tu, Q.; He, S. Herbal extract mixture modulates intestinal antioxidative capacity and microbiota in weaning piglets. Front. Microbiol. 2021, 12, 706758. [Google Scholar] [CrossRef]
  29. Wu, D.T.; He, Y.; Yuan, Q.; Wang, S.; Gan, R.-Y.; Hu, Y.-C.; Zou, L. Effects of molecular weight and degree of branching on microbial fermentation characteristics of okra pectic-polysaccharide and its selective impact on gut microbial composition. Food Hydrocoll. 2022, 132, 107897. [Google Scholar] [CrossRef]
  30. Li, R.; Tang, N.; Jia, X.; Xu, Y.; Cheng, Y. Antidiabetic activity of galactomannan from Chinese Sesbania cannabina and its correlation of regulating intestinal microbiota. J. Funct. Foods 2021, 83, 104530. [Google Scholar] [CrossRef]
  31. Abed, J.; Maalouf, N.; Manson, A.L.; Earl, A.M.; Parhi, L.; Emgård, J.E.M.; Klutstein, M.; Tayeb, S.; Almogy, G.; Atlan, K.A.; et al. Colon cancer-associated Fusobacterium nucleatum may originate from the oral cavity and reach colon tumors via the circulatory system. Front. Cell. Infect. Microbiol. 2020, 10, 400. [Google Scholar] [CrossRef] [PubMed]
  32. Wang, W.; Hu, H.; Zijlstra, R.T.; Zheng, J.; Gänzle, M.G. Metagenomic reconstructions of gut microbial metabolism in weanling pigs. Microbiome 2019, 7, 48. [Google Scholar] [CrossRef] [PubMed] [Green Version]
  33. Chen, Y.; Lin, H.; Cole, M.; Morris, A.; Martinson, J.; Mckay, H.; Mimiaga, M.; Margolick, J.; Fitch, A.; Methe, B.; et al. Signature changes in gut microbiome are associated with increased susceptibility to HIV-1 infection in MSM. Microbiome 2021, 9, 237. [Google Scholar] [CrossRef] [PubMed]
  34. McCoy, A.N.; Araújo-Pérez, F.; Azcárate-Peril, A.; Yeh, J.J.; Sandler, R.S.; Keku, T.O. Fusobacterium is associated with colorectal adenomas. PLoS ONE 2013, 8, e53653. [Google Scholar] [CrossRef]
  35. Cui, Y.; Zhang, L.; Wang, X.; Yi, Y.; Shan, Y.; Liu, B.; Zhou, Y.; Lü, X. Roles of intestinal Parabacteroides in human health and diseases. FEMS Microbiol. Lett. 2022, 369, fnac072. [Google Scholar] [CrossRef] [PubMed]
  36. You, J.; Liu, J.-F.; Yang, S.-Z.; Mu, B.-Z. Low-temperature-active and salt-tolerant β-mannanase from a newly isolated Enterobacter sp. strain N18. J. Biosci. Bioeng. 2016, 121, 140–146. [Google Scholar] [CrossRef] [PubMed]
  37. Zheng, Y.; Jiang, X.; Gao, Y.; Yuan, L.; Wang, X.; Wu, S.; Xia, Y.; Yao, L.; Yan, J.; Liu, L.; et al. Microbial profiles of patients with antipsychotic-related constipation treated with electroacupuncture. Front. Med. 2021, 8, 737713. [Google Scholar] [CrossRef] [PubMed]
  38. Ezeji, J.C.; Sarikonda, D.K.; Hopperton, A.; Erkkila, H.L.; Cohen, D.E.; Martinez, S.P.; Cominelli, F.; Kuwahara, T.; Dichosa, A.E.K.; Good, C.E.; et al. Parabacteroides distasonis: Intriguing aerotolerant gut anaerobe with emerging antimicrobial resistance and pathogenic and probiotic roles in human health. Gut Microbes 2021, 13, 1922241. [Google Scholar] [CrossRef] [PubMed]
  39. Smith, A.R.; Shenvi, S.V.; Widlansky, M.; Suh, J.H.; Hagen, T.M. Lipoic acid as a potential therapy for chronic diseases associated with oxidative stress. Curr. Med. Chem. 2004, 11, 1135–1146. [Google Scholar] [CrossRef]
  40. Goraca, A.; Skibska, B. Beneficial effect of α-lipoic acid on lipopolysaccharide-induced oxidative stress in bronchoalveolar lavage fluid. J. Physiol. Pharmacol. 2008, 59, 379–386. [Google Scholar]
  41. Peng, P.; Zhang, X.; Qi, T.; Cheng, H.; Kong, Q.; Liu, L.; Cao, X.; Ding, Z. Alpha-lipoic acid inhibits lung cancer growth via mTOR-mediated autophagy inhibition. FEBS Open Bio 2020, 10, 607–618. [Google Scholar] [CrossRef]
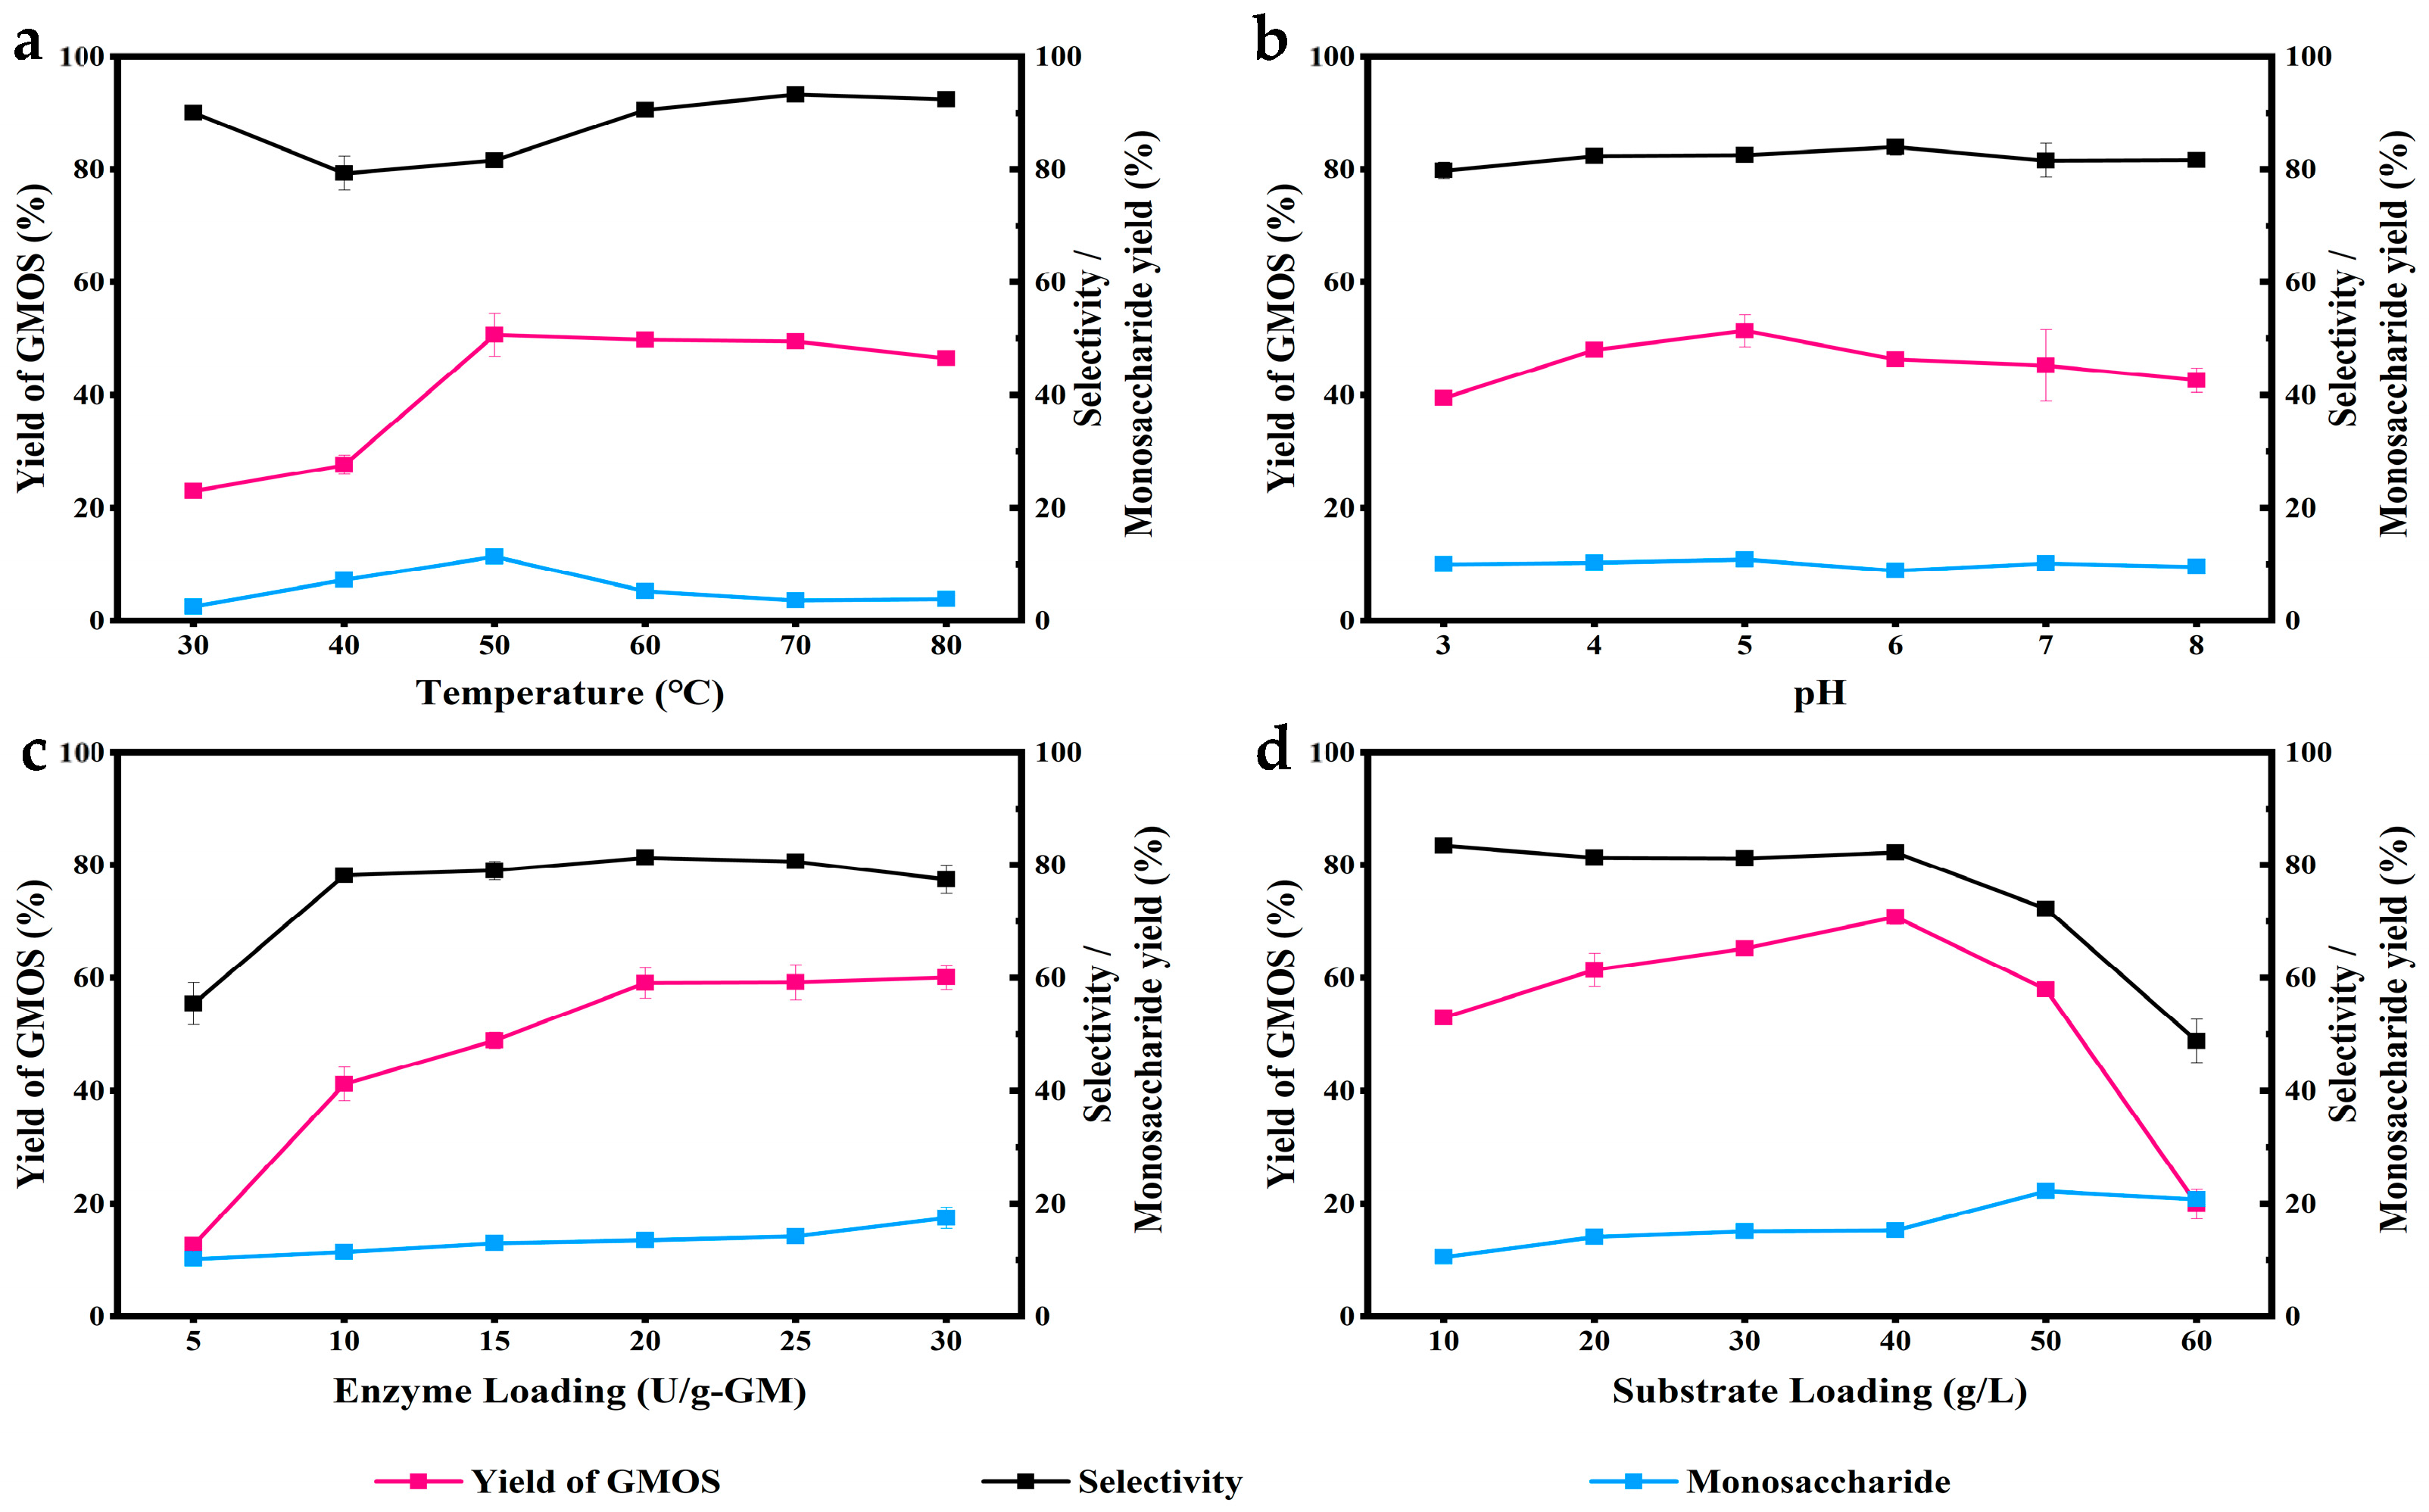
Figure 1. (a) Effect of temperature on the hydrolysis of GM; (b) Effect of pH on GM hydrolysis; (c) Effect of enzyme loading on GM hydrolysis; (d) Effect of substrate loading on GM hydrolysis.
Fermentation 09 00632 g001
Figure 2. The effect of GMOS on intestinal bacteria; proliferation of intestinal bacteria (a); utilization of intestinal bacteria (b); pH of the intestine (c); concentration of SCFAs in the intestine (d).
Fermentation 09 00632 g002
Figure 3. Rarefaction curves based on the Shannon index.
Fermentation 09 00632 g003
Figure 4. Evaluation of changes in fecal microbial composition using NMDS at the OTU level (a) and Venn diagram of GM, GMOS, and Control at the OTU level and (b) after the in vitro fermentation of human fecal matter. NMDS is based on the Bray–Curtis distance among observed intestinal bacteria, and all samples are collected after in vitro fermentation at 48 h (stress < 0.05).
Fermentation 09 00632 g004
Figure 5. Composition of intestinal microbiota in level (a) phyla and level (b) genus.
Fermentation 09 00632 g005
Figure 6. Comparison of effects of different carbon sources on metabolic functions in level 2 (a) and level 3 (b).
Fermentation 09 00632 g006
Table 1. Contents of short-chain fatty acids and lactate in fermentation with addition of GMOS and GM.
SamplesLactate (g/L)Acetate (g/L)Propionate (g/L)Butyrate (g/L)Total SCFA (g/L)p Value
GM0.49 c4.30 b5.51 a4.15 b13.96<0.001
GMOS0.29 d5.41 b7.36 a3.88 c16.65<0.001
Control0.00 c6.04 b8.50 a6.13 b20.67<0.001
a–d Different superscript letters in the same row differ significantly (p < 0.05).
Table 2. Effects of GMOS and GM on alpha diversity of human intestinal bacteria.
GroupControlGMGMOSp Value
Sobs888 a723.2 a1504.8 b<0.001
Shannon6.91 a5.68 b6.56 a<0.001
Simpson0.960.920.960.07
a,b Different superscript letters in the same row differ significantly (p < 0.05).
Disclaimer/Publisher’s Note: The statements, opinions and data contained in all publications are solely those of the individual author(s) and contributor(s) and not of MDPI and/or the editor(s). MDPI and/or the editor(s) disclaim responsibility for any injury to people or property resulting from any ideas, methods, instructions or products referred to in the content.