Article

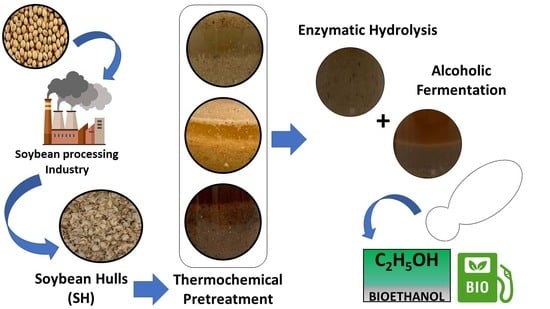
Multi-Response Optimization of Thermochemical Pretreatment of Soybean Hulls for 2G-Bioethanol Production

Grupo de Procesos Biológicos en Ingeniería Ambiental (GPBIA), Facultad de Ingeniería y Ciencias Hídricas (FICH), Universidad Nacional del Litoral (UNL), Consejo Nacional de Investigaciones Científicas y Técnicas (CONICET), Ciudad Universitaria CC 242 Paraje El Pozo, Santa Fe 3000, Argentina
*
Author to whom correspondence should be addressed.
Fermentation 2023, 9(5), 454; https://doi.org/10.3390/fermentation9050454
Submission received: 31 March 2023 / Revised: 5 May 2023 / Accepted: 5 May 2023 / Published: 10 May 2023

Abstract

:
Soybean is a major crop used in the production of human food. The soybean hull (SH) is also known as the seed coat and it constitutes about 5–8% of the total seed on a dry weight basis, depending on the variety and the seed size. Dilute sulfuric acid was employed for the thermochemical pretreatment of SH prior to enzymatic saccharification and alcoholic fermentation. Empirical modeling of response surface, severity factor and multi-response desirability function methodology, were used to perform the process optimization. Temperature, acid concentration and reaction time were defined as operational variables, while furfural, 5-hydroxymethylfurfural and solubilized hemicellulose and cellulose were defined as response variables. Mathematical models satisfactorily described the process and optimal conditions were found at 121 °C; 2.5% w/v H2SO4 and 60 min. More than 80% and 90% of hemicelluloses and celluloses, respectively, were able to solubilize at this point. The fermentation performance of an industrial Saccharomyces cerevisiae strain was also evaluated. The glucose available in the hydrolysates was completely consumed in less than 12 h, with an average ethanol yield of 0.45 gethanol/gglucose. Thus, the thermochemical conditioning of SH with dilute sulfuric acid is a suitable operation for 2G-bioethanol production.

Graphical Abstract

1. Introduction

The transportation sector is an important industrial player in the worldwide economy, which deals with the movement of people and products. This is one of the main energy-claimants: it consumes more than a quarter of the energy produced in the world and also emits high levels of CO2 [1,2]. It is necessary to transform the transport system towards a more sustainable model, which allows the reduction of greenhouse gasses in the atmosphere. One of the main strategies considered to achieve this goal is the replacement of fossil fuels with biofuels.
Bioethanol is one of the most important renewable fuels. It is added to gasoline to reduce the negative environmental impact generated by the worldwide use of fossil fuels. Several energy crops including sugarcane, corn and jatropha are used as raw materials for bioethanol production [1]. The high worldwide bioethanol demand exerts enormous pressure on primary production capacity. Thus, it is imperative to identify new renewable sources for the production of this ‘green’ fuel. Several alternatives have received increased focus, such as lignocellulosic biomass [2] and agro-industrial wastewaters [3]. Lignocellulosic biorefineries can be applied to the production of second generation (2G) biofuels, including bioethanol, as well as a number of high value products [4,5,6].
Soybean (Glycine max L.) is one of the most important crops for the production of human food. The United States, Brazil, Argentina, China and India are the top-five producers, whereas Argentina is the world’s top exporter of flour and oils. The processing of soybean grains results in two main products: soybean meal and soybean oil (also used for biodiesel production). Thus, soybean processing generates different by-products, such as hulls, molasses, and okara. Soybean hulls (SHs) are the main residue of soybean processing, representing about 5–8% of the whole grain dry matter, and containing about 85% of complex carbohydrates [7]. Because the SH has low weight, large storage areas are necessary to manage this waste. This complicates and makes SH handling more expensive. Thus, the bioconversion of this waste in added-value compounds emerges as a promising alternative to valorize a waste with a circular economy approach [8].
Because SHs are essentially lignocellulosic residues, the polymers cellulose, hemicellulose and lignin are the core components of them. Cellulose is a polysaccharide consisting of a linear chain of D-glucose units, whereas hemicellulose contains pentoses, hexoses and/or uronic acids. Unlike cellulose, hemicellulose composition varies depending on cell tissue and plant species. The low lignin content (6–8%) of the SH is noteworthy, which makes it a golden waste [9,10].
In general, a process to produce bioethanol from lignocellulosic biomass (LB) comprises four sequential stages: (1) LB pretreatment; (2) saccharification, i.e., enzymatic hydrolysis of cellulose and hemicellulose; (3) fermentation and (4) ethanol distillation and then rectification to achieve fuel specifications. The major drawbacks for the use of LB are: (i) the recalcitrance to degradation of the lignocellulosic matrix, which is comprised of covalent and hydrogen bonds; and (ii) the poor utilization by Saccharomyces cerevisiae of D-xylose and L-arabinose, which are the main pentoses present in hemicellulose polymers. This work is focused on the first step of the process: the pretreatment operations.
Pretreatment is a crucial step because it breaks down the complex chemical structures of the LB, making cellulose more accessible to subsequent enzymatic hydrolysis. This stage has a significant influence on the overall process economy since it represents up to 35% of the total cost for bioethanol production [11]. The development of efficient, robust, easy-to-upscale and environmentally friendly pretreatment techniques is crucial in order to achieve competitive biorefineries based on LB. The selection of a pretreatment method depends on the chemical composition and physical nature of the material. For this reason, an ideal pretreatment must: consider the sugar loss from pretreated fractions; reduce the production of inhibitory compounds for enzymatic hydrolysis and fermentation; minimize enzyme loading for efficient hydrolysis; decrease energy consumption; and permit the delignification and recovery of other promising compounds. Currently, the thermochemical conditioning processes are the preferred ones for large scale application [12]. Dilute acid hydrolysis was extensively investigated as a pretreatment alternative for LB conversion, with a focus on the use of carbohydrates for bioethanol production [13,14,15,16,17,18]. This method aims to break and solubilize the hemicelluloses and lignin, allowing cellulose to be more accessible to enzymatic attack.
In this work, the thermochemical pretreatment of SH with dilute sulfuric acid was evaluated. The hydrolysis was performed in batch-type reactors and a multi-response optimization methodology based on a desirability function was also applied. The aim of the factorial-type experimental design was to identify the relationship between the main reaction conditions (temperature, acid concentration and reaction time) and the hemicellulose rupture and solubilization, as well as furans production. The effect on cellulose accessibility to subsequent enzymatic hydrolysis was also considered. Finally, several fermentation tests were performed with an industrial strain of Saccharomyces cerevisiae to evaluate the potential inhibitory compounds released.

2. Materials and Methods

2.1. Characterization of SH and Hydrolysates

The SHs were provided by a local soybean processing company (Vicentin S.A.I.C., https://www.vicentin.com.ar, accessed on 13 April 2023). The material was ground and sieved to obtain particles with a size in the range between 1 to 2 mm. The ash and moisture content of SHs were determined following the LAP-NREL/TP-510-42622 procedure reported by the National Renewable Energy Laboratory (NREL) [19].
The carbohydrate content (cellulose and hemicellulose) was measured according to the LAP-NREL/TP-510-42618 protocol [20] with some modifications: a two-step acid hydrolysis was performed using sulfuric acid. Firstly, 3.00 ± 0.01 mL of 72% v/v H2SO4 was added to 300.0 ± 10.0 mg of ground SHs and incubated at 30 °C for 1 h. Then, distilled water was added to reach a 4% v/v H2SO4 solution and it was autoclaved at 121 °C for 1 h. A sample of the liquid phase of the hydrolysate was stored at −20° C for further determinations of soluble hydrolysis products, including pentoses, glucose, furans and acid-soluble lignin. The pH of the remaining hydrolysate was adjusted to 5.0 ± 0.2 using NaOH beads and a commercial enzyme mixture with cellulase activity (Novozyme, Cellic CTec2®) was added following the supplier’s recommendations for the dosage (mass of enzymes: mass of solids ratio). The reaction was kept at 50 °C for 72 h. Glucose was measured using an enzymatic kit (SB Lab., Santa Fe, Argentina), whereas the remaining solid fraction in the hydrolysate was employed for acid-insoluble lignin determination. HMF and furfural were quantified by HPLC-UV (Thermo UltiMate 3000) using a C18 ODS Hypersil column, water:acetonitrile (80:20) as mobile phase and detection at 260 nm. The identity of the main monosaccharides released from SHs were evaluated by HPLC-RI using a Hypersil™ APS-2 (250 × 4.6 mm, 5 μm) column and water:acetonitrile (20:80) as mobile phase.
Hydrolysate samples were centrifuged for 10 min at 10,000 rpm and filtered through a 0.45 µm nylon membrane. C5 sugars were estimated by a colorimetric method using hydrochloric acid, acetic acid and phloroglucinol [21]. A modified Klasson methodology was followed to determine the lignin content [22]. This procedure was selected because it considered the influence of the furans (HMF and furfural) in the medium. Ethanol was quantified by gas chromatography-flame ionization detection (GC–FID, SHIMADZU GC Solution). A 30 m Agilent J&W DB-1 column was used. A sample volume of 1 µL was injected and butanol was used as an internal standard.

2.2. Experimental Design

A Central Composite Design (CCD) that included the time, temperature and sulfuric acid concentration as independent variables (factors) was performed to determine the optimal relationship of these factors. The axial distance (α value) was chosen to be 1.287. For predicting the optimal point, a second-order polynomial function was fitted to correlate the relationship between the independent variables and the response. The values for each factor are shown in Table 1. The experiment was conducted in three blocks, with each condition being studied in triplicate, and the order of the experiments was completely randomized. In total, 48 experimental runs were performed, including 2 central points per block, resulting in 36 degrees of freedom for error estimation. Factor combinations for pretreatment are detailed in Table 2. The reaction time is defined as the period of time in which the temperature is maintained constant, considering the zero time (t = 0) to be the instant where the desired temperature is reached.
All analysis of statistical experimental designs and results was performed using Statgraphics Centurion XV v15.2.06 (StatPoint Inc., Suite, VA, USA), R Studio (R Core Team, Vienna, Austria), MATLAB (MathWorks Inc., Natick, MA, USA). The statistical analysis was performed in the form of analysis of variance (ANOVA). The significance of the regression coefficients and the associated probabilities p(t) were determined by Student’s t-test. The variance explained by the model is given by the multiple determination coefficients, R2, and the parameter values should be close to 1.0 for a good statistical model, while a value above 0.75 indicates the suitability of the model.
The percentage of hemicelluloses solubilization (%HC) was defined as follows:
% HC = C pentoses C solids   X Hemicelluloses 100
where, Cpentoses is the concentration of pentoses in the liquid phase of the hydrolysate (g/L), Csolids is the concentration of SHs in the reactor (g/L) and Xhemicelulloses is the fraction of hemicellulose in dry SHs.
Acid hydrolysis was carried out in borosilicate glass tubes with screw caps (HACH, Loveland, CO, USA) and using a dry block with heating system for temperature control. The reaction volume was 10 mL, with 150 gSH/L.

2.3. Enzymatic Saccharification

After thermochemical pretreatment, the pH of the hydrolysates was adjusted to 5.0 ± 0.2 by adding NaOH beads. Chloramphenicol at final concentration of 2.5 ppm was also incorporated to avoid bacterial proliferation. Then, a cellulase commercial enzyme (Novozyme, Cellic CTec2®) was added as aforementioned. Reactors were kept under orbital shaking at 50 °C for 72 h. Samples of the liquid fraction were taken at regular intervals and the glucose concentration was determined. The cellulose conversion percentage was calculated as follows:
% CEL = C glucose C solids   X celullose 100
where, Cglucose is the glucose concentration (g/L), Csolids is the concentration of solids (g/L) and Xcellulose is the fraction of cellulose in the dry material.

2.4. Fermentation

Fermentations were performed in triplicate using a 500-mL glass reactor (300-mL working volume) operated in batch mode under anaerobic conditions and at a constant temperature of 30 °C, as described previously [23]. The pH was initially adjusted to 4.50 ± 0.10, and orbital shaking (150 rpm) was maintained throughout the experiments to avoid biomass precipitation. The initial concentration of yeast in each experiment was 1.00 ± 0.10 g/L. The samples were collected immediately after inoculation (t = 0) and every 2 h until the end of the experiments. During the fermentation experiments, samples (1 mL) were taken in duplicate and immediately centrifuged for 5 min at 1200× g. The initial supernatants were transferred to sterile 1.5 mL tubes and stored at −20 °C until the corresponding determinations.
The industrial strain Saccharomyces cerevisiae var. Ethanol red (Fermentis Ltd., Lille, France) was selected for fermentation experiments. The performance of this strain on control media and sugar-sweetened high-strength wastewaters from the soft drinks industry was previously studied [24]. Yeast strain was maintained at 4 °C on YPG solid medium (yeast extract 5 g/L, peptone 3 g/L, D-glucose 20 g/L and agar 15 g/L). Pre-culture was obtained by propagation of colonies at 30 °C overnight in a shaken Erlenmeyer flask with liquid YPG. The cells had been previously grown at 30 °C for 12–18 h and were then harvested by centrifugation for 5 min at 4500 rpm, washed twice using distilled water and finally resuspended in a small volume of water before the reactors’ inoculation. A biomass concentrated suspension was used to inoculate the fermentation reactors to reach an initial concentration of 1 g/L. The biomass concentration was indirectly determined by turbidity measurements at 600 nm using a VIS spectrophotometer (DR/2010, HACH, Loveland, CO, USA). These measurements were correlated to biomass concentration using a calibration curve built according to the standard technique for determination of Volatile Suspended Solids (VSS) [25]. To build the calibration curve, the yeasts were grown on YPD medium at 30 °C for 12–18 h and were then harvested by centrifugation for 5 min at 1200× g, then washed five times using distilled water. Several dilutions of distilled water were made by triplicate. An aliquot of each diluted sample was used for measure of turbidity (at 600 nm) using distilled water as blank. Another aliquot of the well-mixed sample (50-mL) was filtered in vacuum through a weighted standard Whatman GFC glass fiber filter (47 mm diameter and 1.2 mm nominal pore size, Biopore, Buenos Aires, Argentina) and the residue retained on the filter was dried to a constant weight at 103–105 °C. The increase in weight of the filter represents the total suspended solids (TSS). The next step was the combustion of the filter at 500 °C for 15 min and the weight lost after combustion represents the weight of Volatile Suspended Solids (VSS) in the sample [23].
SH hydrolysate was fermented in a batch mode at a constant temperature of 30 °C and stirring at 150 rpm. Previous yeast adaptation to the SH hydrolysate was not required. Neither nitrogen source nor additional nutrients (salts or vitamins) were added to the fermentation media. For comparative purposes, the yeast fermentative performance was also evaluated in a synthetic medium containing D-glucose 60 g/L and commercial yeast extract 5 g/L under the same experimental conditions. Duplicate fermentation experiments were conducted for each medium. Finally, the performance of yeasts was evaluated using several parameters defined in a previous work [26].

3. Results and Discussion

3.1. Characterization of Soybean Hull

Variation in the chemical composition of SHs usually depends on the cultivation characteristics, influence of environmental factors (soil and climate), type of grain and genetic factors, among others [27]. The composition of the employed SHs, determined on a dry basis, consisted of 45.0 ± 1.21% cellulose, 15.1 ± 0.92% hemicelluloses, 4.0 ± 1.03% lignins, and 2.0 ± 0.13% ashes (Table 3). These results are in agreement with reported ones by different authors [23,24,25,26,27,28] and support the idea that SHs contain relatively high amounts of carbohydrates (cellulose and hemicellulose) and low lignin content. Thus, the SH is an interesting platform for the development of biorefinery strategies [8], mainly those based on bioprocesses. Because of its potential to obtain fermentable sugars with low generation of lignin degradation compounds, which can be toxic to microbial metabolism, the SH has a high potential as a feedstock for the production of added-value compounds applying biological processes.

3.2. SH loading Selection for Pretreatment

The solid loading is an operational variable that commonly has a significant impact on the efficiency of thermochemical pretreatment and enzymatic hydrolysis processes [33,34,35]. High solid loadings could increase the availability of fermentable sugar for the subsequent fermentation stage, and contribute to decrease the cost of the recovery of ethanol by distillation. However, a high solid concentration is also associated to challenges such as (i) slurry’s high viscosity, (ii) limitation in the effectiveness of both the pretreatment and the enzymatic hydrolysis, (iii) improperly enzyme distribution, (iv) sub-optimal solubilization of carbohydrates, and (v) ineffective mixing of slurry and heat/mass transfer. These topics could lead to an increase in consumption of energy due to additional operations needed [33,36,37].
Since the initial solid content can have an impact on carbohydrate recovery, the selection of an appropriate loading is a crucial factor to consider before commencing the process. Then, a thermochemical hydrolysis screening was performed using 50, 100, 150 and 200 gSH/L. At the highest loading, the solids completely absorbed the liquid, resulting in a mixture without a free aqueous phase (not shown). Because it was difficult to mix and manage the solids at this loading, it was discarded for future experiments. In the remaining reactors, the proportion of pentoses in the liquid phase was evaluated after chemical hydrolysis. Since the measurement was statistically similar for all three conditions (50, 100 and 150 gSH/L), the loading with the highest initial solid content was selected for further experiments. Thus, the study of the impact of the pretreatment conditions on carbohydrate recovery was performed at 150 gSH /L (dry basis). The best initial loading is out of scope of this work and this topic may be addressed in future works.

3.3. Relation between Pretreatment and the Hemicellulose Solubilization

The acid-catalyzed hydrolysis leads to breaking of intermolecular and intramolecular bonds, releasing oligosaccharides and soluble monomers, primarily pentoses, from the hemicellulose. A series of reactions on both the hemicellulose and their hydrolysis products also take place at high temperature and acidic conditions. These reactions include dehydration, oxidation, isomerization, decarboxylation and re-hydration, among others. Thus, in order to study the effect of pretreatment conditions on hemicellulose, the release soluble pentoses were measured, as well as the presence of furfural, the main product of the degradation of C5 sugars at high acidic and temperature conditions. Xylose and arabinose are the main pentoses present in the hemicellulose structure. Partial hydrolysis of hemicellulose to pentose oligomers like arabinoxylan-oligosaccharides could also occur. Both monosaccharides and oligomers are soluble products of the hydrolysis of hemicellulose. Thus, an encompassing variable named generically “pentoses” can be taken as a direct indicator of the effectiveness of chemical hydrolysis; when more pentoses are present in the liquid phase, more hemicellulose has been solubilized.
The conditions evaluated for thermo-chemical hydrolysis of the SHs were listed in Table 2. The solubilization of hemicellulose (%HC) varied between 1.6% and 87.4%, whereas three different conditions reached mean effectiveness above 80%: (i) 81.17 ± 1.99% for treatment 15 (2.50% w/v H2SO4; 125 °C; 30 min); (ii) 83.42 ± 3.78% for treatment 8 (1.50% w/v H2SO4; 131 °C; 105 min); and (iii) 84.34 ± 0.60% for treatment 9 (2.50% w/v H2SO4; 125 °C; 180 min). Analysis of variance of these treatments indicated that they were not statistically different. (p-value > 0.35; alpha = 0.05). These results are slightly higher than others informed by similar studies that use dilute sulfuric acid to pretreat SHs. A solubilization close to 76% was reported at 1.4% v/v H2SO4, 125 °C and 60 min of hydrolysis [38]. A level of 67% of solubilization was observed at 2.2% w/w H2SO4/135 °C/40 min), whereas more severe conditions (1.7% w/w H2SO4; 153 °C; 60 min) lead to a 77% of hemicellulose solubilization [9]. The highest values in literature fall into the range of 90–96% of pentoses and it was obtained after steam explosion pretreatment with dilute sulfuric acid (2% w/w H2SO4; 140 °C; 30 min) [29].
In order to search the optimal pretreatment operative conditions, a linear regression analysis method was applied. The statistical approach of experimental design allowed data acquisition in proper quantity and quality for the built and evaluation of multiple-regression mathematical models. A quadratic polynomial type model, with interactions of three factors (Time, Temperature and Sulfuric acid concentration) was initially built and evaluated to predict the degree of hemicellulose solubilization (Equation (3)).
Y = β 0 + β 1 T + β 2 t + β 3 A + β 11 T 2 + β 22 t 2 + β 33 A 2 + β 12 T t + β 13 T A + β 23 t A ,
where, Y is the percentage of solubilized hemicellulose (%); βi and βij are regression coefficients, whereas A, T and t are the Sulfuric acid concentration (% w/v); the temperature ( °C) and the reaction time (min), respectively.
Statistical evaluation of the polynomial model was performed through t test, ANOVA and AIC (Akaike Information Criterion), choosing a significance level of 95%. Analysis showed that the interaction terms, those involving the time factor and the square of the temperature, were not significant enough to explain response variations (β2, β11, β22, β12, β13, β23 = 0). These terms were eliminated one by one and the resulting models were re-evaluated after each elimination round. The regression analysis of the data showed that a second order linear model (Equation (4)) was a suitable model to describe the hemicellulose solubilization as a function of temperature (T) and sulfuric acid concentration (A), with adjusted R2 value of 0.97.
% H C = 81.67 + 0.76   T + 53.87   A 10.07   A 2 ,   R 2 = 0.97
The surface response for different temperatures and acid concentrations is shown in Figure 1.
As the model shows, in the upper limits of the space studied, the predicted and observed values correspond to 80–90 of %HC. Considering that the goal of the treatment with diluted acids is the solubilization of hemicellulose, the results were close to maximum effectiveness conditions. Sulfuric acid concentration and Temperature were the most important factors that had a significant impact on solubilization of the hemicellulose. The interaction between the temperature and the sulfuric acid concentration was particularly interesting (Figure 2). These findings may be mainly due to the range of conditions tested. A wider range of conditions (100–170 °C and 1.4–3.2% w/w H2SO4) lead to obtaining response surface models for the release of xylose and arabinose, in which, a significant interaction between temperature and sulfuric acid concentration can be observed [9]. In the range of conditions evaluated in this work, the surfaces resemble planes, presenting curvatures in higher values, and being influenced primarily by the temperature.
Figure 3 summarizes the effects of the factors studied: bars correspond to the average values of %HC reached at the corner points of the factorial design. It can be seen that at low and high temperature values, 80 °C and 125 °C, respectively, the %HC increased significantly as the acid concentration increased and the reaction time was maintained constant. On the other hand, non-significant changes can be observed by increasing reaction time and leaving the other variables fixed. This suggests that a significant fraction of the hemicellulose was solubilized relatively quickly and/or during the transient state (heating stage). Similar observations were reported for the hydrolysis of Pinus taeda with dilute sulfuric acid at pH = 1.65 and 150 °C; a significant amount of hemicellulose was also solubilized during the heating of the reactor [39].

3.4. Furans Formation

There are two main reasons why monitoring the concentrations of HMF and furfural is relevant: (i) because they are the products of degradation of hexoses and pentoses, respectively, their presence implies the loss of fermentable sugars, and (ii) depending on their concentration levels, these compounds can act as an inhibitor to the metabolism of a wide range of fermenting microorganisms [40,41,42,43,44].
Figure 4 shows the production of furans in all the evaluated treatments. It can be seen that the more severe the treatment, the more furans are produced. As expected, the generation of furfural is always higher than HMF, suggesting that pretreatment mainly produces the hydrolysis of hemicellulose, i.e., the source of pentoses. The maximal production of furfural and HMF were recorded in treatment 9 (2.50% w/v H2SO4; 125 °C; 180 min). In these conditions, an average of 392.6 mgFurfural/L and 75.4 mgHMF/L were reached. Additionally, treatment 8 (1.50% w/v H2SO4; 131 °C; 105 min) accumulated an average of 229.5 mgFurfural/L and 63.5 mgHMF/L, suggesting an interaction between the factors. ANOVA showed that the productions of furfural and HMF in treatment 9 are significantly higher than treatment 8 (p-value < 0.4 × 10⁻³ and p-value < 0.8 × 10⁻³). An average of 60.7 mgFurfural/L and 38.2 mgHMF/L were produced in treatment 15 (2.50% w/v H2SO4, 125 °C, 30 min), which ranked third. However, the furfural concentrations in treatment 15 were significantly lower than treatments 8 and 9, but were not significantly superior to any other, whereas the HMF concentrations were significantly lower with respect to treatments 8 and 9, but significantly superior to the rest (p-valor < 0.2 × 10⁻⁴).
The furan concentrations presented in this section were in agreement with those reported in the literature. In particular, values of 190 and 280 mgFurfural/L were reported in SH hydrolysates treated 60 min with sulfuric acid (1.4% v/v) at 120 °C and 125 °C, respectively [38].
By applying multiple regression analysis, a mathematical relationship between the furans production and the pretreatment conditions was obtained. Both models are exponential-type and show effects of the three factors and their interactions, satisfactorily representing the data dispersion in the range of study (Equations (5) and (6)).
Fur mg L = exp 4.49 1.70   A 1.43 10 2   T 1.55 10 2   t + 1.78 10 2   AT + 2.94 10 3   At + 1.43 10 4   Tt ,   R 2 = 0.80
HMF mg L = exp 2.17 0.50 10 2   T 1.42   A 0.60 10 2   t + 0.75 10 4   Tt + 0.93 10 3   At + 0.02   AT ,   R 2 = 0.86
The surfaces obtained with both models are shown in Figure 5 for a reaction time of 180 min, in which, the exponential effect on the responses occurs towards at the upper values of temperature and acid concentration. The temporal evolution of furfural and HMF concentrations at constant temperature or acid sulfuric concentration, with the other operative conditions free in the studied range are also shown.

3.5. Enzymatic Saccharification

The glucose concentration in the liquid phase was monitored in all reactors by sampling every 2 h, for a duration of 72 h. In order to analyze the effects of pretreatment on cellulose conversion, glucose concentration was analyzed 12 h after the starting of the enzymatic saccharification. A mathematical relationship with high goodness of fit (R2 = 0.98) for %CEL (Equation (7)), as a function of temperature, sulfuric acid concentration and time was encountered. The surface response for different temperatures and acid concentrations is shown in Figure 6.
% CEL = 26.29   A + 0.12   T + 0.07   t + 0.40   AT ,   R 2 = 0.98
Maximum glucose concentration after 12 h of enzymatic hydrolysis was detected in treatment 9 (2.50% w/v H2SO4; 125 °C; 180 min), with an average glucose release of 86.90 ± 4.11%; followed by treatments 8 (1.50% w/v H2SO4; 131 °C; 105 min) and 15 (2.50% w/v H2SO4; 125 °C; 30 min), with 73.85 ± 6.71% and 69.53 ± 4.11%, respectively. ANOVA shows that treatment 9 is the only one significantly different (T9 > T8 ≈ T15). These amounts of glucose released are similar to those reported by Corredor et al. (2008) [30] and Yoo et al. (2011) [45], which report values around 70% of hexose release after 24 h of enzymatic treatment and a previous pretreatment with dilute sulfuric acid (2.50% w/w) at 140 °C for 30 min.
It is noteworthy that a direct and positive relationship between solubilized hemicellulose during thermochemical pretreatment and the amount of glucose released after 12 h of enzymatic hydrolysis was observed (Figure 7). The high correlation (R2 = 0.90) between these two variables suggests that the interactions between cellulose and hemicellulose would represent the main bottleneck for the use of lignocellulosic material in general, and SHs in particular.

3.6. Optimization of Pretreatment Conditions

During the acid pretreatment of a lignocellulosic material, a set of chemical reactions takes place both in series and in parallel. These reactions generate and/or consume relevant compounds of the 2G-bioethanol production processes. The study of the dynamics (evolution of the concentration) of these compounds both during and after pretreatment operations could provide valuable information about the effects of operational variables (temperature, reaction time and acid concentration) on the global process. However, the nature of the phenomena that take place during the pretreatment means that some of the compounds involved in the reactions may have an opposite effect on the goal of increasing ethanol production. Then, optimal conditions for the overall process cannot be proposed based on optimal individual conditions. Evaluating the models obtained for chemical pretreatment (%HC, furfural, and HMF) and enzymatic hydrolysis (%CEL) in separate ways could be insufficient when searching for optimal operational pretreatment conditions with the goal of maximizing the subsequent ethanol production.

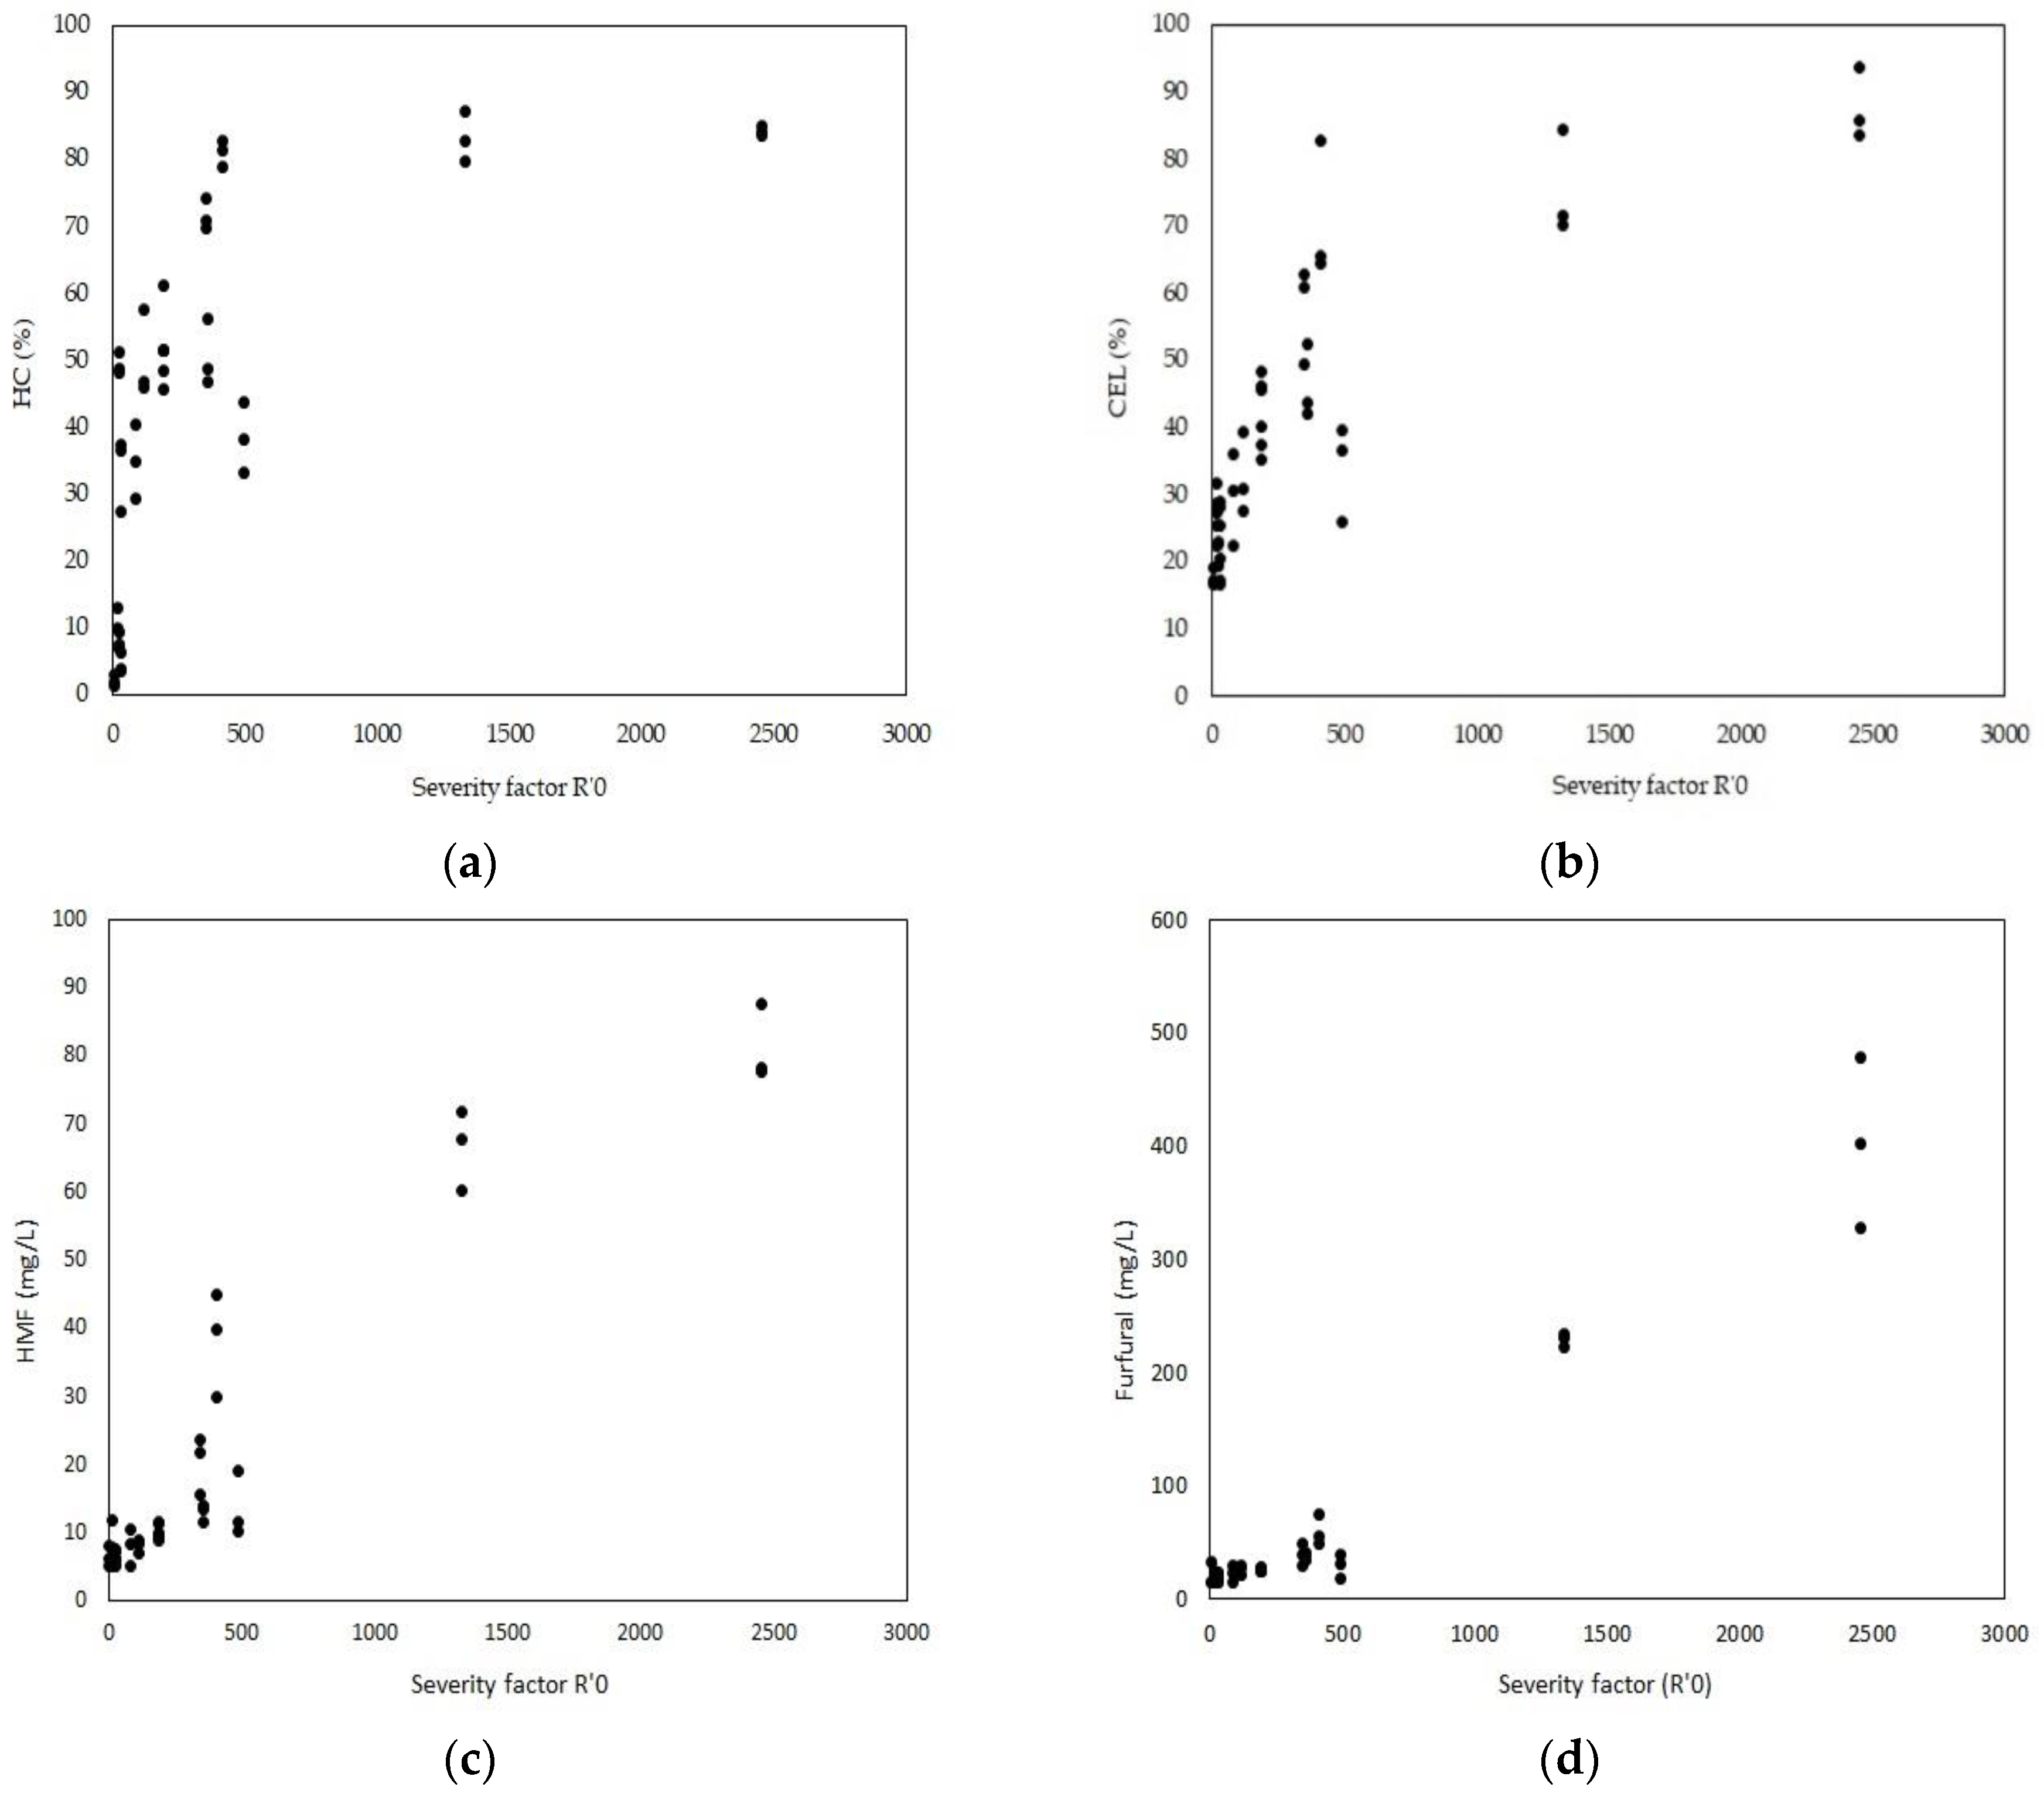
3.6.1. Severity Factor

Since the mid-twentieth century, various severity indices have been proposed to describe pulp and paper industry processes based on correlations between soluble lignins and hemicelluloses and operating conditions, defined by temperature and reaction time [37,38,39]. This concept has been extended to the study of LB processes with the aim of contributing to both operative aspects and the phenomenological understanding of pretreatment processes. Abatzoglou et al. (1992) [46], developed a modified factor, RoH, that allows for an accounting of the influence of a catalyst on the fractionation of lignocellulosic materials using a complex factor that includes adjustment parameters based on a chemical analysis.
In this work, a modified severity factor (Equation (8)) was adopted in order to identify causal relationships and trends:
R 0 = t x   A x   e x p   T T r 14.75 ,
where, t is the reaction time, A is the sulfuric acid concentration and T is the temperature of the reaction, whereas Tr is the reference temperature (100 °C).
Figure 8 shows the positive relationship between severity factor R0′, the solubilization of structural polymers of SH and the monosaccharide degradation products (furfural and HMF). It can be seen that the solubilization of hemicellulose increases rapidly as the severity of pretreatment increases, becoming almost asymptotic for values greater than 400, with %HC between 80–90 for a wide range of R0′ values (Figure 8a). Analysis of the variance of the most severe treatments indicates that there are not significant differences in the %HC (%HC (R0′ = 400) = %HC (R0′ = 1300) = %HC (R0′ = 2500); p-value > 0.34). A similar tendency was observed when a relationship between the glucose release after 12 h of enzymatic hydrolysis and the factor R0′ was established (Figure 8b). Moreover, furans production increase slightly in the severity range from 0 to 400 but an exponential increase is observed when more severe conditions were evaluated ([Furans] (R0′ = 400) < [Furans] (R0′ = 1300) < [Furans] (R0′ = 2500); p-value > 0.4 × 10⁻³). The analysis suggests that an optimal pretreatment would be performed with 2.5% w/v H2SO4 at 125 °C for a duration of 30 min. These conditions correspond to a R0′ = 400, whereas a high %HC and low production of furans were obtained at this point.

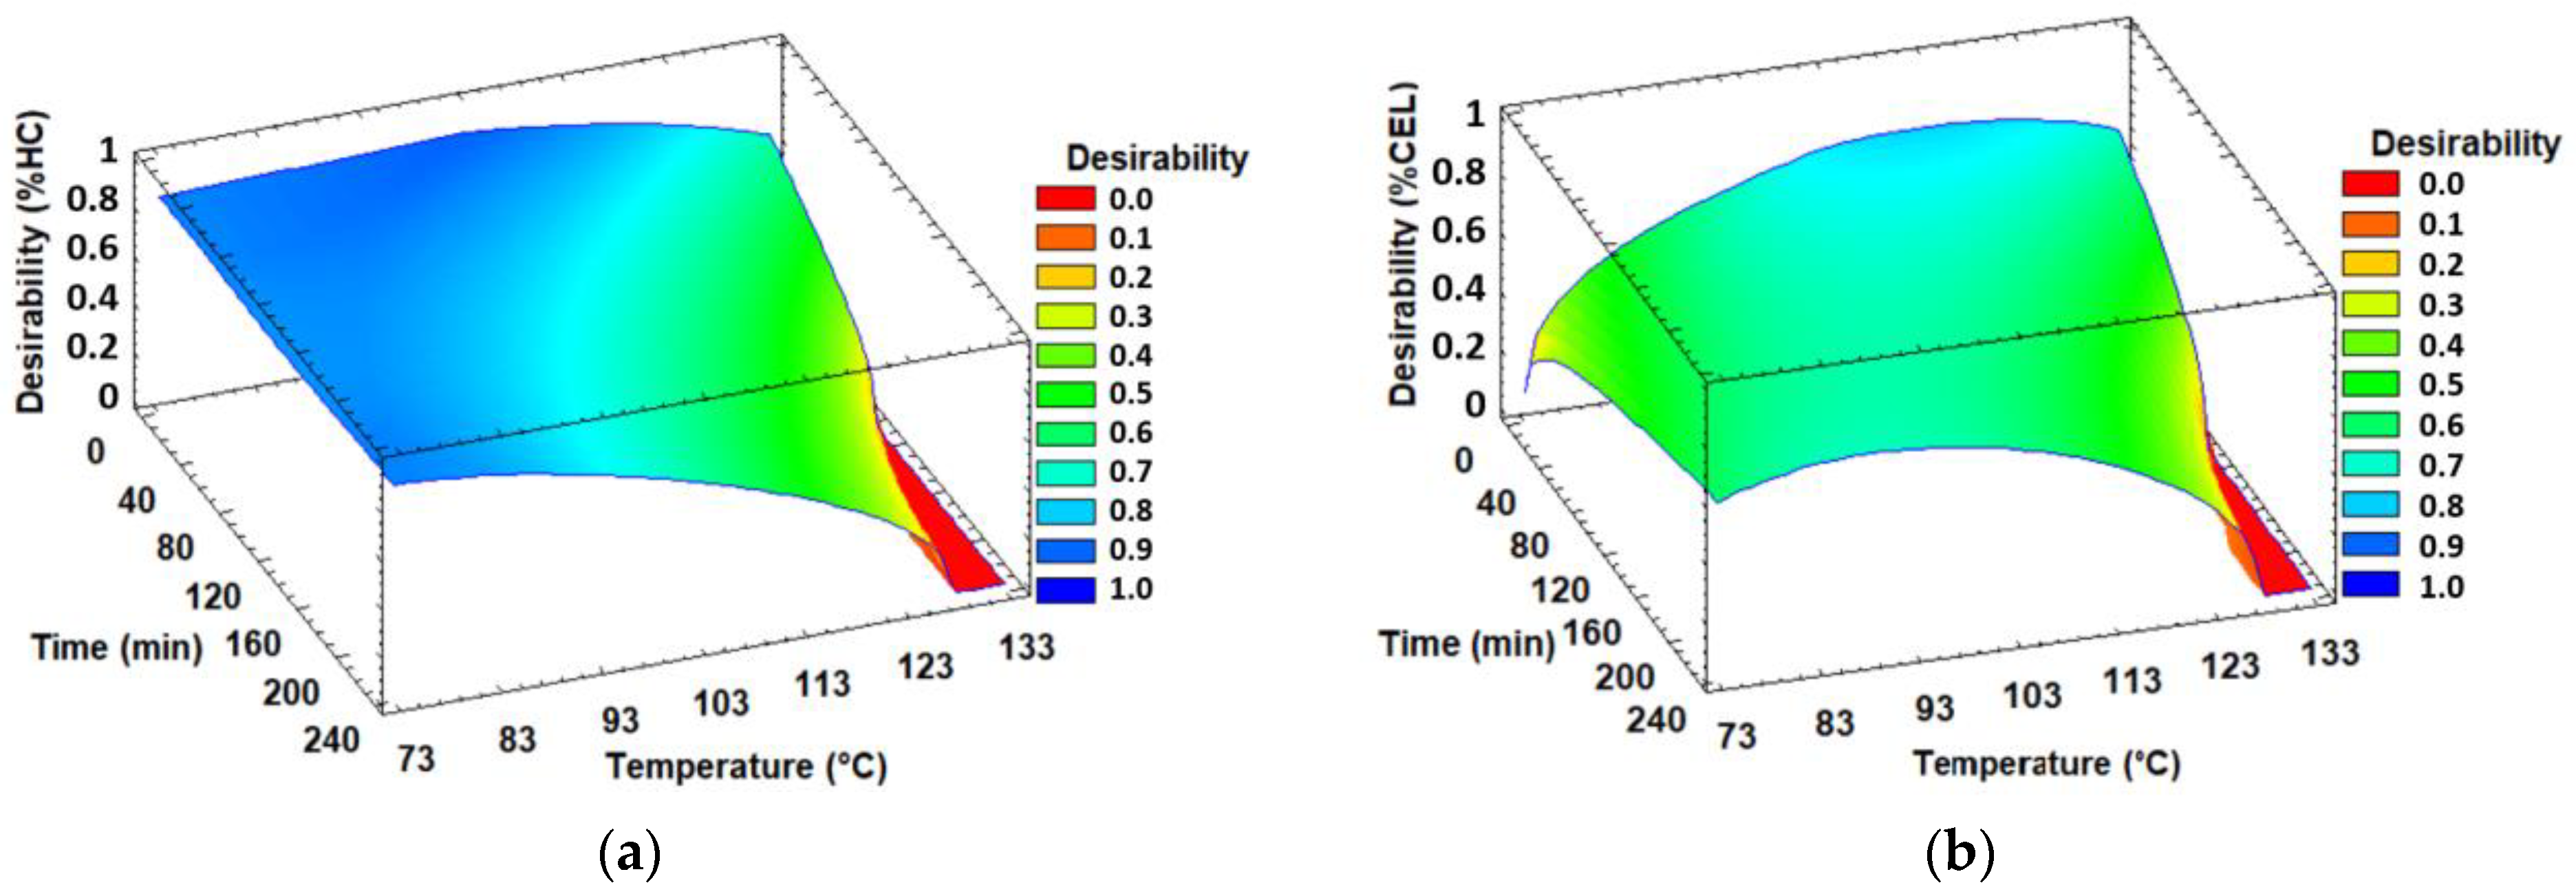
3.6.2. Multiresponse Optimization

Pretreatment optimization was approached as a multi-response optimization problem. Desirability functions, di(ŷ(x)), were constructed using the previously modeled responses (%HC %CEL, furfural and HMF concentration). The optimization of a particular response in the space of conditions (defined by the factors temperature, sulfuric acid concentration and time) was evaluated through the construction of a global desirability index, D = f(di), by combining individual desirability [47,48].
Two optimization problems of identical structure were defined, varying the function to be maximized, %HC or %CEL:
maximize % HC   and   % CEL minimize   Furfural minimize   HMF subject   to   75   ° C   T 135 0.5   % A   2.5   % 30   min t 200   min
Maximum desirability values (0.83) were found for a sulfuric acid concentration of 2.5% w/v, in the range of 115–125 °C and reaction times between 40–60 min (Figure 9). This result agrees with the treatments with the maximum %HC and less severity presented in Figure 7, supporting the idea that the severity factor R0′ constitutes a good tool for prediction and decision-making.

3.7. Separate Saccharification and Fermentation

To verify the predicted results, three independent experiments were performed on SHs pretreated at the optimal conditions previously identified (121 °C; 2.5% w/v Sulfuric acid and 60 min). The pH value of the medium was initially adjusted to 5.00 ± 0.10, and chloramphenicol (1 mg/L) was added to prevent contamination with Gram-positive sporulating microorganisms, which were found in both the raw material and some process supplies. The cellulolytic enzyme complex was added and the reactors were maintained under orbital shaking at 50 °C for 24 h. In all the reactors an average %CEL of 98 ± 2% was obtained.
The values predicted by the models built for %HC, furfural and HMF concentrations, and the values experimentally obtained under optimal conditions selected are shown in Table 4. As can be noted, the models were highly accurate in predicting the responses in different conditions than the ones used for their construction (Table 2).
Fermentation in batch mode under anaerobic conditions while a constant temperature of 30 °C was performed. The industrial yeast strain Saccharomyces cerevisiae var. Ethanol Red® (Fermentis-Lesaffre, Milwaukee, WI, USA) was used for all the experiments. Because this strain was originally adapted to fast growth in corn-based media, it is the industry standard in 1G-bioethanol production, and all the media were inoculated at 1.00 ± 0.10 g/L with exponential-growth biomass. The yeast culture was previously proliferated under aerobic conditions for 12–18 h. A set of reactors with synthetic medium was included as control. The concentrations of sugar and ethanol were monitored over time, whereas the biomass change was also evaluated in control reactors (Figure 10). Concerning the evaluation of the fermentation performance, some useful parameters were calculated following a previous method [24] and are displayed in Table 5.
Sugar was completely depleted in all media in less than 12 h. Despite the presence of potential inhibitory compounds on SH hydrolysates, it is noteworthy that no latency time for sugar consumption was detected (Figure 10b). Fermentation on SH hydrolysates occurs without nutrient supplementation. S. cerevisiae is a non-diazotrophic and non-proteolytic organism (i.e., it cannot fix nitrogen and it is incapable of using proteins as a nitrogen source). Thus, the SH hydrolysates should contain readily utilizable sources of nitrogen to support a suitable fermentation. The free amino nitrogen (FAN) content is a measure of assimilable nitrogen, i.e., individual amino acids and small peptides, which can be utilized by microorganisms for cell growth and proliferation. This parameter is frequently used in brewing, particularly as an indicator of good procedure in beer wort preparation. FAN content in the SH hydrolysate previously to fermentation experiments was measured using the ninhydrin method [49], obtaining values of 196.29 ± 6.03 mg/L. This FAN content is similar to those commonly present in beer wort (approx. 250 mg/L), where subsequent fermentation occurs successfully [50].
Both the profile of glucose consumption and the ethanol production were very similar for the evaluated conditions. Complete glucose starvation occurs between 8–10 h and the maximum ethanol concentration was obtained at 12 h. Ethanol accumulation was slightly different: 36.6 g/L for SH hydrolysate and 26.40 g/L for control media. This result was possibly due to differences in initial glucose content (69.5 gglucose/L and 60.0 gglucose/L in SH hydrolysates and control media, respectively). The ethanol yield was 0.45 gethanol/gglucose in experiments on SH hydrolysate, which was close to 90% of the theoretical value (0.51 gethanol/gglucose). Thus, the S. cerevisiae var. Ethanol Red emerges as a useful and interesting strain to develop robust processes for the 2G-ethanol industry.
It is of note that present work was focused on pretreatment conditions that maximize the release of glucose from SHs with the minimal accumulation of potential inhibitory compounds. Thus, pentoses were not really considered as substrates for ethanol production. However, for a complete use of the fermentable sugars present in SH hydrolysates, the pentoses derived from hemicellulose also should be metabolized to increase the ethanol concentration, or to produce other value-added products, such as xylitol [51,52]. Because the pentose-metabolization machinery is absent or silent in Saccharomyces, it is necessary to use yeast strains naturally capable of consuming pentoses, such as Spathaspora passalidarum or Scheffersomyces stipitis [53], or genetically modified strains, such as S. cerevisiae TMB3400 [54].The recombinant strains S. cerevisiae YRH396 and YRH400 were able to ferment soybean and oat hull hydrolysates obtained by pretreatment with dilute sulfuric acid [10]. Total glucose consumption and ethanol yields between 0.34–0.38 gethanol/gglucose were obtained in media with a significantly higher concentration of HMF (380 mgHMF/L). In another work, S. cerevisiae AY-15 was studied in Saccharification and Simultaneous Fermentation (SSF) processes on detoxified and nutrient-supplemented corn stover hydrolysates. The ethanol yields obtained for cellulose was 0.538 gethanol/gcellulose [55]. Fermentations by Wickerhamomyces sp. UFFS-CE-3.1.2 on SH hydrolysates obtained with subcritical water, showed concentrations of acetic acid, HMF and furfural of 3.41, 0.16 and 0.31 g/L, respectively, and a total inhibition of yeast growth. However, Wickerhamomyces sp. UFFS-CE-3.1.2 was able to consume 10 g/L of glucose on a ½ dilution of these hydrolysates [56]. Table 6 summarizes results in published works that used soybean hydrolysate or related materials, for comparative purposes.
Concerning the utilization of antibiotics in low concentrations in 1G bioethanol production at industrial scale, this is a cost-effective strategy that is frequently used for controlling bacterial contamination, whereas it has vertiginously increased over the past few years [57]. The use of antibiotics in fermentation at industrial scale has been extensively studied as a tool to stop the proliferation of contaminant microorganisms, as well as its impact on yeast performance and ethanol yields. In the fuel ethanol industry, control of bacterial contamination has been achieved by using antibiotics such as penicillin G, streptomycin, tetracycline, virginiamycin or monensin, or mixtures of these antibiotics [58,59]. Lactrol® (virginiamycin) is commonly used in a concentration range of 0.25–2.00 ppm at industrial scale. The enzymatic hydrolysis and fermentation processes were carried out using Lactrol® at 2 ppm as well, obtaining the same results (data not shown) as those exposed next in this section using chloramphenicol. Alternatively, a simultaneous saccharification and fermentation (SSF) strategy is an interesting option for reducing or entirely avoiding the use of antibiotics [60]. In this scenario, yeast is present in the fermentation medium at the initial stage of sugar liberation, and it modifies the medium properties (e.g., pH), displacing other microorganisms such as lactic acid bacteria.
As aforementioned, the pH should be adjusted after preconditioning operations to suitable values for both enzymatic hydrolysis and yeast metabolism. To adjust the pH from 0.7–0.8 to 5.5 of 100 mL of SH hydrolysates with a solid loading of 150 gSH /L, it was necessary to add 2.5 g of NaOH (final concentration of sodium of 14.363 gNa/L). This represents a quantity of 0.167 gNaOH/gSH or 0.096 gNa/gSH. Conventional strains of S. cerevisiae tolerate a sodium chloride concentration of 2 M (45.978 gNa/L). The final concentration of sodium was almost three times smaller than the maximum tolerance concentration values reported in the literature. Moreover, the fermentation performance and evolution of the SH hydrolysates and control (synthetic medium) was very similar for the evaluated conditions. Because the control does not contain sodium added to adjust the pH, it is possible to assume that sodium concentration used was not detrimental for yeast growth and fermentation in the reactors containing hydrolyzed and neutralized SH.
Finally, another compound still remains in fermentation media after ethanol separation: lignin. Although the study of this aromatic biopolymer was outside the scope of the present work, it has the potential to produce various compounds of interest, such as lignin-based hydrogels, surfactants, three-dimensional printing materials, electrodes and fine chemicals through biorefinery activities. Therefore, it is expected to benefit the future circular economy [61]. This aspect will be addressed in future research.

4. Conclusions

This study demonstrates that dilute sulfuric acid, a well-known method, is a suitable option for pretreating a new feedstock in order to develop robust second-generation bioethanol processes. Pretreated hydrolysates were suitable for subsequent enzymatic saccharification, with almost complete recovery of the glucose from the cellulose in 24 h. Neither detoxifying operations nor nutritional supplementation were necessary to ferment the hydrolysates of SH. Additionally, S. cerevisiae var. Ethanol Red was able to completely consume the available glucose in less than 12 h with an ethanol yield of 0.45 gethanol/gglucose. Thus, the feasibility of the pretreatment of SH with dilute sulfuric acid was demonstrated.
The developed empirical mathematical models can satisfactorily describe the effects of the thermochemical pretreatment factors on SH hydrolysis. This results in accurate and reliable prediction of hemicellulose solubilization and furans (HMF and furfural) accumulation, as well as the efficiency in the release of glucose during subsequent enzymatic saccharification. Based on these models, it was possible to optimize pretreatment conditions by applying a multi-response methodology. Moreover, the severity factor is an extremely useful tool to guide decision-making in this type of thermochemical processes. Thus, transversal criteria could be included during a process of 2G-bioethanol production.
Last but not least, it is of note that the process has some interesting advantages: (i) absence of latency time to sugar consumption, (ii) short fermentation time (less than 12 h), (iii) high initial glucose content, (iv) absence or minimal inhibitory effect on saccharification and/or fermentation, (v) high ethanol yields and (vi) the fact that SH hydrolysates provide nutrients in sufficient quantities for suitable fermentation. Thus, the thermochemical process evaluated and the SH constitute promising actors for the 2G-ethanol production.

Author Contributions

Conceptualisation: R.N.C.; Methodology: M.G.R., R.J.L. and B.C.B.; Software: M.G.R. and R.J.L.; Data analysis: M.G.R., R.J.L. and R.N.C.; Writing-original draft preparation: M.G.R., R.J.L. and R.N.C.; Writing-review and editing: M.G.R., R.J.L., B.C.B., L.G.S., M.T.B. and R.N.C.; Visualization: M.G.R. and R.J.L.; Supervision: R.N.C. All authors have read and agreed to the published version of the manuscript.

Funding

This research was supported by the Universidad Nacional del Litoral (UNL) via the CAI+D Program (Project 50620190100054LI), Consejo Nacional de Investigaciones Científicas y Técnicas (CONICET) and the Agencia Nacional de Promoción Científica y Tecnológica (ANPCyT) via PICT2018-01458 project.

Institutional Review Board Statement

Not applicable.

Informed Consent Statement

Not applicable.

Data Availability Statement

Not applicable.

Acknowledgments

The collaboration of the undergraduate student G. Delaloye in the realization of some experiments and S. Racca in editing the manuscript is gratefully acknowledged, as well as the permanent support of all GPBIA’s members.

Conflicts of Interest

The authors declare no conflict of interest and no competing financial interest.

References

  1. Nigam, P.S.; Singh, A. Production of Liquid Biofuels from Renewable Resources. Prog. Energy Combust. Sci. 2011, 37, 52–68. [Google Scholar] [CrossRef]
  2. Limayem, A.; Ricke, S.C. Lignocellulosic Biomass for Bioethanol Production: Current Perspectives, Potential Issues and Future Prospects. Prog. Energy Combust. Sci. 2012, 38, 449–467. [Google Scholar] [CrossRef]
  3. Comelli, R.N.; Benzoo, M.T.; Leonardi, R.J.; Seluy, L.G.; Tomassi, A.H.; Isla, M.A. Agro-Industrial Wastewaters as Feedstocks: New Research on Bioethanol Production. In Agricultural Research Updates; Nova Science Publishers: Hauppauge, NY, USA, 2023; Volume 43, ISBN 979-8-88697-550-5. [Google Scholar]
  4. Wyman, C.E. (Ed.) Handbook on Bioethanol: Production and Utilization; Applied Energy Technology Series; Taylor & Francis: Washington, DC, USA, 1996; ISBN 978-1-56032-553-6. [Google Scholar]
  5. Devi, A.; Singh, A.; Bajar, S.; Pant, D.; Din, Z.U. Ethanol from Lignocellulosic Biomass: An in-Depth Analysis of Pre-Treatment Methods, Fermentation Approaches and Detoxification Processes. J. Environ. Chem. Eng. 2021, 9, 105798. [Google Scholar] [CrossRef]
  6. Patel, A.; Shah, A.R. Integrated Lignocellulosic Biorefinery: Gateway for Production of Second Generation Ethanol and Value Added Products. J. Bioresour. Bioprod. 2021, 6, 108–128. [Google Scholar] [CrossRef]
  7. Nishida, V.S.; Woiciechowski, A.L.; Valladares-Diestra, K.K.; Zevallos Torres, L.A.; Vandenberghe, L.P.d.S.; Zandoná Filho, A.; Soccol, C.R. Second Generation Bioethanol Production from Soybean Hulls Pretreated with Imidazole as a New Solvent. Fermentation 2023, 9, 93. [Google Scholar] [CrossRef]
  8. Amaro Bittencourt, G.; Porto de Souza Vandenberghe, L.; Valladares-Diestra, K.; Wedderhoff Herrmann, L.; Fátima Murawski de Mello, A.; Sarmiento Vásquez, Z.; Grace Karp, S.; Ricardo Soccol, C. Soybean Hulls as Carbohydrate Feedstock for Medium to High-Value Biomolecule Production in Biorefineries: A Review. Bioresour. Technol. 2021, 339, 125594. [Google Scholar] [CrossRef]
  9. Cassales, A.; de Souza-Cruz, P.B.; Rech, R.; Záchia Ayub, M.A. Optimization of Soybean Hull Acid Hydrolysis and Its Characterization as a Potential Substrate for Bioprocessing. Biomass Bioenergy 2011, 35, 4675–4683. [Google Scholar] [CrossRef]
  10. Cortivo, P.R.D.; Hickert, L.R.; Hector, R.; Ayub, M.A.Z. Fermentation of Oat and Soybean Hull Hydrolysates into Ethanol and Xylitol by Recombinant Industrial Strains of Saccharomyces Cerevisiae under Diverse Oxygen Environments. Ind. Crops Prod. 2018, 113, 10–18. [Google Scholar] [CrossRef]
  11. Kumar, A.; Gautam, A.; Dutt, D. Biotechnological Transformation of Lignocellulosic Biomass in to Industrial Products: An Overview. Adv. Biosci. Biotechnol. 2016, 07, 149–168. [Google Scholar] [CrossRef]
  12. Chiaramonti, D.; Prussi, M.; Ferrero, S.; Oriani, L.; Ottonello, P.; Torre, P.; Cherchi, F. Review of Pretreatment Processes for Lignocellulosic Ethanol Production, and Development of an Innovative Method. Biomass Bioenergy 2012, 46, 25–35. [Google Scholar] [CrossRef]
  13. Harris, J.F.; Baker, A.J.; Conner, A.H.; Jeffries, T.W.; Minor, J.L.; Pettersen, R.C.; Scott, R.W.; Springer, E.L.; Wegner, T.H.; Zerbe, J.I. Two-Stage, Dilute Sulfuric Acid Hydrolysis of Wood: An Investigation of Fundamentals; U.S. Department of Agriculture, Forest Service, Forest Products Laboratory: Madison, WI, USA, 1985; p. FPL-GTR-45.
  14. Silverstein, R.A.; Chen, Y.; Sharma-Shivappa, R.R.; Boyette, M.D.; Osborne, J. A Comparison of Chemical Pretreatment Methods for Improving Saccharification of Cotton Stalks. Bioresour. Technol. 2007, 98, 3000–3011. [Google Scholar] [CrossRef] [PubMed]
  15. Taherzadeh, M.J.; Karimi, K. Acid-Based Hydrolysis Processes for Ethanol from Lignocellulosic Materials: A Review. BioResources 2007, 2, 472–499. [Google Scholar]
  16. Takeuchi, Y.; Jin, F.; Tohji, K.; Enomoto, H. Acid Catalytic Hydrothermal Conversion of Carbohydrate Biomass into Useful Substances. J. Mater. Sci. 2008, 43, 2472–2475. [Google Scholar] [CrossRef]
  17. Shahbazi, A.; Zhang, B. Dilute and Concentrated Acid Hydrolysis of Lignocellulosic Biomass. In Bioalcohol Production; Elsevier: Amsterdam, The Netherlands, 2010; pp. 143–158. ISBN 978-1-84569-510-1. [Google Scholar]
  18. Tadimeti, J.G.D.; Thilakaratne, R.; Balla, V.K.; Kate, K.H.; Satyavolu, J. A Two-Stage C5 Selective Hydrolysis on Soybean Hulls for Xylose Separation and Value-Added Cellulose Applications. Biomass Conv. Bioref. 2020, 12, 3289–3301. [Google Scholar] [CrossRef]
  19. Sluiter, A. Determination of Ash in Biomass: Laboratory Analytical Procedure (LAP); Issue Date: 7/17/2005. Technical Report; National Renewable Energy Laboratory: Golden, CO, USA, 2008.
  20. Sluiter, A.; Hames, B.; Ruiz, R.; Scarlata, C.; Sluiter, J.; Templeton, D.; Crocker, D. Determination of Structural Carbohydrates and Lignin in Biomass; Technical Report; National Renewable Energy Laboratory: Golden, CO, USA, 2012.
  21. Eberts, T.J.; Sample, R.H.; Glick, M.R.; Ellis, G.H. A Simplified, Colorimetric Micromethod for Xylose in Serum or Urine, with Phloroglucinol. Clin. Chem. 1979, 25, 1440–1443. [Google Scholar] [CrossRef] [PubMed]
  22. Rocha, G.J.M.; Silva, F.T.; Curvelo, A.A.S.; Araujo, G.T. A Fast and Accurate Method for Determination of Cellulose and Polyoses by HPLC. In Proceedings of the Fifth Brazilian Symposium on the Chemistry of Lignins and Other Wood Components, Curitiba, Brazil, 31 August–5 September 1997; Sepia Editora e Gráfica LTDA: Curitiba, Brazil, 1997; Volume VI. [Google Scholar]
  23. Comelli, R.N.; Seluy, L.G.; Isla, M.A. Optimization of a Low-Cost Defined Medium for Alcoholic Fermentation—A Case Study for Potential Application in Bioethanol Production from Industrial Wastewaters. New Biotechnol. 2016, 33, 107–115. [Google Scholar] [CrossRef]
  24. Comelli, R.N.; Seluy, L.G.; Isla, M.A. Performance of Several Saccharomyces Strains for the Alcoholic Fermentation of Sugar-Sweetened High-Strength Wastewaters: Comparative Analysis and Kinetic Modelling. New Biotechnol. 2016, 33, 874–882. [Google Scholar] [CrossRef]
  25. Eaton, A.D.; Clesceri, L.S.; Greenberg, A.E. Standard Methods for the Examination of Water and Wastewater, 21st ed.; American Public Health Association: Washington, DC, USA, 2005; ISBN 978-0-87553-047-5. [Google Scholar]
  26. Isla, M.A.; Comelli, R.N.; Seluy, L.G. Wastewater from the Soft Drinks Industry as a Source for Bioethanol Production. Bioresour. Technol. 2013, 136, 140–147. [Google Scholar] [CrossRef]
  27. Rojas, M.J.; Siqueira, P.F.; Miranda, L.C.; Tardioli, P.W.; Giordano, R.L.C. Sequential Proteolysis and Cellulolytic Hydrolysis of Soybean Hulls for Oligopeptides and Ethanol Production. Ind. Crops Prod. 2014, 61, 202–210. [Google Scholar] [CrossRef]
  28. Miron, J.; Yosef, E.; Ben-Ghedalia, D. Composition and in Vitro Digestibility of Monosaccharide Constituents of Selected Byproduct Feeds. J. Agric. Food Chem. 2001, 49, 2322–2326. [Google Scholar] [CrossRef]
  29. Corredor, D.Y.; Sun, X.S.; Salazar, J.M.; Hohn, K.L.; Wang, D. Enzymatic Hydrolysis of Soybean Hulls Using Dilute Acid and Modified Steam-Explosion Pretreatments. J Biobased Mater. Bioenergy 2008, 2, 43–50. [Google Scholar] [CrossRef]
  30. Cortivo, P.R.D.; Machado, J.; Hickert, L.R.; Rossi, D.M.; Ayub, M.A.Z. Production of 2,3-Butanediol by Klebsiella Pneumoniae BLh-1 and Pantoea Agglomerans BL1 Cultivated in Acid and Enzymatic Hydrolysates of Soybean Hull. Biotechnol. Prog. 2019, 35, e2793. [Google Scholar] [CrossRef]
  31. Toro-Trochez, J.L.; Carrillo-Pedraza, E.S.; Bustos-Martínez, D.; García-Mateos, F.J.; Ruiz-Rosas, R.R.; Rodríguez-Mirasol, J.; Cordero, T. Thermogravimetric Characterization and Pyrolysis of Soybean Hulls. Bioresour. Technol. Rep. 2019, 6, 183–189. [Google Scholar] [CrossRef]
  32. Robles Barros, P.J.; Ramirez Ascheri, D.P.; Siqueira Santos, M.L.; Morais, C.C.; Ramirez Ascheri, J.L.; Signini, R.; dos Santos, D.M.; de Campos, A.J.; Alessandro Devilla, I. Soybean Hulls: Optimization of the Pulping and Bleaching Processes and Carboxymethyl Cellulose Synthesis. Int. J. Biol. Macromol. 2020, 144, 208–218. [Google Scholar] [CrossRef] [PubMed]
  33. Jung, Y.H.; Park, H.M.; Kim, D.H.; Park, Y.-C.; Seo, J.-H.; Kim, K.H. Combination of High Solids Loading Pretreatment and Ethanol Fermentation of Whole Slurry of Pretreated Rice Straw to Obtain High Ethanol Titers and Yields. Bioresour. Technol. 2015, 198, 861–866. [Google Scholar] [CrossRef] [PubMed]
  34. Shiva; Climent Barba, F.; Rodríguez-Jasso, R.M.; Sukumaran, R.K.; Ruiz, H.A. High-Solids Loading Processing for an Integrated Lignocellulosic Biorefinery: Effects of Transport Phenomena and Rheology—A Review. Bioresour. Technol. 2022, 351, 127044. [Google Scholar] [CrossRef]
  35. Zhang, B.; Liu, X.; Bao, J. High Solids Loading Pretreatment: The Core of Lignocellulose Biorefinery as an Industrial Technology—An Overview. Bioresour. Technol. 2023, 369, 128334. [Google Scholar] [CrossRef]
  36. Pino, M.S.; Rodríguez-Jasso, R.M.; Michelin, M.; Flores-Gallegos, A.C.; Morales-Rodriguez, R.; Teixeira, J.A.; Ruiz, H.A. Bioreactor Design for Enzymatic Hydrolysis of Biomass under the Biorefinery Concept. Chem. Eng. J. 2018, 347, 119–136. [Google Scholar] [CrossRef]
  37. Aguilar, D.L.; Rodríguez-Jasso, R.M.; Zanuso, E.; de Rodríguez, D.J.; Amaya-Delgado, L.; Sanchez, A.; Ruiz, H.A. Scale-up and Evaluation of Hydrothermal Pretreatment in Isothermal and Non-Isothermal Regimen for Bioethanol Production Using Agave Bagasse. Bioresour. Technol. 2018, 263, 112–119. [Google Scholar] [CrossRef]
  38. Schirmer-Michel, Â.C.; Flôres, S.H.; Hertz, P.F.; Matos, G.S.; Ayub, M.A.Z. Production of Ethanol from Soybean Hull Hydrolysate by Osmotolerant Candida Guilliermondii NRRL Y-2075. Bioresour. Technol. 2008, 99, 2898–2904. [Google Scholar] [CrossRef]
  39. Marzialetti, T.; Valenzuela Olarte, M.B.; Sievers, C.; Hoskins, T.J.C.; Agrawal, P.K.; Jones, C.W. Dilute Acid Hydrolysis of Loblolly Pine: A Comprehensive Approach. Ind. Eng. Chem. Res. 2008, 47, 7131–7140. [Google Scholar] [CrossRef]
  40. Palmqvist, E.; Hahn-Hägerdal, B. Fermentation of Lignocellulosic Hydrolysates. I: Inhibition and Detoxification. Bioresour. Technol. 2000, 74, 17–24. [Google Scholar] [CrossRef]
  41. Klinke, H.B.; Thomsen, A.B.; Ahring, B.K. Inhibition of Ethanol-Producing Yeast and Bacteria by Degradation Products Produced during Pre-Treatment of Biomass. Appl. Microbiol. Biotechnol. 2004, 66, 10–26. [Google Scholar] [CrossRef] [PubMed]
  42. Panagiotou, G.; Olsson, L. Effect of Compounds Released during Pretreatment of Wheat Straw on Microbial Growth and Enzymatic Hydrolysis Rates. Biotechnol. Bioeng. 2007, 96, 250–258. [Google Scholar] [CrossRef] [PubMed]
  43. Lee, H.-J.; Lim, W.-S.; Lee, J.-W. Improvement of Ethanol Fermentation from Lignocellulosic Hydrolysates by the Removal of Inhibitors. J. Ind. Eng. Chem. 2013, 19, 2010–2015. [Google Scholar] [CrossRef]
  44. Hoppert, L.; Kölling, R.; Einfalt, D. Synergistic Effects of Inhibitors and Osmotic Stress during High Gravity Bioethanol Production from Steam-Exploded Lignocellulosic Feedstocks. Biocatal. Agric. Biotechnol. 2022, 43, 102414. [Google Scholar] [CrossRef]
  45. Yoo, J.; Alavi, S.; Vadlani, P.; Amanor-Boadu, V. Thermo-Mechanical Extrusion Pretreatment for Conversion of Soybean Hulls to Fermentable Sugars. Bioresour. Technol. 2011, 102, 7583–7590. [Google Scholar] [CrossRef]
  46. Abatzoglou, N.; Chornet, E.; Belkacemi, K.; Overend, R.P. Phenomenological Kinetics of Complex Systems: The Development of a Generalized Severity Parameter and Its Application to Lignocellulosics Fractionation. Chem. Eng. Sci. 1992, 47, 1109–1122. [Google Scholar] [CrossRef]
  47. Derringer, G.; Suich, R. Simultaneous Optimization of Several Response Variables. J. Qual. Technol. 1980, 12, 214–219. [Google Scholar] [CrossRef]
  48. Carlyle, W.M.; Montgomery, D.C.; Runger, G.C. Optimization Problems and Methods in Quality Control and Improvement. J. Qual. Technol. 2000, 32, 1–17. [Google Scholar] [CrossRef]
  49. Lie, S. The Ebc-ninhydrin method for determination of free alpha amino nitrogen. J. Inst. Brew. 1973, 79, 37–41. [Google Scholar] [CrossRef]
  50. Jacob, F.F.; Striegel, L.; Rychlik, M.; Hutzler, M.; Methner, F.-J. Spent Yeast from Brewing Processes: A Biodiverse Starting Material for Yeast Extract Production. Fermentation 2019, 5, 51. [Google Scholar] [CrossRef]
  51. Hor, S.; Kongkeitkajorn, M.B.; Reungsang, A. Sugarcane Bagasse-Based Ethanol Production and Utilization of Its Vinasse for Xylitol Production as an Approach in Integrated Biorefinery. Fermentation 2022, 8, 340. [Google Scholar] [CrossRef]
  52. Kaur, S.; Guleria, P.; Yadav, S.K. Evaluation of Fermentative Xylitol Production Potential of Adapted Strains of Meyerozyma Caribbica and Candida Tropicalis from Rice Straw Hemicellulosic Hydrolysate. Fermentation 2023, 9, 181. [Google Scholar] [CrossRef]
  53. Mouro, A.; dos Santos, A.A.; Agnolo, D.D.; Gubert, G.F.; Bon, E.P.S.; Rosa, C.A.; Fonseca, C.; Stambuk, B.U. Combining Xylose Reductase from Spathaspora Arborariae with Xylitol Dehydrogenase from Spathaspora Passalidarum to Promote Xylose Consumption and Fermentation into Xylitol by Saccharomyces Cerevisiae. Fermentation 2020, 6, 72. [Google Scholar] [CrossRef]
  54. Wahlbom, C.; Vanzyl, W.; Jonsson, L.; Hahnhagerdal, B.; Otero, R. Generation of the Improved Recombinant Xylose-Utilizing TMB 3400 by Random Mutagenesis and Physiological Comparison with CBS 6054. FEMS Yeast Res. 2003, 3, 319–326. [Google Scholar] [CrossRef]
  55. Chen, Y.; Dong, B.; Qin, W.; Xiao, D. Xylose and Cellulose Fractionation from Corncob with Three Different Strategies and Separate Fermentation of Them to Bioethanol. Bioresour. Technol. 2010, 101, 6994–6999. [Google Scholar] [CrossRef]
  56. Vedovatto, F.; Bonatto, C.; Bazoti, S.F.; Venturin, B.; Alves, S.L., Jr.; Kunz, A.; Steinmetz, R.L.R.; Treichel, H.; Mazutti, M.A.; Zabot, G.L.; et al. Production of Biofuels from Soybean Straw and Hull Hydrolysates Obtained by Subcritical Water Hydrolysis. Bioresour. Technol. 2021, 328, 124837. [Google Scholar] [CrossRef]
  57. Aquarone, E. Penicillin and Tetracycline as Contamination Control Agents in Alcoholic Fermentation of Sugar Cane Molasses. Appl. Microbiol. 1960, 8, 263–268. [Google Scholar] [CrossRef]
  58. Hynes, S.H.; Kjarsgaard, D.M.; Thomas, K.C.; Ingledew, W.M. Use of Virginiamycin to Control the Growth of Lactic Acid Bacteria during Alcohol Fermentation. J. Ind. Microbiol. Biotechnol. 1997, 18, 284–291. [Google Scholar] [CrossRef]
  59. Peng, J.; Zhang, L.; Gu, Z.-H.; Ding, Z.-Y.; Shi, G.-Y. The Role of Nisin in Fuel Ethanol Production with Saccharomyces Cerevisiae: Nisin and Fuel Ethanol Production. Lett. Appl. Microbiol. 2012, 55, 128–134. [Google Scholar] [CrossRef] [PubMed]
  60. Chohan, N.A.; Aruwajoye, G.S.; Sewsynker-Sukai, Y.; Gueguim Kana, E.B. Valorisation of Potato Peel Wastes for Bioethanol Production Using Simultaneous Saccharification and Fermentation: Process Optimization and Kinetic Assessment. Renew. Energy 2020, 146, 1031–1040. [Google Scholar] [CrossRef]
  61. Sethupathy, S.; Murillo Morales, G.; Gao, L.; Wang, H.; Yang, B.; Jiang, J.; Sun, J.; Zhu, D. Lignin Valorization: Status, Challenges and Opportunities. Bioresour. Technol. 2022, 347, 126696. [Google Scholar] [CrossRef] [PubMed]
Figure 1. Response surface showing %HC after acid pretreatment.
Fermentation 09 00454 g001
Figure 2. Effects graph for Temperature and Sulfuric acid concentration over %HC. Parallel lines show that no interaction exists.
Fermentation 09 00454 g002
Figure 3. Bar graph for %HC at T = 80 °C (a) and T = 125 °C (b). No significant differences were observed when reaction time increased from 30 min to 180 min.
Fermentation 09 00454 g003
Figure 4. Boxplot that shows the furfural (a) and HMF (b) production by treatment. The treatment sequence is running from low to high concentrations.
Fermentation 09 00454 g004
Figure 5. Relations between operational variables (Temperature, Sulfuric acid concentration and Time) over furans production. Response surfaces obtained for furfural (a) and HMF (d) production for a reaction time of 180.0 min. Temporal evolution of furans production predicted for different sulfuric acid concentrations when T = 135.0 °C, (b,e); and for different temperatures when sulfuric acid concentration was 3.0% w/v, (c,f), respectively.
Fermentation 09 00454 g005aFermentation 09 00454 g005b
Figure 6. Response surface showing %CEL at 12 h of enzymatic saccharification after acid pretreatment during 30 min using different combinations of temperature and acid concentration.
Fermentation 09 00454 g006
Figure 7. Dispersion graph showing relation between %HC and %CEL at 12 h of enzymatic saccharification.
Fermentation 09 00454 g007
Figure 8. Dispersion graphs showing relations between Severity Factor R0′ and %HC (a), %CEL (b), HMF (c) and Furfural (d), respectively.
Fermentation 09 00454 g008
Figure 9. Desirability surfaces obtained by resolving the optimization problem described by Equation (9), maximizing %HC (a) and %CEL (b) at 12 h of enzymatic hydrolysis with sulfuric acid 2.5% w/v.
Fermentation 09 00454 g009
Figure 10. Yeast performance during batch fermentation experiments on a synthetic medium (a), where changes in biomass are indicated by a dashed line, and SH hydrolysates (b). The reported values represent the means of three independent experiments.
Fermentation 09 00454 g010
Table 1. Factors and higher and lower values defined.
FactorsUnitsLower ValueHigher Value
Timemin30180
Temperature°C80125
H2SO4 concentration% w/v0.52.5
Table 2. Experimental design.
TreatmentTime (min)Temperature (°C)H2SO4 (% w/v)
11051032.79
21051030.21
391031.50
430800.50
52021031.50
6180802.50
7 11051031.50
81051311.50
91801252.50
101801250.50
11180800.50
12105741.50
1330802.50
14301250.50
15301252.50
1 The central point of each block was performed by duplicate, so this condition was evaluated in sextuplicate.
Table 3. Soybean hull compositions.
Cellulose (%)Hemicellulose (%)Lignin (%)Ash (%)Reference
51.215.91.5–4.2ND 1[28] 2
36.412.518.24.2[29]
39.725.59.1NI[9]
39.024.012.0NI[30]
52.318.53.72.5[31]
40.633.87.84.2[32]
45.015.14.02.0This work
1 ND: Not determined. 2 Estimates by Van Soest method.
Table 4. Observed values of response variables defined and predicted values by models built.
Response VariablePredictedObserved
%HC82.07 ± 5.0790.42 ± 3.90
Furfural (mg/L)85.06 ± 4.25 97.00 ± 12.07
HMF (mg/L)80.68 ± 4.0368.78 ± 10.39
Table 5. Fermentation parameters for S. cer-ER over SH hydrolysates and synthetic medium.
Fermentation MediaYet/gluYx/glurx
(g/L.h)
rs
(g/L.h)
rp
(g/L.h)
Initial Glucose
conc. (g/L)
Glucose Consumption (%)Max. Biomass conc. (g/L)Max. Ethanol conc. 1 (g/L)
SH Hydrolysates0.45--8.653.6369.5100-36.6
Synthetic control medium0.440.151.348.653.6360.010010.526.40
1 Values for 12 h fermentation.
Table 6. Fermentations parameters obtained in published experiences over different hydrolysates.
Fermentation MediaPretreatmentYp/s (gethanol/gglucose)rp
(g/L.h)
Initial Glucose (g/L)Final Ethanol (g/L)Fermentation Time (h)Ref.
Detoxified corn stover hydrolysate. Nutrient supplementation.Dilute H2SO40.538ND 1SSF37.85120 [55]
Soybean and oat hulls hydrolysate.Dilute H2SO40.34–0.38NI60.12 ± 2.0324.2 ± 2.10120 [10]
Soybean straw and hulls hydrolysates (SS&HH) supplemented with 10 g/L glucose.Subcritical water (200 °C)--10.96-96 [56]
SS&HH diluted ½ and supplemented with 10 g/L of glucose.Hydrolysis with subcritical water (200 °C)0.557NI10.966.11 ± 0.1196 [56]
Soybean hull hydrolysateDilute H2SO40.453.6369.536.6 ± 0.5012 This work
1 ND: Not determined.
Disclaimer/Publisher’s Note: The statements, opinions and data contained in all publications are solely those of the individual author(s) and contributor(s) and not of MDPI and/or the editor(s). MDPI and/or the editor(s) disclaim responsibility for any injury to people or property resulting from any ideas, methods, instructions or products referred to in the content.

