Article

Enhancing Antimicrobial Peptide Productivity in Pichia pastoris (Muts Strain) by Improving the Fermentation Process Based on Increasing the Volumetric Methanol Consumption Rate

by
Chatchol Kongsinkaew
1,
Supenya Chittapun
1,
Chanitchote Piyapittayanun
1,
Viroj Boonyaratanakornkit
2,
Sarintip Sooksai
3,
Kittisak Ajariyakhajorn
4,
Soisuda Pornpukdeewattana
5,
Warawut Krusong
5,
Tunyaboon Laemthong
6 and
Theppanya Charoenrat
1,*
1
Department of Biotechnology, Faculty of Science and Technology, Thammasat University (Rangsit Center), Bangkok 12120, Thailand
2
Department of Clinical Chemistry and Graduate Program in Clinical Biochemistry and Molecular Medicine, Faculty of Allied Health Sciences, Chulalongkorn University, Bangkok 10330, Thailand
3
The Institute of Biotechnology and Genetic Engineering, Chulalongkorn University, Bangkok 10330, Thailand
4
Department of Veterinary Medicine, Faculty of Veterinary Science, Chulalongkorn University, Bangkok 10330, Thailand
5
Division of Fermentation Technology, School of Food Industry, King Mongkut’s Institute of Technology Ladkrabang, Bangkok 10520, Thailand
6
Department of Chemical Engineering, Faculty of Engineering, Thammasat University, Bangkok 12120, Thailand
*
Author to whom correspondence should be addressed.
Fermentation 2023, 9(3), 277; https://doi.org/10.3390/fermentation9030277
Submission received: 30 January 2023 / Revised: 3 March 2023 / Accepted: 10 March 2023 / Published: 12 March 2023

Abstract

:
The instability of the protein expression in Pichia pastoris strains has been an issue for various peptide productions. Some modifications to the traditional fermentation process could potentially solve the problem. Here, we consider a four-stage fermentation process to express the CAP2 (cell-penetrating antimicrobial peptide 2) candidate in P. pastoris KM71H, a slow methanol utilization strain. During the fermentation process, CAP2 productivity is limited (6.15 ± 0.21 mg/L·h) by the low overall methanol consumption (approximately 645 g), which is mainly the result of the slow methanol utilization of the P. pastoris KM71H. To overcome this limitation, we increased the cell concentration two-fold prior to the induction stage. A fed-batch process with exponential and dissolved oxygen tension (DOT) stat feeding strategies was deployed to control the glycerol feed, resulting in an increase in cell concentration and enhancement of the volumetric methanol consumption rate. The improved fermentation process increased the overall methanol consumption (approximately 1070 g) and the CAP2 productivity (13.59 ± 0.24 mg/L·h) by 1.66 and 2.21 times, respectively. In addition, the CAP3 (cell-penetrating antimicrobial peptide 3) candidate could also be produced using this improved fermentation process at a high yield of 3.96 ± 0.02 g/L without any further optimization. Note that there was no oxygen limitation during the improved fermentation process operating at high cell density. This could be due to the controlled substrate addition via the DOT stat system.

1. Introduction

Pichia pastoris was introduced by the Philips Petroleum Company as a protein expression system that used a strongly inducible alcohol oxidase (AOX) promoter [1], and it has become a promising model microorganism for recombinant protein expression. The main attraction of P. pastoris is that it can use methanol as a sole carbon and energy source, grow to high cell densities on a defined medium, secrete recombinant proteins into a growth medium by responding to the alpha factor signal of Saccharomyces cerevisiae, and perform post-translational modifications, such as folding, disulfide bond formation, and glycosylation typically associated with higher eukaryotes [1,2,3,4].
The fermentation process using the P. pastoris expression system has been shown to be a successful technique to improve the production yields of β-glucosidase [5,6,7] and endoglucanase [8]. This fermentation process can be divided into four stages: (i) the glycerol batch stage, (ii) the glycerol fed-batch stage, (iii) the methanol induction stage, and (iv) the production stage [9]. In brief, cells were cultured in the glycerol batch stage, at the end of which approximately 20 g/L of dry cell weight (DCW) was obtained and forced to grow to a DCW of 40 g/L with the addition of glycerol feed (GF) medium using an exponential feed strategy during the glycerol fed-batch stage. Then, the process with a DCW of 40 g/L was induced to utilize methanol through the intermittent addition of methanol feed (MF) medium during the induction stage. Finally, the expression of the recombinant protein was induced by the addition of MF medium using a dissolved oxygen tension (DOT) stat feeding strategy [9], an indirect feedback mode that automatically controls the substrate feeding rate to efficiently maintain the on-line DOT at a near-constant level [10]. To increase endoglucanase production, this four-stage fermentation process has been optimized using a synthetic medium for the inoculum and pH control of proteolysis [8], and the increase in the oxygen transfer rate has improved β-glucosidase production [6].
Utilizing the four-stage fermentation process to express a recombinant protein in the methanol utilization plus (Mut+) strain of P. pastoris, a smooth induction stage was observed, and the methanol addition could be controlled by a DOT signal at 20–25% air saturation [7]. Meanwhile, using a slow methanol utilization (Muts) strain of P. pastoris resulted in a longer induction during endoglucanase production [8] and difficulty in controlling the DOT regulation for the addition of methanol in the production stage, thereby resulting in a decrease in productivity. The specific methanol consumption rate of the P. pastoris Muts strain was 22 mg/g [5], which was 26 times less than that of the Mut+ strain (570 mg/g) [9], resulting in a slow response to the DOT signal because of a lower overall volumetric methanol consumption rate. However, according to various reports, the Muts strain enables higher levels of recombinant protein production than the Mut+ strain [11,12,13,14,15]. The slow growth and lower methanol consumption of the Muts strain may also provide some advantages in large-scale operations, such as a lower oxygen demand and heat generation [16].
In the case of fermentation processes based on an inducible promoter, little attention has been given to cell concentration at the start of the induction stage [17]. Most fermentation processes terminate the glycerol fed-batch stage when the cell concentration reaches approximately 40 g/L of DCW, which is regarded as sufficient for recombinant protein production [5,9,18,19]. Some reports showed that the increase in cell concentration prior to the methanol induction stage enhanced both the volumetric methanol consumption rate and total methanol consumption, resulting in an increase in recombinant protein production [5,20].
We successfully increased the volumetric methanol consumption rate during β-glucosidase production in the P. pastoris Muts strain by increasing the cell concentration up to 80 g/L prior to the methanol induction stage, which was two times higher than the level recommended in the standard process. To do this, we used a combination of exponential and constant feed strategies, which resulted in an improved β-glucosidase production rate due to higher total methanol consumption [5]. However, oxygen limitation may occur during the glycerol fed-batch stage due to the constant feed strategy used. Likewise, in the production stage, even though the specific methanol supply rate was optimized to enhance the production yield by utilizing a constant feed strategy for the addition of MF medium, the DOT signal fell below 20% air saturation, posing a risk of oxygen limitation [5]. Furthermore, optimizing the specific methanol supply rate is a time-consuming step [5,9] that may require re-optimization when expressing a novel recombinant protein [21], even when using the same strain of P. pastoris due to its characteristics [5,8]. Consequently, the four-stage fermentation process needs to be further developed to prevent oxygen limitation during the fermentation process at high cell concentrations to make it suitable for the production of additional recombinant proteins.
The objective of this study was, therefore, to improve the four-stage fermentation process. We increased the volumetric methanol consumption rate by increasing the cell concentration prior to the methanol induction stage, which resulted in increased antimicrobial peptide productivity. The DOT stat feeding strategy was used in the improved fermentation process to control the addition of GF and MF media in the glycerol fed-batch and production stages, respectively, in order to prevent oxygen limitation.

2. Materials and Methods

2.1. Yeast Strains

The CAP2 is a peptide fusion between CyLoP-1 (cytosol localizing peptide-1) [22] and short peptides RRIKA (WLRRIKAWLRRIKA) [23]. The CAP2 cDNA gene was cloned into the pPICzα vector (Invitrogen) and integrated into the genome of the P. pastoris KM71H strain at the pAOX1. A Muts zeocin+ transformant was selected and characterized for extracellular CAP2 production. The CAP3 is a peptide fusion between CyLoP-1 and BAC7(1-16) [24]. The CAP3 cDNA gene was cloned into the pPICzα vector and integrated into the genome of the P. pastoris KM71H at the pAOX1. A Muts zeocin+ transformant was selected and characterized for extracellular CAP3 production. The P. pastoris KM71H with the CAP2 gene and the CAP3 gene were, therefore, called P. pastoris CAP2 and P. pastoris CAP 3, respectively.

2.2. Inoculum Preparation

A primary starter was prepared by inoculating a single colony of recombinant P. pastoris into a 250 mL Erlenmeyer flask containing 40 mL of yeast extract peptone dextrose (YPD) medium. The cells were grown for 24 h at 30 °C and 250 rpm. Following 24 h of incubation, the primary starter was diluted to a target optical density (OD) at 600 nm of 10.0. A secondary starter was prepared by transferring 10 mL of the diluted primary starter (OD600 = 10) into a 500 mL Erlenmeyer flask containing 90 mL of Syn6 medium [25]. The cells were grown for 20 h at 30 °C and 250 rpm.

2.3. The Four-Stage Fermentation Process Improvement Utilizing the P. pastoris Muts Strain as a Model Organism to Express the CAP2 Candidate

2.3.1. The CAP2 Candidate Expression Using a Reference Process

In this study, the four-stage fermentation process was used as a reference process. The recombinant P. pastoris CAP2 was grown using the previously described four-stage fermentation process [8]. This experiment was performed in a 20 L fermenter (Biostat C Plus, Sartorius Stedim Biotech, Göttingen, Germany) containing 4 L of basal salt medium (BSM) with a 4.35 mL/L PTM1 (Pichia trace metal 1) trace salt solution [8]. The fermentation conditions were controlled at 1 vvm aeration and 1000 rpm agitation at 30 °C. The pH was regulated by adding an alkaline solution (a 25% ammonia solution) to keep it at 5.0 throughout the fermentation. The cells were grown in the glycerol batch stage until the glycerol was depleted, which was detected by a sharp increase in the DOT signal.
During the glycerol fed-batch stage, the GF medium (500 g/L glycerol with 12 mL/L PTM1) was fed into a fermenter to force the growth of the cells to a concentration of 40 g/L with an exponential feed rate, which relates to a growth rate of µset = 0.29 h−1, according to Equation (1):
F t = μ m a x V 0 X 0 S 0 Y x / s e x p μ s e t t
where F is the feed rate (L/h), t is time (h), µmax is the maximum specific growth rate (h−1), V0 is the initial volume (L), X0 is the initial cell concentration (g/L), S0 is the glycerol concentration in the GF medium (g/L), Yx/s is the biomass yield (g/g), and µset is the desired specific growth rate (h−1). At the beginning of this stage, the aeration rate was immediately increased to 2.4 vvm and maintained throughout this stage. Once this stage was completed, the induction stage was initiated. At the beginning of the induction stage, the aeration rate was decreased to 1.2 vvm and maintained throughout the fermentation process. In the induction stage, the MF medium (500 g/L methanol with 12 mL/L PTM1) was added intermittently to obtain a final methanol concentration of 1 g/L at 1.5, 2.5, and 3.5 h of the induction period. At the end of the induction stage, the P. pastoris cells were able to use methanol as a substrate, which could be monitored by the response of the DOT signal to the addition of methanol. The DOT stat system was then used to control the addition of the MF medium to initiate the production stage and run for 65 h.

2.3.2. The CAP2 Candidate Expression Utilizes the Improved Fermentation Process

In the glycerol batch and glycerol fed-batch stages, P. pastoris CAP2 was grown, as described in the four-stage fermentation process (Section 2.3.1). Once the cell concentration reached 40 g/L (OD600 ≈ 160) in the early glycerol fed-batch stage, the late glycerol fed-batch stage was initiated by controlling the DOT set point at 20–25% air saturation, to force the growth of the cells to a concentration of 80 g/L (OD600 ≈ 300). The total volume of GF medium added to attain a cell concentration of 80 g/L was calculated from Equation (2):
V F = V 0 c Y x s S 0 X 0 c Y x s S 0 X F
where VF is the volume of GF medium (L), V0c is the initial volume in the fermenter before the addition of the GF medium (L), Yx/s is the biomass yield (g/g), S0 is the glycerol concentration in GF medium (g/L), X0c is the initial cell density (g/L), and XF is the desired cell density (g/L).
In the early and late glycerol fed-batch stages, the aeration rate was increased to 2.4 vvm and maintained throughout these minor stages. In the induction stage, the aeration rate was decreased to 1.2 vvm and maintained throughout the fermentation process. In the early induction stage, the MF medium was added intermittently to obtain the final methanol concentration of 1 g/L at 1.5, 2.5, and 3.5 h of the induction period. Following a sharp increase in the DOT signal after the last intermittent addition of MF medium, the late induction stage was initiated using the DOT stat system to control the addition of the MF medium. In this stage, the DOT set point slowly continued to decrease to 20–25% air saturation within 6 h. Then, the DOT signal was controlled at 20–25% air saturation to control the addition of the MF medium in the production stage for 72 h.

2.4. Fermentation Process Validation: The CAP3 Candidate Expression Utilizing the Improved Fermentation Process

The recombinant P. pastoris CAP3 was grown utilizing the improved fermentation process, as described in Section 2.3.2.

2.5. Cell Density Determination, Total Protein Assay, and Tricine SDS-PAGE

The cell density was determined by measuring the OD600 using a spectrophotometer (Libra S22, Biochrom, Cambridge, UK) and the dry cell weight (DCW). For the DCW measurement, 1.5 mL of the sample was centrifuged at 7378× g for 5 min, then the cells were washed with 1% (w/w) phosphoric acid, and washed again with distilled water. Then, the cells were dried at 80 °C for 48 h, and the DCW was measured [5]. The total protein concentration was quantified through a Lowry protein assay [26] using bovine serum albumin as a standard. Tricine SDS-PAGE was performed to observe the target peptides, as previously described [27]. Gels were imaged and saved as JPEG files with a size of 2379 × 1433 pixels and a resolution of 600 dpi.

2.6. Target Peptide Quantification

The target peptides were quantified through densitometry using ImageJ software [28]. In brief, the electrophoresis gels were saved as JPEG files with a resolution of 2379 × 1433 pixels. Images were cropped to 1070 × 774 pixels to zoom into the gel, and the image type was converted to 16-bit. The rolling ball algorithm was used to decrease the background subtracted by setting the rolling ball radius size to 250 pixels. The gel analyzer tool in ImageJ was used to determine the profile of each lane of the gels. The size of the lane selection tool was 30 pixels wide. From the profile of the lanes, the peak area was created manually by drawing a straight line across the baseline of the profile. The peak areas of the known concentration bands were plotted as a standard curve to estimate the product concentration.

2.7. Statistical Analysis

The fermentation operations were run as single biological experiments according to a previous study’s description [18]. Measurements of the DCW and total protein were represented as three technical replicates. The DCW and total protein were presented as means ± standard deviations.

3. Results and Discussion

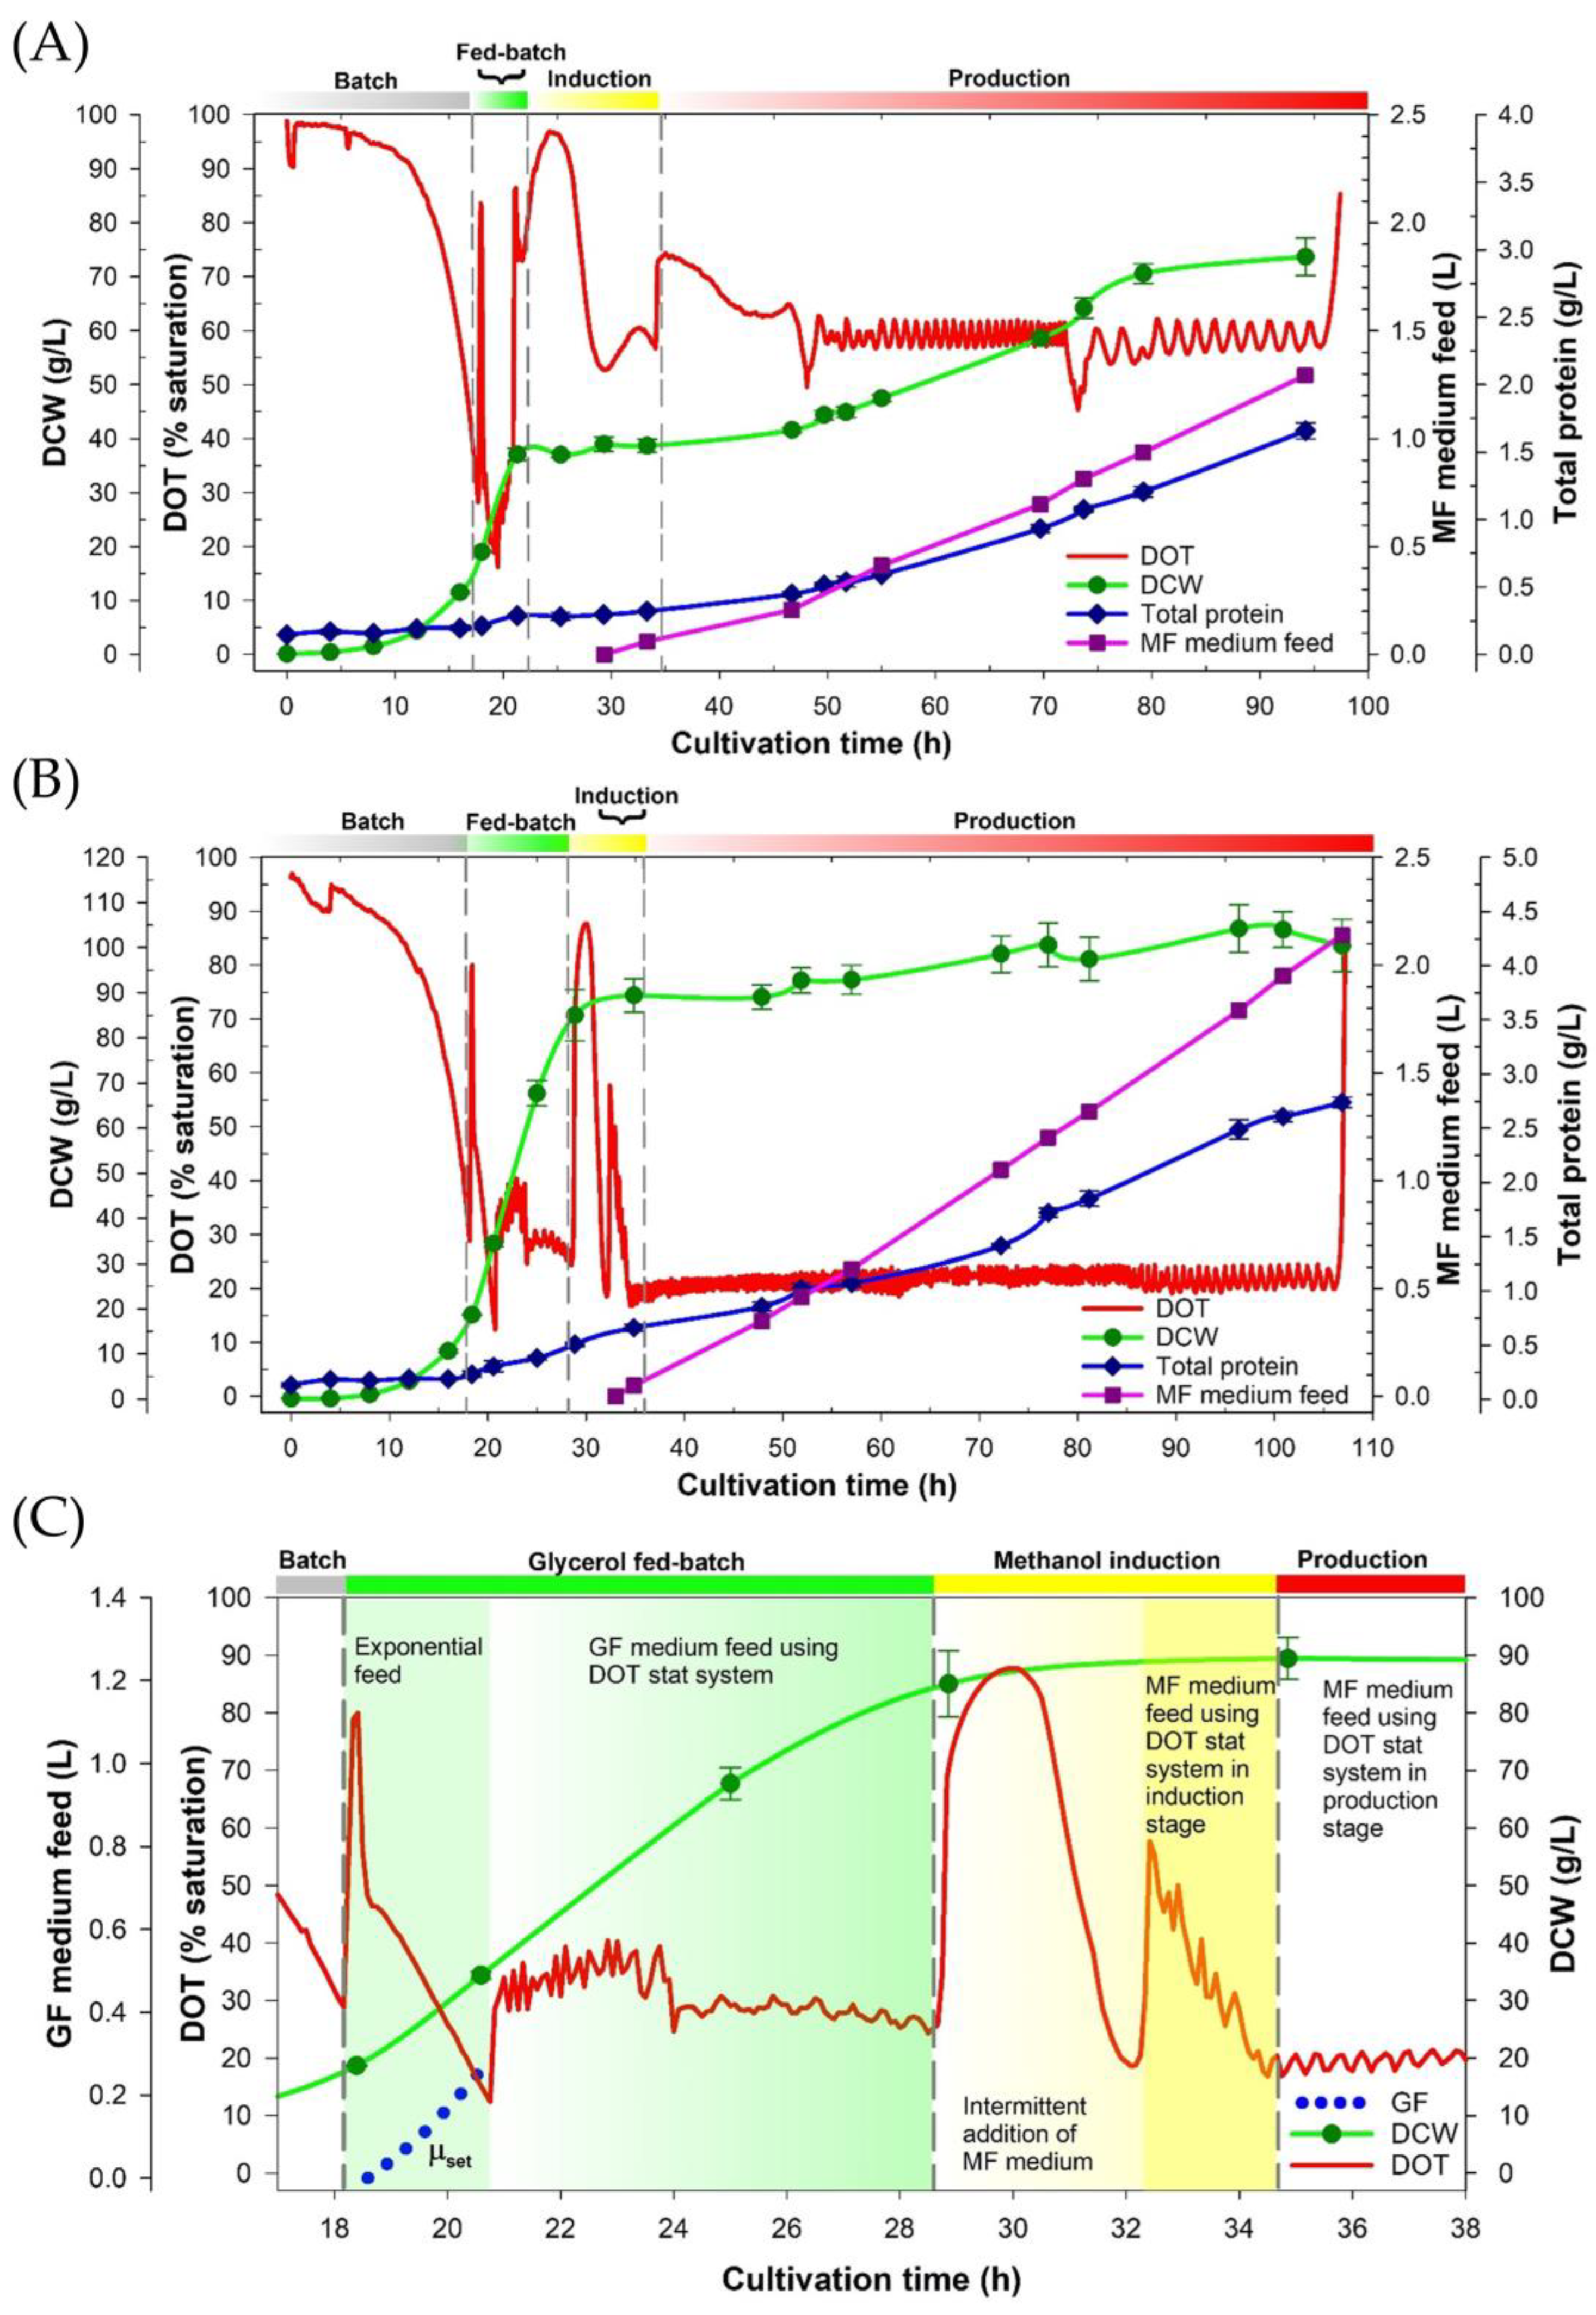
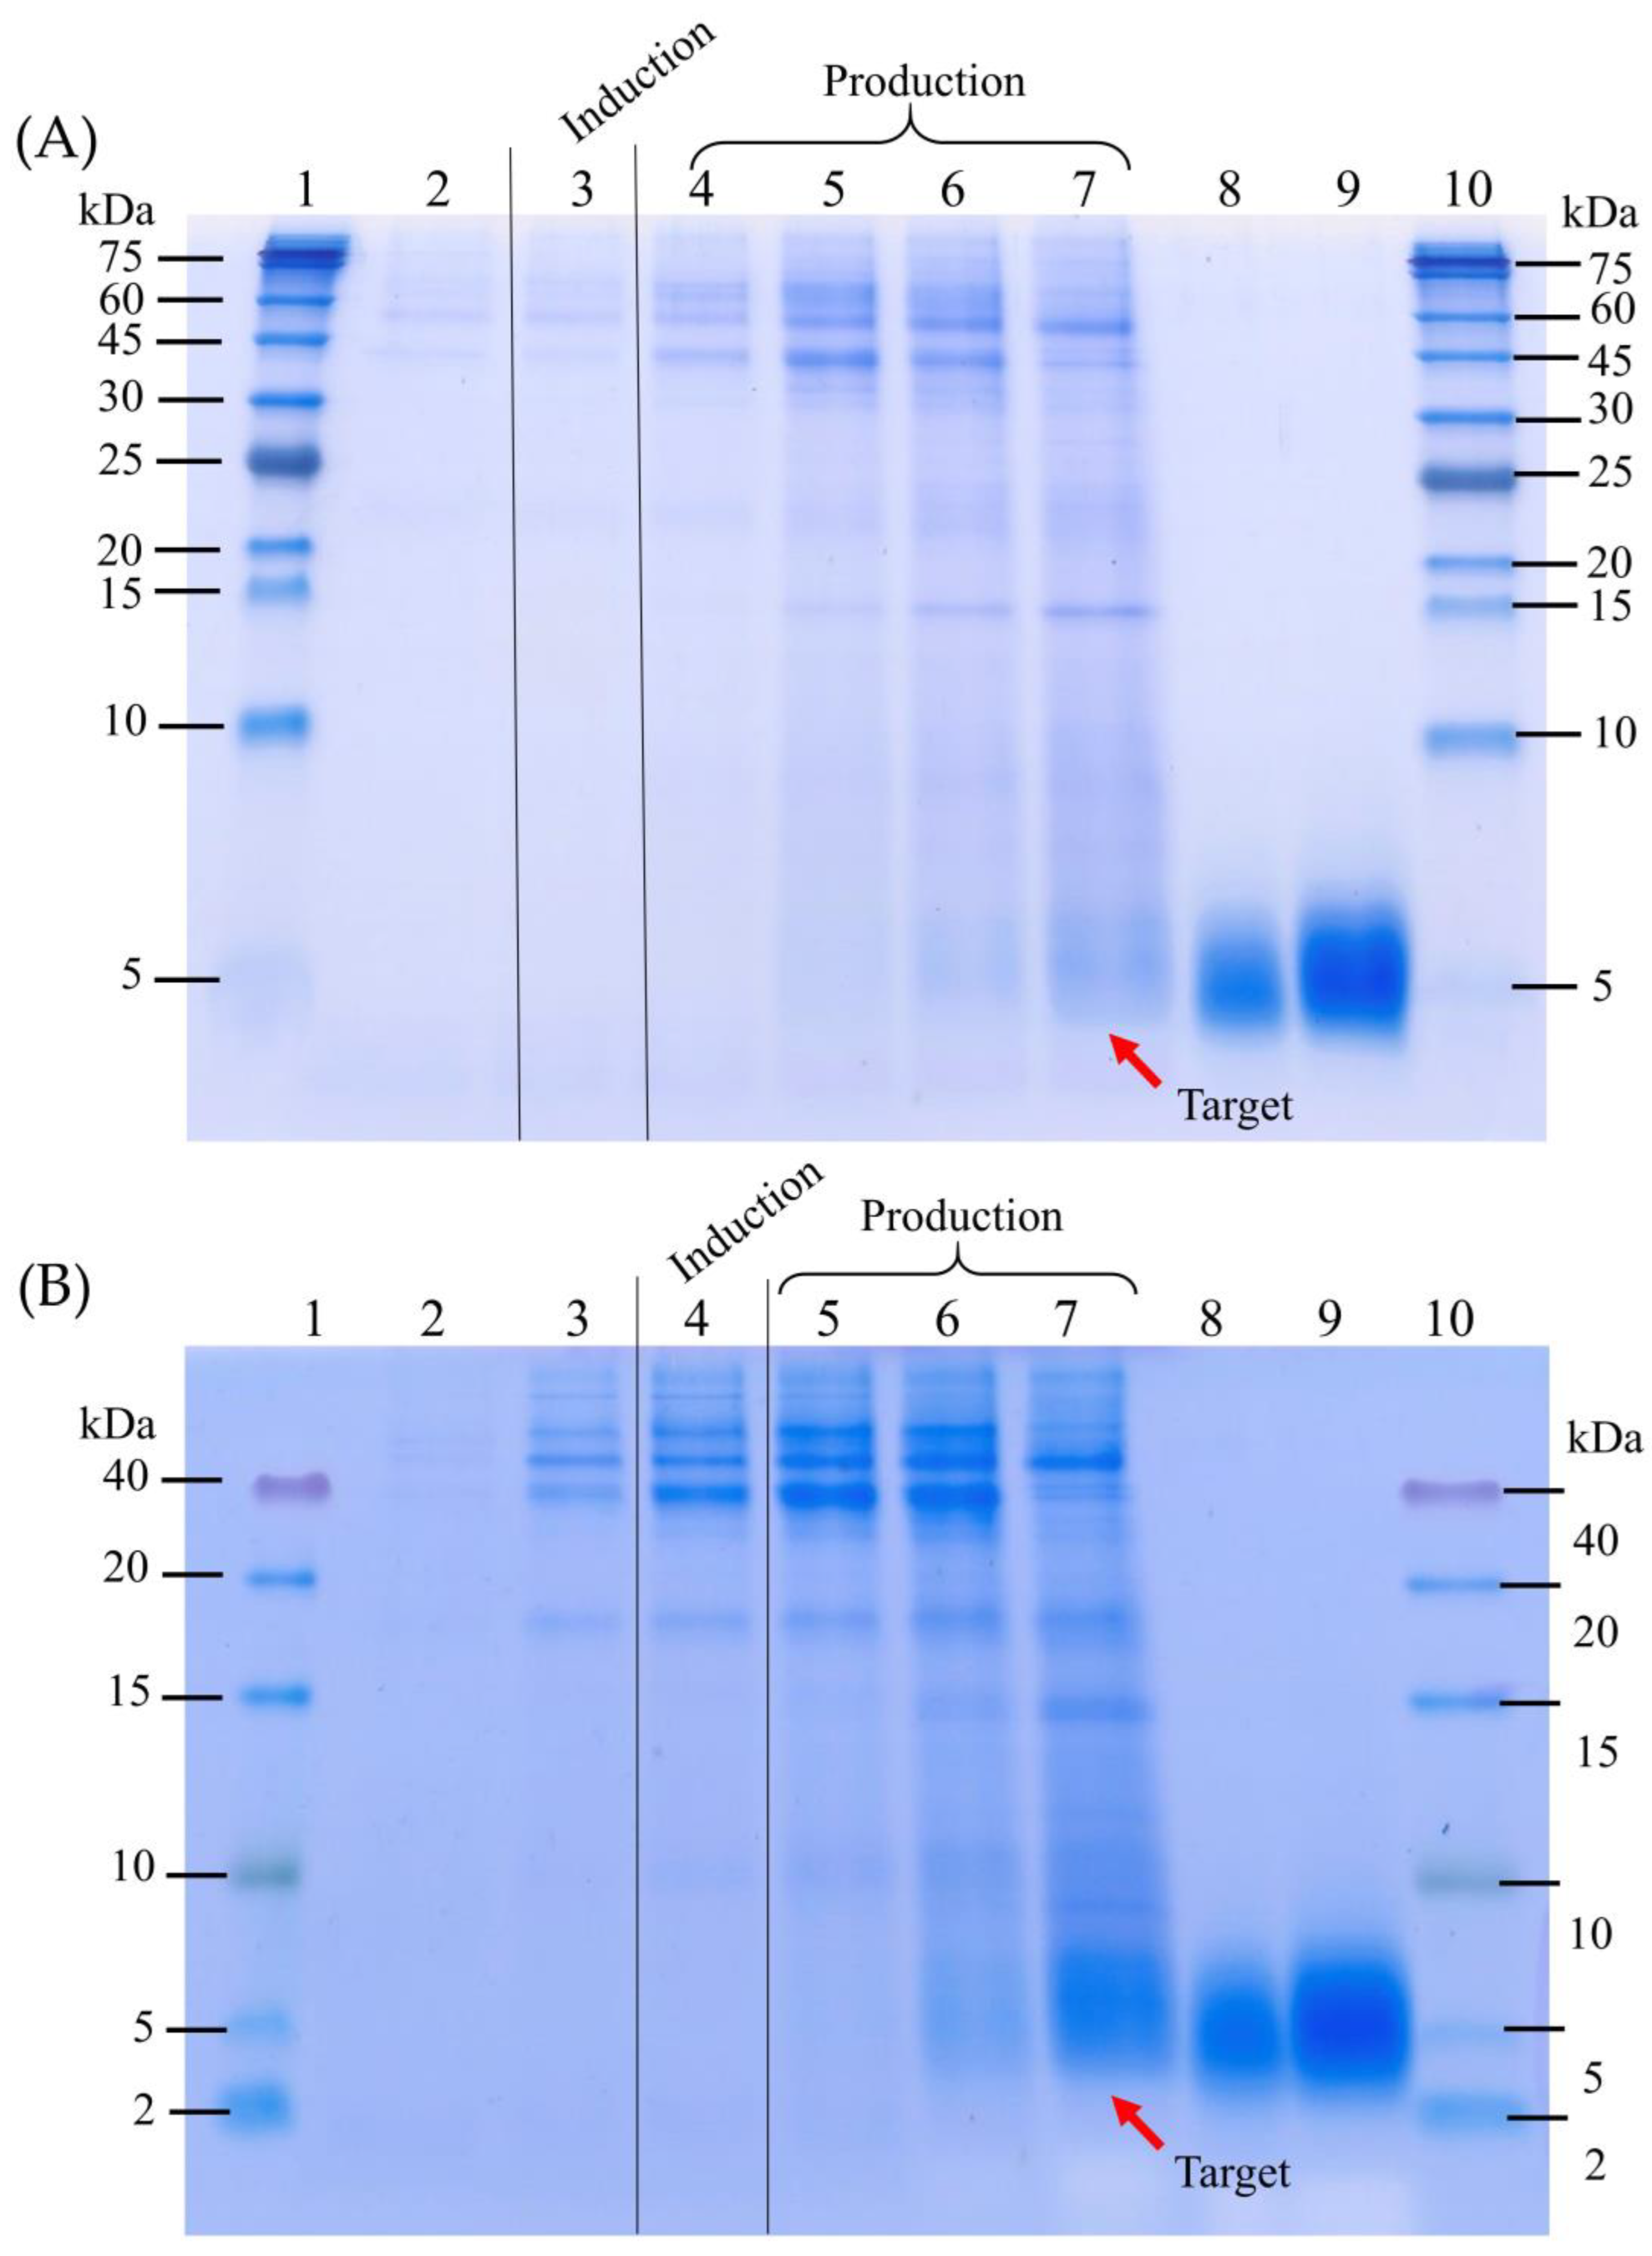
3.1. The Four-Stage Fermentation Process Versus the Improved Fermentation Process for the CAP2 Candidate Production

The four-stage process and improved fermentation processes were compared by applying them to the production of the CAP2 candidate, utilizing the same host cell, the P. pastoris Muts strain under the pAOX1. The four-stage fermentation process profile is shown in Figure 1A, while the improved fermentation process profile is shown in Figure 1B,C. Figure 1B depicts the whole process of the improved fermentation process profile, while Figure 1C displays a zoomed-in view of the improved fermentation process profile during the early and late glycerol fed-batch stages, the early and late induction stages, and the production stage. The fermentation parameters of the four-stage and improved fermentation processes are shown in Table 1.
At the end of the glycerol batch stage, the DOT, DCW, total protein, specific growth rate, and batch time of the four-stage and improved fermentation processes were similar (Figure 1A,B). The similarity of these parameters was due to the same clone of P. pastoris CAP2 used. In the glycerol fed-batch stage of the four-stage fermentation process, 0.27 L of the GF medium was added using the exponential feed strategy, resulting in a dramatic increase in the DCW (Figure 1A). The same amount of GF medium was added in the early glycerol fed-batch stage of the improved fermentation process using the exponential feed strategy, resulting in a dramatic increase in the DCW, and the DCW was continually dramatically increasing in the late glycerol fed-batch stage due to the addition of 0.98 L of GF medium using the DOT stat feeding strategy (Figure 1C). The oxygen limitation concern during the doubling of the DCW (from 40 g/L to 80 g/L) of the improved fermentation process prior to the induction stage was avoided by the combination of the exponential and DOT stat feeding strategies used. The exponential feed strategy provides rapid cell growth [5,8,9,19], while the DOT stat feeding strategy prevents oxygen limitation [10,25].
During the glycerol fed-batch stage of both fermentation processes, the total protein was slightly increased. The tricine SDS-PAGE results of the culture supernatant from the four-stage and improved fermentation processes showed that, at the end of the glycerol fed-batch stage of both processes, a few contaminant bands appeared in the gels (Figure 2A,B). These protein contaminants were observed at a higher concentration in the improved fermentation process, which correlated with the 2.3-fold higher DCW observed in this process. This observation supports the previous study by Kastilan et al. (2017) [18], showing that some contaminant proteins accumulated during the glycerol fed-batch stage and accumulated at higher concentrations at higher cell densities. As a result, even without recombinant peptide accumulation in the culture medium at this point, the total protein was still marginally growing (Figure 1A,B).
The induction stage was initiated by adding MF medium when the DOT signal immediately increased at the end of the glycerol fed-batch stage, indicating glycerol depletion in a fermenter. The DOT signal, at this point, is a critical parameter to indicate the response of the cell to methanol [5,7,8,9]. The results of the methanol induction stage of the four-stage fermentation process showed that a long methanol induction was observed and the response of the DOT signal, which was used as a signal to indicate the presence or absence of methanol in the fermenter, was slow, resulting in the difficult and time-consuming control of the MF medium addition in the next stage (Figure 1A). In the production stage of the four-stage fermentation process, the DOT set point was at 57–63% air saturation, and the set point could not be lowered. This occurred because the volumetric methanol consumption rate was low, resulting in only 1.29 L of MF medium being added. At the end of this stage, the DCW, total protein, and CAP2 concentrations were 73.67 ± 3.46 g/L, 1.66 ± 0.06 g/L, and 0.59 ± 0.03 g/L, respectively (Figure 1A and Table 1). Despite the fact that using the DOT stat feeding method to control the addition of MF medium during the production stage could circumvent oxygen limitations, total methanol consumption was deemed low. Some reports showed that an increased methanol addition led to higher recombinant protein expression levels [5,29].
The induction stage of the improved fermentation process was divided into two minor stages, the early and late induction stages (Figure 1C). In the early induction stage, the operation was carried out in the same manner as the induction stage of the four-stage fermentation process. Following the instant increase in the DOT signal at the end of the early induction stage, the late induction was initiated by deploying the DOT stat feeding strategy to control the addition of MF medium. At this point, the DOT signal was decreased from 60 to 20% air saturation and was maintained at 20–25% air saturation (Figure 1C). The two minor stages of the induction stage were carried out within 6 h, and then the production stage was initiated by maintaining the DOT signal at 20–25% air saturation continuously for 72 h, resulting in the addition of 2.14 L of MF medium. At the end of the production stage, the DCW, total protein, and CAP2 concentrations were 100.42 ± 5.83 g/L, 2.74 ± 0.05 g/L, and 1.45 ± 0.03 g/L, respectively (Figure 1B and Table 1).
The increase in the volumetric methanol consumption rate achieved by increasing the cell concentration prior to the methanol induction stage in the improved fermentation process allowed for a quicker response and more convenient control of the DOT signal in the induction and production stages than in the four-stage fermentation process (Figure 1A,B). Even with a high cell density in the improved fermentation process, there were no oxygen limitations in the induction and production stages. This was because the DOT stat feeding control strategy [25] limited the amount of methanol. Because of the increased volumetric methanol consumption rate, the total MF medium consumption of the improved fermentation process was 1.66 times higher than that of the four-stage fermentation process, resulting in a CAP2 concentration that was 2.46 times higher than the four-stage fermentation process (Table 1). This result was consistent with those previously reported [5,20,29]; a higher total methanol consumption led to higher recombinant protein yields. In the methanol induction and production stages of the four-stage fermentation process, the cell concentration increased by 36.57 g/L, which was 2.37 times higher than in the improved fermentation process (15.40 g/L) (Table 1). This result was consistent with those previously reported by Charoenrat et al. (2015) [5] and Wang et al. (2009) [20], where increased cell concentration before the methanol steps resulted in higher recombinant protein production due to the limited space in high-cell-density cultivation. With a high initial cell concentration, a lower percentage of methanol assimilation into biomass was obtained, while methanol was oxidized to obtain the required energy for recombinant protein production [20]. Therefore, the higher CAP2 productivity in the improved fermentation process than in the four-stage fermentation process was due to the initial cell concentration before the methanol stages.
For the comparison of the overall productivity between the four-stage and improved fermentation processes, productivity was deployed [30]. The productivity of the improved fermentation process was 13.59 ± 0.24 mg/L·h, which was 2.21 times higher than the four-stage fermentation process (Table 1). Therefore, the improved fermentation process has an advantage in terms of productivity over the four-stage fermentation process. However, there are some concerns to consider. The first concern is that the protein impurity bands observed in the SDS-PAGE of the improved fermentation process (Figure 2B) were higher than those observed in the four-stage fermentation process (Figure 2A). This observation supports the previous reports that, in addition to the higher cell concentrations prior to the methanol stages, higher methanol consumption also resulted in higher protein impurities [18,29]. The second concern is that during the methanol stages, the culture supernatants of both fermentation processes developed green-yellow components, but the supernatant of the developed fermentation process developed more dark green-yellow components than the four-stage fermentation process. These green-yellow components may, in some cases, interfere with downstream processing [31]. The improved fermentation process, however, would be beneficial for expressing proteins, particularly short-chain peptides that are difficult to express.

3.2. Validation of the Improved Fermentation Process by Expressing the CAP3 Candidate Using the P. pastoris Muts Strain

Even when the same strain of host cells is used to express different peptides, the fermentation profiles may be different [21,32]. The improved fermentation process was validated in this study by expressing the CAP3 candidate in the same strain host, ensuring that the process could be appropriately used to produce additional peptides.
The fermentation profile of the CAP3 candidate production is shown in Figure 3A. As a result, at the end of the glycerol batch stage, the DCW and specific growth rate were similar to those in the four-stage and improved fermentation processes (Figure 1A,B and Figure 3A and Table 1). Furthermore, the improved fermentation process could force the growth of the cell to 84.07 ± 2.21 g/L prior to the methanol induction stage (Table 1 and Figure 3A). Furthermore, smooth induction was also obtained in the methanol induction stage of the CAP3 fermentation profile (Figure 3A). In the production stage, the DOT set point was controlled at 20–25% air saturation, resulting in the addition of 1.82 L of MF medium. Note that no oxygen limitations were observed in the CAP3 fermentation profile.
During the methanol induction and production stages (Figure 3A), the DCW steadily increased, while the total protein and target peptide observed in the gel (Figure 3B) gradually increased. The relatively constant cell concentrations improved the recombinant peptide expression through the improved fermentation process, and supported the hypothesis that by increasing cell concentrations closer to the saturation point of the cell density prior to the methanol induction stage, recombinant peptide concentrations can be improved [5,20].
The tricine SDS-PAGE result is shown in Figure 3B. A band of the expected size for the CAP3 candidate was observed after 48 h of the production stage and this increased to 3.96 ± 0.02 g/L at the end of the process, giving a CAP3 content of 0.91 ± 0.01 g/g (Table 1). However, although high CAP3 productivity was obtained (Table 1), high levels of protein contaminants were also observed in the gel (Figure 3B). The supernatant also developed green-yellow components during the CAP3 candidate production, which was caused by the expression of the recombinant protein under pAOX [29,31]. Therefore, the clarification process will be established in the next study to avoid this disadvantage.
Taken together, the improved fermentation process could be used to express the CAP3 candidate with high productivity in the P. pastoris Muts strain without any further optimization.

4. Conclusions

The four-stage fermentation process was used to express the CAP2 candidate in P. pastoris KM71H. The results showed that this process could express the CAP2 candidate, giving 6.15 ± 0.21 mg/L·h of productivity. However, we could control the DOT signal only at 57–63% air saturation in the production stage because of the low volumetric methanol consumption rate, resulting in 1.29 L of MF medium consumption. Therefore, the four-stage fermentation process was improved by increasing the cell concentration to approximately 80 g/L at the end of the glycerol fed-batch stage, which was two times higher than the four-stage fermentation process using the exponential and DOT stat feeding control strategies to control the addition of the GF medium. The DOT stat feeding control strategy was also used in the induction and production stages to control the addition of the MF medium. The DOT signal of the improved fermentation process could be controlled at 20–25% air saturation, resulting in 2.14 L of MF medium consumption and 13.59 ± 0.24 mg/L·h of productivity, which were 1.66 and 2.21 times higher than those in the four-stage fermentation process, respectively. Note that oxygen limitations, which normally occur during high-cell-density fermentation, were avoided by the substrate addition strategies used.
The improved fermentation process was validated by expressing the CAP3 candidate using the same host, resulting in 3.96 ± 0.02 g/L of CAP3 without any further optimization. Therefore, we anticipate that this improved fermentation process could potentially be used to express other peptides, especially short-chain peptides.
In future research, we are going to use this improved fermentation process to produce other recombinant peptides to show that it can be used as a guideline for recombinant peptide expression. We are also going to develop a clarification process to remove the green-yellow components produced and accumulated in the culture supernatant during recombinant peptide expression in the P. pastoris expression system under pAOX, which is one of the problems with the improved fermentation process.

Author Contributions

Conceptualization, C.K., S.P. and T.C.; methodology, C.K., S.C., S.S. and T.C.; validation, S.C., C.P., W.K. and S.P.; formal analysis, C.K. and T.C.; investigation, S.P., W.K. and T.L.; resources, V.B., S.S. and T.C.; data curation, C.K., S.C. and T.L.; writing—original draft preparation, C.K. and T.C.; writing—review and editing, C.K., C.P., T.L. and T.C.; visualization, C.K., K.A., T.L. and T.C.; supervision, T.C.; project administration, V.B. and T.C.; funding acquisition, V.B., T.C., S.S. and K.A. All authors have read and agreed to the published version of the manuscript.

Funding

This research was supported by the Agricultural Research Development Agency, Thailand (Grant number CRP6305032110). C.K. was supported by the Scholarship for Talented Students to Study Graduate Program in the Faculty of Science and Technology at Thammasat University, Contract No. TB 7/2563.

Institutional Review Board Statement

Not applicable.

Informed Consent Statement

Not applicable.

Data Availability Statement

The data presented in this study are available upon request from the corresponding author because of their usage in the ongoing study.

Acknowledgments

The contribution of Anthony Keith Thompson (a visiting professor at the School of Food Industry, KMITL) in critically editing the manuscript is acknowledged.

Conflicts of Interest

The authors declare no conflict of interest.

Abbreviations

AOXalcohol oxidase
pAOX1alcohol oxidase one promoter
BSMbasal salt medium
CAP2cell-penetrating antimicrobial peptide 2
CAP3cell-penetrating antimicrobial peptide 3
DCWdry cell weight (g/L)
DOTdissolved oxygen tension (%)
Mutsmethanol utilization slow
Mut+methanol utilization plus
PTM1Pichia trace metal 1
GF glycerol feed
MFmethanol feed
ODoptical density
YPDyeast extract peptone dextrose
Ffeed rate (L/h)
V0initial volume (L)
X0initial cell concentration (g/L)
S0initial glycerol concentration in GF medium (g/L)
ttime (h)
Yx/sbiomass yield (g/g)
VFvolume of GF medium (L)
V0cinitial volume before the addition of GF medium (L)
X0cinitial cell density (g/L)
XFdesired cell density (g/L)
µmaxmaximum specific growth rate (h−1)
µsetdesired specific growth rate (h−1)

References

  1. Cregg, J.M.; Cereghino, J.L.; Shi, J.; Higgins, D.R. Recombinant protein expression in Pichia pastoris. Mol. Biotechnol. 2000, 16, 23–52. [Google Scholar] [CrossRef] [PubMed]
  2. Karbalaei, M.; Rezaee, S.A.; Farsiani, H. Pichia pastoris: A highly successful expression system for optimal synthesis of heterologous proteins. J. Cell. Physiol. 2020, 235, 5867–5881. [Google Scholar] [CrossRef] [PubMed]
  3. Macauley-Patrick, S.; Fazenda, M.L.; McNeil, B.; Harvey, L.M. Heterologous protein production using the Pichia pastoris expression system. Yeast 2005, 22, 249–270. [Google Scholar] [CrossRef]
  4. Carneiro, C.V.; Serra, L.A.; Pacheco, T.F.; Ferreira, L.M.; Brandão, L.T.; Freitas, M.N.; Trichez, D.; Almeida, J.R. Advances in Komagataella phaffii engineering for the production of renewable chemicals and proteins. Fermentation 2022, 8, 575. [Google Scholar] [CrossRef]
  5. Charoenrat, T.; Sangprapai, K.; Promdonkoy, P.; Kocharin, K.; Tanapongpipat, S.; Roongsawang, N. Enhancement of thermostable β-glucosidase production in a slow methanol utilization strain of Pichia pastoris by optimization of the specific methanol supply rate. Biotechnol. Bioprocess Eng. 2015, 20, 315–323. [Google Scholar] [CrossRef]
  6. Charoenrat, T.; Ketudat-Cairns, M.; Jahic, M.; Veide, A.; Enfors, S.-O. Increased total air pressure versus oxygen limitation for enhanced oxygen transfer and product formation in a Pichia pastoris recombinant protein process. Biochem. Eng. J. 2006, 30, 205–211. [Google Scholar] [CrossRef]
  7. Charoenrat, T.; Ketudat-Cairns, M.; Stendahl-Andersen, H.; Jahic, M.; Enfors, S.O. Oxygen-limited fed-batch process: An alternative control for Pichia pastoris recombinant protein processes. Bioprocess Biosyst. Eng. 2005, 27, 399–406. [Google Scholar] [CrossRef] [PubMed]
  8. Charoenrat, T.; Khumruaengsri, N.; Promdonkoy, P.; Rattanaphan, N.; Eurwilaichitr, L.; Tanapongpipat, S.; Roongsawang, N. Improvement of recombinant endoglucanase produced in Pichia pastoris KM71 through the use of synthetic medium for inoculum and pH control of proteolysis. J. Biosci. Bioeng. 2013, 116, 193–198. [Google Scholar] [CrossRef] [PubMed]
  9. Jahic, M.; Rotticci-Mulder, J.; Martinelle, M.; Hult, K.; Enfors, S.O. Modeling of growth and energy metabolism of Pichia pastoris producing a fusion protein. Bioprocess Biosyst. Eng. 2002, 24, 385–393. [Google Scholar] [CrossRef]
  10. Liu, W.C.; Inwood, S.; Gong, T.; Sharma, A.; Yu, L.Y.; Zhu, P. Fed-batch high-cell-density fermentation strategies for Pichia pastoris growth and production. Crit. Rev. Biotechnol. 2019, 39, 258–271. [Google Scholar] [CrossRef]
  11. Theron, C.W.; Berrios, J.; Steels, S.; Telek, S.; Lecler, R.; Rodriguez, C.; Fickers, P. Expression of recombinant enhanced green fluorescent protein provides insight into foreign gene-expression differences between Mut+ and MutS strains of Pichia pastoris. Yeast 2019, 36, 285–296. [Google Scholar] [CrossRef]
  12. Ascacio-Martínez, J.A.; Barrera-Saldaña, H.A. Production and secretion of biologically active recombinant canine growth hormone by Pichia pastoris. Gene 2004, 340, 261–266. [Google Scholar] [CrossRef]
  13. Bredell, H.; Smith, J.J.; Görgens, J.F.; van Zyl, W.H. Expression of unique chimeric human papilloma virus type 16 (HPV-16) L1-L2 proteins in Pichia pastoris and Hansenula polymorpha. Yeast 2018, 35, 519–529. [Google Scholar] [CrossRef] [PubMed] [Green Version]
  14. Cos, O.; Serrano, A.; Montesinos, J.L.; Ferrer, P.; Cregg, J.M.; Valero, F. Combined effect of the methanol utilization (Mut) phenotype and gene dosage on recombinant protein production in Pichia pastoris fed-batch cultures. J. Biotechnol. 2005, 116, 321–335. [Google Scholar] [CrossRef] [PubMed]
  15. Krainer, F.W.; Dietzsch, C.; Hajek, T.; Herwig, C.; Spadiut, O.; Glieder, A. Recombinant protein expression in Pichia pastoris strains with an engineered methanol utilization pathway. Microb. Cell Factories 2012, 11, 22. [Google Scholar] [CrossRef] [PubMed] [Green Version]
  16. Schotte, P.; Dewerte, I.; De Groeve, M.; De Keyser, S.; De Brabandere, V.; Stanssens, P. Pichia pastoris MutS strains are prone to misincorporation of O-methyl-l-homoserine at methionine residues when methanol is used as the sole carbon source. Microb. Cell Factories 2016, 15, 98. [Google Scholar] [CrossRef] [Green Version]
  17. Vandermies, M.; Fickers, P. Bioreactor-scale strategies for the production of recombinant protein in the yeast Yarrowia lipolytica. Microorganisms 2019, 7, 40. [Google Scholar] [CrossRef] [Green Version]
  18. Kastilan, R.; Boes, A.; Spiegel, H.; Voepel, N.; Chudobová, I.; Hellwig, S.; Buyel, J.F.; Reimann, A.; Fischer, R. Improvement of a fermentation process for the production of two PfAMA1-DiCo-based malaria vaccine candidates in Pichia pastoris. Sci. Rep. 2017, 7, 11991. [Google Scholar] [CrossRef] [Green Version]
  19. Cregg, J.M.; Cregg, J.M. Pichia Protocols, 2nd ed.; Humana Press: Totowa, NJ, USA, 2007. [Google Scholar]
  20. Wang, Y.; Wang, Z.; Du, G.; Hua, Z.; Liu, L.; Li, J.; Chen, J. Enhancement of alkaline polygalacturonate lyase production in recombinant Pichia pastoris according to the ratio of methanol to cell concentration. Bioresour. Technol. 2009, 100, 1343–1349. [Google Scholar] [CrossRef]
  21. Cos, O.; Ramón, R.; Montesinos, J.L.; Valero, F. Operational strategies, monitoring and control of heterologous protein production in the methylotrophic yeast Pichia pastoris under different promoters: A review. Microb. Cell Factories 2006, 5, 17. [Google Scholar] [CrossRef] [Green Version]
  22. Ponnappan, N.; Budagavi, D.P.; Chugh, A. CyLoP-1: Membrane-active peptide with cell-penetrating and antimicrobial properties. Biochim. Et Biophys. Acta. Biomembr. 2017, 1859, 167–176. [Google Scholar] [CrossRef]
  23. Mohamed, M.F.; Seleem, M.N. Efficacy of short novel antimicrobial and anti-inflammatory peptides in a mouse model of methicillin-resistant Staphylococcus aureus (MRSA) skin infection. Drug Des. Dev. Ther. 2014, 8, 1979–1983. [Google Scholar] [CrossRef] [Green Version]
  24. Seefeldt, A.C.; Graf, M.; Pérébaskine, N.; Nguyen, F.; Arenz, S.; Mardirossian, M.; Scocchi, M.; Wilson, D.N.; Innis, C.A. Structure of the mammalian antimicrobial peptide Bac7(1-16) bound within the exit tunnel of a bacterial ribosome. Nucleic Acids Res. 2016, 44, 2429–2438. [Google Scholar] [CrossRef] [PubMed] [Green Version]
  25. Charoenrat, T.; Antimanon, S.; Kocharin, K.; Tanapongpipat, S.; Roongsawang, N. High cell density process for constitutive production of a recombinant phytase in thermotolerant methylotrophic yeast Ogataea thermomethanolica using table sugar as carbon source. Appl. Biochem. Biotechnol. 2016, 180, 1618–1634. [Google Scholar] [CrossRef]
  26. Lowry, O.H.; Rosebrough, N.J.; Farr, A.L.; Randall, R.J. Protein measurement with the Folin phenol reagent. J. Biol. Chem. 1951, 193, 265–275. [Google Scholar] [CrossRef] [PubMed]
  27. Schägger, H. Tricine–SDS-PAGE. Nat. Protoc. 2006, 1, 16–22. [Google Scholar] [CrossRef]
  28. Alonso Villela, S.M.; Kraïem, H.; Bouhaouala-Zahar, B.; Bideaux, C.; Aceves Lara, C.A.; Fillaudeau, L. A protocol for recombinant protein quantification by densitometry. MicrobiologyOpen 2020, 9, 1175–1182. [Google Scholar] [CrossRef] [PubMed] [Green Version]
  29. Damasceno, L.M.; Pla, I.; Chang, H.J.; Cohen, L.; Ritter, G.; Old, L.J.; Batt, C.A. An optimized fermentation process for high-level production of a single-chain Fv antibody fragment in Pichia pastoris. Protein Expr. Purif. 2004, 37, 18–26. [Google Scholar] [CrossRef]
  30. Bausch, M.; Schultheiss, C.; Sieck, J.B. Recommendations for comparison of productivity between fed-batch and perfusion processes. Biotechnol. J. 2019, 14, e1700721. [Google Scholar] [CrossRef] [PubMed] [Green Version]
  31. Hao, J.; Xu, L.; He, H.; Du, X.; Jia, L. High-level expression of Staphylococcal Protein A in Pichia pastoris and purification and characterization of the recombinant protein. Protein Expr. Purif. 2013, 90, 178–185. [Google Scholar] [CrossRef] [PubMed]
  32. Hohenblum, H.; Gasser, B.; Maurer, M.; Borth, N.; Mattanovich, D. Effects of gene dosage, promoters, and substrates on unfolded protein stress of recombinant Pichia pastoris. Biotechnol. Bioeng. 2004, 85, 367–375. [Google Scholar] [CrossRef] [PubMed]
Figure 1. Fermentation profiles of the CAP2 candidate production in P. pastoris KM71H using the four-stage (A) and improved fermentation processes (B,C). (A) DCW, DOT, MF medium feed, and total protein profiles of the four-stage fermentation process (process time = 95.17 h). (B) DCW, DOT, MF medium feed, and total protein profiles of the improved fermentation process (process time: 106.88 h). (C) GF medium feed, DOT, and DCW profiles during the early and late glycerol fed-batch stages, the early and late induction stages, and the production stage of the improved fermentation process. Error bars indicate the standard deviation of technical triplicates.
Fermentation 09 00277 g001
Figure 2. Tricine SDS-PAGE analysis of the culture supernatant from the expression of the CAP2 candidate utilizing the four-stage fermentation process (A) and the improved fermentation process (B). (A) The samples in lanes 1 and 10 were protein molecular weight markers; lane 2 was the finished glycerol fed-batch stage; lane 3 was the finished methanol induction stage; lanes 4, 5, 6, and 7 were 16, 40, 50, and 65 h of the production stage, respectively; lanes 8 and 9 were 1.76 and 3.52 g/L of the CAP2, respectively. (B) The samples in lanes 1 and 10 were protein molecular weight markers; lane 2 was the finished glycerol batch stage; lane 3 was the finished glycerol fed-batch stage; lane 4 was the finished methanol induction stage; lanes 5, 6, and 7 were 24, 48, and 72 h of the production stage, respectively; lanes 8 and 9 were 1.76 and 3.52 g/L of the CAP2, respectively. The arrows represent the target peptide CAP2 (≈4.1 kDa).
Fermentation 09 00277 g002
Figure 3. (A) DCW, DOT, MF medium feed, and total protein profiles during the improved fermentation process of the CAP3 candidate production (process time = 108.95 h). Error bars indicate the standard deviation of the technical triplicates. (B) Tricine SDS-PAGE analysis of the culture supernatant from the expression of the CAP3 candidate utilizing the improved fermentation process. The samples in lanes 1 and 10 were molecular weight markers; lane 2 was the finished glycerol batch stage; lane 3 was the finished glycerol fed-batch stage; lane 4 was the finished methanol induction stage; lanes 5, 6, and 7 were 24, 48, and 72 h of the production stage, respectively; lanes 8 and 9 were 1.76 and 3.52 g/L of the CAP2, respectively. The arrow represents the target peptide CAP3 (≈4.3 kDa).
Fermentation 09 00277 g003
Table 1. Comparison of the fermentation parameters between the four-stage fermentation process and the improved fermentation process.
ParameterFour-Stage Fermentation ProcessImproved Fermentation Process
CAP2CAP2CAP3
Specific growth rate (h−1)0.30 ± 010.29 ± 0.020.27 ± 0.02
DCW after glycerol batch stage (g/L)19.0 ± 0.0718.67 ± 0.1220.62 ± 0.27
DCW after glycerol fed-batch stage (g/L)37.10 ± 1.1585.02 ± 5.7384.07 ± 2.21
Final DCW (g/L)73.67 ± 3.46100.42 ± 5.83109.84 ± 4.80
Total protein concentration (g/L)1.66 ± 0.062.74 ± 0.054.35 ± 0.05
Target peptide concentration (g/L)0.59 ± 0.031.45 ± 0.033.96 ± 0.02
Target peptide content (g/g)0.35 ± 0.000.53 ± 0.020.91 ± 0.01
Productivity (mg/L·h)6.15 ± 0.2113.59 ± 0.2436.38 ± 0.19
Note: The specific growth rates were calculated from DCW data obtained during the logarithmic growth phase of the glycerol batch stage.
Disclaimer/Publisher’s Note: The statements, opinions and data contained in all publications are solely those of the individual author(s) and contributor(s) and not of MDPI and/or the editor(s). MDPI and/or the editor(s) disclaim responsibility for any injury to people or property resulting from any ideas, methods, instructions or products referred to in the content.

