Article

Machine Learning Models Using Data Mining for Biomass Production from Yarrowia lipolytica Fermentation

by
Nattha Pensupa
1,
Treesukon Treebuppachartsakul
2 and
Suejit Pechprasarn
3,*
1
Department of Agro-Industry, Naresuan University, Phitsanulok 65000, Thailand
2
Department of Biomedical Engineering, School of Engineering, King Mongkut’s Institute of Technology Ladkrabang, Bangkok 10520, Thailand
3
College of Biomedical Engineering, Rangsit University, Pathum Thani 12000, Thailand
*
Author to whom correspondence should be addressed.
Fermentation 2023, 9(3), 239; https://doi.org/10.3390/fermentation9030239
Submission received: 1 February 2023 / Revised: 24 February 2023 / Accepted: 25 February 2023 / Published: 1 March 2023
(This article belongs to the Section Industrial Fermentation)

Abstract

:
In this paper, a database of biomass production from Yarrowia lipolytica fermentation is prepared and constructed using machine learning and data mining approaches. The database is curated from 15 publications and consists of 301 rows of data with 25 predictors and 1 label. The predictors include inoculum size, temperature, pH, and time, while the label is the corresponding biomass production. The database is then divided into training, validation, and test datasets and analyzed as a supervised machine learning task for regression. Twenty-six regression models are employed and compared for their performance in predicting biomass production. The best-performing model is the Matern 5/2 Gaussian process regression model, which has the lowest root-mean-squared error of 0.75 g/L, the highest R squared of 0.90, and the lowest mean absolute error of 0.52 g/L. The t-test is used to identify the most important predictors, and 14 predictors are sufficient for creating an accurate model. These 14 predictors are fermentation time, peptone, temperature, total Kjeldahl nitrogen, shaking rate, total nitrogen, inoculum size, yeast extract, crude glycerol, glucose, oil and grease, media pH, ammonium sulfate, and olive oil. This research demonstrates the application of machine learning and data mining to estimate biomass production and gives insight into which parameters are essential for Yarrowia lipolytica fermentation.

1. Introduction

A non-conventional yeast species called Yarrowia lipolytica (Y. lipolytica) has been thoroughly investigated for its potential biotechnological uses, including the production of biofuels, enzymes, and other high-value products [1]. Yeast is a potential option for transforming waste lipids into products with added value due to its ability to grow on various carbon sources, including vegetable oils and animal fats [2,3,4,5,6].
The ability of Y. lipolytica to accumulate large amounts of internal lipids, which can be turned into biofuels and other valuable chemicals, is one of its advantages over other microbes. In addition, yeast can create numerous additional substances, including omega-3 polyunsaturated fatty acid (3 PUFA), γ-decalactone, carotenoids, pigments, and enzymes [1,7,8,9].
The relationship between biomass production and the production of other valuable compounds in Y. lipolytica is complex and not fully understood. Fermentation conditions, such as temperature, pH, and the type and concentration of the carbon source, have been shown to affect biomass production and other valuable compounds [10,11,12]. Having the ability to estimate biomass production has several advantages. Examples include (1) Cost savings: A model that can accurately predict biomass output can be utilized to optimize fermentation conditions, hence, decreasing expenses associated with the overproduction or underproduction of biomass [5]. (2) Knowing the expected biomass production can optimize the use of resources, such as nutrients and energy, resulting in more efficient and sustainable production operations [13]. (3) Quality control: by predicting biomass production, manufacturers may better control the final product’s quality, ensuring it meets the standards and specifications [14]. (4) Scale-up: the ability to estimate biomass production can facilitate the industrialization of the laboratory fermentation process [13]. (5) Development of new products: knowing the expected biomass production can facilitate the development of new products or applications based on Y. lipolytica fermentation [13]. (6) The optimization of the manufacturing process: by being able to estimate biomass production, producers may optimize the process to create the appropriate amount of biomass, avoiding the need for human adjustments, which can be time-consuming and expensive. (7) By examining the data from the machine learning model, researchers can obtain a better knowledge of the factors that influence biomass generation, which can be utilized to design new strategies for improving the fermentation process in the future [13]. In summary, estimating biomass production can bring significant advantages, such as cost savings, efficiency improvements, quality control, and a better understanding of fermentation using Y. lipolytica.
The scientific literature has documented different fermentation conditions for the growth and synthesis of biomass and other valuable compounds by Y. lipolytica. Temperature, pH, and the type and concentration of the carbon source are among these factors [5]. The yeast grows in a temperature range of 20–34 °C and a pH range of 2–9 [15,16]. However, optimal growth of Y. lipolytica has been observed at temperatures between 28 and 30 °C, pH between 5 and 7, and with various carbon sources, including glucose, xylose, and vegetable oil [5,17]. In addition, the addition of nutrients, the use of varying agitation speeds, and the use of different inoculum sizes have been found to alter the growth and production of Y. lipolytica [18,19].
Despite the abundance of literature on the fermentation of Y. lipolytica, the conditions used in these studies vary widely, making it challenging to identify the key factors that affect biomass production. In addition, a few comprehensive databases or models can be used to predict biomass production under various fermentation conditions [20,21,22]. These challenges emphasize the need for a more thorough and systematic strategy to comprehend the elements that affect the growth and output of Y.lipolytica.
Previous studies have used machine learning techniques to predict and optimize the biomass production of Y. lipolytica. For example, Coşgun et al. [21] used a support vector machine to predict the biomass production, lipid content, and lipid production of Y. lipolytica. The study found that the C/N ratio and fermentation time was the most significant factor for biomass production, while the glucose concentration and pH influenced lipid accumulation in the cell. Another study by Czajka et al. [20] used knowledge mining, feature extraction, genome-scale modeling, and machine learning to create a model for predicting cell growth and compounds produced by Y. lipolytica. These studies have used similar techniques and data sets to the current research, but this paper aims to use a variety of machine learning models and employ feature selection using an f-test [23] to improve the accuracy and interpretability of the model. Additionally, this study will use a built-in optimizer in the MATLAB Regression Learner software to optimize the predictors for the highest biomass production.
In this study, we aim to address this gap in the literature by (1) integrating, combining, and converting different units reported from several papers reported in the literature to a database, (2) using machine learning models under Regression Learner in Matlab 2022b to analyze the collected database, (3) identifying and highlighting essential fermentation conditions and resources that affect the biomass production of Y.lipolytica, and (4) validating the model against values reported in the literature. To the best of the authors’ knowledge, this generalized model has never been reported in the literature.

2. Materials and Methods

The process flow of the paper is shown in Figure 1. This study is divided into 5 steps, including (1) data collection, curation, and unit conversion, (2) datasets preparation for the training dataset, validation dataset, and test dataset, (3) supervised learning for regression predicting biomass production, (4) model performance parameters calculation, and (5) important feature selection using f-test. The following subsections will provide a detailed methodology of the study.

2.1. Data Collection and Curation

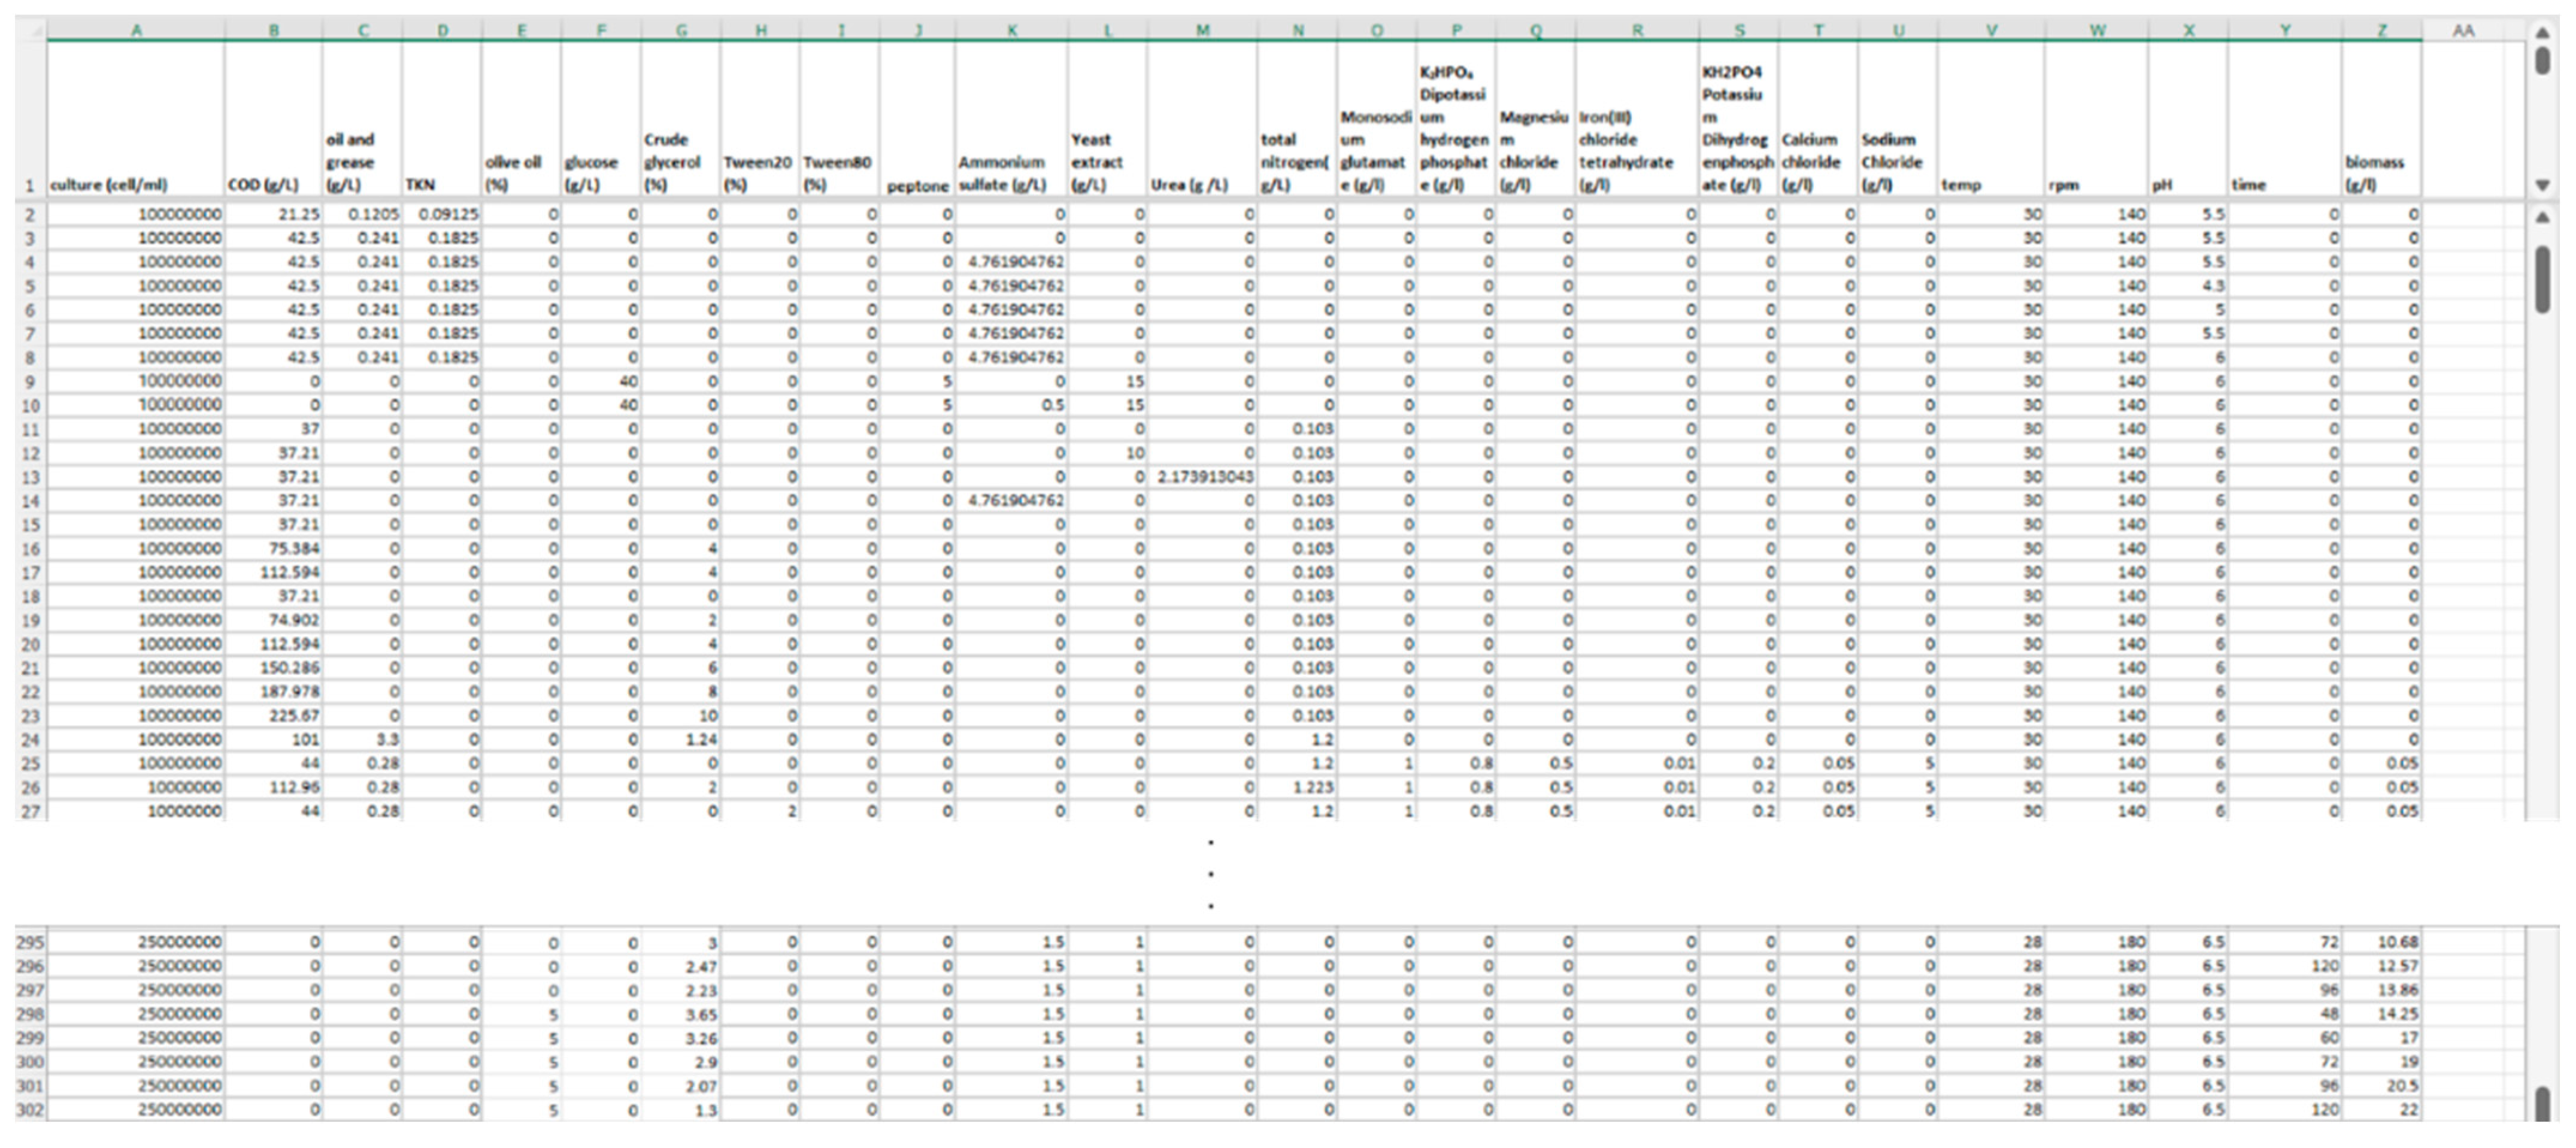
Firstly, we collected and formed a table from the 15 publications referenced herein [24,25,26,27,28,29,30,31,32,33,34,35,36,37,38]. These data can be summarized by converting them to the same units for data curation, as shown in Figure 2. All the information regarding the combined dataset, including the relevant references, can be found in the Supplementary Table S1, submitted as an additional part of this manuscript covering the journal articles published from 2013 to 2020. The data were preprocessed by removing any missing or duplicate values, resulting in the remaining 301 rows of the combined data.
From the database, the following paragraph and Table 1 describe details of the predictors and the label for developing machine learning models.
Details of predictors for machine learning: (1) inoculum size (cell/mL), (2) COD (g/L), (3) oil and grease (g/L), (4) TKN, (5) olive oil (%), (6) glucose: C₆H₁₂O₆ (g/L), (7) crude glycerol (%), (8) Tween20 (%), (9) Tween80 (%), (10) peptone (g/L), (11) ammonium sulfate (g/L), (12) yeast extract (g/L), (13) Urea (g/L), (14) total nitrogen (g/L), (15) Monosodium glutamate: C₅H₈NO₄Na (g/L), (16) Di-potassium hydrogen phosphate: K₂HPO₄ (g/L), (17) magnesium chloride: MgCl2 (g/L), (18) Iron (III) chloride: FeCl3 (g/L), (19) Potassium di-hydrogen phosphate: KH2PO4 (g/L), (20) Calcium chloride: CaCl2 (g/L), (21) Sodium chloride: NaCl (g/L), (22) temperature (°C), (23) shaking rate (rpm), (24) pH, (25) time (h).
Response (label): (26) biomass (g/L).

2.2. Supervised Learning for Regression Predicting Biomass Production

We employed machine learning models in MATLAB Regression Learner under MATLAB 2022b, including linear regression model, stepwise linear regression model, decision tree model, support vector machine (SVM), ensemble model, Gaussian process model (GPR), neural networks, and kernel models. These models were then employed to perform regression tasks predicting the biomass production from Y. lipolytica fermentation at different conditions reported in the literature. Various models allow for selecting the best-performing model based on its accuracy and precision. All the training, validation, and testing were carried out using an Acer Nitro 7 laptop equipped with Intel® Core ™ i7-9750H CPU (2.60 GHz), 6 cores, 12 logical processors, 24 GB of RAM, and NVIDIA GeForce GTX 1660 Ti graphic processing unit (GPU).

2.3. Model Performance Parameters

Root-mean-square error (RMSE), R-squared value (R2), and mean-absolute-error (MAE) were used to compute the difference between the biomass production predicted from the models and the values reported in the literature. RMSE and MAE have commonly used evaluation metrics in regression problems; they measure the difference between the predicted and actual values. The parameter R2 is a good indicator of the model’s correlation. The 5-fold cross-validation method was employed to compute the model’s accuracy and precision. Cross-validation is a resampling method that allows for the estimation of the performance of a model on an independent dataset.

2.4. Training Dataset, Validation Dataset, and Test Dataset

The database formed, as explained in Section 2.1, was divided into 3 datasets: a training dataset for 80% (241 rows), a validation dataset for 10% (30 rows), and a test dataset for 10% (30 rows). The size of the training dataset, the validation dataset, and the test dataset chosen here are within standard data separation ratios of data science, which are at 70%:30% to 90%:10% depending on the amount of available data. The training dataset was employed to train all the regression models in the Regression Learner to compute the training RMSE. The validation and test datasets were then utilized to validate and evaluate the actual performance of unseen data by calculating the validation and test RMSE. The validation set allows for selecting the best-performing model based on its accuracy and precision on unseen data.

2.5. Feature Selection Using f-Test

The f-test is a statistical technique that can be applied for dimensionality reduction by identifying the essential predictors or principal components that explain the most variation in the data. Identifying the most critical predictors can help to reduce the number of predictors in the model and improve its interpretability. The p-value of the f-test was employed to identify crucial predictors that can contribute to the biomass production of the Y. lipolytica fermentation by including only parameters with a p-value greater than 0.05. The regression model with the lowest RMSE was trained using different numbers of predictors to determine how many factors and which factors are essential for predicting biomass production. Like Section 2.4, the simplified model was validated using the test dataset.

3. Results

3.1. Machine Learning Model Training Using All 25 Predictors

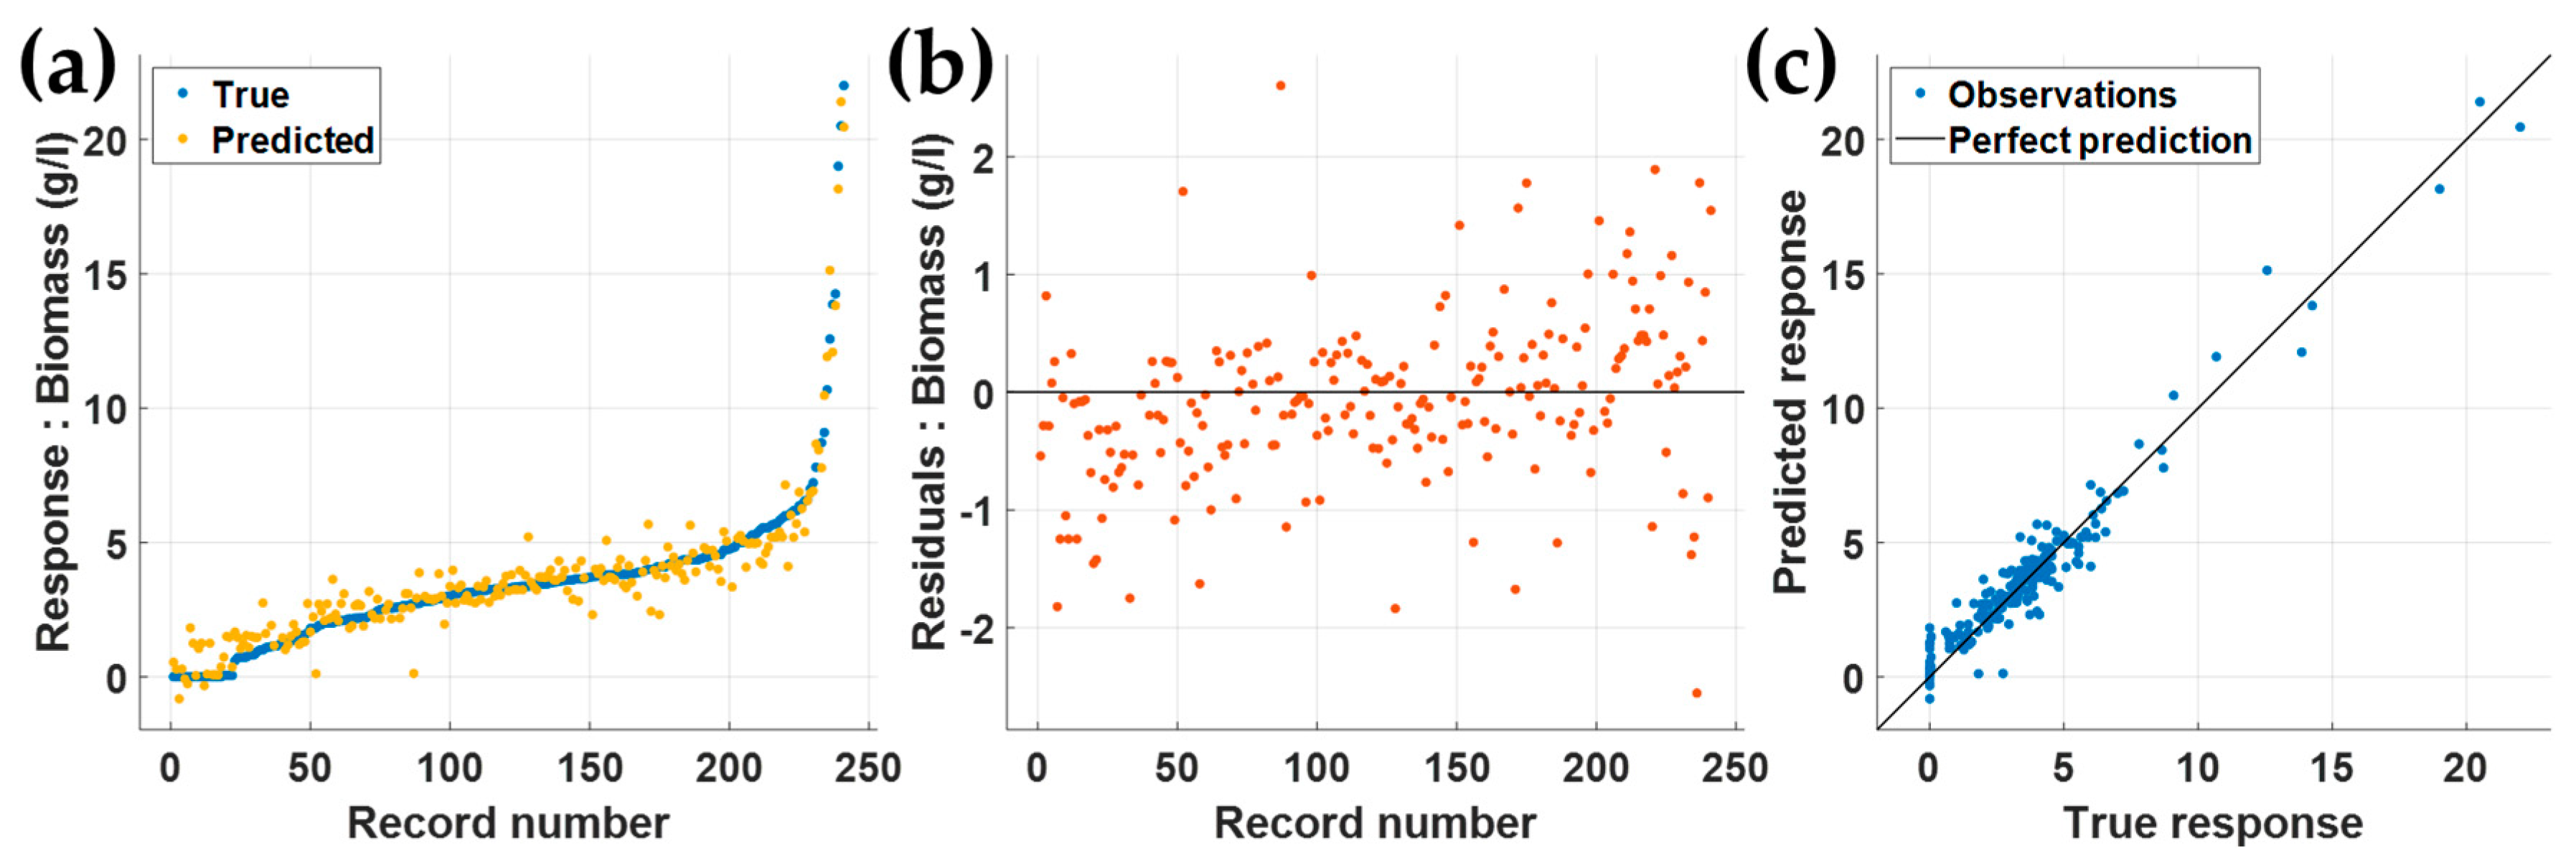
Table 2 shows RMSE, R2, and MAE values from 26 trained regression models using all 25 predictors, as explained in the materials and methods section. The Gaussian process regression (GPR) with Matern 5/2 GPR method had the lowest five-fold cross-validation RMSE of 0.72 g/L, the highest R2 of 0.94, and the lowest MAE of 0.52 g/L calculated by comparing the prediction accuracy of the predicted values against the training dataset, as shown in Figure 3a. The labels were arranged in ascending order to demonstrate, firstly, the discrepancies between the predicted values from the Matern 5/2 GPR model, and secondly, the labels are randomly distributed throughout the range of biomass production in this study. Residual error computed from the difference between the labels and the predicted values from the model is shown in Figure 3b. Figure 3c shows the predicted values against the training labels. They agree well for all the ranges, although the constructed database is a biased dataset, with most biomass data points corresponding to biomass concentrations below 7 g/L.

3.2. Validation and Testing Using the Separated 30 Rows

In this section, the separated validation dataset was then used to validate the performance of all trained models to predict some unseen data. Table 3 shows the average RMSE, average R2 of 0.86, and average MAE were obtained by taking the average values between Table 2 and the RMSE, R2, and MAE when the validation dataset was employed to evaluate the performance of the model by predicting the biomass production using the validation dataset and comparing them to their known labels. The average values allow us to assess the performance of all the trained models by considering the training and validation datasets. The reason for employing the average values rather than the RMSE, R2, and MAE of the validation dataset was that the sampling size of the validation dataset of 30 rows was much smaller than the training dataset of 241 rows. Therefore, more RMSE, R2, and MAE fluctuations are expected from the validation dataset. It can be seen that the best RMSE of 0.75 was obtained from the Matern 5/2 GPR, followed by an RMSE of 0.75 for the exponential GPR. These performance parameters indicate that the exponential GPR is also an acceptable model. The Matern 5/2 GPR model was chosen to perform PCA analysis in the next section. Figure 4a shows the labels of the validation dataset in the solid blue curve and the predicted biomass production calculated using the trained Matern 5/2 GPR model. It can be observed that the predicted data agree well with the labels, and the overall error is randomly distributed throughout all the expected biomass ranges, as shown in Figure 4b. Figure 4c shows the predicted values against the labels. All the data points were along the diagonal line of the perfect prediction response.

3.3. Testing Using the Separated 30 Rows

The Matern 5/2 GPR confirmed that it could provide the best RMSE performance compared to the others. In this section, another set of unseen data, namely, the test dataset, was then employed to evaluate the performance of the Matern 5/2 GPR and whether it can perform similarly to the training and validation dataset. The Matern 5/2 GPR model, when validated using the test dataset, had an RMSE of 0.77 g/L, R2 of 0.94, and MAE of 0.48 g/L. Figure 5a shows the test dataset’s labels compared to the predicted values from the trained Matern 5/2 GPR model; it can be seen that the estimated biomass amounts agree well with the labels throughout the range of study, as shown as the difference between the predicted values and their label, as shown in Figure 5b. Figure 5c shows the predicted values against the labels, indicating that the predicted biomass production agrees well with their expected values, similar to the finding discussed in the earlier section for the training data and validation dataset.

3.4. Predictor Selection Using f-Test

One of the research aims of this study is to identify the main components contributing to biomass production. The constructed database comprises 25 predictors and 1 corresponding label, biomass production. Here, the f-test was employed to compute RMSE, R2, and MAE when the Matern 5/2 GPR model was trained using only some predictors from the 25 available predictors starting from 1 to 25 predictors.
The predictors were ranked based on their importance using the p-value of the f-test, as shown in Table 4. From Table 4, it can be concluded that 14 statistically significant predictors should be included to form a regression model. These include time, peptone, temperature, TKN, shaking rate, total nitrogen, inoculum size, yeast extract, crude glycerol, glucose, oil and grease, pH, ammonium sulfate, and olive oil, ranked based on their p-value.
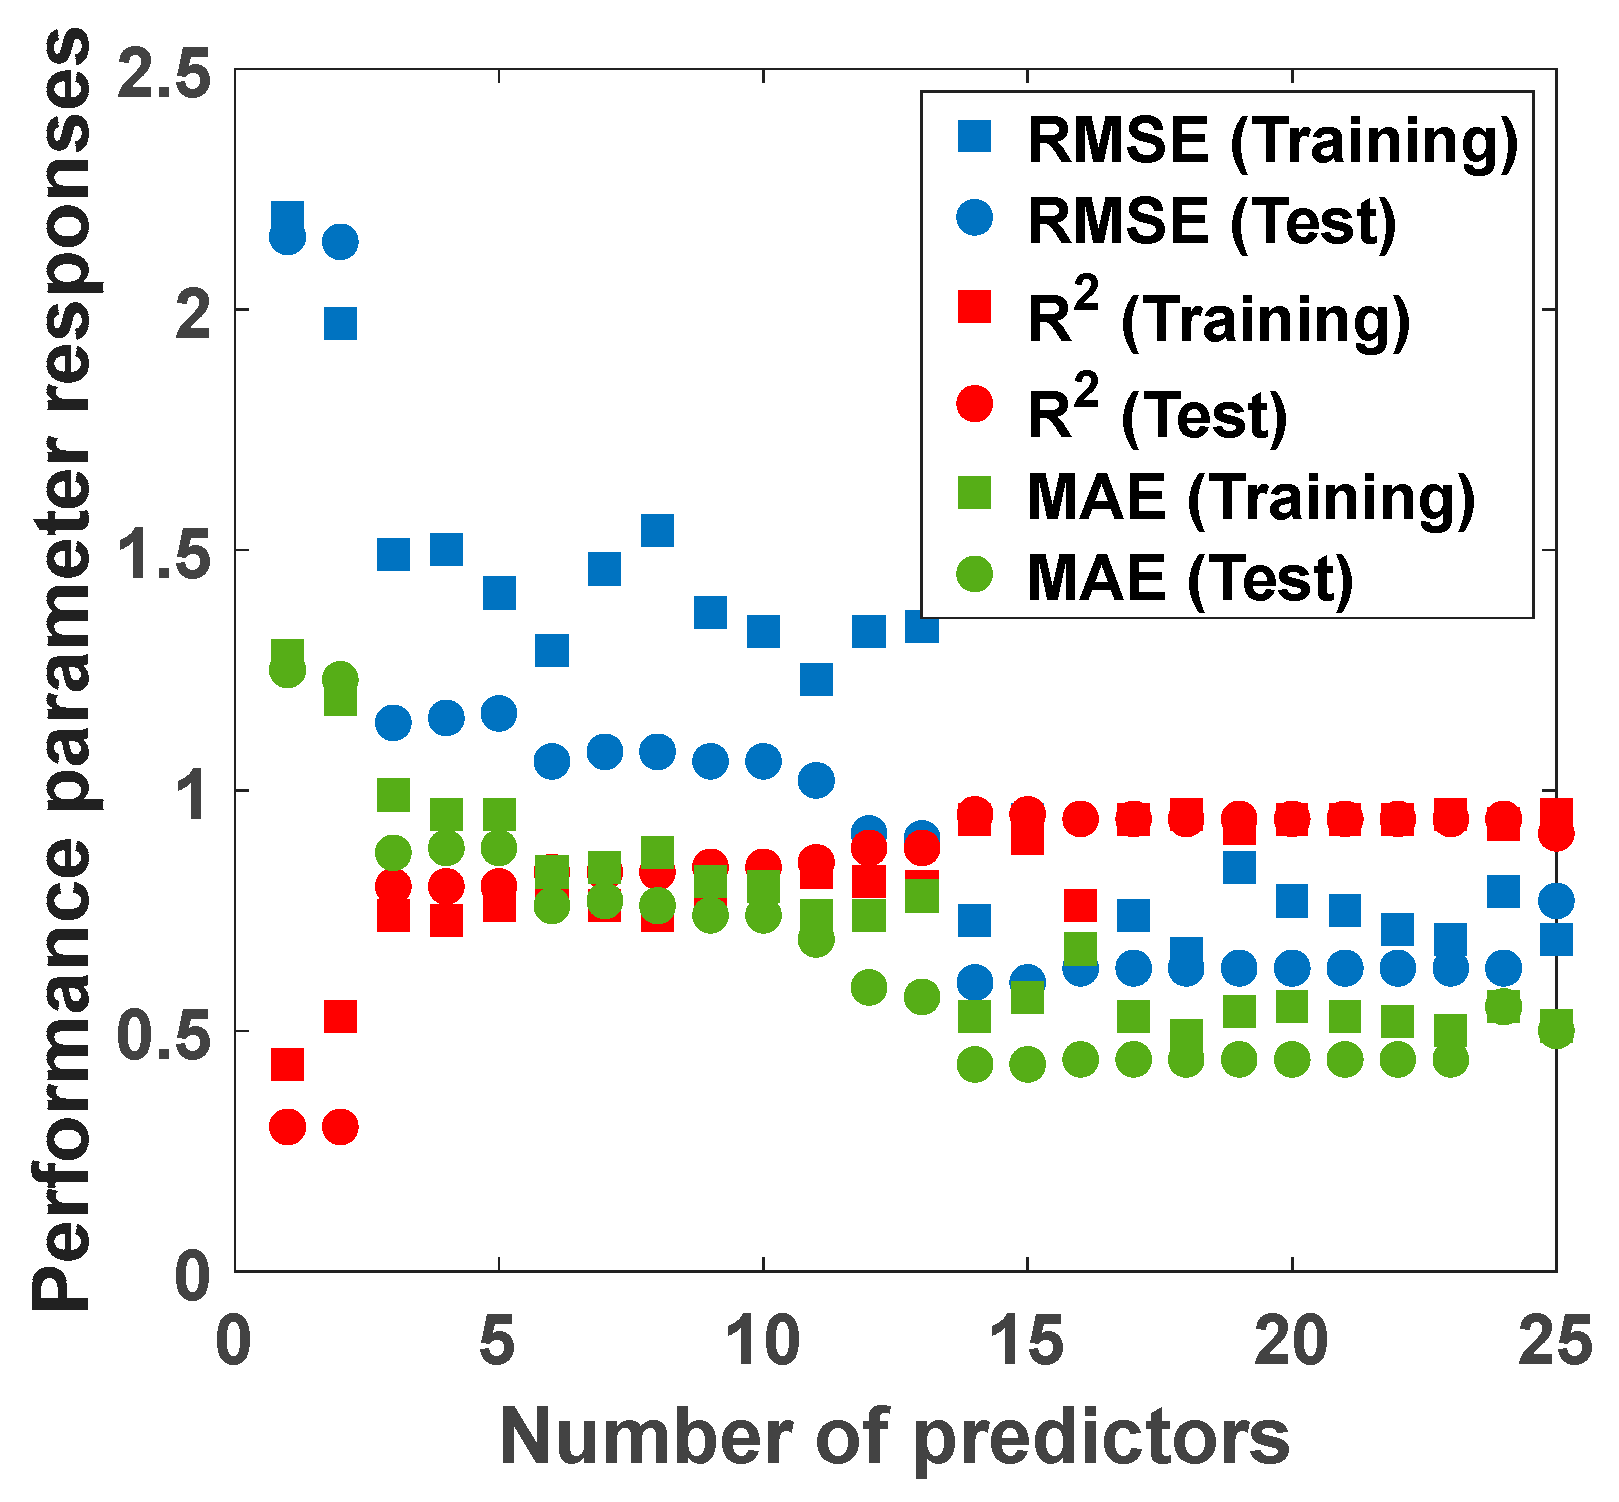
Here, the predictors in Table 4 were employed to train Matern 5/2 GPR models using only some of the 25 available predictors starting from 1 predictor up to 25 predictors. Table 5 shows the Matern 5/2 GPR models trained using a different number of predictors, as indicated by the second column of the table. The third column shows the predictors selected using the p-value of the f-test. The third to fifth columns show the training RMSE, training R2, and training MAE. From Table 5, it can be observed that the performance parameters of the trained models become stable when the number of predictors reaches 14, as shown in Figure 6.
All the trained models were then tested to check whether they could provide similar responses when predicting some unseen data. Here, we combined the 30 rows of the validation dataset and the 30 rows of the test dataset into 1 single test dataset since there was no need to perform 2 steps of validation and testing because we chose the Matern 5/2 GPR model, as explained in Section 3.1 and Section 3.2. The combined test dataset was then employed to test the performance of the trained models, and the performance parameters are also shown in Table 5 and Figure 6, allowing a direct comparison to the performance responses of the training dataset. It can be seen from Figure 6 that the RMSE, R2, and MAE of the test dataset were close to the training dataset after the number of predictors reached 14.
Note that various methodologies, such as the f-test, Maximum Relevance–Minimal Redundancy (MRMR), and principal component analysis (PCA), can be used to choose essential predictors for regression problems. We used the f-test to confirm the paper’s findings and compared them to the MRMR and PCA approaches, and all techniques identified the same number of critical predictors and key traits.

4. Discussion

First, regarding the materials and methods used in the research, it is essential to note that the study was conducted by summarizing 15 publications reported in the literature to form a database for machine learning. There was a total of 301 rows with 25 predictors and 1 label. This sample size was large enough to train machine learning models to predict biomass production from Y. lipolytica fermentation. The methods used were robust and reliable, producing similar RMSE, R2, and MAE for the training, validation, and testing. The RMSE was within 0.72 g/L to 0.77 g/L, the R2 between 0.90 and 0.94, and the MAE between 0.43 g/L and 0.52 g/L. The performance helps to ensure that the study results are valid and meaningful and can be applied in Y. lipolytica fermentation.
The f-test can be applied to identify principal features from the 25 predictors. Only 14 predictors are essential for predicting biomass production from the Y. lipolytica fermentation. The 14 predictors are time, peptone, temperature, TKN, shaking rate, total nitrogen, inoculum size, yeast extract, crude glycerol, glucose, oil and grease, pH, ammonium sulfate, and olive oil. These predictors were ranked based on their p-value in ascending order, and the dimension-reduced model had an RMSE of 0.73 g/L and 0.60 g/L for the validation datasets.
Although the predictors are sufficient to predict biomass production from Y. lipolytica fermentation in the scope of the study, we have prepared more predictors than needed and made the database publicly available in the Supplementary Table S1. Hopefully, the constructed database can be further expanded and valuable in research and industrial applications.
Having mentioned in the introduction, although biomass production is not a product of interest, it can be a good indicator of the cellular activity of the Y. lipolytica fermentation. Additionally, it can save costs associated with the overproduction or underproduction of biomass output, resulting in more efficient and sustainable production operations.
The science and engineering community has recently been interested in applying data mining and machine learning to estimate biological and biomedical products and processes. Fermentation is also one of the interests, especially for Y. lipolytica fermentation; there are only a few papers on this research field. Machine learning with data mining can analyze and accurately estimate biomass production for Y. lipolytica fermentation.

5. Conclusions

This study used machine learning with a data mining approach to construct a database for studying biomass production from Y. lipolytica fermentation. The database was extracted from 15 publications and curated by converting to the same unit and removing missing data rows. The predictors were inoculum size, COD, oil and grease, TKN, olive oil, glucose, crude glycerol, Tween20, Tween80, peptone, ammonium sulfate, yeast extract, Urea, total nitrogen, Monosodium glutamate, Di-potassium hydrogen phosphate, Iron (III) chloride, Calcium chloride, Sodium chloride, temperature, shaking rate, pH, and time. The database can be analyzed as a supervised machine learning task for a regression problem using 26 types of regression models.
The Matern 5/2 GPR model provided the lowest RMSE of 0.75 g/L, the highest R2 of 0.90, and the lowest MAE of 0.52 g/L. The t-test was used to identify significant predictors and found that 14 predictors were sufficient to create an accurate model to estimate biomass production from Y. lipolytica fermentation.

Supplementary Materials

The following supporting information can be downloaded at: https://www.mdpi.com/article/10.3390/fermentation9030239/s1, Table S1: the Y. lipolytica fermentation database formed by extracting experimental results reported in the 15 referenced articles.

Author Contributions

Conceptualization, N.P., S.P. and T.T.; methodology, N.P., S.P. and T.T.; software, N.P., S.P. and T.T.; validation, N.P., S.P. and T.T.; formal analysis, N.P., S.P. and T.T.; investigation, N.P., S.P. and T.T.; resources, N.P., S.P. and T.T.; data curation, N.P., S.P. and T.T.; writing—original draft preparation, N.P., S.P. and T.T.; writing—review and editing, N.P., S.P. and T.T.; visualization, N.P., S.P. and T.T.; supervision, S.P.; project administration, S.P.; funding acquisition, N.P. and S.P. All authors have read and agreed to the published version of the manuscript.

Funding

This work was supported by (1) the Research Institute of Rangsit University (RSU), (2) the School of Engineering of King Mongkut’s Institute of Technology Ladkrabang (KMITL), and (3) a research grant from Naresuan University (grant number: R2564C017).

Institutional Review Board Statement

Not applicable.

Informed Consent Statement

Not applicable.

Data Availability Statement

Not applicable.

Acknowledgments

We would like to acknowledge resources, fruitful discussion, and suggestions from (1) the College of Biomedical Engineering, Rangsit University, Thailand, (2) the School of Engineering, KMITL, Thailand, and (3) the Department of Agro-Industry, Naresuan University, Phitsanulok 65000, Thailand.

Conflicts of Interest

The authors declare no conflict of interest.

References

  1. Liu, H.; Song, Y.; Fan, X.; Wang, C.; Lu, X.; Tian, Y. Yarrowia lipolytica as an Oleaginous Platform for the Production of Value-Added Fatty Acid-Based Bioproducts. Front. Microbiol. 2021, 11, 608662. [Google Scholar] [CrossRef] [PubMed]
  2. Juszczyk, P.; Rymowicz, W.; Kita, A.; Rywińska, A. Biomass production by Yarrowia lipolytica yeast using waste derived from the production of ethyl esters of polyunsaturated fatty acids of flaxseed oil. Ind. Crops Prod. 2019, 138, 111590. [Google Scholar] [CrossRef]
  3. El Kantar, S.; Koubaa, M. Valorization of Low-Cost Substrates for the Production of Odd Chain Fatty Acids by the Oleaginous Yeast Yarrowia lipolytica. Fermentation 2022, 8, 284. [Google Scholar] [CrossRef]
  4. Gottardi, D.; Siroli, L.; Braschi, G.; Rossi, S.; Bains, N.; Vannini, L.; Patrignani, F.; Lanciotti, R. Selection of Yarrowia lipolytica Strains as Possible Solution to Valorize Untreated Cheese Whey. Fermentation 2023, 9, 51. [Google Scholar] [CrossRef]
  5. Gao, R.; Li, Z.; Zhou, X.; Bao, W.; Cheng, S.; Zheng, L. Enhanced lipid production by Yarrowia lipolytica cultured with synthetic and waste-derived high-content volatile fatty acids under alkaline conditions. Biotechnol. Biofuels 2020, 13, 3. [Google Scholar] [CrossRef]
  6. Papanikolaou, S.; Chevalot, I.; Komaitis, M.; Marc, I.; Aggelis, G. Single cell oil production by Yarrowia lipolytica growing on an industrial derivative of animal fat in batch cultures. Appl. Microbiol. Biotechnol. 2002, 58, 308–312. [Google Scholar] [CrossRef]
  7. Carreira, A.; Ferreira, L.M.; Loureiro, V. Brown pigments produced by Yarrowia lipolytica result from extracellular accumulation of homogentisic acid. Appl. Environ. Microbiol. 2001, 67, 3463–3468. [Google Scholar] [CrossRef] [Green Version]
  8. Larroude, M.; Onésime, D.; Rué, O.; Nicaud, J.-M.; Rossignol, T. A Yarrowia lipolytica Strain Engineered for Pyomelanin Production. Microorganisms 2021, 9, 838. [Google Scholar] [CrossRef]
  9. Bruder, S.; Melcher, F.A.; Zoll, T.; Hackenschmidt, S.; Kabisch, J. Evaluation of a Yarrowia lipolytica Strain Collection for Its Lipid and Carotenoid Production Capabilities. Eur. J. Lipid Sci. Technol. 2020, 122, 1900172. [Google Scholar] [CrossRef]
  10. Carsanba, E.; Papanikolaou, S.; Fickers, P.; Erten, H. Screening various Yarrowia lipolytica strains for citric acid production. Yeast 2019, 36, 319–327. [Google Scholar] [CrossRef]
  11. Liu, X.; Lv, J.; Xu, J.; Zhang, T.; Deng, Y.; He, J. Citric Acid Production in Yarrowia lipolytica SWJ-1b Yeast When Grown on Waste Cooking Oil. Appl. Biochem. Biotechnol. 2015, 175, 2347–2356. [Google Scholar] [CrossRef] [PubMed]
  12. Sayın Börekçi, B.; Kaya, M.; Kaban, G. Citric Acid Production by Yarrowia lipolytica NRRL Y-1094: Optimization of pH, Fermentation Time and Glucose Concentration Using Response Surface Methodology. Fermentation 2022, 8, 731. [Google Scholar] [CrossRef]
  13. Du, Y.-H.; Wang, M.-Y.; Yang, L.-H.; Tong, L.-L.; Guo, D.-S.; Ji, X.-J. Optimization and Scale-Up of Fermentation Processes Driven by Models. Bioengineering 2022, 9, 473. [Google Scholar] [CrossRef]
  14. Helleckes, L.M.; Hemmerich, J.; Wiechert, W.; von Lieres, E.; Grünberger, A. Machine learning in bioprocess development: From promise to practice. Trends Biotechnol. 2022. [Google Scholar] [CrossRef]
  15. Ciliberti, C.; Biundo, A.; Colacicco, M.; Agrimi, G.; Isabella, P. Physiological Characterisation of Yarrowia lipolytica Cultures Grown on Alternative Carbon Sources to Develop Microbial Platforms for Waste Cooking Oils Valorisation. Chem. Eng. Trans. 2022, 93, 241–246. [Google Scholar]
  16. Hackenschmidt, S.; Bracharz, F.; Daniel, R.; Thürmer, A.; Bruder, S.; Kabisch, J. Effects of a high-cultivation temperature on the physiology of three different Yarrowia lipolytica strains. FEMS Yeast Res. 2019, 19, foz068. [Google Scholar] [CrossRef] [PubMed]
  17. Gonçalves, F.A.; Colen, G.; Takahashi, J.A. Yarrowia lipolytica and its multiple applications in the biotechnological industry. TheScientificWorldJournal 2014, 2014, 476207. [Google Scholar] [CrossRef] [PubMed] [Green Version]
  18. Mookiah, V.P.; Kasimani, R.; Pandian, S.; Asokan, T. Study on the Effects of Initial pH, Temperature and Agitation Speed on Lipid Production by Yarrowia lipolytica and Chlorella vulgaris using Sago Wastewater as a Substrate. 2020. Available online: https://tierarztliche.com/gallery/v40.53.pdf (accessed on 12 January 2023).
  19. Mukhtar, H.; Suliman, S.M.; Shabbir, A.; Mumtaz, M.W.; Rashid, U.; Rahimuddin, S.A. Evaluating the Potential of Oleaginous Yeasts as Feedstock for Biodiesel Production. Protein Pept. Lett. 2018, 25, 195–201. [Google Scholar] [CrossRef]
  20. Czajka, J.J.; Oyetunde, T.; Tang, Y.J. Integrated knowledge mining, genome-scale modeling, and machine learning for predicting Yarrowia lipolytica bioproduction. Metab. Eng. 2021, 67, 227–236. [Google Scholar] [CrossRef]
  21. Coşgun, A.; Günay, M.E.; Yıldırım, R. Analysis of lipid production from Yarrowia lipolytica for renewable fuel production by machine learning. Fuel 2022, 315, 122817. [Google Scholar] [CrossRef]
  22. Zhao, C.; Gu, D.; Nambou, K.; Wei, L.; Chen, J.; Imanaka, T.; Hua, Q. Metabolome analysis and pathway abundance profiling of Yarrowia lipolytica cultivated on different carbon sources. J. Biotechnol. 2015, 206, 42–51. [Google Scholar] [CrossRef] [PubMed]
  23. Golugula, A.; Lee, G.; Madabhushi, A. Evaluating feature selection strategies for high dimensional, small sample size datasets. In Proceedings of the 2011 Annual International Conference of the IEEE Engineering in Medicine and Biology Society, Boston, MA, USA, 30 August–3 September 2011; pp. 949–952. [Google Scholar]
  24. Louhasakul, Y.; Cheirsilp, B.; Prasertsan, P. Valorization of Palm Oil Mill Effluent into Lipid and Cell-Bound Lipase by Marine Yeast Yarrowia lipolytica and Their Application in Biodiesel Production. Waste Biomass Valorization 2016, 7, 417–426. [Google Scholar] [CrossRef]
  25. Intasit, R.; Cheirsilp, B.; Yeesang, J. Selection of Oleaginous Yeasts and their Use for Lipid Production from Oil Palm Sap. In Proceedings of the National and International Graduate Research Conference 2016, Khon Kaen, Thailand, 15 January 2016. [Google Scholar]
  26. Louhasakul, Y.; Cheirsilp, B. Industrial waste utilization for low-cost production of raw material oil through microbial fermentation. Appl. Biochem. Biotechnol. 2013, 169, 110–122. [Google Scholar] [CrossRef]
  27. Louhasakul, Y.; Cheirsilp, B.; Treu, L.; Kougias, P.G.; Angelidaki, I. Metagenomic insights into bioaugmentation and biovalorization of oily industrial wastes by lipolytic oleaginous yeast Yarrowia lipolytica during successive batch fermentation. Biotechnol. Appl. Biochem. 2020, 67, 1020–1029. [Google Scholar] [CrossRef] [PubMed]
  28. Louhasakul, Y.; Cheirsilp, B.; Intasit, R.; Maneerat, S.; Saimmai, A. Enhanced valorization of industrial wastes for biodiesel feedstocks and biocatalyst by lipolytic oleaginous yeast and biosurfactant-producing bacteria. Int. Biodeterior. Biodegrad. 2020, 148, 104911. [Google Scholar] [CrossRef]
  29. Kebabci, Ö.; Cihangir, N. Comparison of three Yarrowia lipolytica strains for lipase production: NBRC 1658, IFO 1195, and a local strain. Turk. J. Biol. 2012, 36, 15–24. [Google Scholar] [CrossRef]
  30. Darvishi, F.; Nahvi, I.; Zarkesh-Esfahani, H.; Momenbeik, F. Effect of plant oils upon lipase and citric acid production in Yarrowia lipolytica yeast. J. Biomed. Biotechnol. 2009, 2009, 562943. [Google Scholar] [CrossRef] [PubMed] [Green Version]
  31. Fickers, P.; Destain, J.; Thonart, P. Improvement of Yarrowia lipolytica lipase production by fed-batch fermentation. J. Basic Microbiol. 2009, 49, 212–215. [Google Scholar] [CrossRef]
  32. Moftah, O.A.S.; Grbavcic, S.Z.; Moftah, W.A.; Luković, N.D.; Prodanović, O.; Jakovetic, S.M.; Knezevic-Jugović, Z.D. Lipase production by Yarrowia lipolytica using olive oil processing wastes as substrates. J. Serb. Chem. Soc. 2013, 78, 781–794. [Google Scholar] [CrossRef]
  33. Fickers, P.; Ongena, M.; Destain, J.; Weekers, F.; Thonart, P. Production and down-stream processing of an extracellular lipase from the yeast Yarrowia lipolytica. Enzym. Microb. Technol. 2006, 38, 756–759. [Google Scholar] [CrossRef]
  34. Gonçalves, F.; Colen, G.; Takahashi, J. Optimization of cultivation conditions for extracellular lipase production by Yarrowia lipolytica using response surface method. Afr. J. Biotechnol. 2013, 12, 2270–2278. [Google Scholar] [CrossRef]
  35. Magdouli, S.; Guedri, T.; Tarek, R.; Brar, S.K.; Blais, J.F. Valorization of raw glycerol and crustacean waste into value added products by Yarrowia lipolytica. Bioresour. Technol. 2017, 243, 57–68. [Google Scholar] [CrossRef] [PubMed] [Green Version]
  36. Pereira, A.d.S.; Fontes-Sant’Ana, G.C.; Amaral, P.F. Mango agro-industrial wastes for lipase production from Yarrowia lipolytica and the potential of the fermented solid as a biocatalyst. Food Bioprod. Process. 2019, 115, 68–77. [Google Scholar] [CrossRef]
  37. Corzo, G.; Revah, S. Production and characteristics of the lipase from Yarrowia lipolytica 681. Bioresour. Technol. 1999, 70, 173–180. [Google Scholar] [CrossRef]
  38. Nambou, K.; Zhao, C.; Wei, L.; Chen, J.; Imanaka, T.; Hua, Q. Designing of a “cheap to run” fermentation platform for an enhanced production of single cell oil from Yarrowia lipolytica DSM3286 as a potential feedstock for biodiesel. Bioresour. Technol. 2014, 173, 324–333. [Google Scholar] [CrossRef]
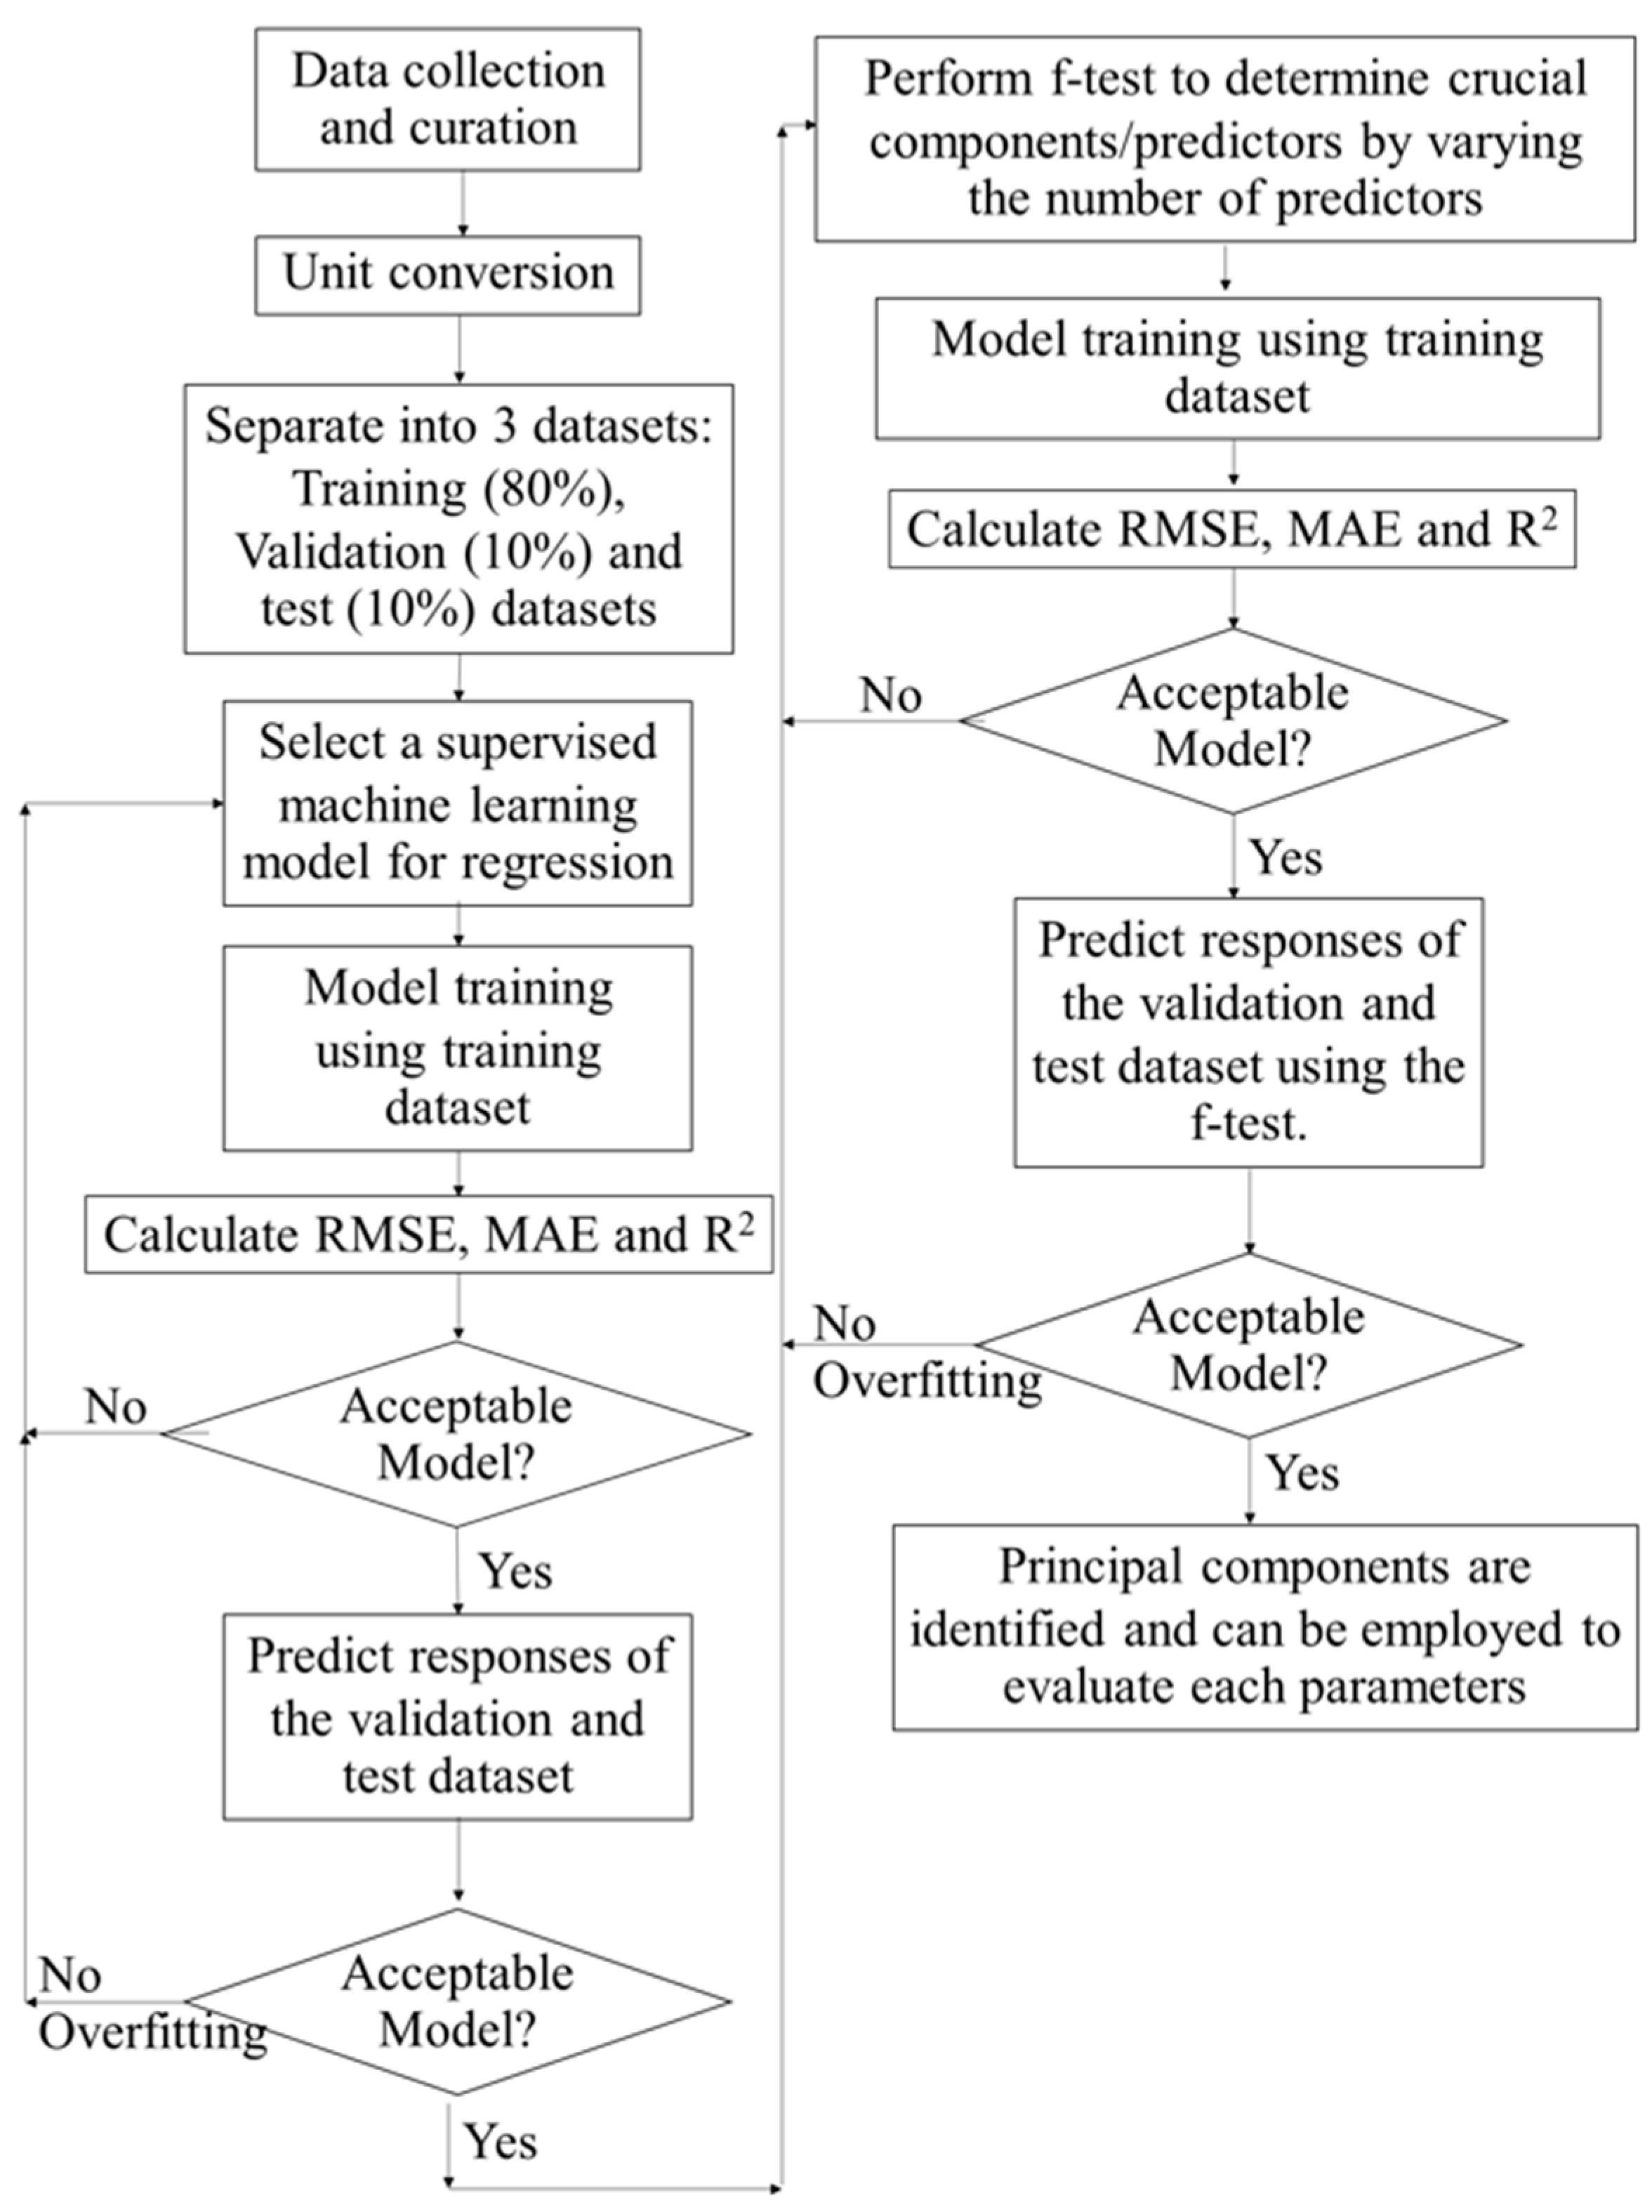
Figure 1. Process flow of data curation, model training, validation, and testing.
Fermentation 09 00239 g001
Figure 2. The combined dataset comprises 301 rows and 26 columns from 15 publications reported in the literature.
Fermentation 09 00239 g002
Figure 3. (a) Labels compared to the predicted values from the Matern 5/2 GPR model, (b) residual error, and (c) predicted values plotted against the training labels.
Fermentation 09 00239 g003
Figure 4. (a) Validation dataset’s labels compared to the predicted values from the trained Matern 5/2 GPR model, (b) residual error, and (c) predicted values plotted against the validation dataset’s labels.
Fermentation 09 00239 g004
Figure 5. (a) Test dataset’s labels compared to the predicted values from the trained Matern 5/2 GPR model, (b) residual error, and (c) predicted values vs. the test dataset’s labels.
Fermentation 09 00239 g005
Figure 6. RMSE, R2, and MAE responses from the trained Matern 5/2 GPR model with different numbers of predictors ranging from 1 predictor to 25 predictors for the training and test datasets.
Fermentation 09 00239 g006
Table 1. Definition of each parameter, mean value ( x ¯ ), minimum value (Min), maximum value (Max), and standard deviation ( S ).
Attribute No.Attribute SymbolDetailsUnit x ¯ MinMax S
Predictors
(1)Inoculum size cell/mL1.07 × 1081.00 × 1072.50 × 1084.02 × 107
(2)COD Chemical oxygen demandg/L70.280.00225.6748.93
(3)Oil and grease g/L1.260.008.421.93
(4)TKNTotal Kjeldahl nitrogeng/L0.030.000.180.06
(5)Olive oil %0.150.005.000.85
(6)GlucoseC₆H₁₂O₆g/L1.060.0040.006.44
(7)Crude glycerol %1.580.0010.002.26
(8)Tween20 %0.050.002.000.30
(9)Tween80 %0.050.002.000.30
(10)Peptone g/L0.130.005.000.81
(11)Ammonium sulfate g/L0.760.004.761.65
(12)Yeast extract g/L0.690.0015.002.81
(13)Urea g/L0.050.002.170.33
(14)Total nitrogen g/L0.530.001.240.56
(15)Monosodium glutamate C₅H₈NO₄Nag/L0.110.001.000.31
(16)Di-potassium hydrogen phosphateK₂HPO₄g/L0.090.000.800.25
(17)Magnesium chloride MgCl2g/L0.050.000.500.15
(18)Iron (III) chloride FeCl3g/L0.00110.000.01000.0031
(19)Potassium
dihydrogen phosphate
KH2PO4g/L0.020.000.200.06
(20)Calcium chloride CaCl2g/L0.010.000.050.02
(21)Sodium chloride NaClg/L0.530.005.001.54
(22)Temperature °C29.8828.0030.000.48
(23)Shaking rate rpm142.39140.00180.009.50
(24)pH 5.924.306.500.35
(25)Time hours37.680.00120.0025.50
Response (label)
(26)Biomass g/L3.500.0022.002.83
Table 2. RMSE, R2, and MAE values of the 26 regression models trained using all 25 predictors.
Model TypeModel Details5-Fold Cross-Validation RMSE Calculated from the Training Dataset in (g/L)5-Fold Cross-Validation R2
Calculated from the Training Dataset
5-Fold Cross-Validation MAE Calculated from the Training Dataset in (g/L)
Linear regressionLinear1.440.770.98
Interactions linear3.20-0.131.20
Robust linear1.620.710.92
Stepwise linear
regression
Stepwise linear1.340.790.79
TreeFine tree1.660.670.89
Medium tree1.920.560.94
Coarse tree2.330.351.37
Support vector
machine (SVM)
Linear SVM1.470.760.93
Quadratic SVM3.96-0.750.99
Cubic SVM2.690.200.95
Fine Gaussian SVM2.340.391.01
Medium Gaussian SVM2.030.541.15
Coarse Gaussian SVM2.340.391.35
EnsembleBoosted trees1.300.800.74
Bagged trees1.670.670.94
Gaussian process regression (GPR)Squared exponential GPR0.730.940.54
Matern 5/2 GPR0.720.940.52
Exponential GPR0.770.930.54
Rational quadratic GPR0.730.940.53
Neural networkNarrow neural network1.190.840.68
Medium neural network1.180.850.74
Wide neural network1.150.850.70
Bilayered neural network0.990.890.67
Trilayered neural network1.310.810.88
KernelSVM kernel2.750.161.39
Least squares regression kernel2.470.321.33
Table 3. Average RMSE, average R2, and average MAE values of the 26 trained regression models computed by taking the average value between the RMSE, R2, and MAE of the validation dataset and the RMSE, R2, and MAE values of the training dataset reported in Table 2.
Model TypeModel DetailsAverage RMSE in (g/L)Average R2Average MAE in (g/L)
Linear regressionLinear1.310.720.92
Interactions linear5.21−5.611.71
Robust linear1.720.470.91
Stepwise linear
regression
Stepwise linear1.260.740.80
TreeFine tree1.390.680.76
Medium tree1.430.670.83
Coarse tree1.940.371.23
Support vector machine (SVM)Linear SVM1.360.700.87
Quadratic SVM2.88−0.250.93
Cubic SVM2.070.360.92
Fine Gaussian SVM1.720.550.88
Medium Gaussian SVM1.460.680.90
Coarse Gaussian SVM1.830.491.19
EnsembleBoosted trees1.120.790.69
Bagged trees1.230.750.79
Gaussian process
regression (GPR)
Squared exponential GPR0.800.880.56
Matern 5/2 GPR0.750.900.52
Exponential GPR0.750.900.51
Rational quadratic GPR0.760.900.53
Neural networkNarrow neural network1.100.800.70
Medium neural network1.540.510.81
Wide neural network1.260.710.74
Bilayered neural network0.990.830.67
Trilayered neural network1.120.800.73
KernelSVM kernel2.120.321.18
Least squares regression kernel2.050.351.19
Table 4. p-value of f-test for all the predictors.
Predictorf-test
Significant parameters
(25) Time0.48
(10) Peptone0.36
(22) Temperature0.36
(4) TKN0.36
(23) Shaking rate0.22
(14) Total nitrogen0.21
(1) Inoculum size0.18
(12) Yeast extract0.16
(7) Crude glycerol0.16
(6) Glucose0.13
(3) Oil and grease 0.12
(24) pH0.12
(11) Ammonium sulfate0.08
(5) Olive oil0.05
Insignificant parameters
(9) Tween800.04
(19) Potassium di-hydrogen phosphate: KH2PO40.02
(20) Calcium chloride0.02
(21) Sodium chloride0.02
(15) Monosodium glutamate0.02
(16) Di-potassium hydrogen phosphate: K₂HPO₄0.02
(13) Urea0.02
(17) Magnesium chloride0.02
(18) Iron (III) chloride tetrahydrate0.02
(8) Tween200.01
(2) COD0.00
Table 5. Training RMSE (g/L), training R2, and training MAE (g/L) when training the models using a different number of predictors ranging from 1 predictor to 25 predictors, and test RMSE (g/L), test R2 test MAE (g/L) when testing the trained models.
Number of PredictorsPredictorsTraining RMSE (g/L)Training R2Training MAE (g/L)Test RMSE (g/L)Test R2Test MAE (g/L)
1(25)2.190.431.282.150.301.25
2(25), (10)1.970.531.192.140.301.23
3(25), (10), (22)1.490.740.991.140.800.87
4(25), (10), (22), (4)1.500.730.951.150.800.88
5(25), (10), (22), (4), (23)1.410.760.951.160.800.88
6(25), (10), (22), (4), (23), (14)1.290.800.831.060.830.76
7(25), (10), (22), (4), (23), (14), (1)1.460.760.841.080.830.77
8(25), (10), (22), (4), (23), (14), (1), (12)1.540.740.871.080.830.76
9(25), (10), (22), (4), (23), (14), (1), (12), (7)1.370.790.811.060.840.74
10(25), (10), (22), (4), (23), (14), (1), (12), (7), (6)1.330.810.801.060.840.74
11(25), (10), (22), (4), (23), (14), (1), (12), (7), (6), (3)1.230.830.741.020.850.69
12(25), (10), (22), (4), (23), (14), (1), (12), (7), (6), (3), (24)1.330.810.740.910.880.59
13(25), (10), (22), (4), (23), (14), (1), (12), (7), (6), (3), (24), (11)1.340.800.780.900.880.57
14(25), (10), (22), (4), (23), (14), (1), (12), (7), (6), (3), (24), (11), (5)0.730.940.530.600.950.43
15(25), (10), (22), (4), (23), (14), (1), (12), (7), (6), (3), (24), (11), (5), (9)0.940.900.570.600.950.43
16(25), (10), (22), (4), (23), (14), (1), (12), (7), (6), (3), (24), (11), (5), (9), (19)1.480.760.670.630.940.44
17(25), (10), (22), (4), (23), (14), (1), (12), (7), (6), (3), (24), (11), (5), (9), (19), (20)0.740.940.530.630.940.44
18(25), (10), (22), (4), (23), (14), (1), (12), (7), (6), (3), (24), (11), (5), (9), (19), (20), (21)0.660.950.490.630.940.44
19(25), (10), (22), (4), (23), (14), (1), (12), (7), (6), (3), (24), (11), (5), (9), (19), (20), (21), (15)0.840.920.540.630.940.44
20(25), (10), (22), (4), (23), (14), (1), (12), (7), (6), (3), (24), (11), (5), (9), (19), (20), (21), (15), (16)0.770.940.550.630.940.44
21(25), (10), (22), (4), (23), (14), (1), (12), (7), (6), (3), (24), (11), (5), (9), (19), (20), (21), (15), (16), (13)0.750.940.530.630.940.44
22(25), (10), (22), (4), (23), (14), (1), (12), (7), (6), (3), (24), (11), (5), (9), (19), (20), (21), (15), (16), (13), (17)0.710.940.520.630.940.44
23(25), (10), (22), (4), (23), (14), (1), (12), (7), (6), (3), (24), (11), (5), (9), (19), (20), (21), (15), (16), (13), (17), (18)0.690.950.500.630.940.44
24(25), (10), (22), (4), (23), (14), (1), (12), (7), (6), (3), (24), (11), (5), (9), (19), (20), (21), (15), (16), (13), (17), (18), (8)0.790.930.550.630.940.55
25(25), (10), (22), (4), (23), (14), (1), (12), (7), (6), (3), (24), (11), (5), (9), (19), (20), (21), (15), (16), (13), (17), (18), (8), (2)0.690.950.510.770.910.50
Disclaimer/Publisher’s Note: The statements, opinions and data contained in all publications are solely those of the individual author(s) and contributor(s) and not of MDPI and/or the editor(s). MDPI and/or the editor(s) disclaim responsibility for any injury to people or property resulting from any ideas, methods, instructions or products referred to in the content.