Abstract
In this study the combinatory effect of several extrinsic factors on reduced (vacuum) pressure fermentations was explored. Specifically, the pressure, temperature, and FAN levels of high gravity Saccharomyces cerevisiae fermentations were manipulated, while yeast morphology was assessed using automated multivariate image analysis. Fermentation attributes including yeast growth, viability, and ethanol production were monitored using standard methods. Across all FAN and temperature levels, reduced pressure (vacuum pressure) fermentations resulted in a greater than or equal number of cells in suspension, higher average viability, and greater ethanol production in comparison to atmospheric pressure fermentations; however, the magnitude of the effect varied with extrinsic factors. The image analysis revealed that while yeast size was extremely variable across all fermentations, the ratio of vacuole to cell area consistently decreased over each fermentation and could be used to predict the point where the yeast experienced a sharp decline in viability ending the fermentation. This study showed that a combination of traditional measurements and novel automated analyses can be used by brewers to anticipate performance and endpoints of their fermentations, and that reduced pressure can have significant effects upon the rate and final ethanol concentration of variable industrial fermentations.
1. Introduction
The effect of reduced pressure on batch fermentations has been reported by numerous researchers [1]. Generally, fermenting under vacuum pressure has resulted in an increase in the number of cells in suspension and a reduction in the process time when compared to atmospheric pressure conditions. These differences were hypothesized to be explained by the reduction of carbon dioxide (CO2) during fermentation which is a known inhibitor of yeast metabolism [2]. The effects of reduced pressure are difficult to quantify as they appear to be dependent upon other extrinsic factors such as Free Amino Nitrogen (FAN) and temperature which themselves have been shown to influence fermentation attributes including fermentation rate [1,3,4,5,6], yeast cell growth [7,8,9,10,11], yeast viability [12], ethanol production [13], and ethanol tolerance [14,15]. Furthermore, the combinatory relationships between these factors and yeast performance and morphology are neither consistent, or directly proportional. This study used a combination of traditional methods and novel image analysis techniques to examine the effect of reduced pressure on fermentations with variable FAN and temperature.
Although the stress response pathways of Saccharomyces cerevisiae have been examined extensively [16,17,18,19], the ability of brewers to measure yeast stress quickly and effectively remains limited. Within brewing and distilling fermentation processes, yeast cells undergo numerous adaptations [20], which often result in visible changes to yeast morphology [21,22,23]. Previous authors [17,18] studied yeast’s general stress response (GSR) mechanism. This intracellular response assists in the adaptation process through a non-specific response that includes the synthesis of protective compounds [20,22], and changes to cell morphology and organelles such as vacuoles [24]. Additionally, this response can modulate the permeability of the cell membrane and positively impact yeast performance and viability in various environments [25]. The aim of the GSR is to counteract unfavorable environmental conditions (e.g., temperature, ethanol, carbon dioxide, etc.) during the fermentation process. Published studies [24,26,27] have determined that these changes in yeast morphology (cell size and vacuole size) throughout fermentation could be correlated to environmental stress factors, including osmotic pressure and ethanol content. Therefore, while yeast stress cannot be easily measured directly, the visible characteristics of yeast size and vacuole structure can be used as stress indicators [23,27,28]. Recent advances in automated image processing allow closer observation of how yeast structural characteristics (especially yeast and vacuole size) change throughout fermentation in different environmental conditions [29,30,31,32]. Automated image analysis has been used to observe yeast size (expressed as cross-sectional area (CSA)) and yeast vacuolar fragmentation/size [33], but has not yet been optimized for use by the fermentation industry.
One of the most important nutrients for yeast is a source of FAN at the beginning of the fermentation. Free Amino Nitrogen (FAN) refers to the concentration of certain biologically available nitrogen-containing compounds (alpha-amino acids, ammonia, and small peptides) that can be metabolized by yeast [34,35]. Lei et al. found that concentrations of FAN less than 280 mg/L negatively affected the fermentation rate [36]. Conversely, when high (≥280 mg/L) FAN levels were present in the media, yeast showed higher consumption of fermentable sugars and tolerance to ethanol. In brewing operations, the high malt utilization usually results in sufficient FAN to support the process (Jones and Budde, 2005). However, in high adjunct or grain-free fermentations (e.g., sucrose/molasses fermentations), it is common to encounter low levels of FAN. Thus, supplementing the media with a source of FAN is often employed to improve these fermentations.
Many studies have thoroughly studied fermentation temperature as a key factor for controlling yeast growth and performance [10,11]. Temperature has a direct impact on both fermentation rate and ethanol production [13] as well as the sensory properties of the final product. Additionally, yeast ethanol tolerance (similar to other traits), is dependent on the fermentation temperature [15]. The effects of temperature are strain-dependent due to a complex heat-resistant response [37] that creates a “temperature range” where fermentation is possible. When fermenting at the high end of the optimal range, researchers [38,39] have reported low yeast viability.
The objective of this research was to assess the effect of reduced pressure on fermentations with variable FAN and temperature. The attributes of the fermentations including fermentation rate, yeast growth, viability, and ethanol production were assessed using standard methods while the morphology of the yeast was monitored using multivariant automated image analysis. Two different levels of each factor (high and low FAN concentration, temperature, and pressure) were selected based on the Saccharomyces cerevisiae strain used. Multivariant automated image analysis was used in an attempt to quantify yeast health during fermentations under each set of factors. This study was performed to increase the understanding of yeast performance and morphology under various environmental conditions, allowing the brewing and distilling industry to apply these techniques to increase the fermentation process efficiency.
2. Materials and Methods
2.1. Design of Experiment
This research was designed to have similar conditions to Very-High-Gravity distiller’s fermentation [40] using molasses and sucrose to assess the effect of extrinsic factors on yeast performance. The experiments were designed by altering three extrinsic factors (FAN concentration, temperature, and pressure) with two levels for each (completed in duplicate). The low FAN level obtained from the molasses used was 17 mg/L, while yeast extract was added to the media to achieve 300 mg/L as the high FAN level. In this study, the lower and higher fermentation temperatures of the supplier recommended range (30 °C and 35 °C) were used for testing (referred to hereafter as low and high temperature, respectively). The low pressure level selected was 24.1 kPa (vacuum), which was maintained throughout the fermentations by circulating water through a water aspirator connected to a centrifugal pump. The high pressure level was 101.3 kPa (atmospheric), as typically used in the brewing and distilling industry. The combination of low temperature with high FAN (LTHF) was hypothesized to promote yeast growth with a high viability, resulting in faster fermentation with a high ethanol production. On the contrary, the combination of high temperature with low FAN was expected to hinder yeast viability, resulting in a slow fermentation with a low ethanol production. Both conditions were expected to improve under vacuum pressure.
2.2. Yeast Strain and Media
A Saccharomyces cerevisiae strain, commercially designated as DISTILAMAX® SR, was obtained from Lallemand Inc., Québec, Canada. This active dry yeast displays good osmotic stress resistance as well as high temperatures resistance (~35 °C). Additionally, it has the ability to ferment molasses to produce rum and other molasses-based spirits. The media used in each experiment is shown in Table 1. The media was made by mixing unsulfured blackstrap molasses (Golden Barrel, Honey Brook, PA, USA), sucrose, yeast extract, and distilled water. The media without added yeast extract (Formulation 1) was used for the experiments with a low concentration of FAN, whilst the supplemented media (Formulation 2) was used in the experiments with a high concentration of FAN. Four liters of media were fermented in each set of experiments with an initial sugar concentration of ~24% (w/w).

Table 1.
Media composition used in all fermentation trials.
2.3. Yeast Propagation
To create a consistent inoculum for each fermentation, the yeast were rehydrated and propagated in increasing quantities before each fermentation for a total of 48 h at 35 °C. Rehydration was performed using sterile tap water at 35 °C for 15 min as suggested by the supplier. The first half of the yeast propagation started with 25 × 106 cells/mL of rehydrated viable yeast that were pitched into five 250 mL flasks containing 150 mL of Formulation 2 diluted to 15% w/w of sugar concentration and propagated for 24 h at 35 °C with agitation. Washed yeast was obtained by centrifuging yeast at 5000 RPM for 5 min. The supernatant was discarded and the yeast were resuspended in an equal volume of sterile distilled water and mixed using a vortex. This process was repeated three times to completely wash the residual sugars from the broth. Sterile water was used to wash yeast based on typical industrial harvesting and washing practices. Yeast was washed in between the two phases of propagation. For the second half of propagation, 25 × 106 cells/mL of viable washed yeast was pitched into eight 500 mL flasks each containing 350 mL of Formulation 2 for an additional 24 h at 35 °C with agitation. The propagated yeast were washed and used in the fermentation. After the 48 h propagation process, a consistent inoculum with high viability (>95%) was obtained. The propagated yeast were washed and used in the fermentation process.
2.4. Fermentation
Each fermentation was carried out in stainless steel vessels with a volume capacity of 5 L and a glass condenser attached to the top. The condensers were maintained at 5 °C to retain evaporated volatile ethanol during fermentations. Vacuum pressure was generated using the Bernoulli principle through a water aspirator attached to the system. Figure 1 shows a diagram of the equipment used during the fermentations, including the vacuum generator used. Four liters of media were poured into each vessel and oxygenated with a flow rate of 1200 L/h of oxygen for two minutes. Approximately, 35 × 106 viable yeast cells were pitched into the media and shaken for 30 s. Vacuum pressure was applied 6.5 h after the pitching when dissolved O2 was depleted and CO2 bubbles were observed in the water trap. Each fermenter was sampled throughout the fermentation with the initial sample taken immediately after pitching. A sample of 125 mL was taken every 4 to 12 h depending on the progression of the fermentation.
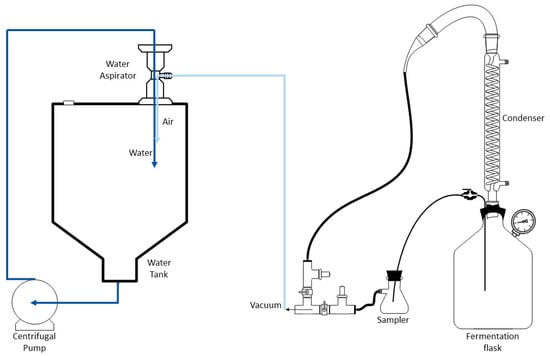
Figure 1.
Diagram of equipment used during fermentation experiments. Water aspirator was attached to the fermentation vessel (flask) during low pressure fermentation and was maintained at 24.1 kPa.
2.5. Measured Fermentation Attributes
Cells in suspension were counted using a hemocytometer at a 400× magnification as described by the American Society of Brewing Chemists (ASBC) Yeast-4 method [41]. Yeast viability was assessed using the methylene blue technique described by Painting and Kirsop [42], due to its simplicity and common use in the industry. The levels of FAN were determined through absorbance readings at 570 nm using ninhydrin (dye) and glycine as the standard as described by the ASBC Wort-12 method [43]. Sugar consumption and ethanol production were analyzed with an alcohol and extract meter ALEX 500 (Anton-Paar, Houston, TX, USA) using filtered and degassed samples. These samples were obtained after centrifuging them at 5000 RPM for 5 min and mixing with diatomaceous earth (0.1% (w/v)).
2.6. Models
Cells in suspension data were modelled using the step model described by Rudolph et al. [44]. This model illustrates the maximum number of cells in suspension and the final number of cells in suspension obtained in each fermentation. Sugar consumption and ethanol production were modelled using the logistic 4P model as described in the ASBC Yeast-14 method [45]. Ethanol production rate of each fermentation was determined using the first derivative of the logistic 4P model with respect to time as described by Guadalupe-Daqui et al. [33].
2.7. Measurement of Yeast Morphology
Yeast cross-sectional area (CSA) and vacuolar ratio were assessed using the method described by Guadalupe-Daqui et al. [33]. A sample with 0.01%(w/v) methylene blue solution was made to differentiate viable from dead cells. A total of 1 μL of sample was smeared onto a microscope slide using a Fisherbrand disposable inoculating loop (Pittsburgh, PA, USA). Between 8 and 13 microscope images for every sample were captured using a Nikon Eclipse Ci-L microscope at 1000× magnification, combining a 100× oil immersion objective and a 10× eyepiece. ImageJ v1.8.0 software (Madison, WI, USA) was used to measure various cell properties including the average yeast cell CSA, total yeast CSA within an image, and the vacuolar CSA of 200–600 yeast cells per sampling time. Figure 2 shows a graphic representation of the morphological measurements taken in this study.
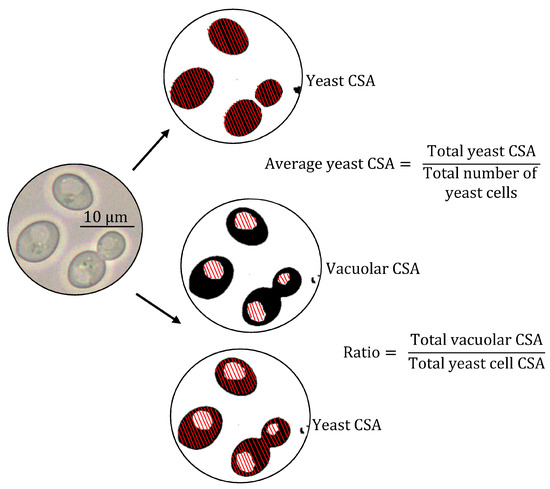
Figure 2.
Graphic representation and calculation of the morphological properties: average yeast cell cross-sectional area (CSA) and vacuolar ratio. The left circle image is a microscope image taken during fermentation (1000×). Right circle images are after image processing for the automated analysis with the red shading representing the variable collected.
2.8. Statistical Analysis
The data collected were statistically analyzed using GraphPad Prism version 8.00 for Windows (GraphPad Software, La Jolla, CA, USA). The models were plotted with a 95% confidence interval. The data were subjected to two-way analysis of variance (ANOVA) to determine statistical significance with Tukey post-hoc tests with a significance level of p < 0.05.
3. Results and Discussion
3.1. Fermentation Attributes
The data from all fermentations were grouped into four sets based on fermentation temperature and initial FAN concentrations, each having two pressure variants as shown in Table 2. All assessments of significance were calculated with a 95% confidence interval.
Table 2.
Setup of extrinsic factors under each fermentation configuration.
3.1.1. Sugar Consumption
The decrease in sugar concentration over time for all fermentations is shown in Figure 3. These data were used to calculate the sugar consumption rate of each fermentation, as well as to determine the fermentation end points. The sugar consumption data were modelled using a Logistic 4P model.
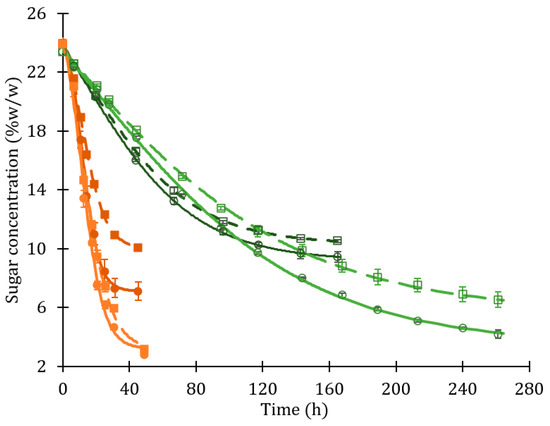
Figure 3.
Sugar concentration during each fermentation configuration: LTHF (orange); HTHF (dark orange); LTLF (green); HTLF (dark green). Fermentations were performed in duplicate. Models were obtained using a Logistic 4P model, with a 95% confidence interval and the error bars represent the standard deviation of the data. The data shown represent sugar concentration under vacuum (circles) and atmospheric conditions (squares); sugar concentration model under vacuum (continuous lines) and atmospheric pressure (dotted lines).
Overall sugar consumption was faster (up to ~85%) in fermentations with a high concentration of FAN (LTHF and HTHF) compared to fermentations with a low concentration of FAN (LTLF and HTLF). This allowed the high FAN fermentations to conclude in under 50 h, compared to at least 150 h for the low FAN versions. The final sugar concentrations were substantially lower when fermenting at low temperatures (30 °C) as opposed to high temperatures (35 °C), with the total sugar consumed being ~30–40% greater in the low temperature fermentations. When fermenting under vacuum pressure, a ~0–12% increase in the total amount of sugar consumption was observed compared to control.
Figure 4 shows the ethanol concentration data, modelled using a Logistic 4P model, and the ethanol production rate, calculated by taking the first derivative of the model. Each parameter assessed had a significant effect upon the overall fermentation and by changing the parameters of the fermentation, the final ethanol concentration could be adjusted by up to 9% w/w.
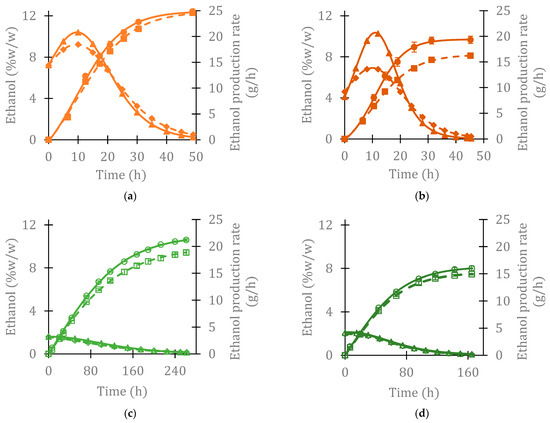
Figure 4.
Ethanol concentration and production rate during each fermentation configuration: (a) LTHF (orange); (b) HTHF (dark orange); (c) LTLF (green); (d) HTLF (dark green). Fermentations were performed in duplicate. Models were obtained using a Logistic 4P model with a 95% confidence interval. The error bars represent the standard deviation of the data. The data shown represent ethanol concentration data under vacuum (circles) and atmospheric pressure (squares); ethanol concentration model under vacuum (continuous lines) and atmospheric pressure (dotted lines); ethanol production rate under vacuum (up-pointing triangles and continuous lines) and atmospheric pressure (diamonds and dotted lines).
3.1.2. Cells in Suspension
The eight fermentation configurations were further analyzed to determine the number of suspended viable yeast cells throughout each fermentation [44]. The cell in suspension models were obtained using the step model described by Rudolph (2019). Fermentations with high levels of FAN (Figure 5a,b) resulted in more cells in suspension (up to 3 times more) compared to the fermentations with low FAN levels (Figure 5c,d). This trend was expected based on the literature [3]. Independent of FAN concentration, more cells in suspension (up to 50%) were reached when fermentations were run at 30 °C (Figure 5a,c) in comparison to 35 °C (Figure 5b,d). When fermenting under vacuum, more cells in suspension were observed compared to atmospheric conditions for LTHF (37% increase), HTHF (24% increase), and LTLF (44% increase). Under HTLF conditions, the data for vacuum and atmospheric cells in suspension were not significantly different (Figure 5d). The number of cells in suspension correlated with fermentation rate across all fermentation configurations.
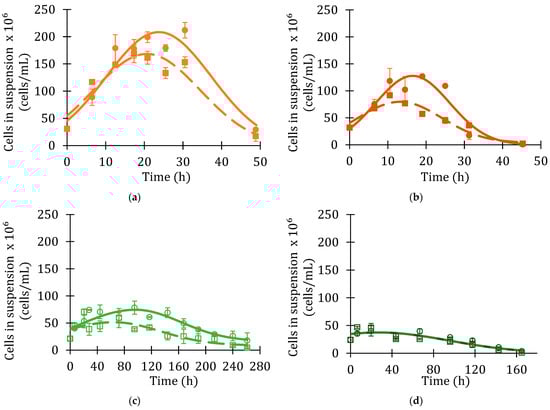
Figure 5.
Viable cells in suspension throughout each fermentation configuration: (a) LTHF (orange); (b) HTHF (dark orange); (c) LTLF (green); (d) HTLF (dark green). Fermentations were performed in duplicate. Models were obtained using a step model, with a 95% confidence interval and the error bars represent the standard deviation of the data. The data shown represent cells in suspension under vacuum (circles) and atmospheric pressure (squares); high FAN (filled) and low FAN (empty); high temperature (darker shade) and low temperature (lighter shade). Cells in suspension model under vacuum (continuous lines) and atmospheric pressure (dotted lines).
3.1.3. Cell Viability
Yeast viability over the progression of each fermentation configuration with respect to ethanol concentration is shown in Figure 6. Under low temperature and high FAN concentration, the highest ethanol tolerance was achieved, compared to the other experimental configurations. Under these conditions, viability remained high (>90%) until the end of the fermentation (when ethanol concentration is assumed to have reached a toxic level for the yeast). On the contrary, the HTLF fermentation viability dropped immediately after pitching and exhibited the lowest ethanol tolerance. Fermentations with a high FAN concentration (Figure 6a,b) improved the yeast’s ethanol tolerance compared to the fermentations with a low FAN concentration (Figure 6c,d). Similarly, fermenting under vacuum pressure increased the apparent ethanol tolerance compared to fermentations at atmospheric pressure. The yeast showed a higher ethanol tolerance when fermenting at a low temperature (Figure 6a,c) compared to a high temperature (Figure 6b,d).
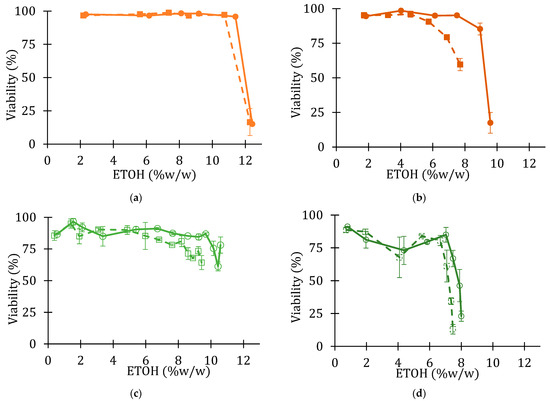
Figure 6.
Yeast cell viability plotted against ethanol concentration: (a) LTHF (orange); (b) HTHF (dark orange); (c) LTLF (green); (d) HTLF (dark green). Fermentations were performed in duplicate. Error bars represent the standard deviation of the data. The data shown represent yeast viability under vacuum (circles and continuous lines) and atmospheric pressure (squares and dotted lines); high FAN (filled) and low FAN (empty); high temperature (darker shade) and low temperature (lighter shade).
These results indicate a general increase in both cell viability and number of yeast cells in suspensions for fermentations run with more FAN, low pressure, and the lower tested temperature. All these points suggest a reduction in stresses upon the yeast population, promoting growth and ethanol tolerance. The FAN and temperature results were expected, but the vacuum fermentation remains less thoroughly studied. CO2 has previously been identified as a yeast growth inhibitor, especially at high concentrations [2]. This correlates the vacuum pressure with a reduction in dissolved CO2, resulting in an increase in cell viability. Notably the pressure effect was not observed when the fermentation was run at a high temperature with a lack of nutrients. This suggests that brewers could use reduced pressure fermentation techniques to help mitigate the drawbacks of higher temperatures on fermentation, as long as there are sufficient nutrients present. Reduced pressure fermentation techniques could also be used to increase fermentation rate more generally (through promoting cell growth) as the yeast are potentially less stressed by dissolved CO2.
3.2. Yeast Morphology Assessment
Automated image analysis was performed on samples to assess various parameters including the cross-sectional area and the vacuole size.
3.2.1. Yeast CSA
Figure 7 shows the average yeast cell CSA from each fermentation. A higher yeast cell CSA was observed at high FAN concentrations (Figure 7a,b) compared to low FAN concentrations (Figure 7c,d). FAN concentrations have been directly linked to yeast dimensions by previous studies [7,34], which also suggests that a high initial FAN concentrations fosters multiple buddings and mature yeast [46]. The decreases in CSA at the end of the fermentations is likely linked to the yeast viability drop (Figure 6) due to susceptibility to high ethanol concentrations [15]. While differences were observed between the various environmental parameters, pressure did not make a significant difference in yeast CSA.
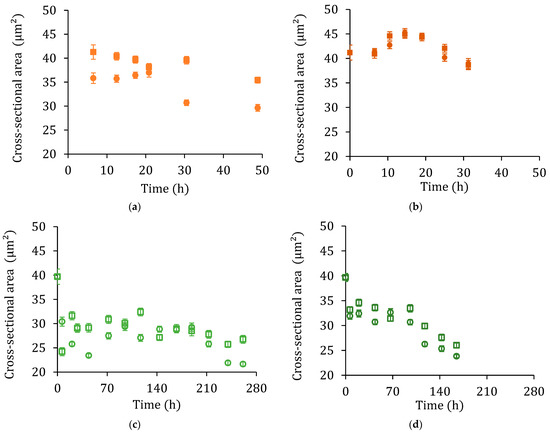
Figure 7.
Average overall yeast cell CSA plotted over time: (a) LTHF (orange); (b) HTHF (dark orange); (c) LTLF (green); (d) HTLF (dark green). Fermentations were performed in duplicate. The data shown represent yeast cell CSA under vacuum (circles) and atmospheric pressure (squares); high FAN (filled) and low FAN (empty); high temperature (darker shade) and low temperature (lighter shade); viability (crosses).
3.2.2. Vacuolar Ratio
When the results from yeast CSA proved unhelpful in predicting the yeasts’ behavior (as the size of yeast varied between fermentation parameters and fermentation time), the image analysis software was used in combination with multivariate statistics to identify other image characteristics that correlated to yeast performance independent of fermentation parameters. From this analysis, it was found that the ratio between vacuole size and cell size behaved in a predictable manner. Yeast vacuoles are spherical organelles that store and breaks down nutrients [47]; a larger size has been found to be optimal for cell growth and higher viability in stored yeast [48]. Alone, the vacuole CSA did not correlate with any assessed parameter (data not shown), as it partially depended upon the size of the yeast (which was already variable) as well as changes in response to cell states and stresses [49]. Of the many combinations of automatically assessed parameters, the ratio between vacuole CSA and yeast CSA (Figure 3) showed promise as a yeast attribute to assess the fermentation environment by correlating with measured parameters (p > 0.05) as described by Guadalupe-Daqui et al. [33]. Figure 8 shows the vacuolar ratio over time, as well as the yeast viability.
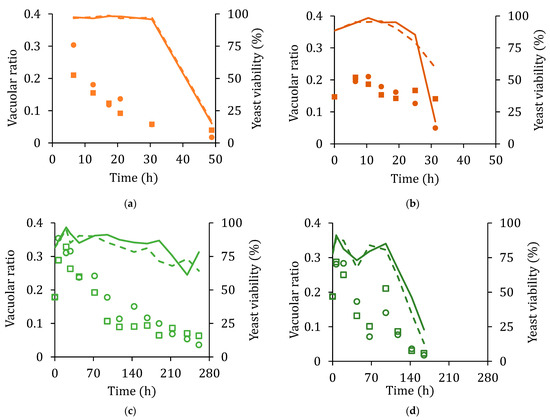
Figure 8.
Vacuolar ratio (total vacuolar CSA to total yeast cell CSA) plotted over time: (a) LTHF (orange); (b) HTHF (dark orange); (c) LTLF (green); (d) HTLF (dark green). Fermentations were performed in duplicate. The data shown represent vacuolar ratio under vacuum (circles) and atmospheric conditions (squares); high FAN (filled) and low FAN (empty); high temperature (darker shade) and low temperature (lighter shade); yeast viability (continuous and dotted lines).
The vacuolar ratio decreased throughout each fermentation process, however, in all fermentations the viability of the yeast population dropped when the ratio reached ~0.05 (Figure 7). These results show a correlation between the average cell area occupied by vacuoles and viability with higher stress fermentation having a higher slope and ending at lower ethanol concentrations. This suggests that the vacuolar ratio can be used as a stress indicator, so a brewer can measure the vacuolar ratio of an ongoing fermentation (using automated image analysis) to gain insight on the effect of various stresses on their yeast populations (from all sources including temperature, nutrient availability, and presence of dissolved CO2). In order to obtain a larger ratio (suggesting a less stressed yeast population), brewers and distillers could aim to employ a fermentation technique with more optimal temperatures or reduced CO2 concentrations. This proposes the possibility of using automated yeast imaging in the brewing industry to quickly detect unexpected stress on the yeast populations, or to allow quick iteration of experimental fermentation designs.
4. Conclusions
In this research, the three extrinsic factors of initial FAN concentration, pressure, and temperature were selected to assess their effect on fermentation attributes and yeast morphology. The parameter that had the most effect on ethanol concentration was the initial FAN concentration, while the rate was most affected by temperature (as was expected from the literature). When the pressure was reduced, the final ethanol concentration increased as did the fermentation rate for all but the low temp/high FAN condition. This finding was supported by the literature that found vacuum conditions improved fermentations when yeast stress was impacted by external conditions.
An additional finding of this study was that as the fermentation progressed, the ratio of vacuole to cell size showed correlations with viability. The slope of the decrease in the ratio was dependent upon external conditions, and as the fermentation was performed in less ideal conditions (high temp/low FAN), the slope increased. The findings of this research could be used to estimate how aspects of the fermentation process, including yeast biomass, rate, or final ethanol concentrations will respond to extrinsic factors. They also suggest potential uses of multivariant automated image analysis as a tool for brewers, allowing quick identification of stress in yeast populations.
Author Contributions
Conceptualization, M.G.-D.; methodology, M.G.-D., A.J.M. and P.J.S.; software, M.C.; validation, M.G.-D.; formal analysis, M.G.-D., A.J.M. and R.M.G.-S.; investigation, M.G.-D. and M.C.; resources, A.J.M. and P.J.S.; data curation, M.G.-D., M.C., R.M.G.-S. and A.J.M.; writing—original draft preparation, M.G.-D., M.C. and A.J.M.; writing—review and editing, M.G.-D., M.C. and A.J.M.; visualization, M.G.-D.; supervision, A.J.M. and R.M.G.-S.; project administration, A.J.M. All authors have read and agreed to the published version of the manuscript.
Funding
This research received no external funding.
Institutional Review Board Statement
Not applicable.
Informed Consent Statement
Not applicable.
Data Availability Statement
Data presented within the article.
Acknowledgments
The authors would like to acknowledge Lallemand Inc. for the donation of the yeast used throughout this research, the Food Science and Human Nutrition department at the University of Florida for use of their facilities, and Ian MacIntosh for the technical and writing support provided during the development of this manuscript.
Conflicts of Interest
The authors declare no conflict of interest.
References
- Guadalupe-Daqui, M.; MacIntosh, A.J. Rapid beer fermentation: The effect of vacuum pressure on a pilot scale lager fermentation. J. Am. Soc. Brew. Chem. 2019, 77, 235–242. [Google Scholar] [CrossRef]
- Dixon, N.M.; Kell, D.B. The inhibition by CO2 of the growth and metabolism of micro-organisms. J. Appl. Bacteriol. 1989, 67, 109–136. [Google Scholar] [CrossRef]
- Lekkas, C.; Stewart, G.G.; Hill, A.E.; Taidi, B.; Hodgson, J.A. The importance of free amino nitrogen in wort and beer. Tech. Q. 2005, 42, 113–116. [Google Scholar]
- Cysewski, G.R.; Wilke, C.R. Rapid ethanol fermentations using vacuum and cell recycle. Biotech. Bioeng. 1977, 19, 1125–1142. [Google Scholar] [CrossRef]
- Nguyen, V.; Kosuge, H.; Auresenia, J.; Tan, R.; Brondial, Y. Effect of vacuum pressure on ethanol fermentation. J. Appl. Sci. 2009, 9, 3020–3026. [Google Scholar] [CrossRef]
- Ramalingham, A.; Finn, R.K. Vacuferm process: A new approach to fermentation alcohol. Biotech. Bioeng. 1977, 19, 583–589. [Google Scholar] [CrossRef]
- Lekkas, C.; Stewart, G.G.; Hill, A.E.; Taidi, B.; Hodgson, J.A. Elucidation of the role of nitrogenous wort components in yeast fermentation. J. Inst. Brew. 2007, 113, 3–8. [Google Scholar] [CrossRef]
- Paik, J.; Low, N.H.; Ingledew, W.M. Malt extract relationship of chemical composition to fermentability. J. Am. Soc. Brew. Chem. 1990, 49, 8–13. [Google Scholar] [CrossRef]
- Piddock, M.P.; Kreisz, S.; Heldt-Hansen, H.P.; Nielsen, K.F.; Olsson, L. Physiological characterization of brewer’s yeast in high-gravity beer fermentations with glucose or maltose syrups as adjuncts. Appl. Microbiol. Biotechnol. 2009, 84, 453–464. [Google Scholar] [CrossRef]
- Fernández, S.; Machuca, N.; González, M.G.; Sierra, J.A. Accelerated fermentation of high-gravity worts and its effect on yeast performance. J. Am. Soc. Brew. Chem. 1985, 43, 109–113. [Google Scholar] [CrossRef]
- White, J.; Munns, D.J. Influence of temperature on yeast growth and fermentation. J. Inst. Brew. 1951, 57, 280–284. [Google Scholar] [CrossRef]
- Mo, F.; Zhao, H.; Lei, H.; Zhao, M. Effects of nitrogen composition on fermentation performance of brewer’s yeast and the absorption of peptides with different molecular weights. Appl. Biochem. Biotech. 2013, 171, 1339–1350. [Google Scholar] [CrossRef]
- Almeida, R.B.; Almeida e Silva, J.B.; Lima, U.A.; Silva, D.P.; Assis, A.N. Evaluation of fermentation parameters during high-gravity beer production. Braz. J. Chem. Eng. 2019, 18, 459–465. [Google Scholar] [CrossRef]
- Lei, H.; Zhao, H.; Yu, Z.; Zhao, M. Effects of wort gravity and nitrogen level on fermentation performance of brewer’s yeast and the formation of flavor volatiles. Appl. Biochem. Biotech. 2012, 166, 1562–1574. [Google Scholar] [CrossRef]
- D’Amore, T.; Panchal, C.J.; Russell, I.; Stewart, G.G. A study of ethanol tolerance in yeast. Crit. Rev. Biotech. 1990, 9, 287–304. [Google Scholar] [CrossRef]
- Ruis, H.; Schüller, C. Stress signaling in yeast. BioEssays 1995, 17, 959–965. [Google Scholar] [CrossRef]
- Martinez-Pastor, M.T.; Marchler, G.; Schuller, C.; Marchler-Bauer, A.; Ruis, H.; Estruch, R. The Saccharomyces cerevisiae zinc finger proteins Msn2p and Msn4p are required for transcriptional induction through the stress response element (STRE). EMBO J. 1996, 15, 2227–2235. [Google Scholar] [CrossRef]
- Schmitt, A.P.; McEntee, K. Msn2p, a zinc finger protein, is the transcriptional activator of the multistress response in Saccharomyces cerevisiae. Proc. Natl. Acad. Sci. USA 1996, 93, 5777–5782. [Google Scholar] [CrossRef]
- Chatterjee, M.T.; Khalawan, S.A.; Curran, B.P.G. Cellular lipid composition influences stress activation of the yeast general stress response element (STRE). Microbiol. Read. 2000, 146, 877–884. [Google Scholar] [CrossRef]
- Gibson, B.R.; Lawrence, S.J.; Leclaire, J.P.R.; Powell, C.D.; Smart, K.A. Yeast responses to stresses associated with industrial brewery handling. FEMS Microbes. 2007, 31, 535–569. [Google Scholar] [CrossRef]
- Saini, P.; Beniwal, A.; Kokkiligadda, A.; Vij, S. Response and tolerance of yeast to changing environmental stress during ethanol fermentation. Proc. Biochem. 2018, 72, 1–12. [Google Scholar] [CrossRef]
- Wang, J.; Ding, H.; Zheng, F.; Li, Y.; Liu, C.; Niu, C.; Li, Q. Physiological changes of beer brewer’s yeast during serial beer fermentation. J. Am. Soc. Brew. Chem. 2019, 77, 10–20. [Google Scholar] [CrossRef]
- Zakhartsev, M.; Reuss, M. Cell size and morphological properties of yeast Saccharomyces cerevisiae in relation to growth temperature. FEMS Yeast Res. 2018, 18, foy052. [Google Scholar] [CrossRef]
- Pratt, P.; Bryce, J.; Stewart, G.G. The yeast vacuole—A scanning electron microscopy study during high gravity wort fermentations. J. Inst. Brew. 2007, 113, 50–60. [Google Scholar] [CrossRef]
- Mansure, J.J.C.; Panek, A.D.; Crowe, L.M.; Crow, J.H. Trehalose inhibits ethanol effects on intact yeast cells and liposomes. Int. J. Biochem. and Biophy. 1994, 1191, 309–316. [Google Scholar] [CrossRef] [PubMed]
- Izawa, S.; Ikeda, K.; Miki, T.; Wakai, Y.; Inoue, Y. Vacuolar morphology of Saccharomyces cerevisiae during the process of wine making and Japanese sake brewing. Appl. Microbiol. Biotech. 2010, 88, 277–282. [Google Scholar] [CrossRef]
- Pratt, P.; Bryce, J.; Stewart, G.G. The effects of osmotic pressure and ethanol on yeast viability and morphology. J. Inst. Brew. 2003, 109, 218–228. [Google Scholar] [CrossRef]
- Coelho, M.; Belo, I.; Pinheiro, R.; Amaral, A.; Mota, M.; Coutinho, J.; Ferreira, E. Effect of hyperbaric stress on yeast morphology: Study by automated image analysis. Appl. Microbiol. Biotech. 2004, 66, 318–324. [Google Scholar] [CrossRef]
- Ginovart, M.; Carbó, R.; Blanco, M.; Portell, X. Digital image analysis of yeast single cells growing in two different oxygen concentrations to analyze the population growth and to assist individual-based modeling. Front. Microbiol. 2018, 8, 2628. [Google Scholar] [CrossRef]
- Stolze, N.; Bader, C.; Henning, C.; Mastin, J.; Holmes, A.; Sutlief, A. Automated image analysis with ImageJ of yeast colony forming units from cannabis flowers. J. Microbiol. Meth. 2019, 164, 105681. [Google Scholar] [CrossRef]
- Wilson, C.; Lukowicz, R.; Merchant, S.; Valquier-Flynn, H.; Caballero, J.; Sandoval, J.; Okuom, M.; Huber, C.; Brooks, T.D.; Wilson, E.; et al. Quantitative and qualitative assessment methods for biofilm growth: A mini-review. Res. Rev. J. Eng. Technol. 2017, 6, 1–42. [Google Scholar]
- Grishagin, I.V. Automatic cell counting with ImageJ. Anal. Biochem. 2015, 473, 63–65. [Google Scholar] [CrossRef] [PubMed]
- Guadalupe-Daqui, M.; Chen, M.; Thompson-Witrick, K.A.; MacIntosh, A.J. Yeast morphology assessment through automated image analysis during fermentation. Fermentation 2021, 7, 44. [Google Scholar] [CrossRef]
- Hill, A.E.; Stewart, G.G. Free amino nitrogen in brewing. Fermentation 2019, 5, 22. [Google Scholar] [CrossRef]
- Pugh, T.A.; Maurer, J.M.; Pringle, A.T. The impact of wort nitrogen limitation on yeast fermentation performance and diacetyl. Tech. Q. 1997, 34, 185–189. [Google Scholar]
- Jones, B.L.; Budde, A.D. How various malt endoproteinase classes affect wort soluble protein levels. J. Cereal Sci. 2005, 41, 95–106. [Google Scholar] [CrossRef]
- Liu, C.; Li, K.; Wen, Y.; Geng, B.; Liu, Q.; Lin, Y. Chapter One—Bioethanol: New opportunities for an ancient product. In Advances in Bioenergy; Li, Y., Ge, X., Eds.; Elsevier: Amsterdam, The Netherlands, 2019; Volume 4, pp. 1–34. [Google Scholar]
- Reddy, L.; Reddy, O. Effect of fermentation conditions on yeast growth and volatile composition of wine produced from mango (Mangifer indica L.) fruit juice. Food Bioprod. Proc. 2011, 89, 487–491. [Google Scholar] [CrossRef]
- Torija, M.; Rozès, N.; Poblet, M.; Guillamón, J.; Mas, A. Effects of fermentation temperature on the strain population of Saccharomyces cerevisiae. Int. J. Food Microbiol. 2003, 80, 47–53. [Google Scholar] [CrossRef]
- Camargos, C.V.; Moraes, V.D.; de Oliveira, L.M.; Guidini, C.Z.; Ribeiro, E.J.; Santos, L.D. High gravity and very high gravity fermentation of sugarcane molasses by flocculating Saccharomyces cerevisiae: Experimental investigation and kinetic modeling. Appl. Biochem. Biotech. 2021, 193, 807–821. [Google Scholar] [CrossRef]
- ASBC Methods of Analysis, online. Method Yeast-4. MICROSCOPIC YEAST CELL COUNTING. Approved (1958), Rev. (2016). American Society of Brewing Chemists, St. Paul, MN, USA. Available online: https://www.asbcnet.org/Methods/About/Pages/Cite.aspx (accessed on 31 December 2022).
- Painting, K.; Kirsop, B. A quick method for estimating the percentage of viable cells in a yeast population, using methylene blue staining. World J. Microbiol. Biotechnol. 1990, 6, 346–347. [Google Scholar] [CrossRef]
- ASBC Methods of Analysis, Online. Method Wort-12. Ninhydrin Method (International Method). Approved (1975 ), Rev. (2010). American Society of Brewing Chemists, St. Paul, MN, USA. Available online: http://dx.doi.org/10.1094/ASBCMOA-Wort-12 (accessed on 31 December 2022).
- Rudolph, A.; MacIntosh, A.J.; Speers, R.A.; St. Mary, C. Modeling Yeast in Suspension during Laboratory and Commercial Fermentations to Detect Aberrant Fermentation Processes. J. Am. Soc. Brew. Chem. 2020, 78, 63–73. [Google Scholar] [CrossRef]
- ASBC Methods of Analysis, online. Method Yeast-14. MINIATURE FERMENTATION ASSAY. Approved (2011). American Society of Brewing Chemists, St. Paul, MN, USA. Available online: http://dx.doi.org/10.1094/ASBCMOA-Yeast-14 (accessed on 31 December 2022).
- Powell, C.D.; Quain, D.E.; Katherine, S.A. The impact of brewing yeast cell age on fermentation performance, attenuation and flocculation. FEMS Microbiol. 2003, 3, 149–157. [Google Scholar] [CrossRef] [PubMed]
- Stewart, G.G.; Russel, I.; Anstruther, A. Handbook of Brewing; CRC Press: Boca Raton, FL, USA, 2017. [Google Scholar]
- Jin, Y.; Weisman, L.S. The vacuole/lysosome is required for cell-cycle progression. eLife 2015, 4, e08160. [Google Scholar] [CrossRef] [PubMed]
- Chan, Y.M.; Wallace, M.F. Organelle size scaling of the budding yeast vacuole is tuned by membrane trafficking rates. Biophys. J. 2014, 106, 1986–1996. [Google Scholar] [CrossRef] [PubMed]


Disclaimer/Publisher’s Note: The statements, opinions and data contained in all publications are solely those of the individual author(s) and contributor(s) and not of MDPI and/or the editor(s). MDPI and/or the editor(s) disclaim responsibility for any injury to people or property resulting from any ideas, methods, instructions or products referred to in the content. |
© 2023 by the authors. Licensee MDPI, Basel, Switzerland. This article is an open access article distributed under the terms and conditions of the Creative Commons Attribution (CC BY) license (https://creativecommons.org/licenses/by/4.0/).