Article

Strategies for the Biotransformation of Tung Leaves in Bioethanol Fermentation

1
State Key Laboratory of Utilization of Woody Oil Resource, Hunan Academy of Forestry, Changsha 410004, China
2
Key Laboratory of New Materials and Facilities for Rural Renewable Energy (Ministry of Agriculture and Rural Affaires of China), Henan Agricultural University, Zhengzhou 450002, China
*
Authors to whom correspondence should be addressed.
Fermentation 2023, 9(11), 986; https://doi.org/10.3390/fermentation9110986
Submission received: 17 October 2023 / Revised: 16 November 2023 / Accepted: 16 November 2023 / Published: 19 November 2023
(This article belongs to the Section Industrial Fermentation)

Abstract

:
The tung tree (Vernicia fordii Hemsl.), as a woody oilseed crop, has been cultivated in China for thousands of years, and its leaves are rich in cellulose and proteins. The tung leaf is an alternative raw material for the traditional ethanol fermentation of food crops. In this work, the effects of the simultaneous saccharification fermentation of tung leaves at different substrate concentrations on gas production characteristics, reducing sugars, pH, oxidation–reduction potential (ORP), and ethanol yield were investigated during bioethanol production. In addition, the effect of the initial fermentation pH on the ethanol fermentation of tung leaves was explored. The results showed that during bioethanol production from tung leaves, the pH of the fermentation broth showed a continuous decreasing trend. Moreover, the ORP showed a decreasing trend and then rebounded, and the concentration of reducing sugars initially increased and then decreased. The optimal ethanol yield of 4.99 g/L was obtained when the substrate concentration was 100 g/L. Changes in the initial pH have little effect on yeast activity, but such changes can affect the yeast cell wall structure and substance transport, leading to differences in the ethanol yield. When the initial pH is 7, the maximum ethanol yield is 5.22 g/L. The experimental results indicate that the utilization of tung leaves for bioethanol production has a good potential for development.

1. Introduction

China is a large oilseed-producing and -consuming country, and woody oilseed crops have a wide planting area, which is dominated by Camellia oleifera, the tung tree, and Litsea cubeba [1]. Among them, the tung tree is native to China, forming a unique economic forest, and this tree has a cultivation history of more than a thousand years. The tung tree has high oil content, widely applicable oil products, widespread popularity for planting, and a long economic life and can provide great economic benefits. In the 1990s, Chinese researchers carried out various research works, such as the variety classification of germplasm resources; the breeding of excellent families, clones, and superior trees; the sexual reproduction of tung trees; and the introduction test and correlation analysis of biological characteristics [2,3]. Large amounts of waste biomass, such as tung tree branches, leaves, and residue after oil production, are produced during tung tree growth and oil production. Utilizing these biomasses for biotransformation can not only reduce carbon dioxide emission and promote the carbon cycle but also produce biofuel and enable green development [4,5].
Biologically produced ethanol has a wide range of degradable substrates and a simple production process, and the products are easily stored and transferred [6,7]. However, the raw materials for the first generation of ethanol production are primarily based on crops (rice, corn, sweet potato, sorghum, etc.). Given the continuous and steady increase in our population and the decrease in arable land area every year, the search for low-cost feedstocks that can replace the crops used for ethanol fermentation is an urgent task. Based on the abovementioned background, considerable research has also been conducted on the production of bioethanol from second-generation biomass such as corn straws for bioethanol production. Johnston et al. [8] investigated the feasibility of replacing corn with corn stover for bioethanol production and analyzed the effects of the amount of a mixture of corn stover and corn on the yield of ethanol, the rate of fermentation, and the amount of residual sugar. Remarkable results were obtained. The effects of laccase pretreatment and surfactant addition on the simultaneous saccharification and fermentation of corn stover were studied [9]. The combination of laccase pretreatment and the addition of rhamnolipids further increased the ethanol yield. Le et al. [10] utilized ammonia pretreatment to increase the enzyme saccharification and biogenic ethanol yield of corn stover and obtained a maximum ethanol concentration of 14.5 g/L. Molaverdi et al. [11] utilized sodium carbonate pretreatment of corn stover to enhance the solid-state ethanol fermentation yield and increased the ethanol concentration from 24 to 41 g/L with a low cellulase loading (5 FPU/g of substrate) and sodium carbonate pretreatment. Stenberg et al. [12] studied the effects of the substrate concentration and cellulase load on simultaneous saccharification and ethanol production, and the results showed that ethanol production increased with the increase in the cellulase load. A low substrate concentration resulted in lactic acid production, whereas a high substrate concentration inhibited ethanol production. Existing studies on the production of ethanol from cellulose focus on the pretreatment of raw materials and the optimization of saccharification and fermentation, and studies on ethanol production from cellulose are insufficient.
Based on the literature on the resource utilization of woody oilseed crops, Hu et al. used sanguinaria to extract ethanol, isopropyl toluene, and stilbene as the basic substances for spices [13]. Zhu et al. [14] used oil tea husk treated with NaOH to obtain solid and liquid fractions. The solid fraction was hydrolyzed by a cellulase enzyme and fermented to produce ethanol, whereas the liquid fraction was oxidized to prepare vanillin-pasteurized oligo-xylan. Solid fractions containing cellulose and a small amount of xylanan at 10% xylan concentration produced 17.35 g/L of ethanol. In the study conducted by Yan et al., oil tea seed husk was pretreated by utilizing microwaves and ethanol and then enzymatically digested before preparing oligosaccharides [15]. The studies in the literature are primarily feasibility studies on using the fruit waste of woody oilseed crops, focusing on the hydrolysis saccharification efficiency of various feedstocks under different pretreatment conditions, and studies on the fermentation parameters of second-generation fermentation feedstocks were not carried out. Tung leaves have high cellulose and hemicellulose contents, and for branches and leaves produced by woody oilseed crops, as well as other waste biomass produced by ethanol fermentation, process parameter optimization is also worthy of study.
The conversion of these oleaginous leaf waste biomasses to bioethanol can lead to the high utilization of waste. Woody oilseed solid waste contains polysaccharides, acids, proteins, and other components, and these organic components can be further utilized. Bioethanol conversion using woody oilseed solid waste is also a good method of resource utilization. However, little research has been conducted on the use of woody oilseed crop solid wastes for bioethanol production. Therefore, the physicochemical properties of woody oilseed solid wastes must be analyzed in detail, and their unique physicochemical characteristics (high toxin levels, high lignin content, nutritional imbalance, etc.) have high requirements for enzymatic saccharification degradation. Moreover, the patterns of the influence and enhancement mechanism of woody oilseed solid wastes on bioethanol must be further investigated.
In this study, the feasibility of bioethanol production from tung leaves was investigated using tung leaves as the substrate and Saccharomyces cerevisiae as the ethanol-producing bacterium. By adjusting the concentration of the substrate and the initial pH, the liquid-phase characteristics during bioethanol production were analyzed in detail, and the optimal process for ethanol production from tung leaves was explored.

2. Materials and Methods

2.1. Experimental Materials

Tung leaves were provided by the Hunan Academy of Forestry (cellulose, hemicellulose, and lignin fractions of 40.8%, 24.2%, and 14.1%, respectively). The leaves were crushed to destroy the crystalline structure of cellulose and reduce the crystallinity and then passed through a 60-mesh sieve. Cellulase: 51 FPU/mL (Novozymes Biotechnology Co., Ltd., Copenhagen, Denmark). S. cerevisiae: brewer’s high-activity dry yeast (Angel Yeast Co., Ltd., Yichang, China).

2.2. Experimental Methods

Experiments were conducted using 200 mL conical flasks as fermentation reactors. First, 1, 10, 20, 30, or 40 g of tung leaf powder was weighed into a conical flask, and 200 mL of distilled water was added to the mix with tung leaf powder. Cellulase was added at a concentration of 0.1 mL/g tung leaves. Then, 0.2 g of brewer’s high-activity dry yeast was added to the bottle. Finally, the mixture was shaken well to fully mix the enzyme and yeast with the reaction material. The temperature of the thermostatic incubator was adjusted to 30 °C. Data were measured and recorded every 2 h in the first 10 h. Afterward, data were measured and recorded every 12 h.
In exploring the influence of the initial pH on bioethanol production, leaves of the tung tree with the same substrate concentration (100 g/L) were added to the conical bottles, and then the pH of the solutions in the five flasks was adjusted to 4.0, 5.0, 6.0, 7.0, and 8.0 with NaOH solution and sulfuric acid solution. The following experiments were performed using the same steps as those used in the first experiment.
Each experiment was conducted in triplicate.

2.3. Test Method

A gas chromatograph (7090B, Agilent Technologies, Inc., Santa Clara, USA) was used to measure the ethanol concentration with a DB_FFAP column type. The temperature of the column box was 40 °C; the inlet temperature of the sample was 250 °C; the detector temperature was 300 °C; the pressure was 10 psi; the flow of the chromatographic column was 2.396 mL/min; and the temperature of the valve box was 44.1 °C [16]. The pH of the reaction solution was tested using a pH meter (PHSJ-6L, INESA (Group) Co., Ltd., Shanghai, China). The oxidation–reduction potential (ORP) of the reaction solution was measured using an ORP meter (SX 712, Shanghai San-Xin Instrumentation, Inc., Shanghai, China). The reducing sugar concentration was measured at OD540 nm using a visible spectrophotometer (721, Shanghai Metash Instruments Co., Ltd., Shanghai, China) [17].

2.4. Energy Conversion Efficiency Analysis

The energy conversion efficiency of ethanol fermentation using tung leaves is given by Equation (1):
E = m e t h a n o l × Q e t h a n o l m t u n g   l e a v e s × Q t u n g   l e a v e s × 100 %
where E is the energy conversion efficiency of ethanol fermentation, %; m t u n g   l e a v e s and m e t h a n o l are the masses of tung leaves and ethanol, g; and Q t u n g   l e a v e s and Q e t h a n o l are the calorific values of tung leaves and ethanol, which are 14,635 J/g and 26,780 J/g, respectively.

2.5. Kinetic Analysis

The Gompertz equation was used to analyze the kinetics of the ethanol fermentation of tung leaves [4]. The Gompertz equation is as follows [18]:
P t = P m e x p e x p R m e P m λ t + 1
P t represents the actual ethanol production; t is the fermentation time; e is a constant, which is 2.718; and P m , R m , and λ represent the maximum ethanol production potential, maximum ethanol production rate, and fermentation delay period, respectively.
Statistical analyses of kinetics and ANOVA were performed using Origin software. p < 0.05 was regarded as statistically significant.

3. Results and Discussion

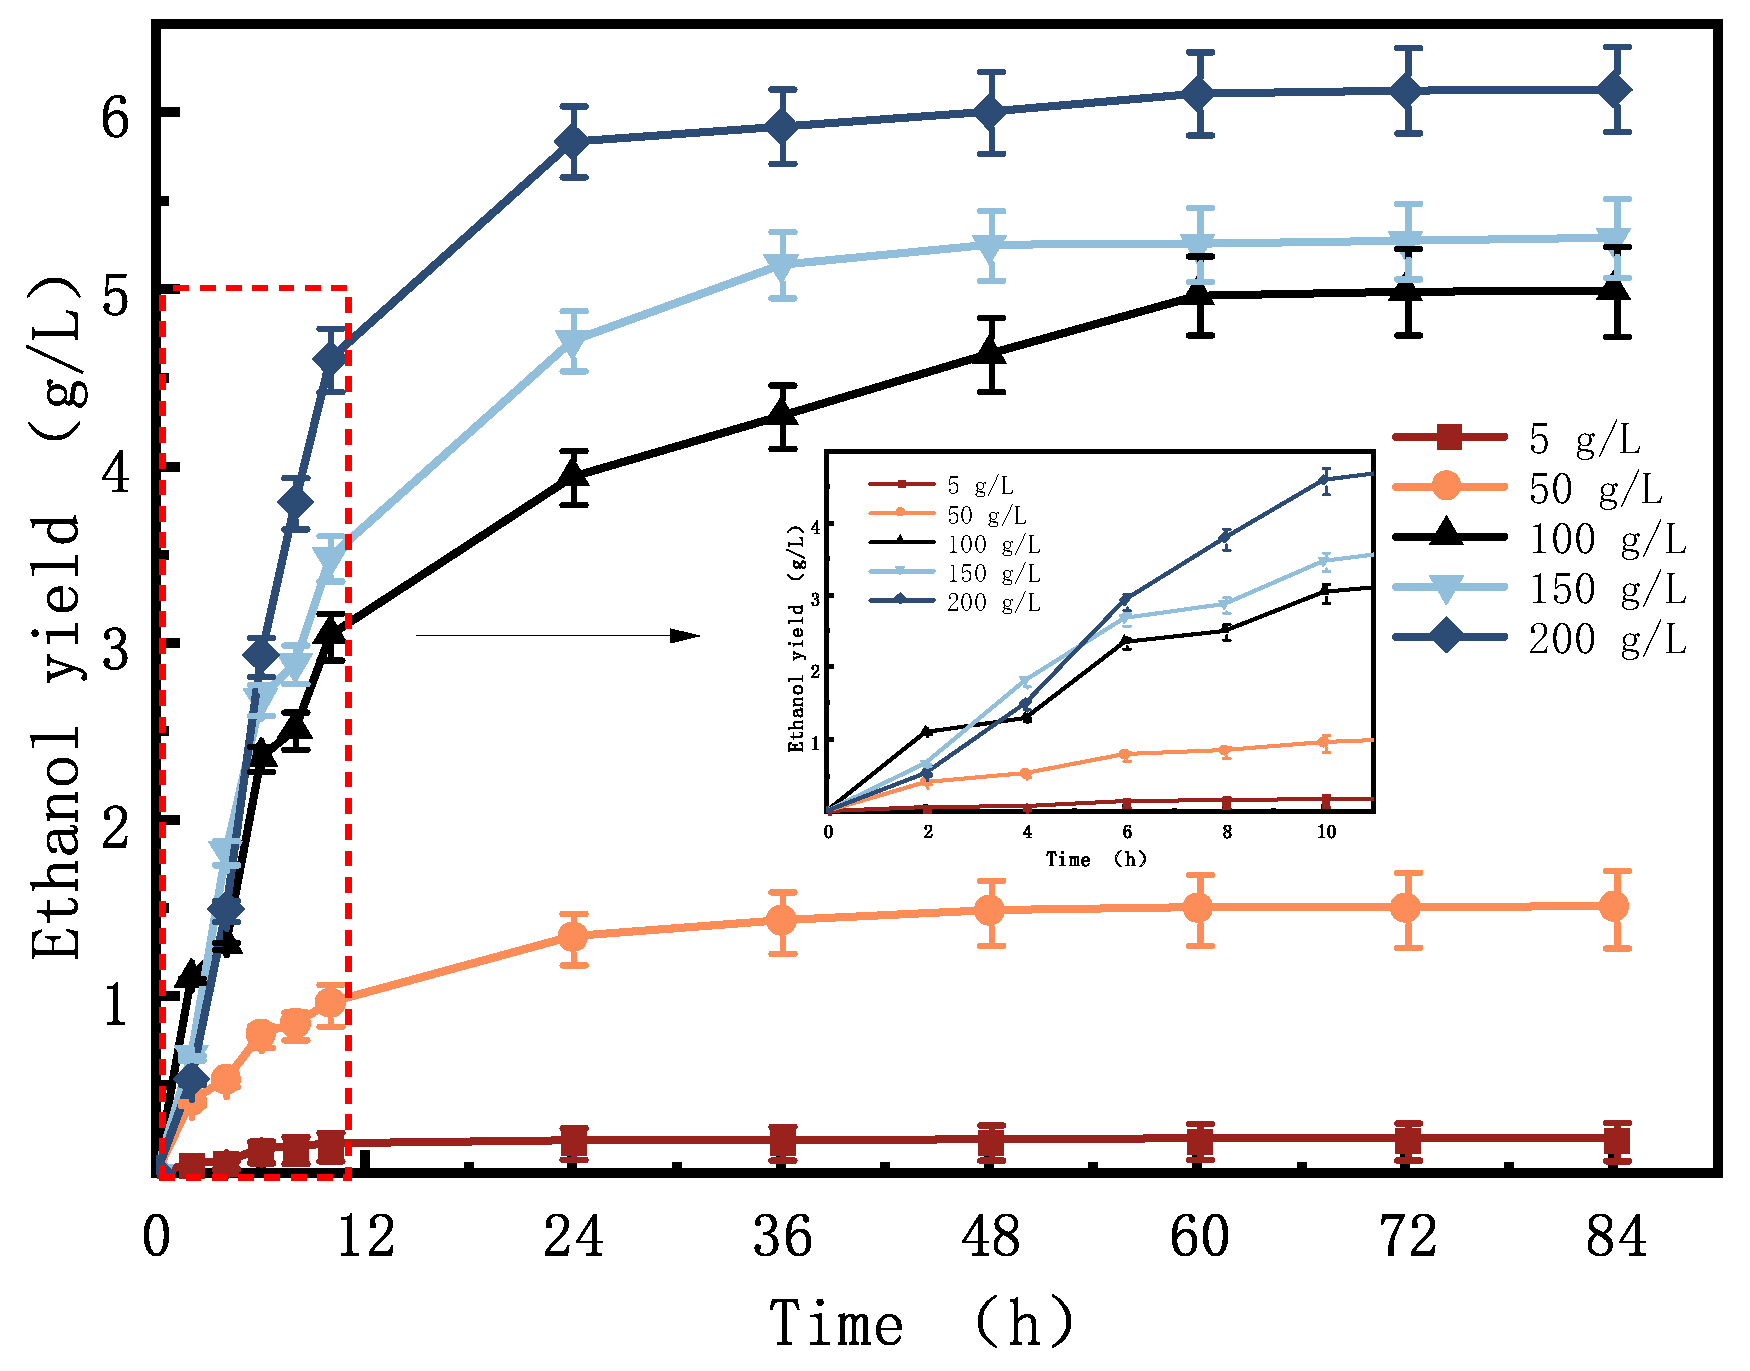
3.1. Effect of Substrate Concentration on the Gas Characteristics of Bioethanol Production

In this experiment, ethanol was produced by simultaneous saccharification and co-fermentation [19], which is a commonly used method in industrial production. While cellulase hydrolyzes cellulose to produce glucose, yeast also consumes glucose for growth and metabolism, which can effectively alleviate the inhibition of a high-concentration substrate on fermentation hydrolysis and separation. Figure 1a demonstrates the trend of the reducing sugar concentration during bioethanol production from tung leaves. The reducing sugar concentration initially increased and then decreased in the first 10 h. During the first period of bioethanol production, the conversion rate of cellulase to produce reducing sugars was greater than the rate of yeast degradation of the reducing sugars. In addition, reducing sugars accumulated rapidly, showing an increasing trend, and reached the peak value around 2 h. Then, the reducing sugars were rapidly consumed by the yeast to produce ethanol, which was the main stage of ethanol production, and the reducing sugar concentration gradually decreased. In the late stage of fermentation (after 24 h), the concentration of reducing sugars gradually increased because the yeast consumption of reducing sugars decreased at the end of ethanol fermentation. At this time, the cellulase enzyme only decomposed a small amount of tung leaves, thereby increasing the concentration of reducing sugars, and the yeast cannot metabolize xylose, leading to the continuous accumulation of xylose [20]. In the fermentation experiment, the yeast gradually stopped producing ethanol, and reducing sugars were only used to maintain bacterial growth, metabolism, consumption, and accumulation. Therefore, the mass concentration of reducing sugars remained stable and unchanged [21].
The concentration of reducing sugars in the reaction solution with a substrate mass concentration of 5 g/L was 0.34 g/L for 2 h, which stabilized at approximately 0.30 g/L for 84 h. The concentration of reducing sugars did not change remarkably during the whole fermentation process. The concentration of reducing sugars in the reaction solution with substrate mass concentrations of 50 and 100 g/L reached maximum values of 2.98 and 3.64 g/L at 2 h and then decreased rapidly to 1.22 and 1.19 g/L at 8 h, respectively. In addition, the concentration of reducing sugars increased slightly at 24 h and finally stabilized at 1.80 and 1.95 g/L. The concentration of reducing sugars in the reaction solution with substrate mass concentrations of 150 and 200 g/L was 0.34 g/L at 2–4 h, which stabilized at 0.30 g/L at 84 h. The concentration of reducing sugars did not change much during the whole fermentation process. The reaction broth with substrate mass concentrations of 150 and 200 g/L had high reducing sugar concentrations at 2–4 h, with maximum values of 5.90 and 6.38 g/L, respectively, and the peak reducing sugar concentration was maintained for a longer time compared with the low-concentration substrate, which decreased to 1.21 and 1.60 g/L at 10 h and then gradually increased to 2.58 and 3.30 g/L after 72 h. The differences in reducing sugar concentrations at the end of fermentation were remarkable. The concentration of reducing sugars in the reaction solution initially increased and then decreased rapidly with fermentation, followed by a slow increase, and the highest and final concentrations during fermentation were proportional to the number of tung leaves added to the reaction solution. The rate of cellulase conversion to produce reducing sugars was greater than the rate of yeast degradation of reducing sugars, thereby showing an increasing trend, followed by the rapid degradation of reducing sugars by yeast to produce soluble substances such as ethanol. Therefore, the microbial activity showed a similar change rule during biochemical transformation [22].
The changes in pH during ethanol fermentation with different substrate mass concentrations are shown in Figure 1b. The figure shows that the pH values of the experimental groups with different substrate concentrations during fermentation and production initially decreased and then slowly recovered. At 2 h, the pH of the reaction stock with a substrate mass concentration of 5 g/L decreased to about 4.4 within the first 10 h of the fermentation, and the pH of the other four groups of reaction stocks was reduced to around 4.2. As the reaction progressed, the pH slightly fluctuated. During ethanol production by yeast, a series of intermediate products become acidic during glucose fermentation, which increases the concentration of hydrogen ions in the solution, thereby lowering the pH [23,24]. Over time, the yeast will decompose some of the organic acids into ethanol and carbon dioxide and simultaneously produce substances such as ammonia, amines, and carbonates, which are alkaline in nature and can neutralize the hydrogen ions in the solution, leading to a gradual increase in pH. Throughout ethanol production, the metabolic activities of yeast continuously produce various organic substances, which play a complex role in regulating the pH of the solution [25,26]. In addition, factors such as temperature, oxygen, nutrients, and the presence of other microorganisms affect the metabolic process and change the pH of the solution with brewer’s yeast [27].
The variation in ORP during ethanol fermentation with different substrate mass concentrations is shown in Figure 1c. Considering that ethanol preparation is a redox reaction process, the flow of electrons during this process changes the ORP of the solution [28,29]. As shown in the figure, the ORP is a positive value for 2–84 h, showing a decreasing trend. The higher the mass concentration of the substrate, the greater the rate of decrease. When the content of acidic substances in the leaves of the tung tree was too low, they had almost no effect on the flow of electrons, so the ORP of the solution changed slowly. With the gradual increase in the content of acidic substances, they begin to affect the flow of electrons, and the ORP of the solution begins to accelerate the change. However, when the content of acidic substances reaches a certain level, they begin to compete with one another, and the electron flow is hindered to a certain extent, resulting in the decreasing trend of the ORP of the solution. Finally, when the content of acidic substances continues to increase, the competition gradually decreases, and the electron flow accelerates again, leading to another increase in the ORP of the solution [28,30]. Meanwhile, many reports have indicated that by regulating the ORP during fermentation, the biometabolic fluxes can be further regulated, thereby increasing the yield of directed products [31,32,33].
As shown in Figure 1c, the ORP of all the reaction liquids increased rapidly within 0–2 h, and the ORP of the reaction liquid with a substrate mass concentration of 5 g/L increased slowly before 12 h. The other four groups of reaction liquids began to decrease slowly after 6 h. At 6 h, the ORP of the reaction feed liquid with a substrate mass concentration of 50 g/L was the highest at 235 mV. After 12 h, the ORP of the reaction liquid began to decrease slowly to varying degrees. The higher the substrate mass concentration, the faster the ORP reduction rate, which tended to stabilize. The final ORPs with 5, 50, 100, 150, and 200 g/L of substrate are 209, 183, 187, 160, and 152 mV, respectively.
The variation in gas production during ethanol fermentation with different substrate mass concentrations is shown in Figure 1d. Based on the metabolic reaction equation of yeast anaerobic respiration, C6H12O6 → 2C2H5OH + 2CO2, ethanol fermentation is accompanied by a large amount of carbon dioxide gas production, and the characteristics of fermentation can be determined by analyzing the gas production. As shown in the figure, gas production with a substrate mass concentration of 5 g/L did not change after 10 h, and the total gas production was 30 mL. In addition, the experimental group with a substrate mass concentration of 50 g/L stopped gas production after 24 h, and the total gas production was 118 mL. Moreover, gas production from substrate mass concentrations of 100, 150, and 200 g/L remained unchanged after 36 h, and the total gas production was 287, 429, and 440 mL, respectively. With the increase in the substrate mass concentration, the peak of gas production was shifted backward and concentrated in the first 24 h, which also indicated that ethanol fermentation had a shorter lag period compared with methane and hydrogen fermentation.
Figure 2 demonstrates the trend of the ethanol yield during bioethanol production from tung leaves. The ethanol yield gradually increased with the prolongation of the fermentation time, and the ethanol fermentation initiation was fast compared with other biomass-refining methods [4]. The accumulation peak was primarily concentrated in the first 24 h, and only a small amount of ethanol output was produced in the later stage. Meanwhile, the pre-production rate of ethanol was inversely proportional to the substrate mass concentration: the lower the substrate mass concentration, the faster the fermentation initiation time. With the increase in the substrate mass concentration, the ethanol yield increased significantly. The ethanol yields of the experimental groups with substrate mass concentrations of 5 and 50 g/L were 0.20 and 1.51 g/L, respectively, and the ethanol yields of the experimental groups with substrate mass concentrations of 100, 150, and 200 g/L were 4.99, 5.29, and 6.13 g/L, respectively, which is 0.73 g/L higher than that in another experiment that used corn straw saccharification and fermentation to produce ethanol [9]. Shet et al. [34] used the yeast Pichia pastoris to ferment cacao pods (pretreated with hydrochloric acid), with an initial sugar concentration of 4.09 g/L and a final ethanol yield of 2 g/L. In the study by Muktham et al. [35], ethanol fermentation using de-oiled seed residues yielded 4.43 g/L of ethanol. The different ethanol concentrations were due to different substrates, microorganisms, and process conditions. Although the fermentation of tung leaves for ethanol at high concentrations had higher ethanol yields, as analyzed from the ethanol concentration per unit of tung leaves converted, the ethanol concentration obtained per unit of substrate concentration initially increased and then decreased as the substrate concentration of tung leaves increased, and a maximum yield of 0.25 g/L per gram of tung leaves was obtained at 100 g/L. The accumulation of a high ethanol concentration in the late stage of fermentation will adversely affect the cells, causing yeast growth stagnation or even death. A high concentration of glucose also affects the osmotic pressure of the cells, and yeast metabolism is inevitably affected [36].

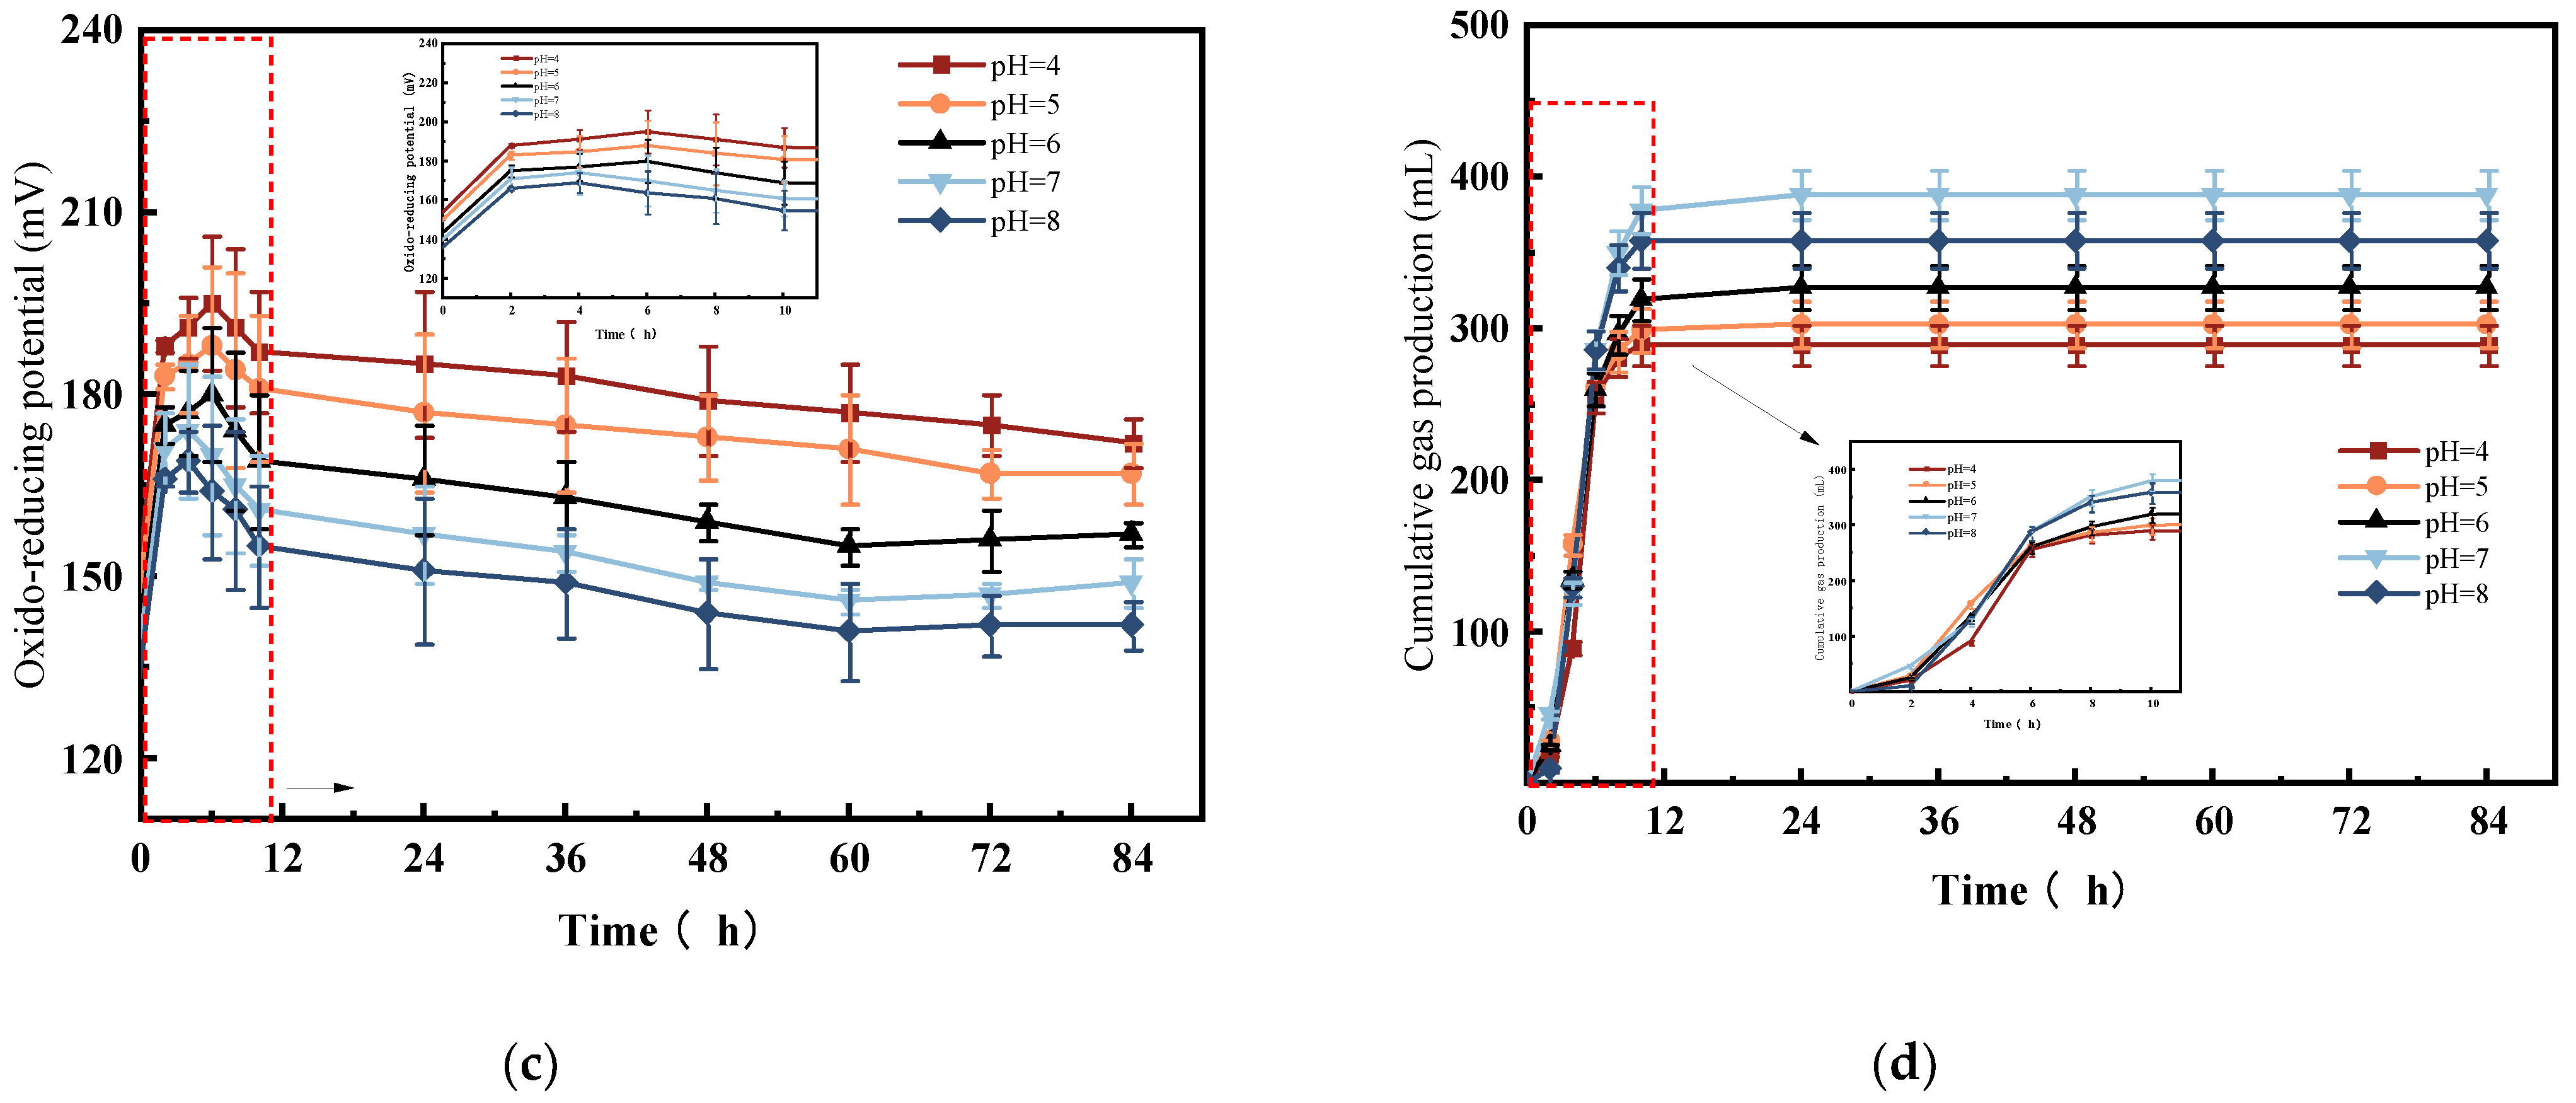
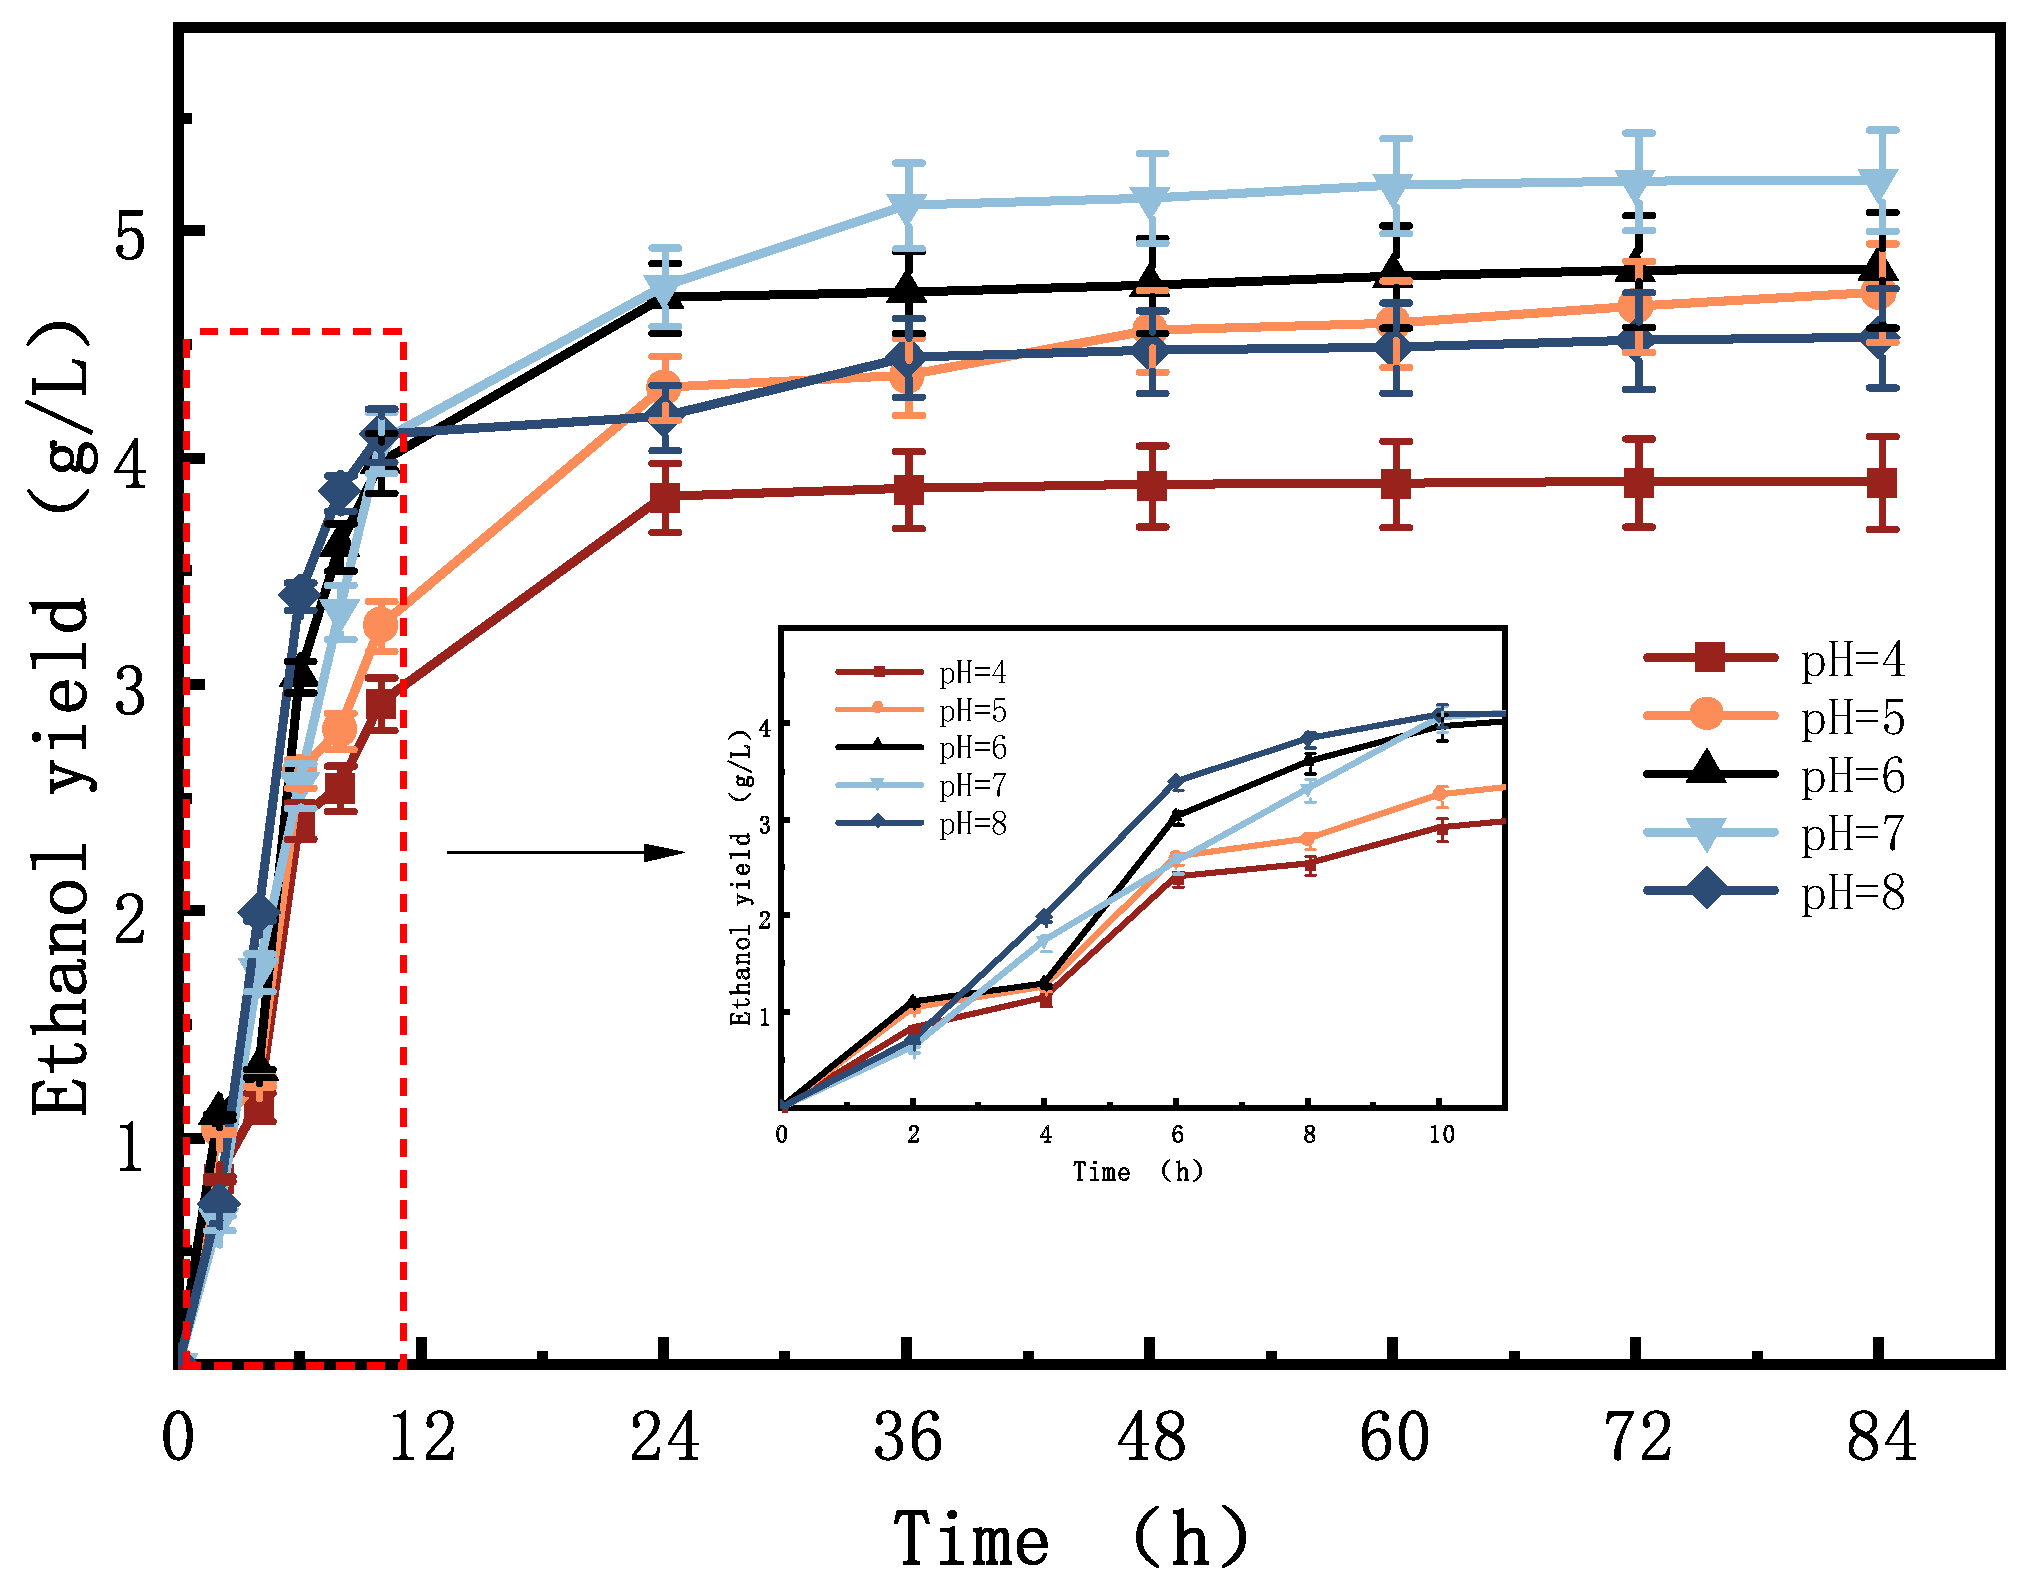
3.2. Analysis of the Effect of Initial pH on Bioethanol Results

Changes in the pH of the culture medium or fermentation broth will also cause changes in the activities of various enzymes inside the yeast cells, affecting the rate of yeast metabolism of nutrients and sometimes changing the metabolic pathway of the yeast. On the other hand, pH affects the state of the charge carried by the yeast cell membrane, thereby changing the permeability of the cell membrane, affecting the absorption of nutrients and the excretion of metabolites by the yeast, and affecting the normal operation of yeast growth and fermentation [37]. In addition, important effects on yeast growth and metabolic pathways under different pH conditions have been reported [38]. Although yeasts are suitable for a wide range of pH values and are adaptable, studying the effect of the initial pH of fermentation on the final fermentation results is necessary to fully utilize the role of yeasts [39]. Therefore, we investigated the effect of the initial pH on ethanol fermentation under the experimental condition of optimal yield per unit mass (100 g/L).
The changes in reducing sugars during the ethanol fermentation of tung leaves with different initial pH values are shown in Figure 3a. This phenomenon is primarily due to the fact that the initial pH has little effect on the efficiency of reducing sugar enzymolysis during the production of reducing sugars from tung leaves. Similarly, the initial pH does not have any significant effect on the metabolism of reducing sugars by yeasts. In 0–2 h, the concentration of reducing sugars from tung leaves increased sharply because of the initially high substrate concentration. In addition, the collision frequency of enzyme molecules and substrate molecules was high, and the reaction rate was fast. At this time, the yeast was in the growth retardation period, and the consumption of reducing sugars was not large. Moreover, the concentration of reducing sugars was approximately 2.80 g/L. In 2–12 h, the concentration of the substrate and reaction rate decreased, and the yeast was in the growth phase, which led to a gradual decrease in the production of reducing sugars, and the lowest value was 1.20 g/L. In the late stage of fermentation, the activity of the yeast weakened, and the reducing sugars began to accumulate slowly [40]. Furthermore, the concentration of reducing sugars at 48 h was approximately 2.3 g/L, and the whole process was characterized by an N-shaped change curve.
The change in pH during ethanol fermentation is shown in Figure 3b, which shows that different initial pH values have different patterns of change. When the initial pH value was 4, the pH value slowly increased with ethanol fermentation, and the pH value was 4.23 at 10 h, which decreased to approximately 4.0 until the end of the reaction. In the remaining four groups of experiments, from the beginning of the experiment until 2 h, the pH value rapidly declined. As the initial pH increased, the rate of decline became rapid, and the initial pH (8) of the experimental group significantly declined to 6.78. During the initial stage of ethanol fermentation, yeast will decompose the macromolecules of glucose and other organic substances into small-molecule acids. The initial pH is lower than the metabolite’s pH value, which will increase the solution pH value of the metabolic products and then the reaction of ethanol fermentation. The initial pH is lower than that of the metabolites, and the pH of the solution will increase when the initial pH is lower than that of the metabolites. The difference between the initial pH and the metabolites’ pH will increase, and the pH will decrease more drastically. The 2–8 h interval is the main stage of ethanol fermentation, in which S. cerevisiae utilizes small-molecule acids, and the acidity of the solution decreases during fermentation. Finally, the pH of each experimental group still maintained a gradient without any further change, with values of 3.98, 4.72, 4.98, 5.61, and 6.31. Yeast has a high tolerance to environmental pH. On the one hand, yeast improves the pH of the external environment through its metabolites, and on the other hand, it maintains the stability of the intracellular environment through the control of ions entering and exiting the cell.
The changes in the ORP during the ethanol fermentation of tung leaves at different initial pH values are shown in Figure 3c. The ORP decreased rapidly after yeast inoculation. At this stage, the oxygen in the air remaining in the upper part of the conical flask provided a micro-oxygenic environment for the fermentation broth, and the yeast grew rapidly through aerobic respiration. In addition, the highly active cells rapidly consumed the reducing power produced by glucose, which resulted in a rapid decrease in the value of ORP in the solution [27,41]. pH changes in each experimental group after 12 h were within 15 mV until the end. The final ORPs for initial pH values of 4.0, 5.0, 6.0, 7.0, and 8.0 were 172, 167, 157, 149, and 142 Mv, respectively, which indicates that a decrease in pH leads to an increase in the oxidizing power of the reacting solution. With the increase in pH, more reducing substances were produced during yeast fermentation, which is favorable for ethanol accumulation.
The variation in gas production during the ethanol fermentation of tung leaves with different initial pH values is shown in Figure 3d. As a by-product of cellular respiration, the carbon dioxide produced during ethanol fermentation (aerobic and anaerobic respiration) can be regarded as an important indicator of the ethanol yield, and the amount of gas production increased rapidly from 0 to 12 h. The maximum amount of gas production was 378 mL with an initial pH of 7.0, followed by an initial pH of 8.0 (358 mL), and the lowest amount of gas production was 289 mL at an initial pH value of 4.0.
The changes in ethanol accumulation during the ethanol fermentation of tung leaves with different initial pH values are shown in Figure 4. The ethanol content increased rapidly from 0 to 12 h, and the increase became slower from 12 to 48 h. Almost no further increase was observed after 48 h. In contrast to Figure 3d, almost no additional gas production was observed after 48 h, indicating that the ethanol-producing reaction almost ceased after 48 h. The lowest ethanol yield of 3.89 g/L was obtained at an initial pH value of 4.0, and the ethanol accumulation increased as the pH increased to neutral, with a maximum ethanol yield of 5.22 g/L at an initial pH value of 7.0, equivalent to 0.0522 g/g of tung leaf, which is higher than the 0.0452 g/g of substrate in a previous study [39]. As the pH continued to increase to 8.0, the ethanol yield decreased to 4.53 g/L, which is lower than those of 4.73 and 4.82 g/L at initial pH values of 5.0 and 6.0, respectively. A significantly faster rate of ethanol accumulation and a shorter time of fermentation at an acidic pH compared to the rest of the experimental groups were observed, and similar phenomena have been reported previously [42]. Although the pH range in which yeast can grow is relatively wide, the intracellular pH is relatively stable [43]. Changes in the initial pH can have an impact on the cell wall structure of yeast and alter the conformation of proteins protruding from the plasma membrane, as well as affecting the charge and permeability of the plasma membrane of Saccharomyces cerevisiae, affecting substance transport and leading to different ethanol yields [43,44,45]. The optimal initial pH of ethanol fermentation is different for different yeasts [24]. Ethanol fermentation using tung leaves under neutral or weakly acidic conditions resulted in the highest ethanol yields, although the optimal pH for yeast growth was lower, which also fits with some of the previous studies [46,47]. The utilization of biomass materials such as lignin for ethanol fermentation introduces more uncertainties into the fermentation environment, and the acid produced by fermentation further causes fluctuations in the pH of the fermentation broth.

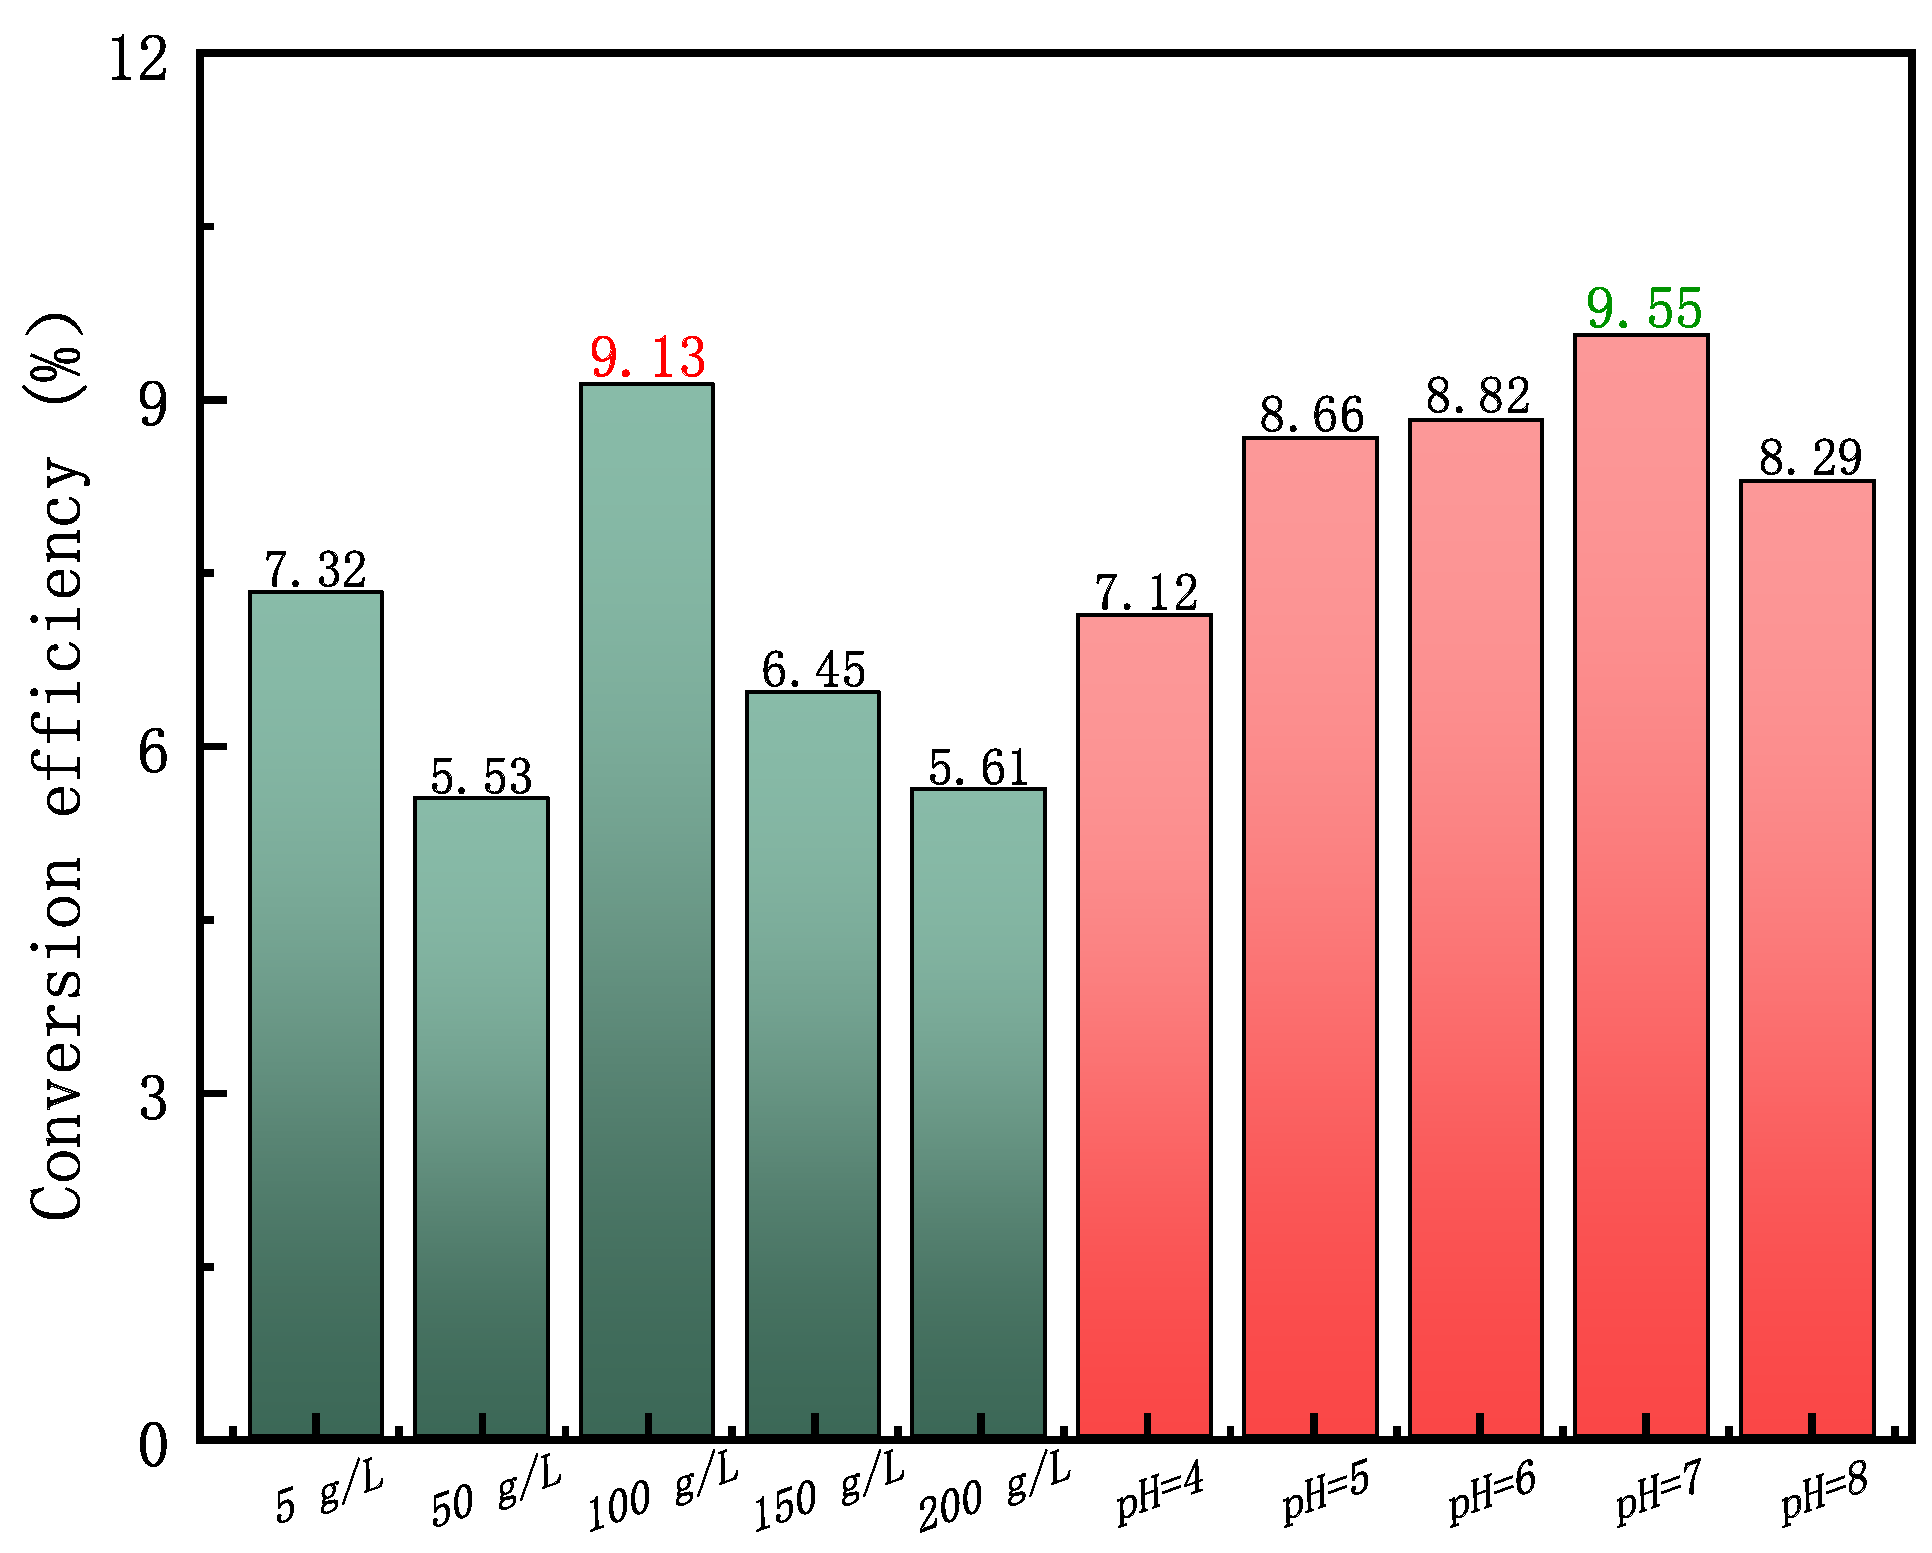
3.3. Analysis of Energy Conversion Efficiency

The energy conversion efficiency of ethanol production from tung leaves can be calculated according to Equation (1), as shown in Figure 5, and in the biomass-refining process, ethanol fermentation usually has a higher energy conversion efficiency than biohydrogen production technology [4,48]. The mass substrate concentration at 100 g/L had a considerable energy conversion efficiency of 9.13%, and at an initial pH of 7.0, there was a maximum energy conversion efficiency of 9.55%, which also coincided with having the maximum unit ethanol production, as described previously.

3.4. Analysis of Fermentation Kinetics under Different Conditions

Table 1 shows the kinetic parameters of ethanol production from tung leaves under different fermentation conditions. All R2 values in the table greater than 0.95 indicate that the kinetic equation is well fitted. At different substrate mass concentrations, Pm, Rm, and λ all increased with the increase in the substrate mass concentration, among which 200 g/L had the highest ethanol production potential (5.91 g/L) and ethanol production rate (0.64 g/L/h) but had a longer fermentation delay period (1.63 h). When the initial pH was 7, the maximum ethanol production potential was 5.11 g/L, and when the initial pH was 8, the maximum ethanol production rate was 0.74 g/L/h. The lower the pH, the shorter the fermentation delay period. When the initial pH was 4, the fermentation delay period was 0.24 h. The kinetic analysis showed that a suitable substrate mass concentration and pH could shorten the fermentation delay period and result in a considerable ethanol yield.

4. Conclusions

Bioethanol production from tung leaves has a good potential for development, and the ethanol yield could be increased by controlling the initial fermentation substrate mass concentration and pH. When the initial substrate mass concentration was 100 g/L and pH was neutral, there was an optimal ethanol yield of 5.22 g/L, with an energy conversion efficiency of 9.55%.
The experimental study of ethanol production from tung leaf waste indicated that biomass could be an important resource to replace fossil fuels. Tung leaf waste is a rich source of raw materials that can produce high-purity ethanol through an appropriate processing technology and is of great significance for alleviating energy pressure, protecting the environment, and promoting economic development.

Author Contributions

Conceptualization, G.W. (Guangtao Wang) and C.L.; methodology, G.W. (Guangtao Wang) and K.D.; software, P.S.; validation, G.W. (Guangtao Wang), T.Z. and D.W.; formal analysis, J.H.; investigation, J.L. and G.W. (Guanshu Wang); resources, J.L. and G.W. (Guanshu Wang); data curation, G.W. (Guangtao Wang) and C.L.; writing—original draft preparation, G.W. (Guangtao Wang) and C.L.; writing—review and editing, C.L., H.L. and X.L.; supervision, C.L.; project administration, C.L., X.L. and H.L.; funding acquisition, C.L. and H.L. All authors have read and agreed to the published version of the manuscript.

Funding

National Natural Science Foundation of China (52306238), Foundation of State Key Laboratory of Utilization of Woody Oil Resource (GZKF202122), Key Research and Promotion Project of Henan Province (222102240078), Natural Science Foundation of Henan province (222300420189), Youth Talent Training Project of Henan Province (2023HYTP008), Training Program for Excellent Young Innovators of Changsha (kq2206067), National Natural Science Foundation of Changsha (kq2208101), Science and Technology Planning Project of Hunan Province (2022RC4031), National Natural Science Foundation of Hunan (2023JJ10023), and Scientific Research Foundation for Top Talent of Henan Agricultural University (30500840).

Institutional Review Board Statement

Not applicable.

Informed Consent Statement

Not applicable.

Data Availability Statement

Data are contained within the article.

Conflicts of Interest

The authors declare no conflict of interest.

References

  1. Shao, H.B.; Chu, L.Y. Resource evaluation of typical energy plants and possible functional zone planning in China. Biomass Bioenergy 2008, 32, 283–288. [Google Scholar] [CrossRef]
  2. Zhan, Z.; Wang, Y.; Shockey, J.; Chen, Y.; Zhou, Z.; Yao, X.; Ren, H. Breeding status of tung tree (Vernicia sp.) in China, a multipurpose oilseed crop with industrial uses. Silvae Genet. 2012, 61, 265–270. [Google Scholar] [CrossRef]
  3. Li, Z.; Shi, K.; Zhang, F.; Zhang, L.; Long, H.; Zeng, Y.; Liu, Z.; Niu, G.; Tan, X. Growth, Physiological, and Biochemical Responses of Tung Tree (Vernicia fordii) Seedlings to Different Light Intensities. Hortscience 2019, 54, 1361–1369. [Google Scholar] [CrossRef]
  4. Lu, C.; Wang, G.; Zhang, Q.; Yang, X.; Yu, J.; Liu, T.; Petracchini, F.; Zhang, Z.; Sun, Y.; Jiang, D.; et al. Comparison of biorefinery characteristics: Photo-fermentation biohydrogen, dark fermentation biohydrogen, biomethane, and bioethanol production. Appl. Energy 2023, 347, 121463. [Google Scholar] [CrossRef]
  5. Lu, C.; Li, W.; Zhang, Q.; Liu, L.; Zhang, N.; Qu, B.; Yang, X.; Xu, R.; Chen, J.; Sun, Y. Enhancing photo-fermentation biohydrogen production by strengthening the beneficial metabolic products with catalysts. J. Clean. Prod. 2021, 317, 128437. [Google Scholar] [CrossRef]
  6. Ben Atitallah, I.; Antonopoulou, G.; Ntaikou, I.; Soto Beobide, A.; Dracopoulos, V.; Mechichi, T.; Lyberatos, G. A Comparative Study of Various Pretreatment Approaches for Bio-Ethanol Production from Willow Sawdust, Using Co-Cultures and Mono-Cultures of Different Yeast Strains. Molecules 2022, 27, 1344. [Google Scholar] [CrossRef]
  7. Wu, B.; Wang, Y.-W.; Dai, Y.-H.; Song, C.; Zhu, Q.-L.; Qin, H.; Tan, F.-R.; Chen, H.-C.; Dai, L.-C.; Hu, G.-Q.; et al. Current status and future prospective of bio-ethanol industry in China. Renew. Sustain. Energy Rev. 2021, 145, 111079. [Google Scholar] [CrossRef]
  8. Johnston, D.B.; Nghiem, N.P. Mixed fermentation of corn and pretreated corn stover for fuel ethanol production. Cereal Chem. 2021, 98, 926–934. [Google Scholar] [CrossRef]
  9. Li, H.; Xiao, W.; Liu, J.; Ran, Q.; Wang, R.; Yu, C.; Zhang, X.; Song, H.; Jiang, Z. Combination strategy of laccase pretreatment and rhamnolipid addition enhance ethanol production in simultaneous saccharification and fermentation of corn stover. Bioresour. Technol. 2022, 345, 126414. [Google Scholar] [CrossRef]
  10. Tin Diep Trung, L.; Vi Phuong Nguyen, T.; My Thi Tra, N.; Kim, T.H.; Oh, K.K. Pretreatment of Corn Stover Using an Extremely Low-Liquid Ammonia (ELLA) Method for the Effective Utilization of Sugars in Simultaneous Saccharification and Fermentation (SSF) of Ethanol. Fermentation 2021, 7, 191. [Google Scholar] [CrossRef]
  11. Molaverdi, M.; Karimi, K.; Mirmohamadsadeghi, S.; Galbe, M. High efficient ethanol production from corn stover by modified mild alkaline pretreatment. Renew. Energy 2021, 170, 714–723. [Google Scholar] [CrossRef]
  12. Stenberg, K.; Bollok, M.; Reczey, K.; Galbe, M.; Zacchi, G. Effect of substrate and cellulase concentration on simultaneous saccharification and fermentation of steam-pretreated softwood for ethanol production. Biotechnol. Bioeng. 2000, 68, 204–210. [Google Scholar] [CrossRef]
  13. Hu, L.; Wang, Y.; Du, M.; Zhang, J. Characterization of the volatiles and active components in ethanol extracts of fruits of Litsea cubeba (Lour.) by gas chromatography-mass spectrometry (GC-MS) and gas chromatography-olfactometry (GC-O). J. Med. Plants Res. 2011, 5, 3298–3303. [Google Scholar]
  14. Zhu, J.; Zhu, Y.; Jiang, F.; Xu, Y.; Ouyang, J.; Yu, S. An integrated process to produce ethanol, vanillin, and xylooligosaccharides from Camellia oleifera shell. Carbohydr. Res. 2013, 382, 52–57. [Google Scholar] [CrossRef]
  15. Yan, C.; Liu, Y.; Cao, L.; Xia, M.; Zhang, Q.; Li, C.; Ruan, R. Oligosaccharide preparation from microwave-ethanol pretreated Camellia oleifera seed shell by enzymolysis of Agrocybe aegerita. Ind. Crops Prod. 2021, 161, 113155. [Google Scholar] [CrossRef]
  16. Liu, H.; Ru, G.; Zhang, Z.; Li, Y.; Xia, C.; Lu, C.; Zhang, Q. Experimental study on optimization of initial pH for photo-fermentation bio-hydrogen under different enzymatic hydrolysis of chlorella vulgaris. Bioresour. Technol. 2021, 338, 125571. [Google Scholar] [CrossRef]
  17. Lu, C.; Zhang, Z.; Ge, X.; Wang, Y.; Zhou, X.; You, X.; Liu, H.; Zhang, Q. Bio-hydrogen production from apple waste by photosynthetic bacteria HAU-M1. Int. J. Hydrog. Energy 2016, 41, 13399–13407. [Google Scholar] [CrossRef]
  18. Xiang, G.; Zhang, Q.; Li, Y.; Zhang, X.; Liu, H.; Lu, C.; Zhang, H. Enhancement on photobiological hydrogen production from corn stalk via reducing hydrogen pressure in bioreactors by way of phased decompression schemes. Bioresour. Technol. 2023, 385, 129377. [Google Scholar] [CrossRef]
  19. He, D.P.; Chen, X.L.; Lu, M.S.; Shi, S.; Cao, L.M.; Yu, H.T.; Lin, H.; Jia, X.W.; Han, L.J.; Xiao, W.H. High-solids saccharification and fermentation of ball-milled corn stover enabling high titer bioethanol production. Renew. Energy 2023, 202, 336–346. [Google Scholar] [CrossRef]
  20. Liu, C.-G.; Xiao, Y.; Xia, X.-X.; Zhao, X.-Q.; Peng, L.; Srinophakun, P.; Bai, F.-W. Cellulosic ethanol production: Progress, challenges and strategies for solutions. Biotechnol. Adv. 2019, 37, 491–504. [Google Scholar] [CrossRef]
  21. Zhang, H.; Zhang, R.; Song, Y.; Miu, X.; Zhang, Q.; Qu, J.; Sun, Y. Enhanced enzymatic saccharification and ethanol production of corn stover via pretreatment with urea and steam explosion. Bioresour. Technol. 2023, 376, 128856. [Google Scholar] [CrossRef] [PubMed]
  22. Bhuyar, P.; Shen, M.-Y.; Trejo, M.; Unpaprom, Y.; Ramaraj, R. Improvement of fermentable sugar for enhanced bioethanol production from Amorphophallus spp. tuber obtained from northern Thailand. Environ. Dev. Sustain. 2022, 24, 8351–8362. [Google Scholar] [CrossRef]
  23. Mendes Ferreira, A.; Mendes-Faia, A. The Role of Yeasts and Lactic Acid Bacteria on the Metabolism of Organic Acids during Winemaking. Foods 2020, 9, 1231. [Google Scholar] [CrossRef]
  24. Shuang, X.; Yaping, W.; Xuewu, G.; Zhiyang, W.; Zhongguan, S.; Dongguang, X. Effects of fermentation conditions on ethanol fermentation and ester production of five ester-producing yeasts. China Brew. 2018, 37, 24–28. [Google Scholar]
  25. Robles, A.; Fabjanowicz, M.; Chmiel, T.; Plotka-Wasylka, J. Determination and identification of organic acids in wine samples. Problems and challenges. TrAC Trends Anal. Chem. 2019, 120, 115630. [Google Scholar] [CrossRef]
  26. Scutarasu, E.C.; Teliban, I.V.; Zamfir, C.I.; Luchian, C.E.; Colibaba, L.C.; Niculaua, M.; Cotea, V.V. Effect of Different Winemaking Conditions on Organic Acids Compounds of White Wines. Foods 2021, 10, 2569. [Google Scholar] [CrossRef]
  27. Torija, M.J.; Beltran, G.; Novo, M.; Poblet, M.; Rozès, N.; Mas, A.; Guillamòn, J.M. Effect of organic acids and nitrogen source on alcoholic fermentation:: Study of their buffering capacity. J. Agric. Food Chem. 2003, 51, 916–922. [Google Scholar] [CrossRef]
  28. Liu, C.-G.; Xue, C.; Lin, Y.-H.; Bai, F.-W. Redox potential control and applications in microaerobic and anaerobic fermentations. Biotechnol. Adv. 2013, 31, 257–265. [Google Scholar] [CrossRef]
  29. Farina, L.; Medina, K.; Urruty, M.; Boido, E.; Dellacassa, E.; Carrau, F. Redox effect on volatile compound formation in wine during fermentation by Saccharomyces cerevisiae. Food Chem. 2012, 134, 933–939. [Google Scholar] [CrossRef]
  30. Lin, Y.-H.; Chien, W.-S.; Duan, K.-J. Correlations between reduction–oxidation potential profiles and growth patterns of Saccharomyces cerevisiae during very-high-gravity fermentation. Process Biochem. 2010, 45, 765–770. [Google Scholar] [CrossRef]
  31. Gu, J.; Li, Z.; Xie, G.; Yang, Y.; Liu, B.; Ren, Z.J.; Xing, D. Electro-fermentation enhances H2 and ethanol co-production by regulating electron transfer and substrate transmembrane transport. Chem. Eng. J. 2022, 429, 132223. [Google Scholar] [CrossRef]
  32. Vassilev, I.; Averesch, N.J.H.; Ledezma, P.; Kokko, M. Anodic electro-fermentation: Empowering anaerobic production processes via anodic respiration. Biotechnol. Adv. 2021, 48, 107728. [Google Scholar] [CrossRef] [PubMed]
  33. Zhang, Y.; Li, J.; Meng, J.; Sun, K.; Yan, H. A neutral red mediated electro-fermentation system of Clostridium beijerinckii for effective co-production of butanol and hydrogen. Bioresour. Technol. 2021, 332, 125097. [Google Scholar] [CrossRef] [PubMed]
  34. Vinayaka, B.S.; Nisha, S.; Manasa, B.; Manasa, N.; Mascarenhas, L.N.; Goveas, L.C.; Vaman Rao, C.; Ujwal, P.; Sandesh, K.; Aparna, A. Acid hydrolysis optimization of cocoa pod shell using response surface methodology approach toward ethanol production. Agric. Nat. Resour. 2018, 52, 581–587. [Google Scholar] [CrossRef]
  35. Muktham, R.; Ball, A.S.; Bhargava, S.K.; Bankupalli, S. Bioethanol production from non-edible de-oiled Pongamia pinnata seed residue-optimization of acid hydrolysis followed by fermentation. Ind. Crops Prod. 2016, 94, 490–497. [Google Scholar] [CrossRef]
  36. Gibson, B.R.; Lawrence, S.J.; Leclaire, J.P.R.; Powell, C.D.; Smart, K.A. Yeast responses to stresses associated with industrial brewery handling. Fems Microbiol. Rev. 2007, 31, 535–569. [Google Scholar] [CrossRef] [PubMed]
  37. Waseem, W.; Noor, R.S.; Umair, M. The anaerobic transformation of agricultural waste for bioethanol production. Biomass Convers. Biorefinery 2023. [Google Scholar] [CrossRef]
  38. Narendranath, N.V.; Power, R. Relationship between pH and medium dissolved solids in terms of growth and metabolism of lactobacilli and Saccharomyces cerevisiae during ethanol production. Appl. Environ. Microbiol. 2005, 71, 2239–2243. [Google Scholar] [CrossRef]
  39. Valladares-Diestra, K.K.; de Souza Vandenberghe, L.P.; Soccol, C.R. A biorefinery approach for pectin extraction and second-generation bioethanol production from cocoa pod husk. Bioresour. Technol. 2022, 346, 126635. [Google Scholar] [CrossRef]
  40. Murata, Y.; Nwuche, C.O.; Nweze, J.E.; Ndubuisi, I.A.; Ogbonna, J.C. Potentials of multi-stress tolerant yeasts, Saccharomyces cerevisiae and Pichia kudriavzevii for fuel ethanol production from industrial cassava wastes. Process Biochem. 2021, 111, 305–314. [Google Scholar] [CrossRef]
  41. Lu, C.; Jiang, D.; Jing, Y.; Zhang, Z.; Liang, X.; Yue, J.; Li, Y.; Zhang, H.; Zhang, Y.; Wang, K.; et al. Enhancing photo-fermentation biohydrogen production from corn stalk by iron ion. Bioresour. Technol. 2022, 345, 126457. [Google Scholar] [CrossRef] [PubMed]
  42. Athanasiadis, I.; Boskou, D.; Kanellaki, M.; Koutinas, A.A. Low-temperature alcoholic fermentation by delignified cellulosic material supported cells of kefir yeast. J. Agric. Food Chem. 1999, 47, 4474–4477. [Google Scholar] [CrossRef] [PubMed]
  43. Eardley, J.; Timson, D.J. Yeast Cellular Stress: Impacts on Bioethanol Production. Fermentation 2020, 6, 109. [Google Scholar] [CrossRef]
  44. Liu, X.; Jia, B.; Sun, X.; Ai, J.; Wang, L.; Wang, C.; Zhao, F.; Zhan, J.; Huang, W. Effect of Initial PH on Growth Characteristics and Fermentation Properties of Saccharomyces cerevisiae. J. Food Sci. 2015, 80, M800–M808. [Google Scholar] [CrossRef]
  45. Liu, R.; Shen, F. Impacts of main factors on bioethanol fermentation from stalk juice of sweet sorghum by immobilized Saccharomyces cerevisiae (CICC 1308). Bioresour. Technol. 2008, 99, 847–854. [Google Scholar] [CrossRef]
  46. Srinivas, D.; Jagannadha Rao, K.; Theodore, K.; Panda, T. Direct conversion of cellulosic material to ethanol by the intergeneric fusant Trichoderma reesei QM 9414/Saccharomyces cerevisiae NCIM 3288. Enzym. Microb. Technol. 1995, 17, 418–423. [Google Scholar] [CrossRef]
  47. Ratnam, B.V.V.; Rao, S.S.; Rao, M.D.; Rao, M.N.; Ayyanna, C. Optimization of medium constituents and fermentation conditions for the production of ethanol from palmyra jaggery using response surface methodology. World J. Microbiol. Biotechnol. 2005, 21, 399–404. [Google Scholar] [CrossRef]
  48. Zhang, Z.; Li, Y.; Zhang, H.; He, C.; Zhang, Q. Potential use and the energy conversion efficiency analysis of fermentation effluents from photo and dark fermentative bio-hydrogen production. Bioresour. Technol. 2017, 245, 884–889. [Google Scholar] [CrossRef]
Figure 1. Changes in reducing sugar mass concentration (a), pH (b), ORP (c), and cumulative gas production (d) during ethanol production at different substrate mass concentrations.
Fermentation 09 00986 g001
Figure 2. Changes in cumulative ethanol yield during ethanol production with different substrate mass concentrations.
Fermentation 09 00986 g002
Figure 3. Changes in reducing sugar mass concentration (a), pH (b), ORP (c), and cumulative gas production (d) during ethanol production at different initial pH values.
Fermentation 09 00986 g003aFermentation 09 00986 g003b
Figure 4. Variation in cumulative ethanol yield during ethanol production with different initial pH values.
Fermentation 09 00986 g004
Figure 5. Energy conversion efficiency of ethanol from oleander leaves under different conditions.
Fermentation 09 00986 g005
Table 1. Kinetic parameters of ethanol fermentation of tung leaves under different fermentation conditions.
Pm (g/L)Rm (g/L/h)λ (h)R2
Substrate mass concentration
5 g/L0.200.020.010.98
50 g/L1.420.120.220.98
100 g/L4.300.350.220.98
150 g/L5.020.430.500.97
200 g/L5.910.641.630.99
Initial pH value
pH = 43.870.360.240.98
pH = 54.540.390.210.98
pH = 64.780.540.740.98
pH = 75.110.500.850.99
pH = 84.430.741.170.99
Disclaimer/Publisher’s Note: The statements, opinions and data contained in all publications are solely those of the individual author(s) and contributor(s) and not of MDPI and/or the editor(s). MDPI and/or the editor(s) disclaim responsibility for any injury to people or property resulting from any ideas, methods, instructions or products referred to in the content.

