Article

Barley Vinegar Relieves Loperamide-Induced Constipation in Mice via the Modulation of the Gut Microbiota and Serum Metabolism

Institute of Food Science and Technology, Chinese Academy of Agricultural Sciences, Key Laboratory of Agro-Products Processing, Ministry of Agriculture, Beijing 100193, China
*
Authors to whom correspondence should be addressed.
Fermentation 2023, 9(11), 962; https://doi.org/10.3390/fermentation9110962
Submission received: 24 September 2023 / Revised: 5 November 2023 / Accepted: 7 November 2023 / Published: 9 November 2023
(This article belongs to the Special Issue Fermented Foods for Boosting Health)

Abstract

:
This study investigated the effect of barley vinegar on constipation by regulating the structure of intestinal microbiota and the level of short-chain fatty acids (SCFAs). BALB/c mice with loperamide-induced constipation were treated with barley vinegar in the intervention. After treatment, constipation-related factors were identified. The effect of barley vinegar on the composition of the intestinal microbiota was evaluated by means of 16S rDNA gene sequencing, and the content of SCFAs in enteral feces was determined via the GC-MS method. Treating constipated mice with barley vinegar accelerated gastrointestinal peristalsis, inhibited the inflammatory response, protected the intestinal barrier, upregulated the production of beneficial intestinal bacteria, and downregulated the production of harmful intestinal bacteria. These therapeutic effects are attributed to reversed gut microbiota dysfunction, which favors the production of intestinal metabolites such as SCFAs. The purgative function of highland barley vinegar may improve the intestinal environment by regulating the balance of intestinal flora and the concentration of SCFAs. In addition, LC-MS metabolomics was used to analyze the effect of barley vinegar on intestinal metabolites in mice with constipation. The results show that the treatment of barley vinegar inhibited the decrease in aspartate, L-threonine, L-serine, L-proline, 3,4-dihydroxymandelic acid, epinephrine, glyceric acid, and 3,4-dihydroxymandelic acid content in intestinal metabolites caused by constipation. 4-2 hydroxy benzene acetic acid and fumaric acid content increased. KEGG pathway analysis showed that digestive system, amino acid and lipid metabolism pathways were important pathways for highland barley vinegar relieving constipation. This study proves that highland barley vinegar mainly regulates lipid metabolism, the digestive system and amino acid metabolism to maintain a steady state, prevent intestinal injury, and improve constipation. In short, this study demonstrates that highland barley vinegar can alleviate constipation in mice and repair colitis damage.

1. Introduction

The prevalence of constipation worldwide is approximately 3 to 21 percent, and it is one of the most common gastrointestinal disorders clinically [1]. Constipation can cause cardiovascular disease, colon cancer, inflammation, and Alzheimer’s disease [2], and the occurrence and development of a variety of diseases are often accompanied by constipation [3,4]. With the improvement of people’s health awareness, the use of effective and safe dietary interventions to prevent and treat constipation is an important long-term issue. The occurrence of constipation is thought to be related to various factors, and emerging evidence suggests that dysbiosis of the gut microbiota is another risk factor for the development of constipation [5].
The gut microbiome includes 100 trillion bacteria, of which more than 1000 species belong to the gastrointestinal tract. The intestinal microbiome manipulates host metabolism, immunity, digestion, and development [6,7]. In addition, clinical studies verified that the gut microbiota is associated with constipation in patients [8]. Moreover, the diversity of gut bacteria, such as Bacteroides, Coleella, Actinomycetes, and Prevotella [9], influences intestinal peristalsis, colonic mucin secretion, or colonic transit time [9]. Short-chain fatty acids (SCFAs) help to explain the connection between the gut microbiota and constipation. For example, butyrate is a SCFA that can regulate intestinal peristalsis and enhance intestinal barrier integrity by upregulating the expression of tight junction proteins or mucins [10].
Barley is rich in nutrients and contains the nutrients found in common wheat plants, such as protein, starch, fat, and vitamins, as well as special ingredients, all of which are closely related to human health. For example, dietary fiber has many physiological functions, such as reducing cholesterol absorption, sugar absorption, and energy intake and improving intestinal health by moisturizing the intestines, exerting a laxative function, and alleviating constipation, endowing it with unique advantages [11]. Given its good hydration properties, dietary fiber absorbs water in the intestine, expands, increases the volume of feces, stimulates intestinal peristalsis, and promotes bowel movement [12]. Moreover, the fermentability of dietary fiber means it can be fermented by intestinal microorganisms in the large intestine to produce SCFAs, thereby further regulating the release of intestinal neurotransmitters and improving intestinal motility [13]. Barley vinegar is made from barley as a raw material, and in the fermentation process, using the fermentation technology combining liquid fermentation and solid fermentation after saccharification, the brewing process can effectively retain the original dietary fiber and other beneficial components in barley, providing unique health effects. Therefore, whether and how barley vinegar regulates intestinal flora dysfunction in the development of constipation are noteworthy concerns.
In this study, mice with loperamide hydrochloride-induced constipation were used as the research object, different doses of barley vinegar were added to the feed for the dietary intervention, and the effects of different amounts on constipated mice were investigated. By detecting the changes in the defecation experiment, the small intestinal motility experiment, and the gastric emptying rate in each group of mice, the effect of barley vinegar on intestinal pathology and the secretion of intestinal neurotransmitters was further analyzed, and the effect of barley vinegar intervention on intestinal microbial structure composition and SCFAs in constipated mice was comprehensively assessed.

2. Materials and Methods

2.1. Experimental Materials and Animals

Barley vinegar was obtained from Shanxi Zilin Vinegar Industry Co., Ltd. (Taiyuan, China). The content of acetic acid in the barley vinegar was ≥3.50 g/100 mL, and the total dietary fiber content was 21.50%. Male BALB/c mice were purchased from Beijing Vital River Laboratory Animal Technology Co., Ltd. (Beijing, China) (License number: SCXK (Tianjin) 2010–2030).

2.2. Design of Animal Experiments

Sixty male BALB/c mice were placed in animal rooms in single cages with a 12:12 h light–dark cycle, at a temperature of 20 °C and a relative humidity of 60% ± 5%. After 1 week of adaptive rearing, the 60 mice were randomly divided into 2 groups of 30 for defecation experiments and small bowel motility experiments. Each group was divided into 5 subgroups (n = 6), including the blank group (ND); model group (Mod); and low (LD, 0.5 mL/kg/day), medium (MD, 1.0 mL/kg/day), and high (HD, 2.0 mL/kg/day) barley vinegar dose groups. The ND and Mod groups were given normal feed. Barley vinegar was administered by gavage to the intervention groups.
After the animals were fed with the corresponding feed for 1 week, all mice groups except for the ND group were gavaged with 10 mg/kg·BW loperamide hydrochloride, 0.2 mL/mice, 1 time/day, continuously for 7 days. After successful modeling, the body weight and physiological state of the mice were recorded every 3 days.
All animal handling is carried out in accordance with the Guidelines for the Care and Use of Laboratory Animals (Ministry of Science and Technology, Beijing, China, 2006). The protocol was approved by the Animal Ethics Committee of Chinese Academy of Agricultural Sciences (CAAS20210910).

2.3. Animal Sample Collection

On the last day of the experiment, blood samples were taken from the eyeballs, and the resulting serum was obtained after centrifugation (4 °C, 13,000× g centrifugation for 10 min) and kept at −20 °C for biochemical detection. Colonic feces were collected in a clean stage using sterilized EP tubes, stored in liquid nitrogen, and stored at −80 °C for intestinal flora sequencing and SCFA and metabolomics determination.
For each group, three randomly selected colons dissected in defecation experiments and weighing 0.1 g each were cleaned with 0.9% normal saline. Then, the colonic tissue samples were divided and placed into sterilized centrifuge tubes containing 4% tissue fixative solution for histopathological analysis.

2.4. Bowel Movements and Gastric Emptying Tests

Properochlorine hydrochloride administration of 0.2 mL/mouse was performed for the defecation experimental group. After 30 min, gavage ink was administered at 0.1 mL/10 g·BW, with all mice in a single cage in a single aliquot, and we recorded the time required for the first melena of each mouse to pass. The time and the total weight (wet weight) and number of melena excreted within 6 h for each mouse and the time of the occurrence of the first black stool of the mice were noted.
The entire stomach of the mice in the small bowel exercise experiment was cut, the total weight of the stomach was ascertained, and the stomach was cut along the large curve. The stomach contents were washed with 0.9% normal saline, the filter papers used were sucked dry, and the net weight of the stomach was identified. The gastric emptying rate was subsequently calculated according to the following formula.
G a s t r i c   e m p t y i n g   r a t e   % = 1 T o t a l   s t o m a c h   w e i g h t N e t   s t o m a c h   w e i g h t T o t a l   s t o m a c h   w e i g h t × 100 %

2.5. Small Bowel Motility Experiments

The mice in the small intestinal motility group were administered with loperamide hydrochloride at 0.2 mL/mouse. After 30 min, 0.1 mL/10 g·BW gavage ink was administered, and mice were sacrificed after 30 min. Following its complete removal, the small intestine was straightened and measured from the pylorus to the leading edge of the ink (ink advance length). The ink advance rate was calculated according to the following formula.
I n k   a d v a n c e   r a t e   % = I n k   a d v a n c e   l e n g t h T o t a l   l e n g t h   o f   t h e   s m a l l   i n t e s t i n e × 100 %

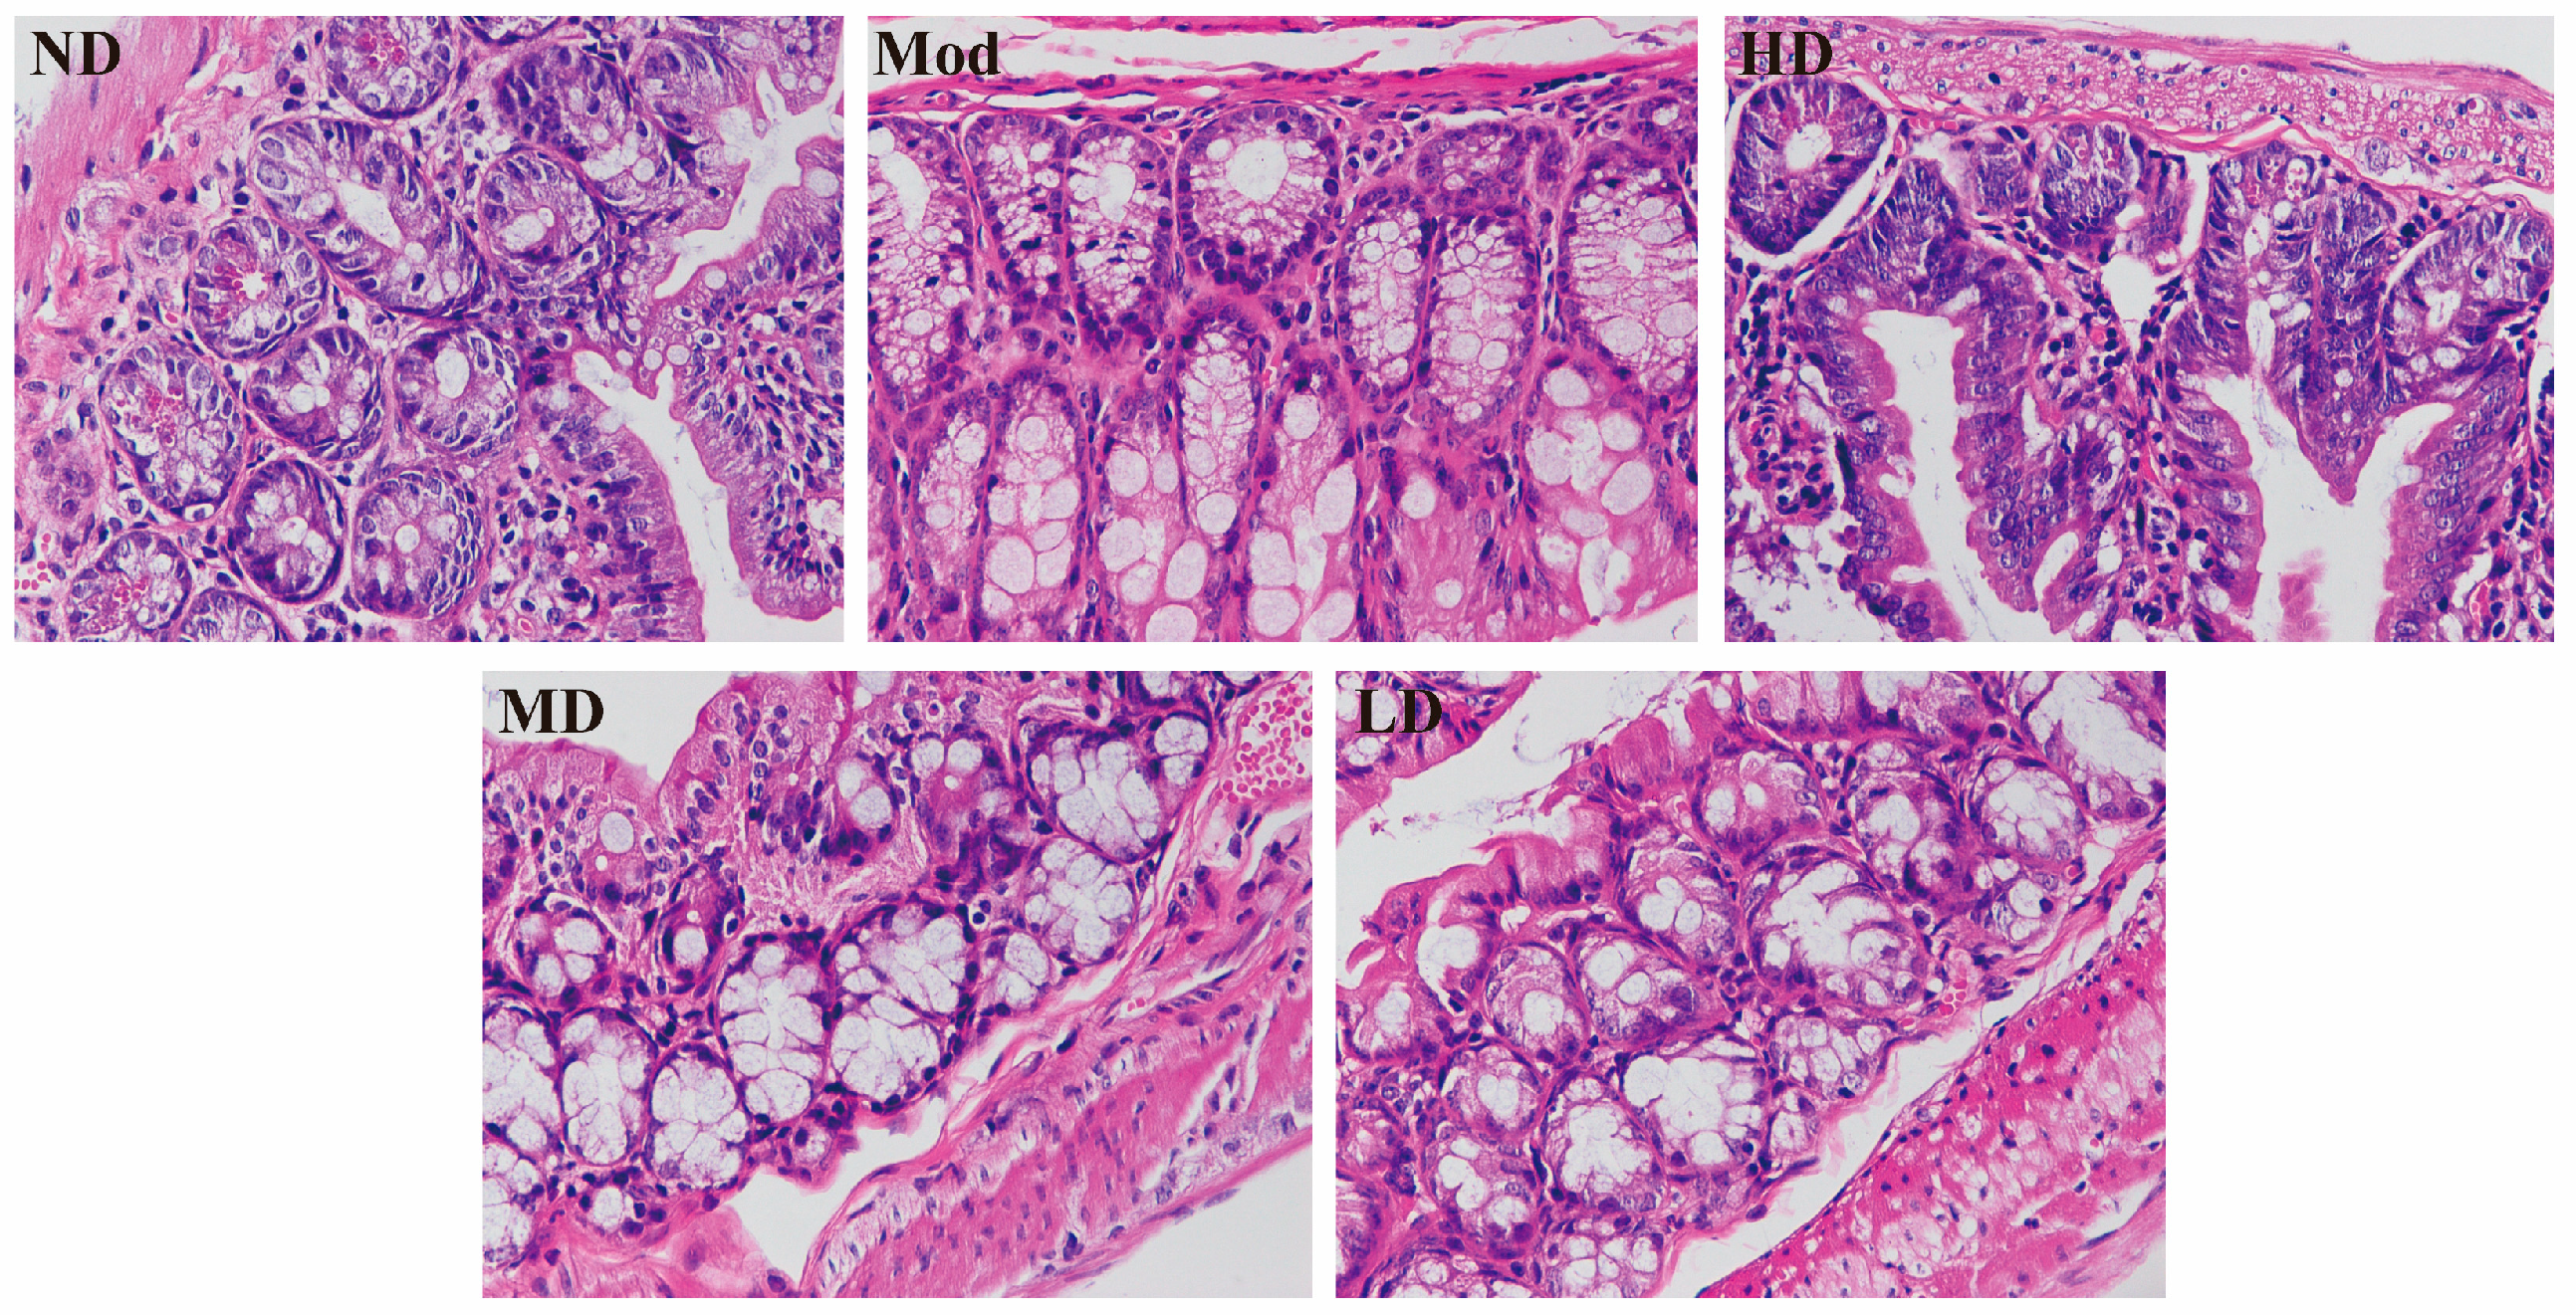
2.6. Histopathological Testing of the Colon

The mice colon was stained using the Alisine Blue-Periodic Acid-Shev Staining Kit (AB-PAS) kit Goldclon (Beijing, China) Biotechnology Co., Ltd (Beijing, China). The colon tissue was removed from the fixative solution and washed repeatedly with water for 30 min. Subsequently, the colon tissue was dehydrated with ethanol, and the dehydrated sample was encapsulated in paraffin. The tissue sections, each with a thickness of approximately 5 μm, were then stained with alisin blue staining solution for 15 min, washed with ddH2O, and then placed in a periodic acid solution and Schiff base for oxidation and staining. After rinsing under running water, the sections were blue-returned to observe the morphology of colonic tissue cells.

2.7. Intestinal Neurotransmitter Assay

The levels of the neurotransmitter acetylcholine (Ach), motilin (MTL), substance P (SP), vasoactive intestinal peptide (VIP), nitric oxide (NO), and serotonin (5-HT) from the samples were determined according to the kit instructions at a wavelength of 450 nm.

2.8. Microbial Diversity Analysis

For this analysis, buffer and grinding beads were added to 0.5 g fecal samples, and the mixture was ground in liquid nitrogen to form a homogenate. Then, the total DNA of the samples was extracted with the kit. The concentration and purity of the resulting DNA was measured with an ultra-micro ultraviolet spectrophotometer. The extracted DNA was then PCR amplified, and the amplified fragment was its V3–V4 variable region. The specific amplification procedure was as follows: first, the DNA was initially denatured for 3 min at 95 °C, followed by 27 cycles of denaturing at 95 °C for 30 s each, subsequent annealing at 55 °C for 30 s, followed by extension at 72 °C for 30 s. After the end of the 27 cycles, the annealing was extended for 10 min at 72 °C.
The products amplified by PCR were recovered using a 2% agarose gel and further purified using kits. Then, according to the operation requirements of the Illumina MiSeq platform, a PE 2 × 300 library was constructed for the purified amplified fragments. The construction of the library mainly included the following steps: (1) The amplified fragment was mixed with the “Y”-shaped connector to join fragments. (2) The self-connecting fragment of the joint was removed, and the adsorption of magnetic beads was used to remove the self-connecting fragment of the joint. (3) The obtained library template fragments were enriched, and PCR amplification was used to increase the template concentration. (4) Finally, NaOH solution was added, and DNA was melted in the presence of NaOH to form single-stranded DNA fragments. Illumina’s MiSeq PE300 platform (Illumina, San Diego, CA, USA)was employed to sequence the constructed library.

2.9. Determination of Short-Chain Fatty Acid Content

The preparation of the mixed stock solution was as follows: 9920 μL of ethyl acetate was placed into a 15 mL centrifuge tube to which 10 μL each of 8 SCFA standards was added. The tube was centrifuged and the solution was mixed well to obtain 8 SCFAs mixed stock solution A.
The preparation of the internal standard stock solution was as follows: 9990 μL of ethyl acetate was placed into a 15 mL centrifuge tube to which 10 μL of internal standard 2-ethylbutyric acid was added. The tube was centrifuged and the solution was mixed well to obtain the internal standard stock solution B.
The configured A and B solutions were diluted with ethyl acetate into different concentrations of working solutions and loaded into injection vials for GC-MS detection and analysis.
The sample handling was performed as follows: a 100 mg fecal sample was placed in a 2 mL grinding tube with grinding beads and 1 mL of water with 0.5% phosphoric acid and 50 μg/mL 2-ethylbutyric acid. The sample was ground twice in a freezer mill at 50 Hz for 3 min each, sonicated in an ice water bath for 30 min, placed at 4 °C for 30 min, and centrifuged at 4 °C at 12,000 rpm for 15 min. Then, the supernatant was transferred to a new centrifuge tube, and 500 μL of ethyl acetate was added to the supernatant, which was extracted, sonicated in an ice water bath for 10 min, centrifuged at 12,000 rpm at 4 °C for 10 min, and the supernatant was obtained for GC-MS analysis.
The chromatographic and mass spectrometry conditions were as follows: column: VF-MAXms quartz capillary column (30 m × 0.25 mm × 0.25 μm); inlet temperature, 280 °C, EI ion source temperature, 230 °C, quadruple rod temperature, 150 °C, high-purity helium (purity greater than 99.999%) as the carrier gas, injection volume, 3 μL, undivided injection; column flow, 1 mL/min, 20PSI constant pressure mode; heating procedure: the initial temperature was maintained at 70 °C for 1 min, first heated to 200 °C at 10 °C/min, and then heated to 240 °C at 30 °C/min and maintained for 3 min; mass detection was performed in fully automated scanning mode with a detection range of 30–150 (m/z).

2.10. UHLC-Q-TOF-MS Analysis

Serum metabolomics detection was performed by Shanghai Beauty, Biomedical Technology Co., Ltd. (Shanghai, China). Briefly, 100 μL of rat serum for each experimental group was removed and stored at −80 °C in a 1.5 mL centrifuge tube containing 400 μL of an extraction solution consisting of methanol and water (4:1, v/v); 0.02 mg/mL L-2-chloroaniline was used as the internal standard to extract serum metabolites. The mixture was precipitated at −10 °C and treated with a frozen tissue crusher Wonbio-96c at 50 Hz for 6 min, followed by a cryosonicator (5 °C, 40 kHz) for 30 min. The supernatant was added to the injection vial and tested using the machine. The prepared supernatant was added to LC-MS/MS for analysis. Metabolites were measured using an ACQUITY UPLC HSS T3 (100 mm × 2.1 mm inner diameter, 1.8 µm; Waters, Milford, CT, USA) Thermo UHPLC system consisting of a mass spectrum detection system, equipped with an electrospray ionization (ESI) source from Thermo UHPLC—Q and a precision mass spectrometer to collect cations or anions.
After collection, the raw data were filtered at baseline, calibrated, integrated and peak detected using Progenesis QI 2.3 (Waters Corporation, Milford, CT, USA) software. Finally, the data matrix of the retention time, mass-to-charge ratio and peak intensity was obtained. The MS/MS identification of metabolites and public metabolism of the human metabolome database (HMDB) (http://www.hmdb.ca/) (accessed on 12 December 2021) and Metlin database system (https://metlin.scripps.edu/) (accessed on 15 December 2021) was carried via comparative analysis. Detailed information (chemical structure and name) of the metabolites was obtained. Partial least square discriminant analysis (PLS-DA) and orthogonal partial least square discriminant analysis (OPLS-DA) were used to analyze the global metabolite changes in each experimental group. The validity of all OPLS-DA models was assessed based on R2X (total variation) and Q2 (representing the predictability of the model) to avoid overfitting. The KEGG database (https://www.kegg/jp) (accessed on 12 December 2021) was used for the annotation of metabolic pathways, and the Python software package (Version 3.8.5) and Fisher exact test were used for pathway enrichment and biological pathway analysis.

2.11. Data Analysis and Processing

2.11.1. Pearson Correlation Analysis

Principal component analysis and partial least square discriminant analysis were used to analyze the different species in the gut microbiota. The Wilcoxon rank-sum test was used to statistically analyze the diversity of intestinal microbiota. The correlation between gut microbiota and SCFAs was analyzed by means of Pearson correlation analysis [10]. Spearman correlation analysis was performed to analyze the correlation by using SPSS Statistics (19.0). Correlation heat maps were drawn by using the Multiple Experiment Viewer software (4.9.0).

2.11.2. Data Statistical Analysis

All experiments were repeated 6 times, and results were expressed as mean ± standard deviation. Multiple samples were compared using the SPSS 25 software (IBM). Differences among groups were compared using one-way ANOVA followed by Tukey’s post hoc test or Student’s t-test. Graphs were made with the GraphPad Prism 8 software. A p-value of <0.05 indicates a statistically significant difference between groups.

3. Results

3.1. Changes in Mice Status and Body Weight

First, the state of the mice was observed. The ND group mice had flexible behavior, good mental state, and smooth hair. By contrast, the Mod group mice were slow to move, messy and had poor mental states. The barley vinegar treatment group had flexible behavior, smooth hair, and good physiological state. Subsequently, the weight change of mice was monitored. As shown in Table 1, the weight of the ND group showed a continuous increasing trend with time. Compared with the ND group, the weight of the Mod group did not change significantly with time. Note that to a certain extent, constipation led to growth retardation of mice, a feature which, in turn, affected weight gain. Compared with the body weight of the Mod group, the weight of mice in the barley vinegar treatment group increased, and the increasing trend was similar in the low-, medium-, and high-dose groups.

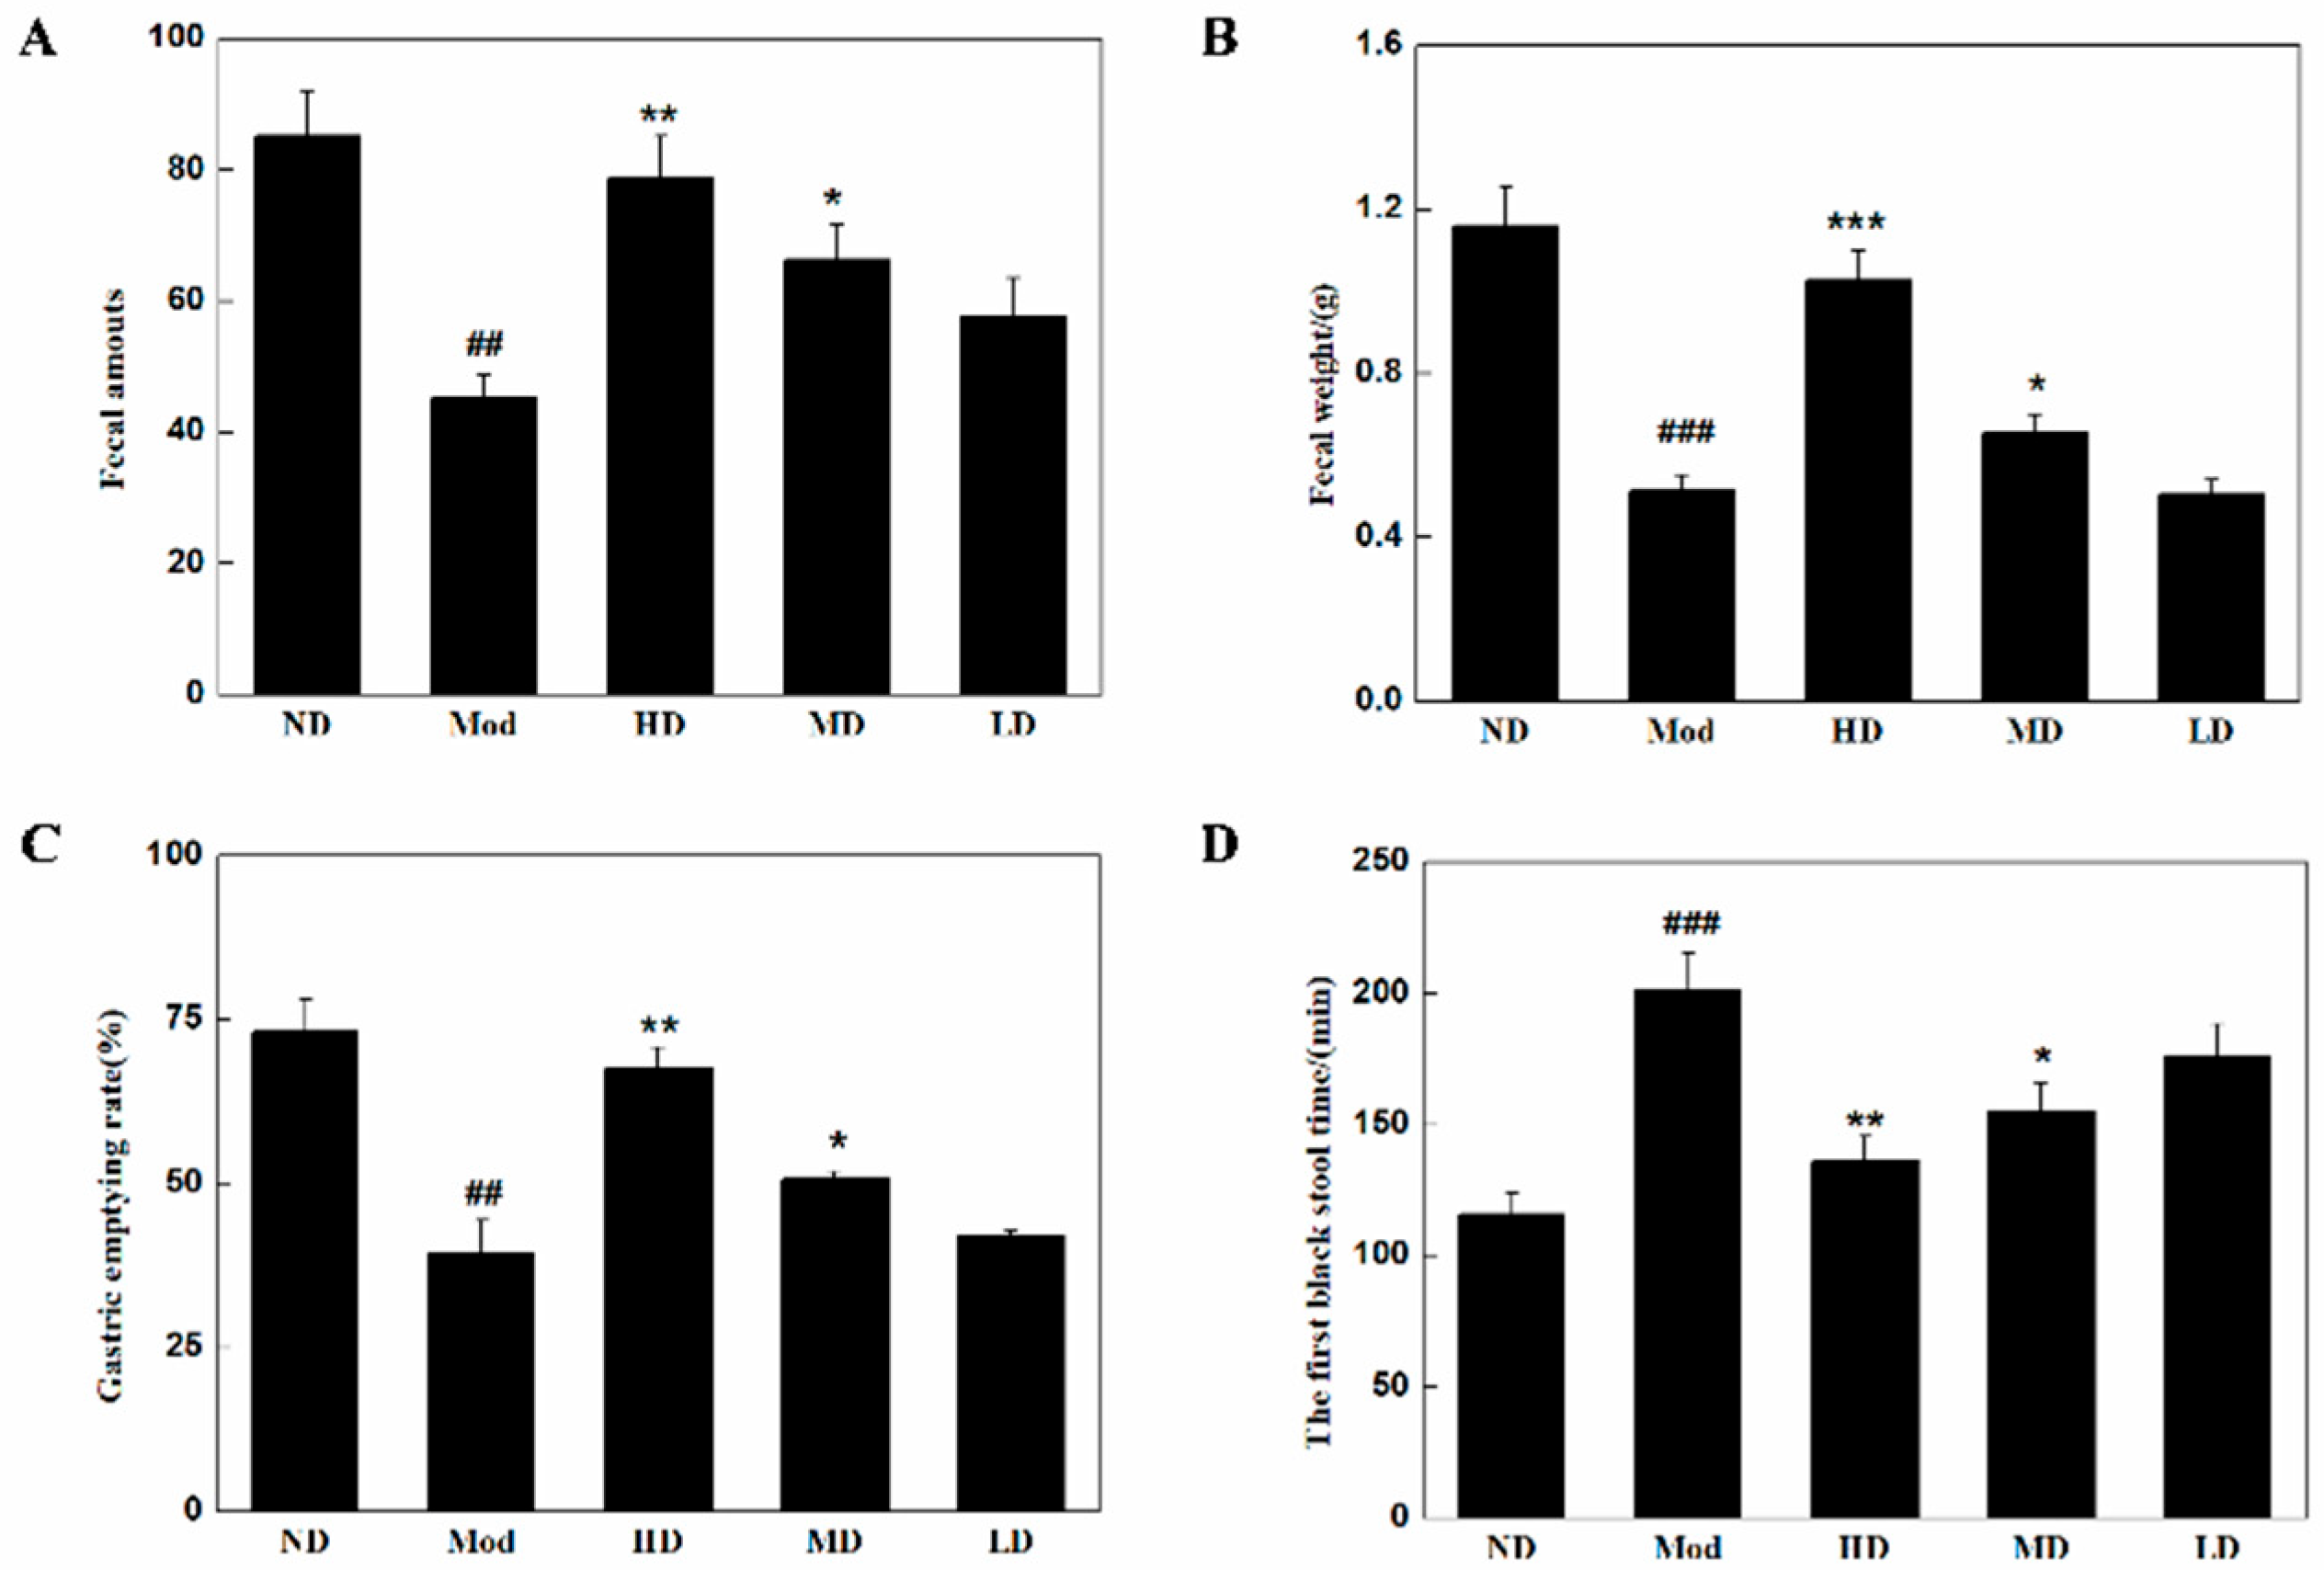
3.2. Changes in Defecation and Gastric Emptying in Mice

The fecal weight, grain number, and first black stool time of mice of the ND and defecation experimental groups were compared, and the outcomes are shown in Figure 1A–C. Compared with the ND group, the Mod group had significantly lower fecal grain number and mouse weight (p < 0.01, p < 0.001), thereby proving that the mouse constipation model was successful. Compared with the Mod group, the HD and MD groups had significantly increased (p < 0.05, p < 0.01, p < 0.001) fecal weight and fecal particle number. The fecal weight and particle number of the LD group increased, but no significant difference was observed. A significant (p < 0.05) or very significant difference (p < 0.01) occurred in the first black stool time of the Mod group, indicating that barley vinegar had a positive gain effect on the defecation function of mice.
The gastric emptying rate (Figure 1C) for the Mod group was significantly reduced compared to the ND group (p < 0.01). Compared with the Mod group, the barley vinegar groups had varying degrees of improved gastric emptying rates, for which the HD group increased significantly (p < 0.01), the MD group increased significantly (p < 0.05), and the LD group increased, but not significantly (p > 0.05).

3.3. Ameliorating Effect on Intestinal Barrier Damage in Mice

In this part, the pathological changes of the colon of mice after different doses of barley vinegar were studied. The HE staining results (Figure 2) indicate that the cell structure of mice in the ND group was clear, and no damage to the goblet cells and crypts was observed. The epithelial cells, goblet cells, and crypts of mice in the Mod group displayed obvious damage, incomplete villi structure, significantly shorter muscle thickness, smaller crypt cells, and obvious inflammatory cell infiltration relative to the outcomes with the ND group. After barley vinegar intervention, the damage in the colonic epithelial cells, goblet cells, and crypts in mice showed different degrees of recovery, and the number of inflammatory cells decreased.

3.4. Effects on Small Bowel Motility in Mice

In this part, the ink propulsion length of mice in the small intestinal motility experimental group was determined. The ink propulsion rates are shown in Table 2. Compared with the ND group, the Mod group had significantly reduced ink propulsion length and propulsion rate (p < 0.01, p < 0.001)—the average propulsion length was reduced by 26.38 cm, and the average propulsion rate was reduced by 57.74%. Compared with the Mod group, the barley vinegar groups had increased ink propulsion lengths and ink propulsion rates, with the HD group showing significantly increased ink propulsion length and ink propulsion rate (p < 0.01, p < 0.001).

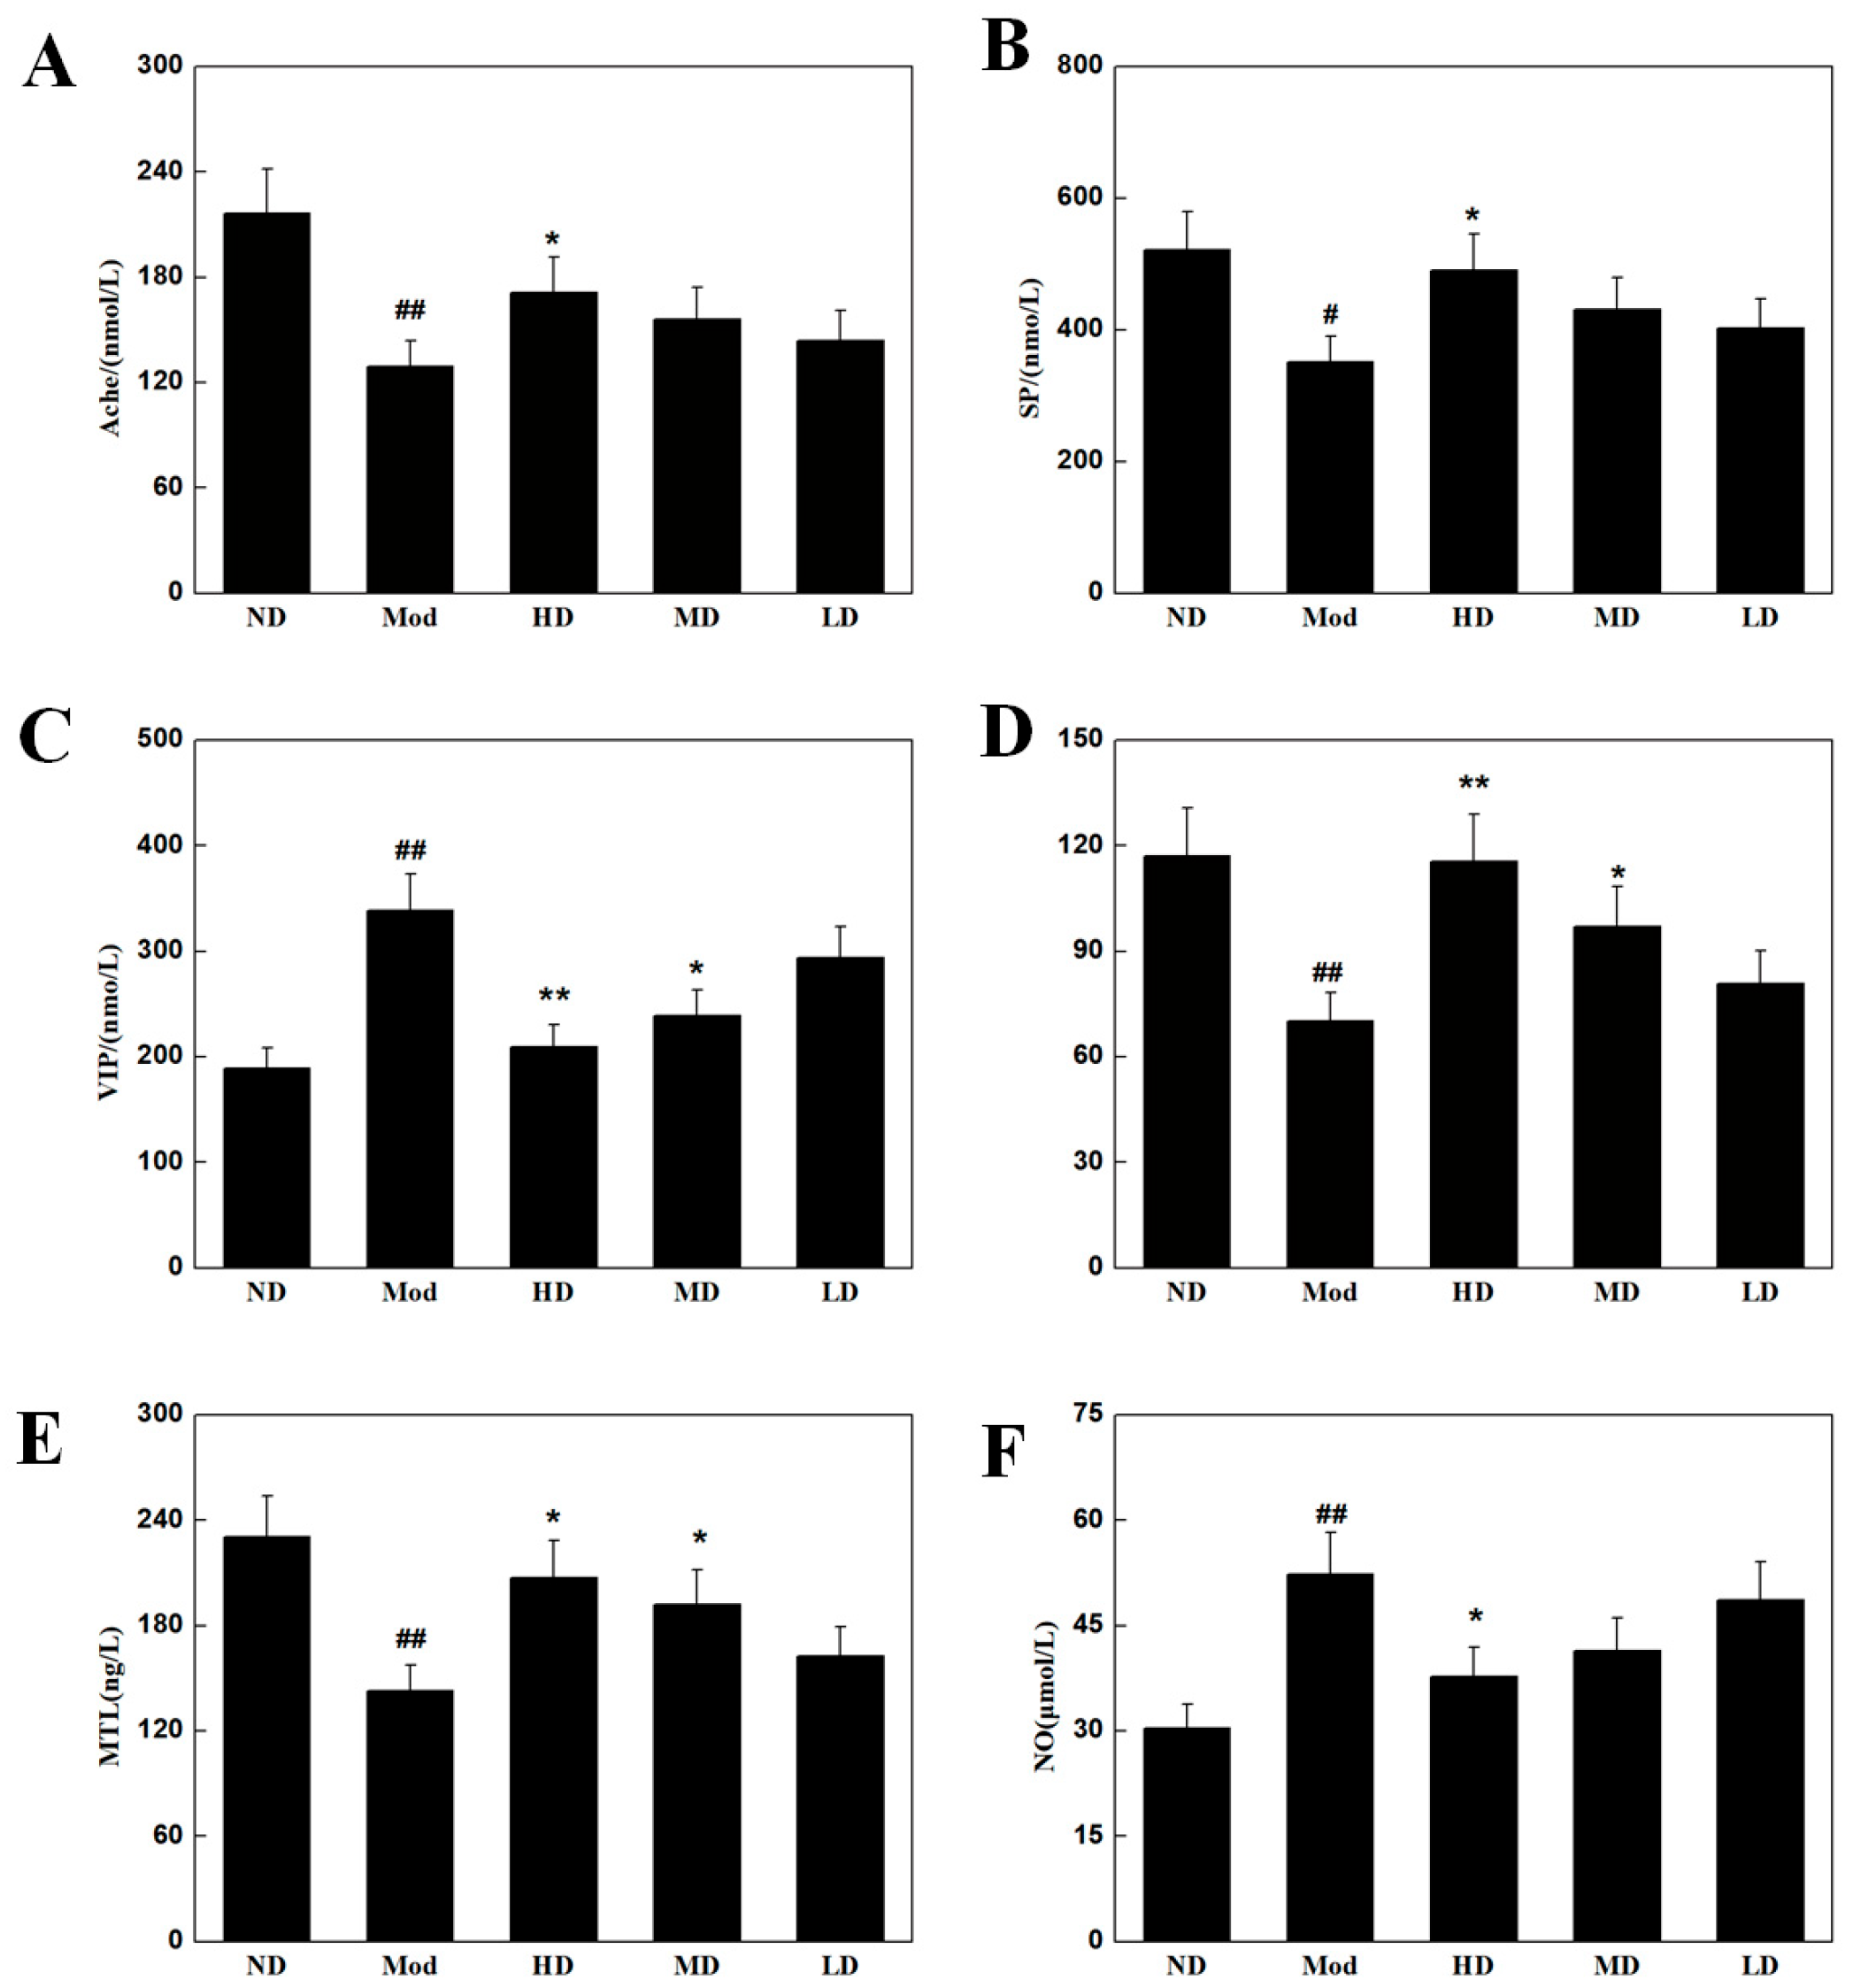
3.5. Effects on Intestinal Neurotransmitters in Mice

The levels of MTL, AChE, SP, 5-HT, VIP, and NO in serum were determined in this section. As shown in Figure 3, the serum levels of MTL, AChE, SP, and 5-HT in mice with loperamide-induced Mod constipation were significantly lower than those for the ND group (p < 0.05, p < 0.01), but the levels of VIP and NO were significantly higher than in the ND group (p < 0.05). Thus, after barley vinegar intervention, the levels of MTL, AChE, SP, and 5-HT in the HD group were significantly higher than those for the Mod group (p < 0.05, p < 0.01), and the levels of VIP and NO in the HD group were significantly lower than those in the Mod group (p < 0.05, p < 0.01).

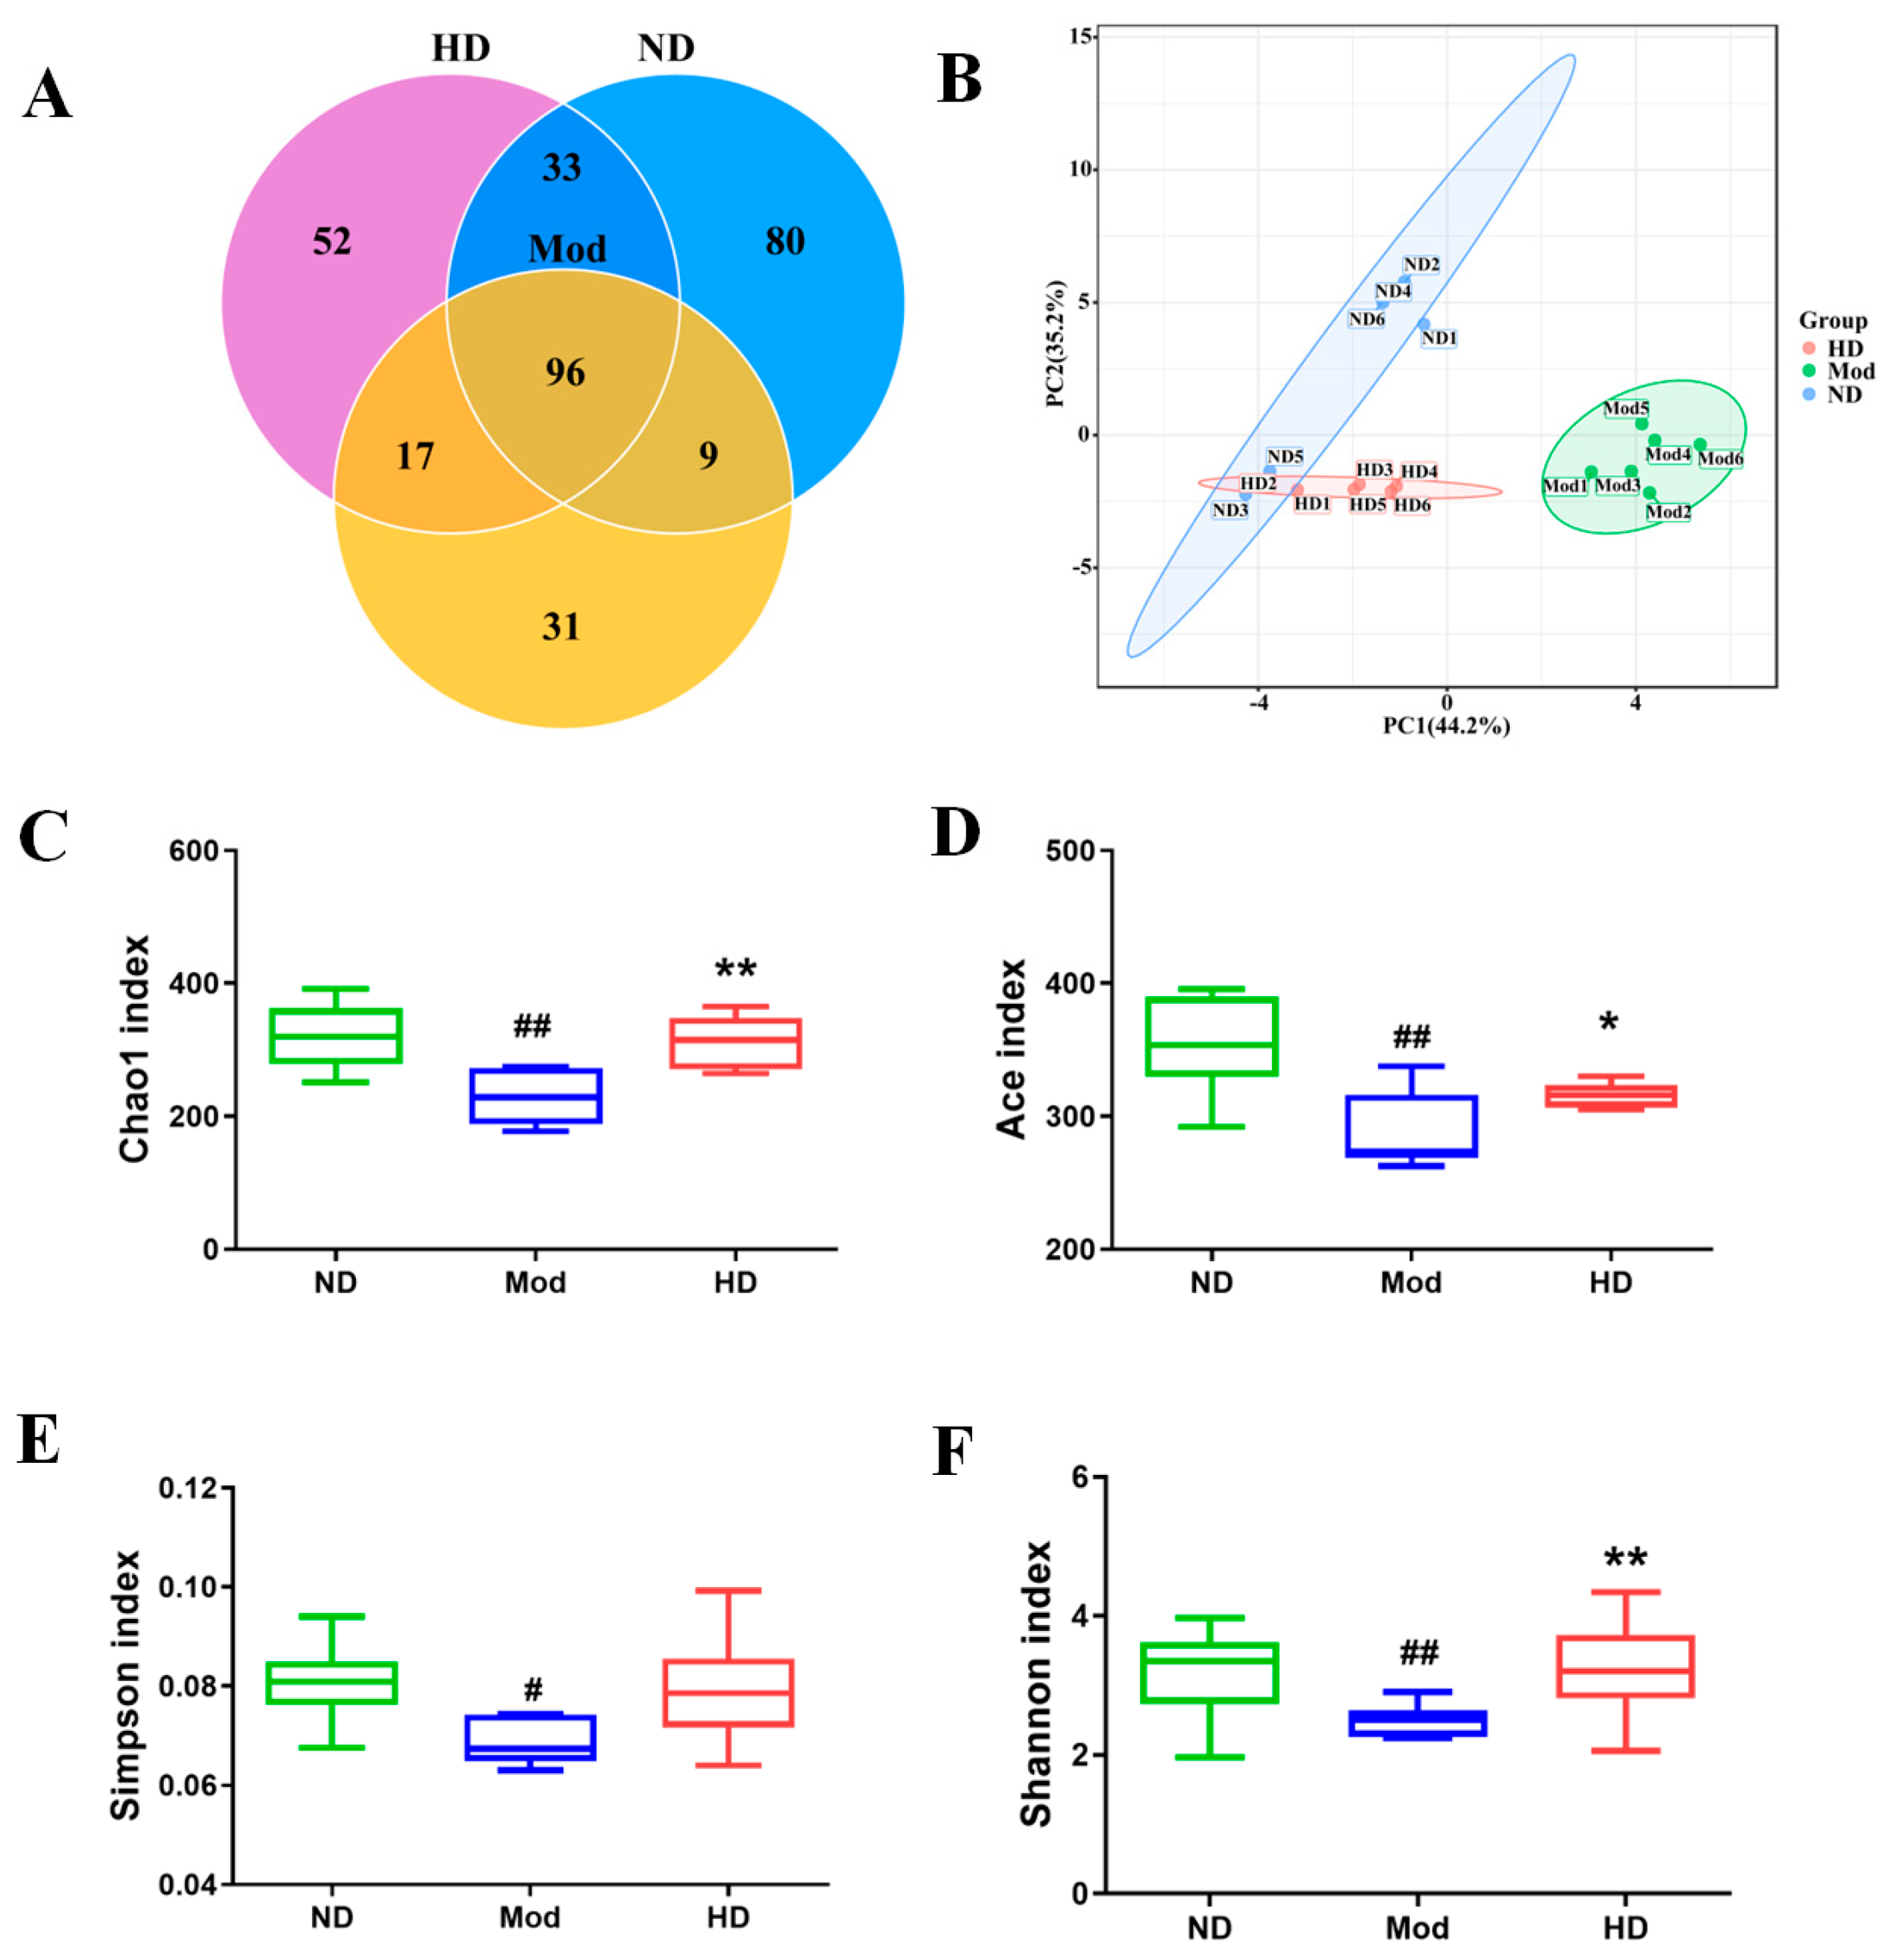
3.6. Effects on the Diversity of Intestinal Flora in Mice

The operational taxonomic unit (OTU) refers to the similarity sequence in 97% of the species taxa. The OTUs in the ND, Mod, and HD groups were analyzed using 16 sRNA sequencing technology, as shown in Figure 4A. The intestinal flora OTUs of the ND group reached 218 with a specific population of 80, those of the Mod group reached 153 with a specific population of 31, and those of the HD group reached 198 with a specific population of 52. Constipation led to a decrease in OTUs and population specificity, but after barley vinegar intervention, the OTUs and population specificity increased.
In this study, principal component analysis (PCA) was further conducted on stool samples at the OTU level, as shown in Figure 4B. The distance between the ND and the Mod groups in the PCA coordinate map was extensive and showed no cross-overlap, indicating that obvious species differences occurred between these groups and that constipation led to changes in the intestinal flora.
The α-diversity of gut microbes in mice is shown in Figure 4C–F. The Ace, Chao, and Shannon indexes in the Mod group decreased significantly compared with the ND group (p < 0.01). Compared with the Mod group, the HD group had Ace, Chao, and Shannon indexes that were significantly increased after the intervention with barley vinegar (p < 0.01, p < 0.05, p < 0.01). Moreover, constipation led to a decrease in the richness and uniformity of intestinal flora, whereas the intervention of barley vinegar significantly increased these features.

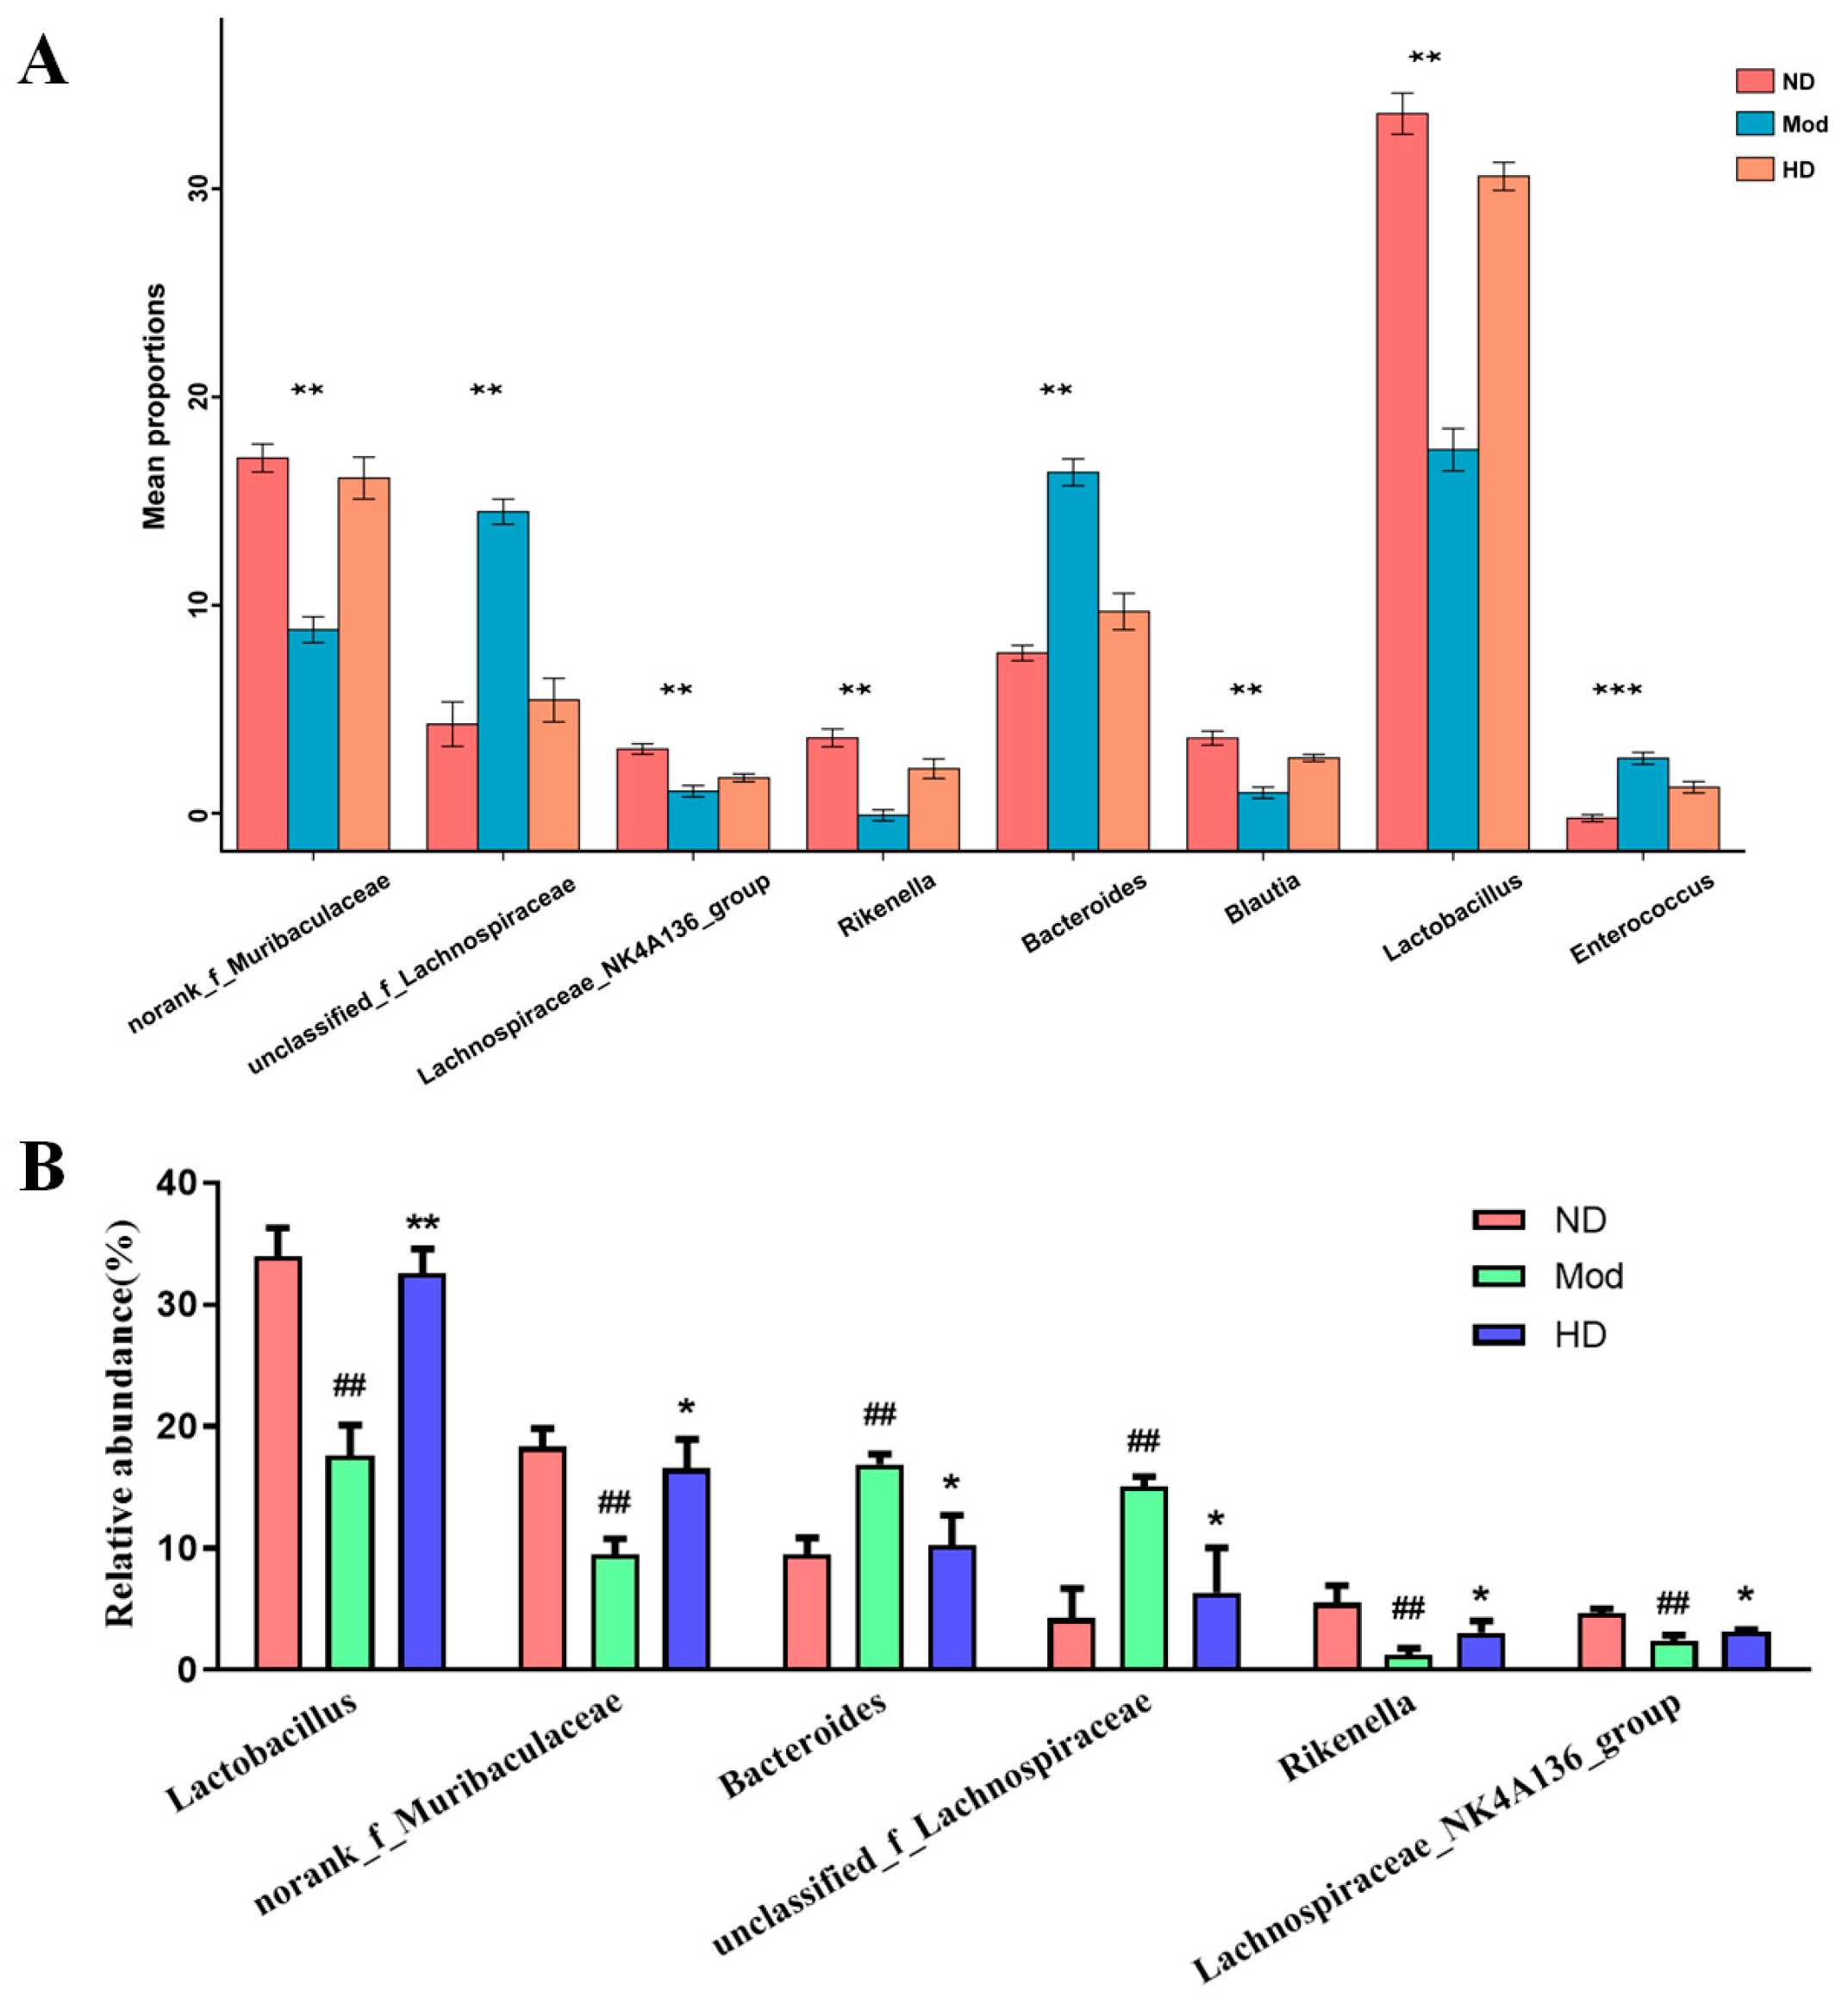
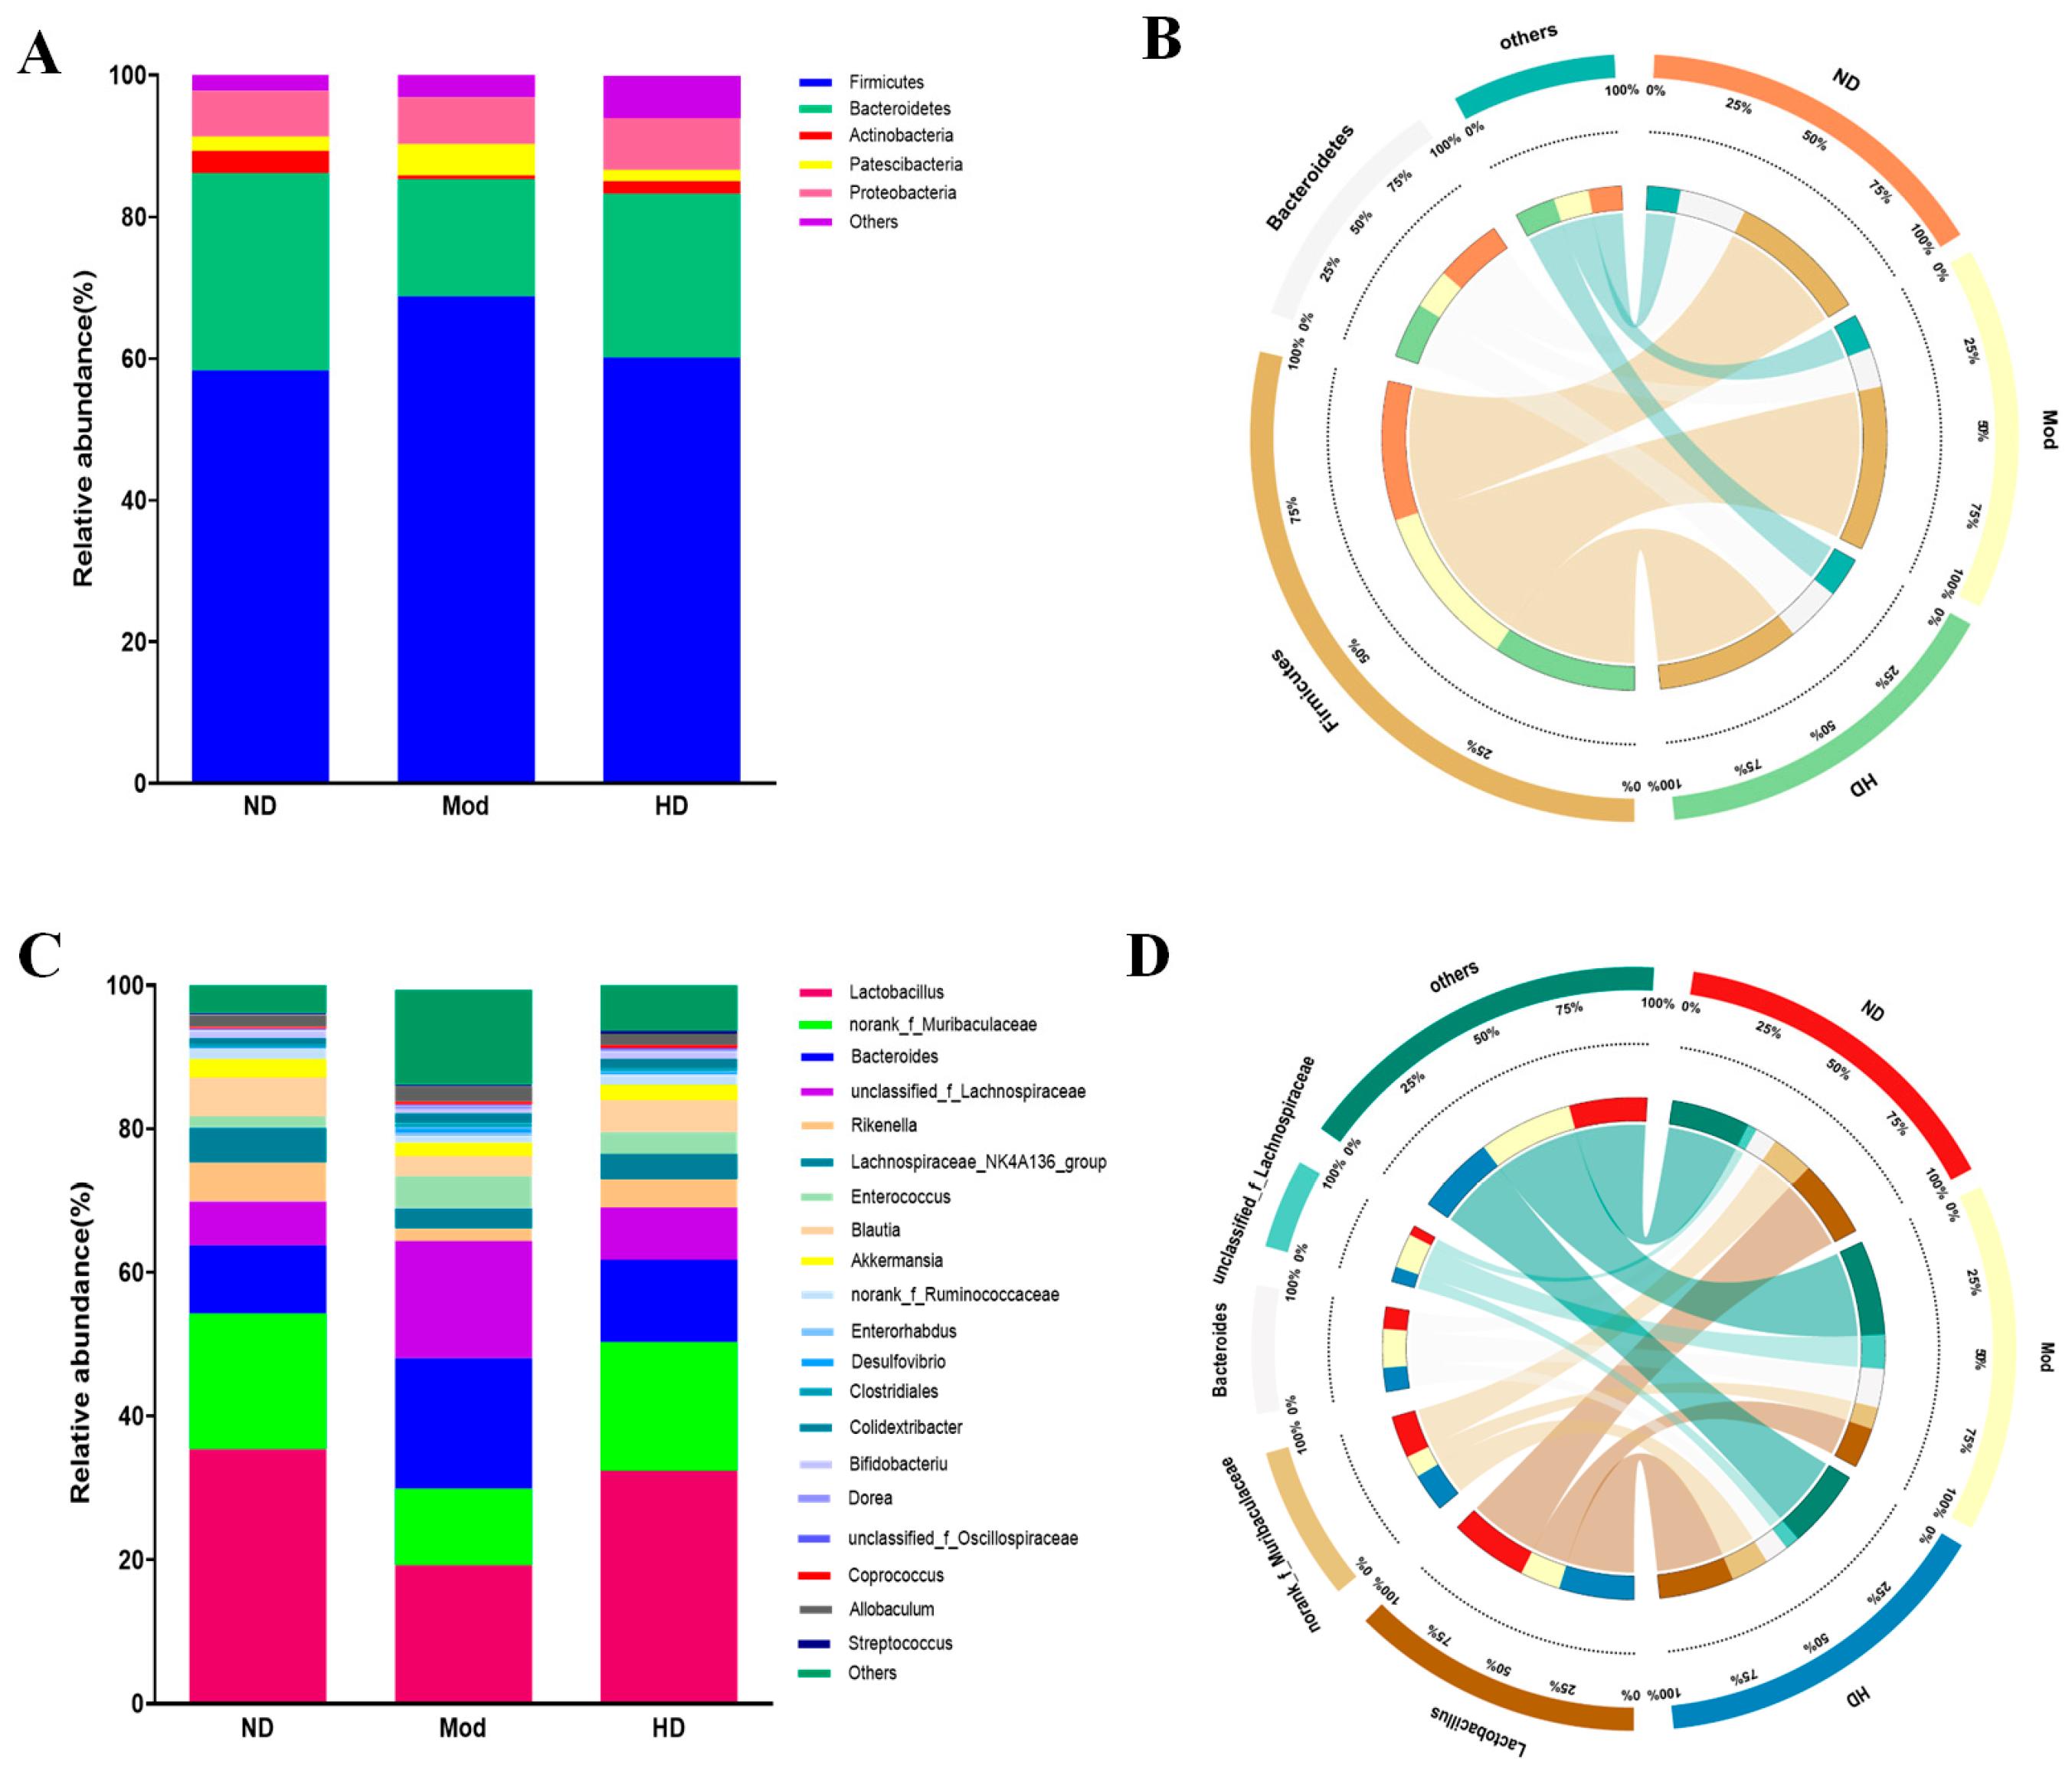
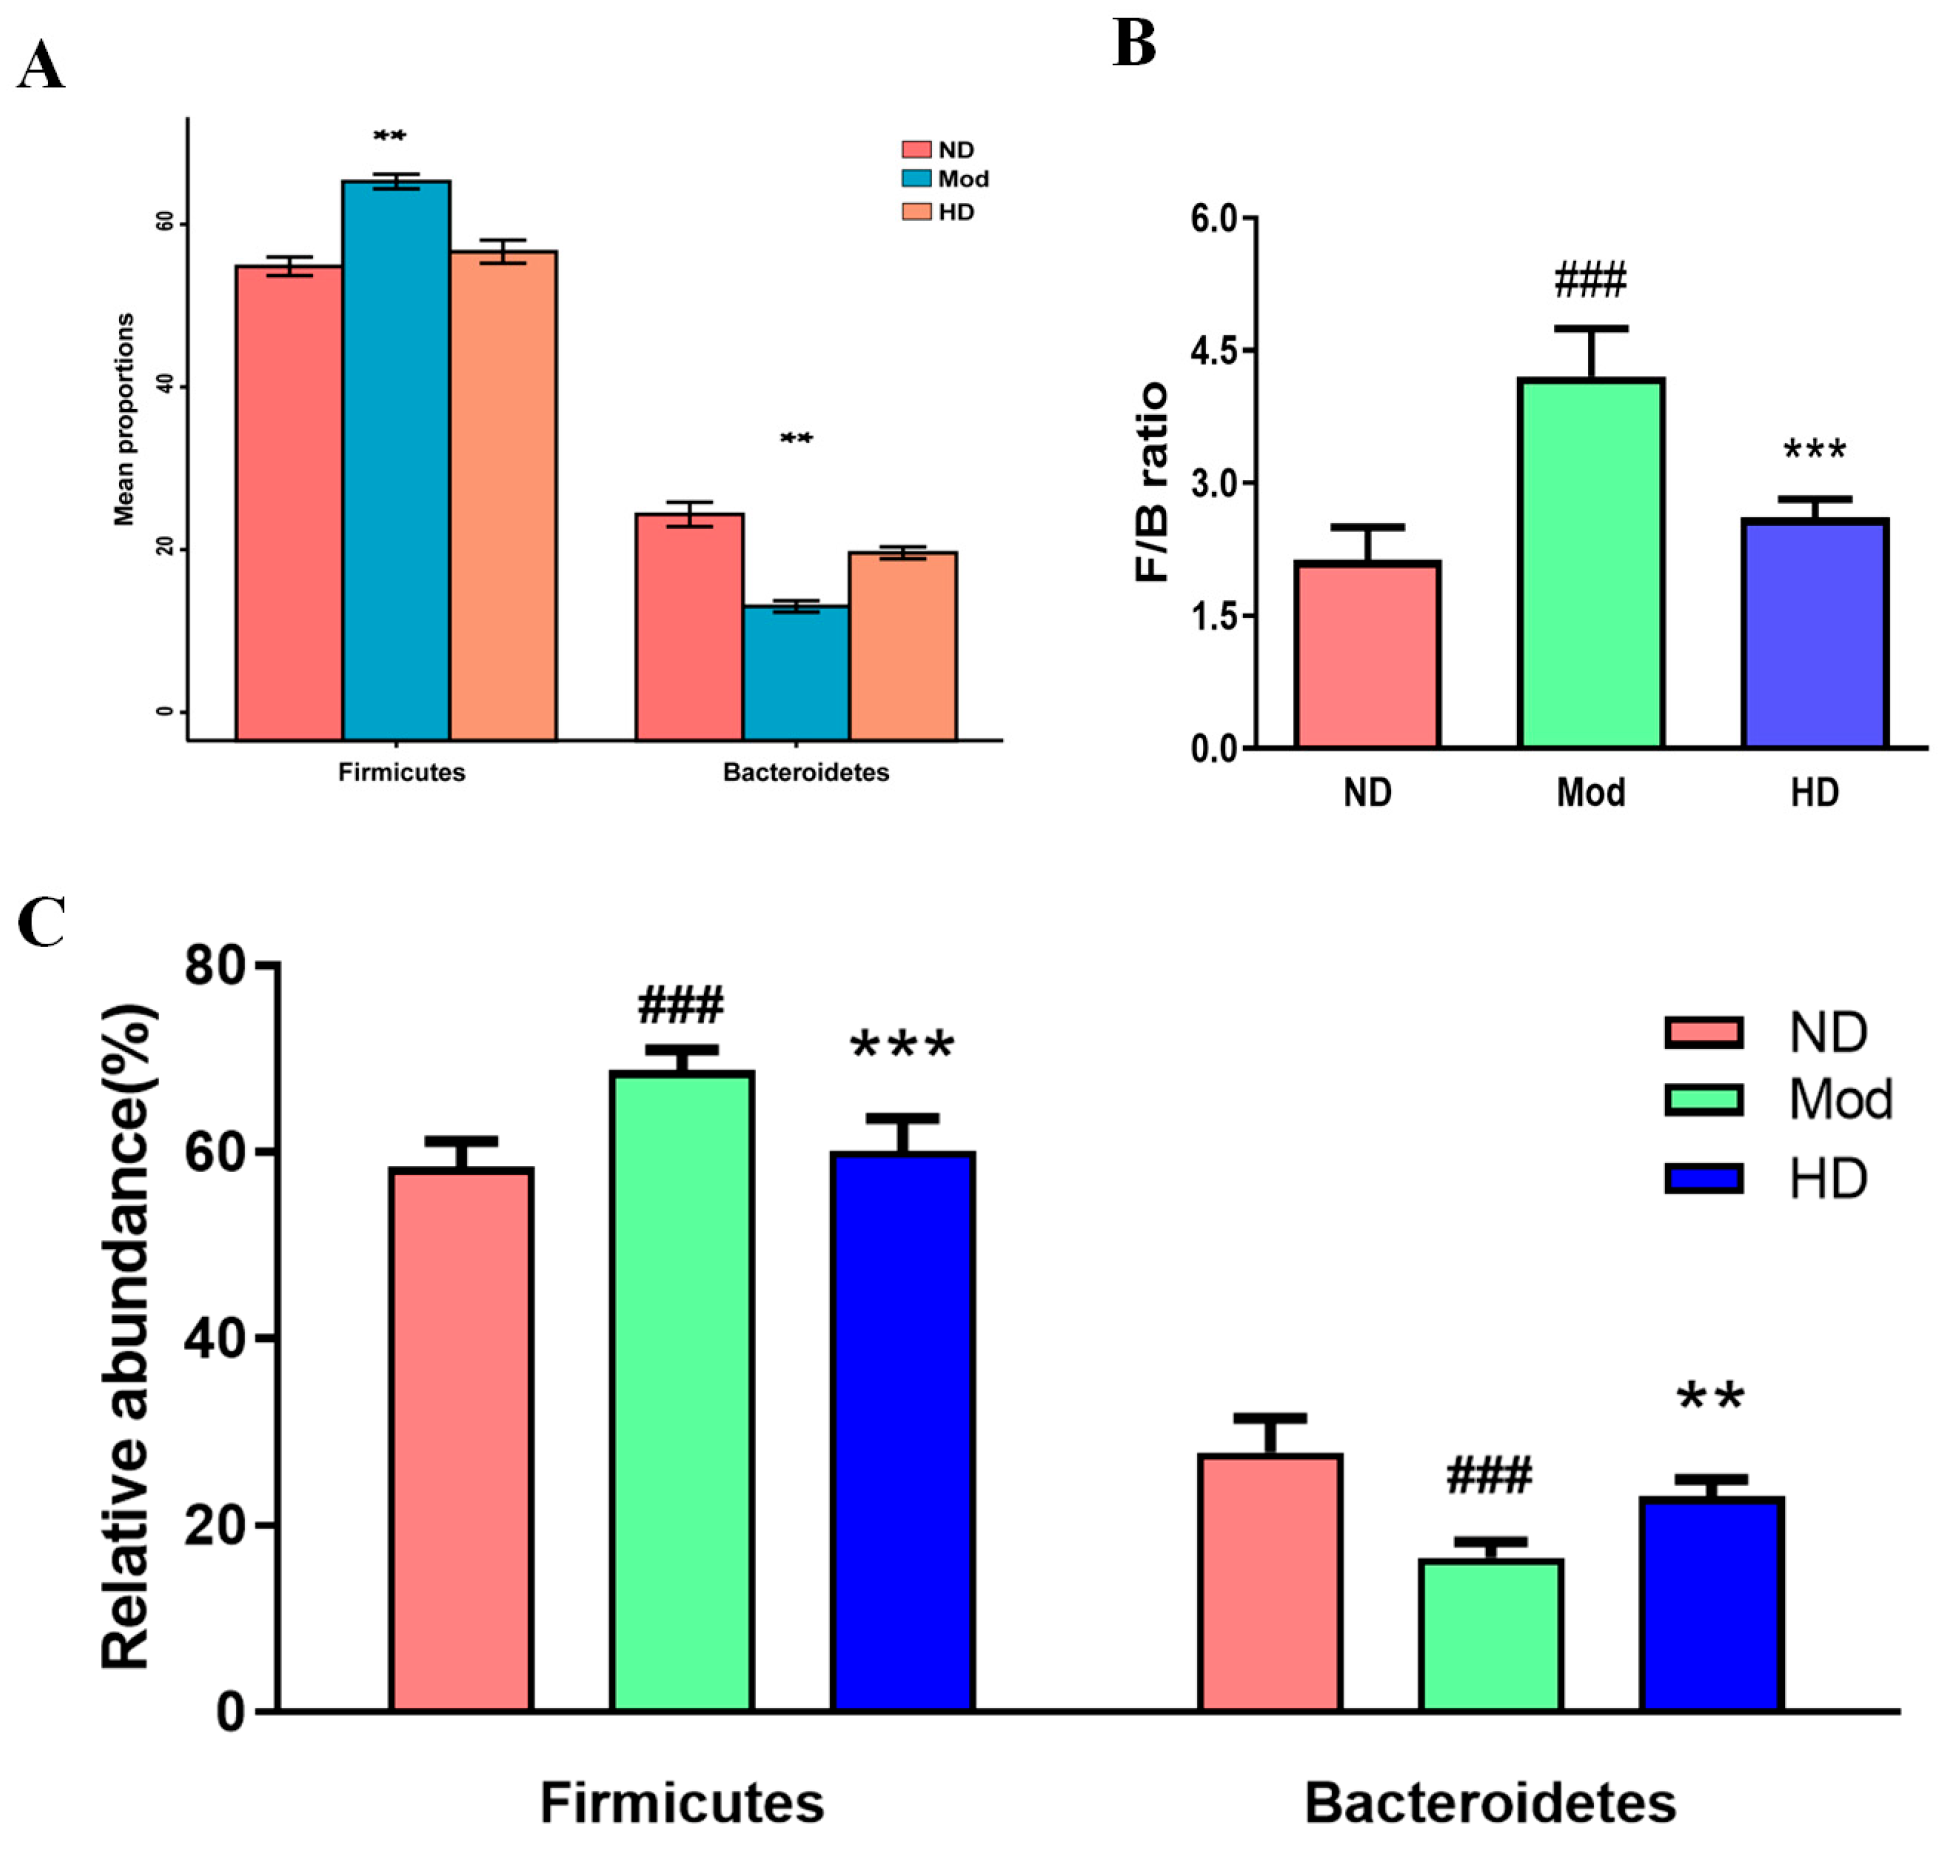
3.7. Changes in the Abundance of Intestinal Flora in Mice

To study the effect of the barley vinegar dietary intervention on the structure of intestinal flora in constipated mice, metastatistics were used to analyze the taxonomic structure of each group of samples to indicate the relative abundance of microorganisms at the phylum level (Figure 5A,B). A total of five phyla were detected, with Firmicutes and Bacteroidota dominating. After the barley vinegar intervention, the relative abundance of Firmicutes was significantly lower and that of Bacteroides was significantly increased compared with the Mod group.
The effect of the barley vinegar intervention on the intestinal microbial structure of constipated mice was further analyzed. The result indicate the prevalence of Lactobacillus, norank_f_Muribaculaceae, Bacteroides, unclassified_f_Lachnospiraceae, Rikenella, Lachnospiraceae_NK4A136_group, Enterococcus, Blautia, Akkermansia, and norank_f_Ruminococcaceae. Among these, Lactobacillus and norank_f_Muribaculaceae were the dominant genera and Lactobacillus accounted for the largest proportion of each group (Figure 5C,D). Lactobacillus belongs to the phylum Firmicutes and is a genus of beneficial intestinal bacteria, including Lactobacillus delbrueckii, Lactobacillus reuteri, Lactobacillus enterobacteria, and other species. Compared with the ND group, the Mod group had significantly reduced abundance of Lactobacillus. The Lactobacillus level also significantly increased after barley vinegar intervention compared with the Mod group.

3.8. Effects on Species Differences in Mice Gut Microbiota

To further determine the effect of the barley vinegar intervention at the phylum and genus levels of intestinal flora in constipated mice, the Wilcoxon rank sum test was used to statistically analyze species differences at the phylum and genus levels of intestinal flora. Differential species analysis of the gut microbiota at the phylum level (Figure 6A) revealed significant differences (p < 0.05) between the ND, Mod, and HD groups, namely for Firmicutes and Bacteroidota. Further analysis of the significance between the groups (Figure 6B,C) indicate that the abundance of Firmicutes in the Mod group increased significantly compared with that of the ND group (p < 0.001), and the abundance of Firmicutes after barley vinegar intervention decreased significantly (p < 0.001). Compared with the ND group, the Mod group showed significantly reduced abundance of Bacteroidota (p < 0.001), and after the barley vinegar intervention, the abundance of Bacteroidota was significantly increased compared with the Mod group (p < 0.01).
The ratio of Firmicutes to Bacteroidota abundance (F/B ratio) is an important indicator of intestinal flora. Herein, the F/B ratio in the Mod group was significantly increased compared to that in the ND group (p < 0.001), and the F/B ratio (p < 0.001) was significantly reduced in the HD group compared to the Mod group.
The genus-level differences in intestinal flora between groups were studied and analyzed. The results show that a total of six microorganisms significantly differed at the genus level (p < 0.05) between the three groups, and the four most abundant microorganisms were Lactobacillus, norank_f_Muribaculaceae, Bacteroides and unclassified_f__Lachnospiraceae (Figure 7A). Further analysis of the significance between the groups of the main strains showed that the abundance of Lactobacillus and norank_f_Muribaculaceae species in the Mod group was significantly reduced compared to that of the ND group, but HD intervention significantly increased the abundance of Lactobacillus and norank_f_Muribaculaceae species (p < 0.01, p < 0.05). In addition, the HD group had significantly increased abundance of the Rikenella and Lachnospiraceae_NK4A136_group genera (p < 0.05) compared with the Mod group.

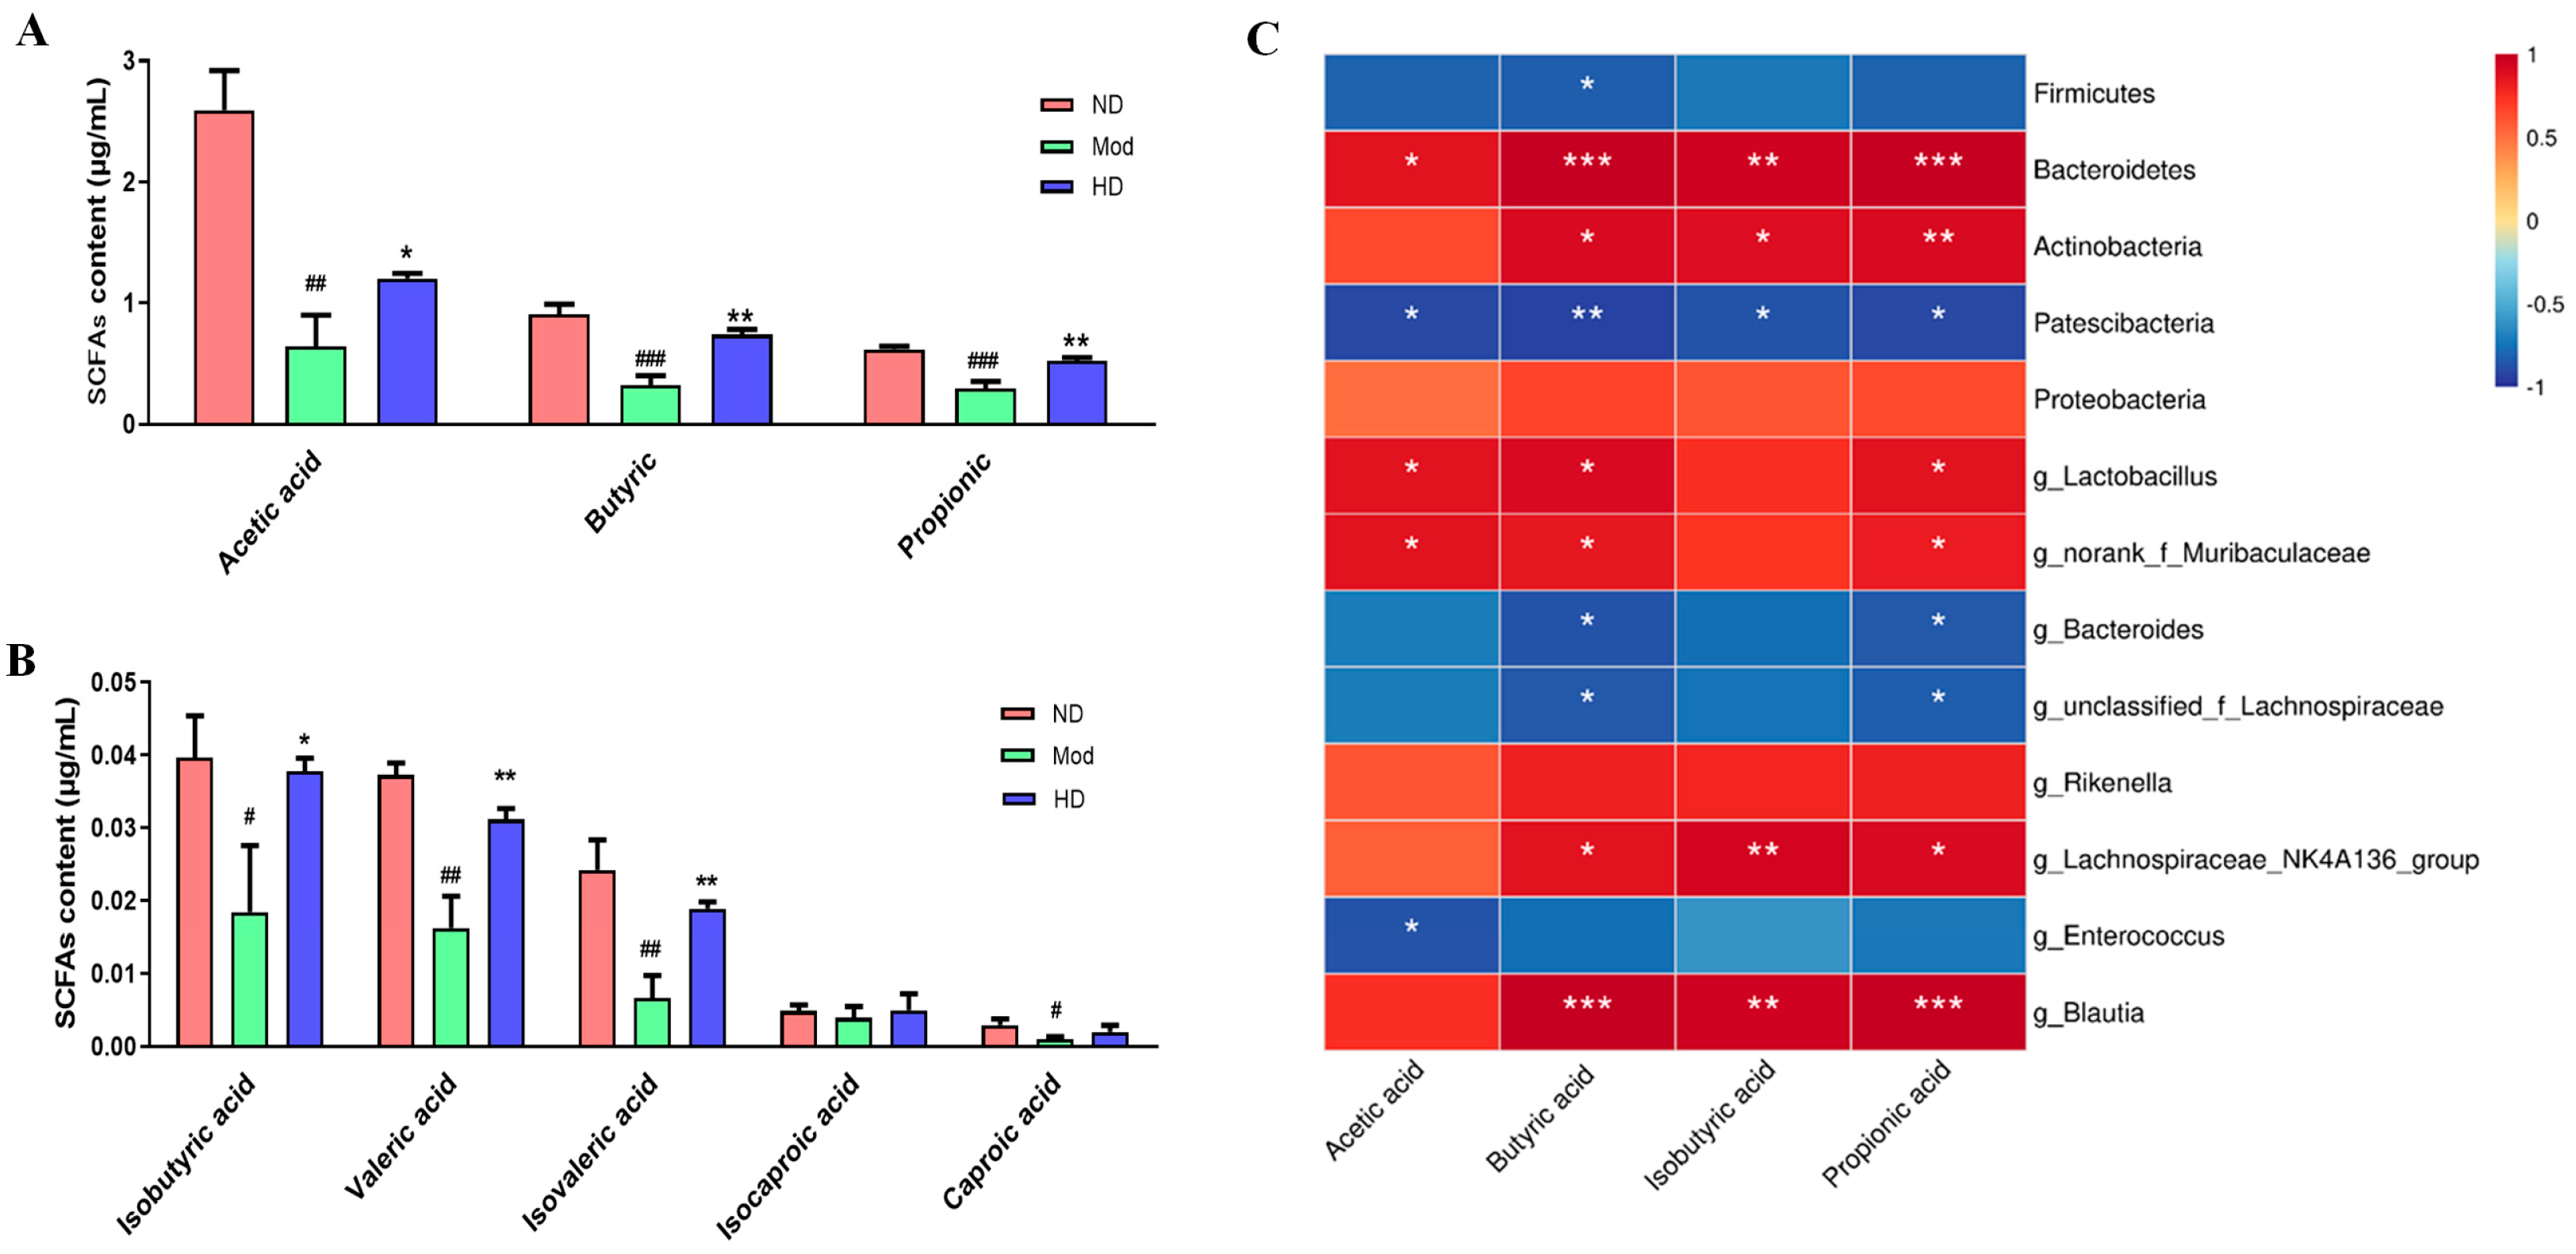
3.9. Fecal Short-Chain Fatty Acid Changes in Mice

SCFAs constitute a bridge to study the connection between intestinal microecology and constipation. After barley vinegar intervention, the SCFA metabolites following colonic fermentation are shown in Figure 8A,B. The acetic acid content in each group was the highest among all SCFAs, followed by butyric acid and propionic acid. The acetic, butyric, and propionic acid levels in the Mod group were significantly reduced compared with those of the ND group (p < 0.01, p < 0.001, p < 0.001), and the acetic, butyric, and propionic acid levels in the barley vinegar group were significantly increased compared with those of the Mod group (p < 0.05, p < 0.01, p < 0.01). In addition, barley vinegar intervention also had significant effects on the isobutyric, valeric, and isovaleric acid levels (p < 0.05).
A certain correlation occurred between intestinal microbes and four SCFAs (Figure 8). At the phylum level, Firmicutes was significantly negatively correlated with butyric acid (p < 0.05), Bacteroidota was significantly positively correlated with acetic, propionic, isobutyric, and butyric acids (p < 0.05), the Actinobacteriota phylum was significantly positively correlated with propionic, isobutyric, and butyric acids (p < 0.05), and the Patescibacteria phylum was significantly negatively correlated with acetic, propionic, isobutyric, and butyric acid (p < 0.05).

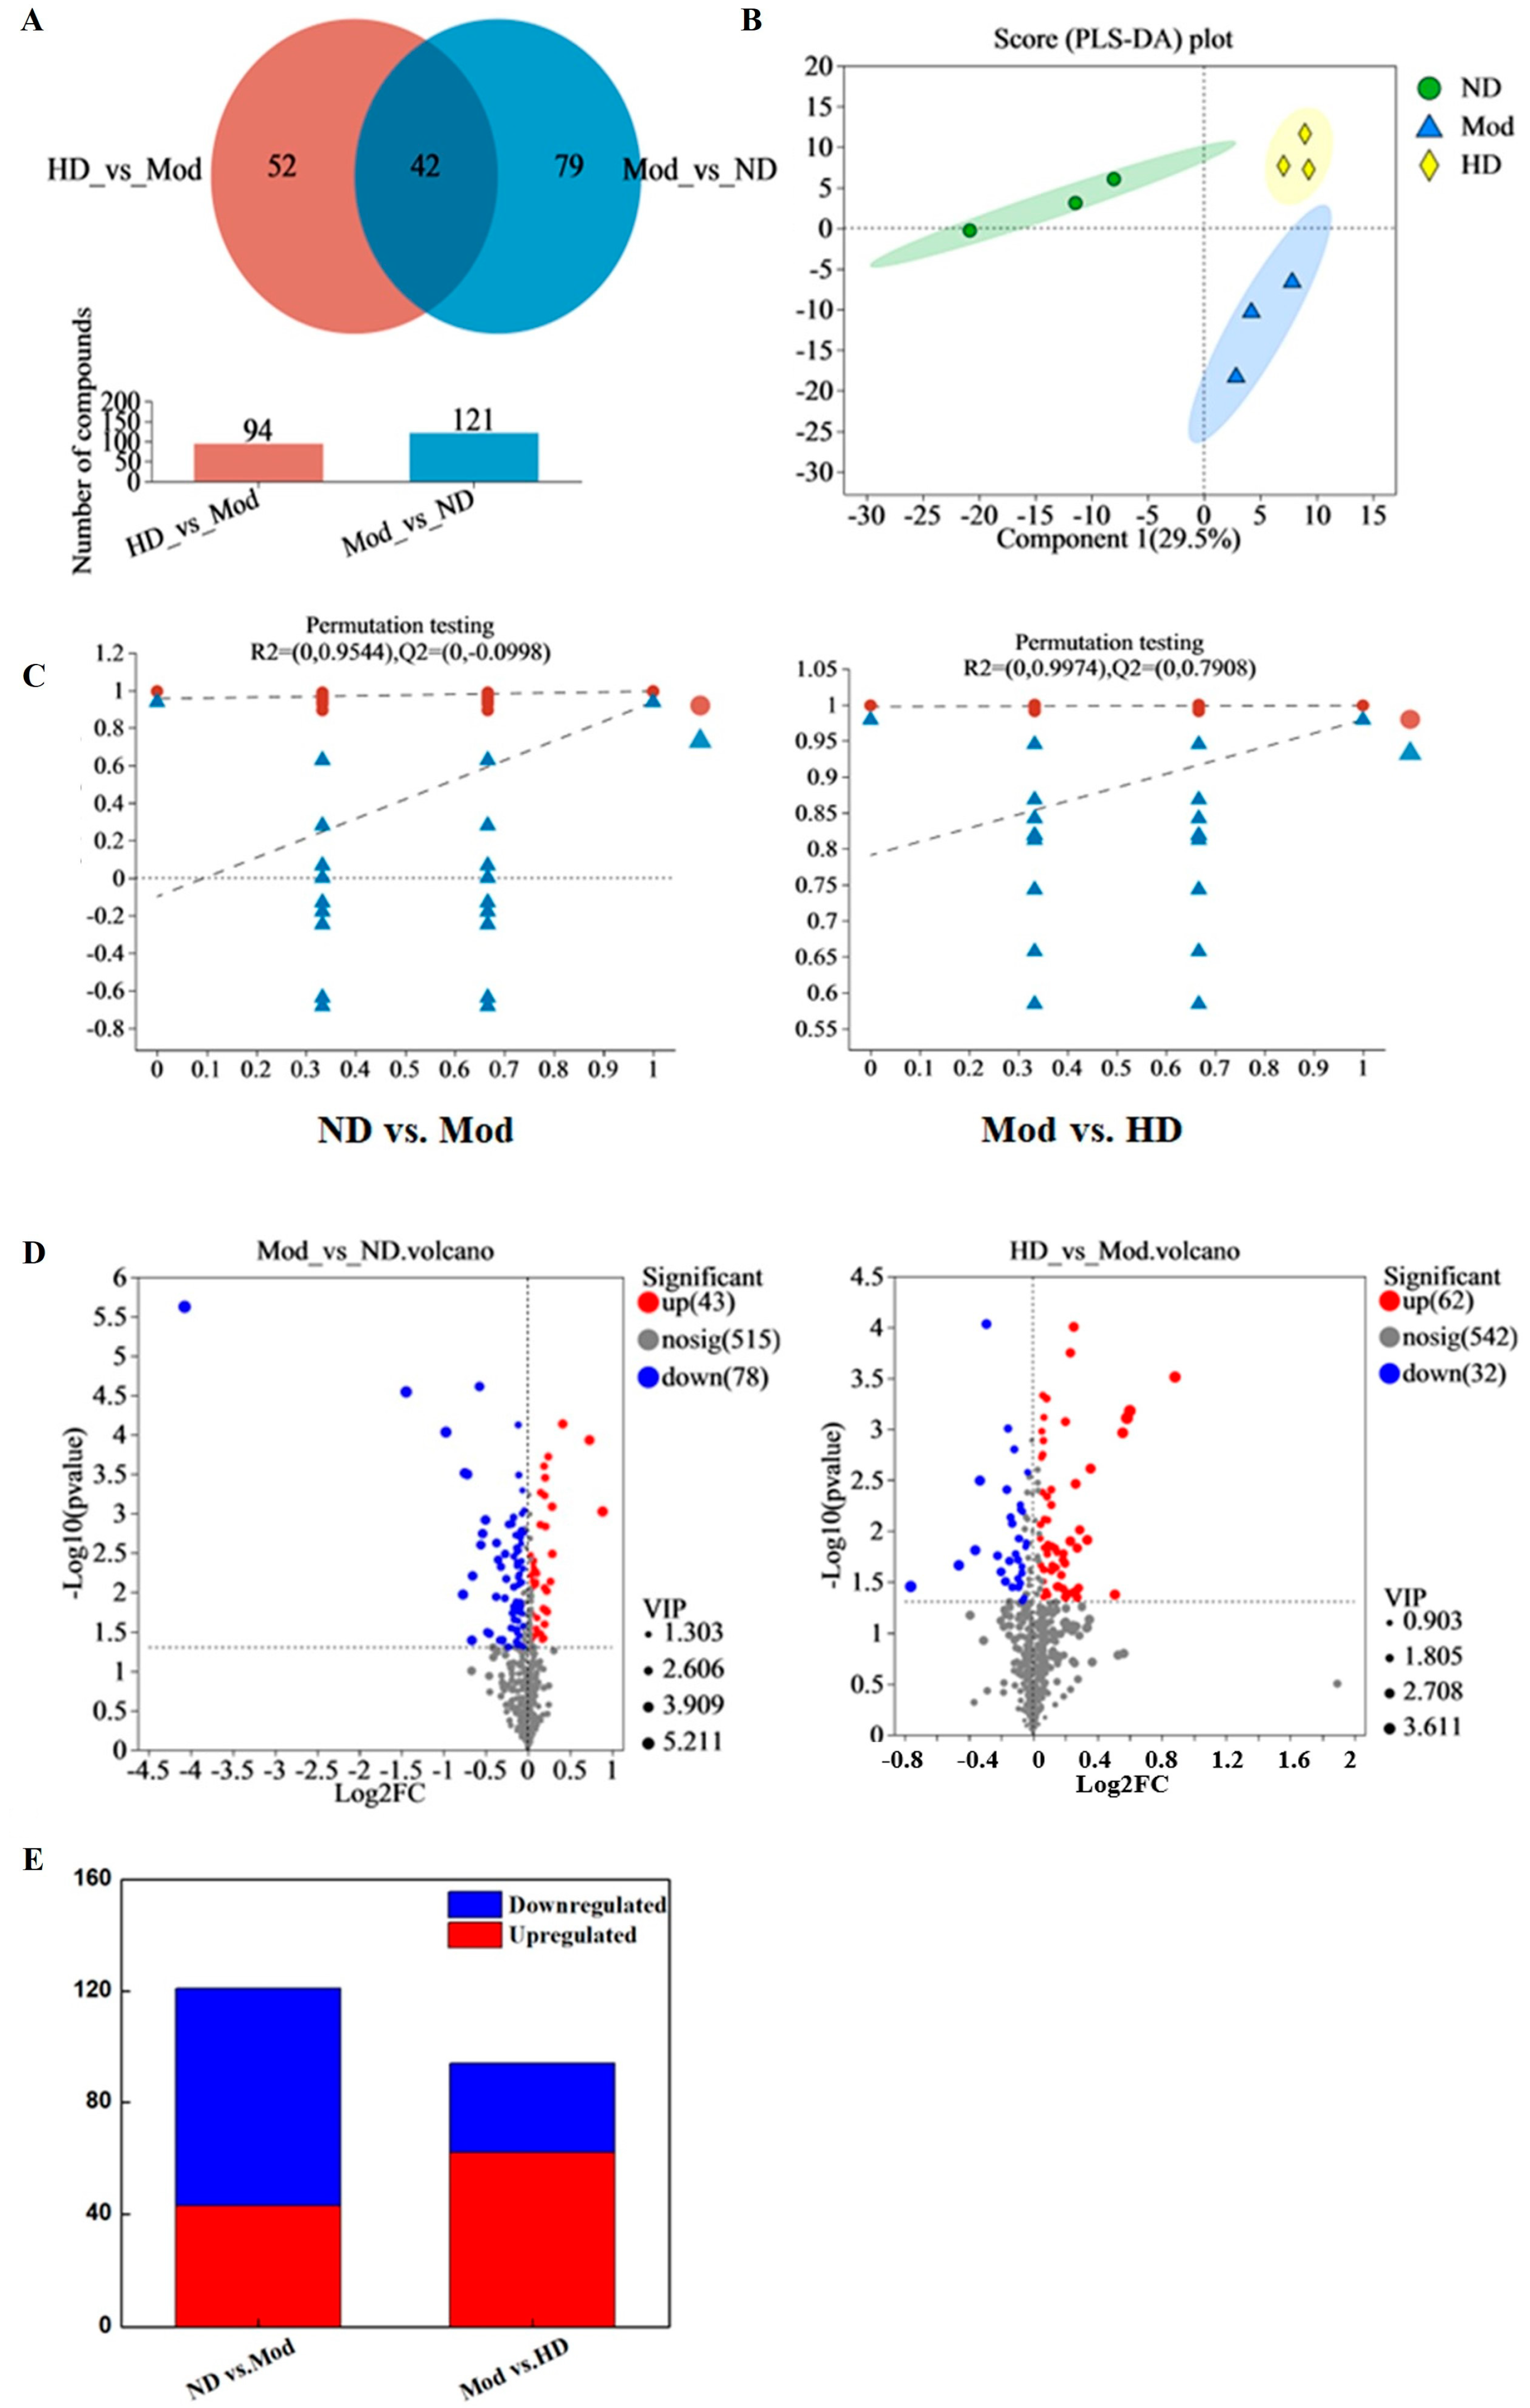
3.10. Effects on Intestinal Metabolic Profile in Mice

3.10.1. Principal Component Analysis and Statistical Analysis of Differences between Groups

Comparing the number of common or unique metabolites in the serum samples between the metabolic sets showed that the number of metabolites in the ND vs. Mod metabolic set was 42, the number of metabolites in the ND vs. Mod metabolic set was 121, the number of metabolites in the unique metabolite set was 79, and the number of metabolites in the MOD vs. HD metabolic set was 94. The number of unique metabolites was 52, and Figure 9A shows that the serum metabolism of the experimental group was significantly affected by highland barley vinegar.
PLS-DA analysis was used to show the sample separation effect. The ND group was significantly separated from all groups in the direction of the first component, and the serum metabolite profile of mice was different from that of rats in the ND group (Figure 9B), indicating that constipation significantly affected the metabolism of rats. However, after the highland barley vinegar intervention, the HD group showed a strong separation pattern from the Mod group in each mode, indicating that the highland barley vinegar intervention significantly affected the overall metabolism of the constipated mice (Figure 9C).
For the standard screening of different metabolites, the p-value was <0.05 and the |log2 FC| was ≥1.5. The volcanic figure shows the metabolite differences for ND vs. Mod and Mod vs. HD, and comparing the two groups, the differences in metabolites were analyzed, and in constipated mice 78 differential metabolites were down-regulated and 43 differential metabolites were up-regulated (Figure 9D,E).

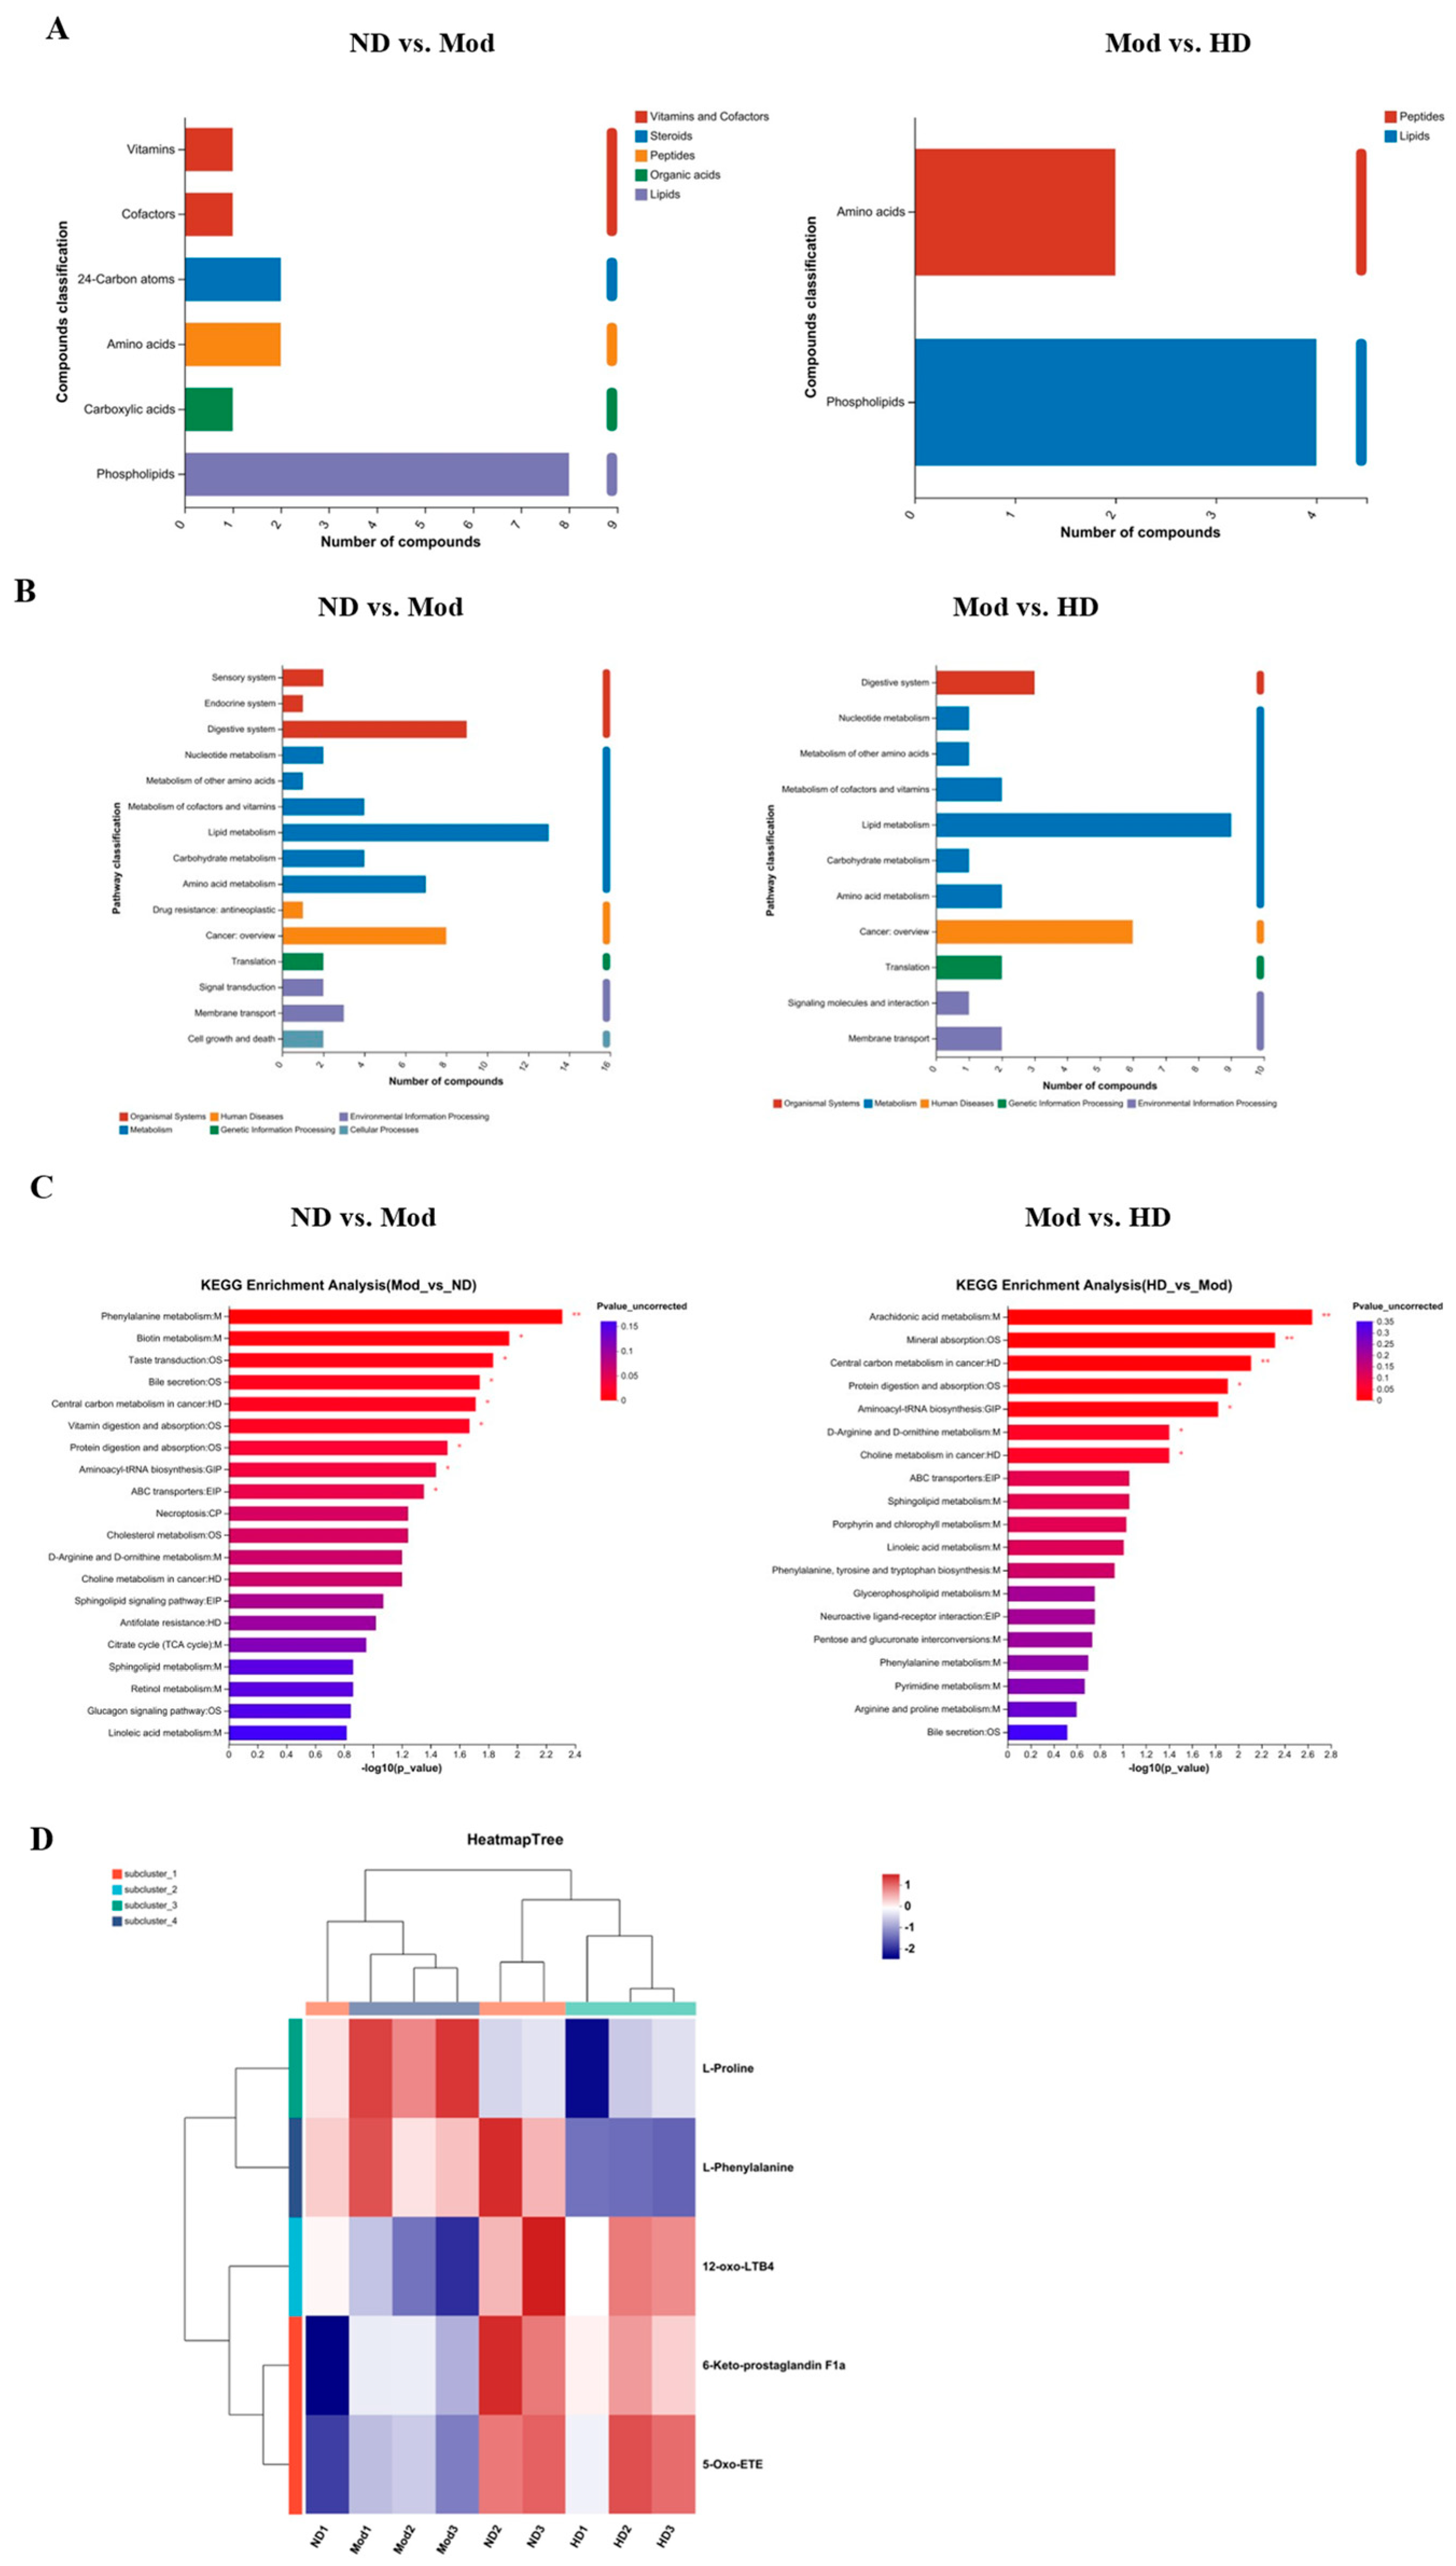
3.10.2. Functional Pathway Statistics and Potential Metabolic Pathway Analysis

KEGG compound classification was performed on the biological function levels of differential metabolites, and it was found that there were eight phospholipid compounds, two amino acid compounds, two vitamin and cofactor compounds, two 24-carbon atom compounds, and one organic acid compound. After the intervention of barley vinegar in constipated mice, four phospholipid compounds and two amino acid compounds were regulated (Figure 10A).
According to the classification statistics of differential metabolites, the functional pathway statistical analysis of differential metabolites was further performed. The pathways affected by highland barley vinegar intervention were mainly involved in lipid metabolism (class 9 compounds), amino acid metabolism (class 2 compounds) and digestive system (class 3 compounds), cancer: overview (class 6 compounds), cofactor and vitamin metabolism (class 2 compounds), and carbohydrate metabolism (class 1 compounds) (Figure 10B).
As shown in Figure 10C, the TOP 20 KEGG pathwayII enrichment map with p < 0.05 is shown. According to the figure, in addition to lipid metabolism-, amino acid metabolism- and digestive system-related pathways, the metabolism of porphyrin and chlorophyll, pentose and glucuronate interconversion, pyrimidine metabolism, D-arginine and D-ornithine metabolism are also regulated by barley vinegar.

4. Discussion

Previous studies have shown that model mice with activated charcoal-induced constipation experienced sustained weight loss, and normal group mice continued to gain weight; compared with the constipation model group, the weight of mice in the low-, medium- and high-dose groups of barley vinegar showed an upward trend, while the weight gain of barley vinegar groups was not significantly correlated with the dose [14]. The results of this investigation are consistent with the body weight changes in mice reported in the literature. In the current study, barley vinegar was shown to alleviate the poor physiological state and weight gain caused by constipation in constipation model mice, thereby improving the growth and development of constipated mice.
Decreased bowel volume is one of the most important features of constipation and its most intuitive manifestation [15]. Dietary fiber has been reported to regulate gastrointestinal transit time, increasing fecal weight and fecal grain count in constipated mice [16]. In this study, the fecal weight and fecal grain number of high and medium barley vinegar dose groups increased significantly, and the outcomes were consistent with those in the above literature. The experimental results showed that the medium and high barley vinegar doses could significantly improve the decrease in stool volume caused by constipation in mice.
Constipation causes a decrease in gastric peristalsis, and the gastric emptying rate reflects the gastric peristalsis of mice. Zhang et al. [17] found that konjac glucomannan can significantly improve the gastric emptying rate of constipated mice induced by loperamide hydrochloride capsules. The experiment conducted in this work revealed consistent results with the above literature. That is, both konjac glucomannan and barley vinegar significantly increased the gastric emptying rate. The experimental results showed that barley vinegar could improve the gastric emptying rate and enhance gastrointestinal peristalsis with a dose-dependent improvement effect.
Constipation causes damage to colonic histiocytes and structural disruption, leading to decreased colonic peristalsis [18]. Li et al. [19] studied the laxative effect of moringa leaf on constipated mice and found that the muscle and mucosal thicknesses of the constipation model mice were significantly thinner than those of the normal group; moreover, the muscle thickness and mucosal thickness of the moringa leaf treatment group were significantly restored. Yin et al. [20] explored the intestinal transport experiments of mice with naringenin intervention for constipation and confirmed that constipated mice showed colonic epithelial cell loss, crypt cell damage, and goblet cell reduction. The damage degree of epithelial cells, crypt cells, and goblet cells in the naringenin intervention group was also lower than that in the constipation model group [20]. The experimental results in the present work indicate that the histopathological changes after the barley vinegar intervention are consistent with the literature results. The treatment effect of the high-dose barley vinegar group was particularly obvious, indicating that barley vinegar can repair colon tissue damage caused by constipation, thereby alleviating constipation.
Constipation leads to a decrease in the peristalsis of the small intestine in mice, and the rate of ink advancement is an important indicator to measure constipation in such subjects [21]. On the one hand, dietary fiber can physically stimulate the inner wall of the gastrointestinal tract and increase the peristalsis ability of the small intestine; on the other hand, dietary fiber has a strong ability to bind water, such that when the digested chyme forms feces, the moisture content increases, the feces soften, and a laxative effect is observed [22,23]. Su et al. [24] studied the improvement of lotus seed oligosaccharides in loperamide-induced constipation of hydrochloride and found that these oligosaccharides and resistant starch mixtures significantly increased the ink advancement rate of the small intestine of mice at low, medium, and high doses (p < 0.05). In this study, medium and high doses of barley vinegar significantly improved the small intestine ink promotion rate of constipated mice, an outcome which was consistent with the results in the above literature. Thus, barley vinegar could increase the ink advance rate of mice and improve the peristalsis of small intestines.
Gastrointestinal regulatory peptides and neurotransmitters are mainly divided into excitatory and inhibitory functional substances, among which MTL, ACh e, SP, and 5-HT are excitatory neurotransmitters and VIP and NO are inhibitory neurotransmitters [25], both of which mainly act on the smooth muscle system of the gastrointestinal tract, thereby contracting and expanding the intestinal tube, regulating the peristalsis of the gastrointestinal tract, and promoting gastrointestinal motility [26]. MTL is one of the main gastrointestinal hormones that stimulate pepsin production and promote gastrointestinal motility [27]. P substance (SP), the first brain-intestinal peptide discovered, can directly act on intestinal smooth muscle, promote the secretion of intestinal water and electrolytes, and stimulate contractile peristalsis [28]. Domestic and foreign scholars have argued that a decrease in SP content may lead to constipation [28]. The VIP mainly innervates the descending reflex of the colon and can bind to VIPR1 to promote periodic peristalsis of the colon. ACh E promotes muscle contraction and mucus secretion, leading to muscle relaxation and excretion [29]. NO causes the contraction of smooth muscle via the stimulation of the CAMP pathway and has an inhibitory effect on gastrointestinal peristalsis [30]. Further, an abnormal 5-HT signaling system can lead to abnormal motility and secretory function of the gastrointestinal tract and hypersensitivity of internal organs, and these functional changes are closely related to gastrointestinal diseases such as chronic constipation, irritable bowel syndrome, diarrhea, and functional dyspepsia [31]. The results of this study are consistent with the improved effect of intestinal neurotransmitters on constipated mice reported in the literature. The serum gastrointestinal motility-related indicators in this work also revealed that barley vinegar regulated the levels of gastrointestinal regulatory peptides and neurotransmitters related to gastrointestinal motility in the serum. Thus, barley vinegar administration is conducive to the relief of constipation symptoms.
Firmicutes and Bacteroides are the two most abundant microorganisms in constipation models [32]. Li et al. [33] found that the relative abundance of Firmicutes in constipated rats accounted for 86.7%. Xu et al. [34] investigated the role of intestinal microbiota in improving intestinal dyskinesia, and found that compared with the non-constipated group, the constipated counterpart had significantly decreased relative abundance of Bacteroides, but the relative abundance of Firmicutes increased significantly. The change trends of Firmicutes and Bacteroides in this experiment are consistent with the above literature. In summary, constipation in this study led to an increase in the abundance of Firmicutes and a decrease in the abundance of Bacteroidota; barley vinegar intervention subsequently caused a decrease in the abundance of Firmicutes and an increase in the abundance of Bacteroidota. Liu et al. [35] found that after quercetin treatment of constipated rats, the number of Lactobacilli in the rat intestinal flora increased significantly. Yao et al. [36] confirmed that wisteria phenol intervention increased the abundance of Lactobacillus and Muribaculaceae in mice with loperamide-induced constipation (p < 0.05). The results of this study are consistent with the above literature, and indicate that the increase in the abundance of Lactobacillus can improve the intestinal microecological environment and relieve constipation to a certain extent. In summary, constipation led to a decrease in the abundance of Lactobacillus and norank_f_Muribaculaceae species in this work, and barley vinegar intervention significantly increased the relative abundance of the intestinal microorganisms Lactobacillus and norank_f_Muribaculaceae, thereby having a laxative effect.
SCFAs are considered important metabolites of the connection of constipation with the gut microbiome, and they play an important role in alleviating constipation by stimulating intestinal wall peristalsis, increasing intestinal osmotic pressure, and promoting water absorption [37]. SCFAs can affect a variety of physiological processes in the body, including providing energy to colonic epithelial cells, maintaining fluid and electrolyte balance, and regulating intestinal flora [38]. As important anions in the colon, SCFAs enhance intestinal osmotic pressure, augment sodium and water absorption, increase intestinal blood flow, promote the proliferation of colonic epithelial cells and the growth of mucosa, and stimulate intestinal motility [39]. Constipation leads to reduced levels of SCFAs, thereby inhibiting bowel movements [40,41]. In this experiment, the SCFA level in the Mod group was lower than that in the ND group, and the SCFA content in the barley vinegar group was higher than that in the Mod group, an outcome which is consistent with the above literature. This work confirms that barley vinegar could increase the content of SCFAs, thereby improving intestinal function.
Lactobacillus is the dominant bacterium for improving constipation [42,43,44]. Several studies have reported increased abundance of Firmicutes, a short-chain fatty acid-producing bacterium [45,46,47]. Chu et al. [45] found that Firmicutes was inversely correlated with the levels of several fecal SCFAs (p < 0.05). Dietary fiber treats chronic constipation by inhibiting colon fermentation and affecting the composition of short-chain fatty acids and intestinal flora [48]. Therefore, we speculate that barley vinegar may relieve constipation by upregulating the abundance of beneficial intestinal microorganisms such as SCFA-producing bacteria (Bacteroidota and Lactobacillus) and down-regulating the abundance of harmful microorganisms (Firmicutes).
Highland barley vinegar mainly regulates the metabolism of phospholipids and amino acids in constipated mice, which is consistent with the purpose of this study. The main metabolic pathways associated with constipation include those related to lipid metabolism, amino acid metabolism, the digestive system, cancer: overview, the metabolism of cofactors and vitamins, and carbohydrate metabolism. Among them, after the intervention with highland barley vinegar, constipation was improved by affecting the secondary metabolic pathways such as lipid metabolism, amino acid metabolism, and digestive system. Studies [49,50,51,52] have found that there are significant differences in the composition of intestinal mucosa and fecal microbiota between patients with constipation and healthy controls. In addition, Nicholson et al. [53,54] proposed that human metabolism is caused by the interaction of one’s own genes and symbiotic microbial genes, and intestinal flora participates in human physiological metabolism through enterohepatic circulation, which affects the pathogenesis and progression of metabolic diseases. The results of this study are consistent with those reported in the literature.
The results of data analysis based on potential pathways showed that arachidonic acid metabolism, glycerophospholipid metabolism, sphingolipid metabolism, and linoleic acid metabolism in lipid metabolism pathways, mineral absorption, protein digestion and absorption in the digestive system, and bile secretion, phenylalanine, tyrosine and tryptophan biosynthesis, phenylalanine metabolism, arginine and proline metabolism in amino acid metabolism pathways are potential targeted metabolic pathways of highland barley vinegar to improve constipation in mice. In order to clarify the effect of highland barley vinegar on metabolites in constipation mice, hierarchical cluster analysis was performed on the expression of related differential metabolites in serum metabolic pathways. The figure visually shows the changes of differential metabolites in each experimental group. Figure 10D shows that the differential metabolites involved in the above metabolic pathways include L-phenylalanine, sphinganine-phosphate, L-proline, 6-Keto-prostaglandin F1a, 5-Oxo-ETE, LysoPC (22:0), LysoPC (24:0), LysoPC (24:1 (15Z)), 2-phenylethanol glucuronide, LysoPC (20:0), 12-oxo-LTB4, and 9-OxoODE. Highland barley vinegar intervention significantly changed the contents of the above differential metabolites. Liu D et al. [36] found that 27 and 22 metabolites related to constipation were screened out in urine and feces, respectively, and these metabolites may affect the metabolism of energy, butyric acid, choline and amino acids. Liu J. et al. [43] explored the constipation model rats induced by loperamide and found that the levels of metabolites such as acetic acid, alanine, glucose, glutamate, glutamine, glycerol, glycine, lactic acid, succinic acid and taurine in the serum of constipated rats were significantly reduced. According to research reports, proline is a protective substance for the inner membrane and enzymes of the body and a free radical scavenger, which can increase the content of the body in some adverse environments to better protect the body. In this experiment, it may be due to the stimulation of the body in the constipation model. The results of this study show that serum metabolites such as L-phenylalanine, sphinganine-phosphate, L-proline, 6-Keto-prostaglandin F1a, 5-Oxo-ETE, LysoPC (22:0), LysoPC (24:0), LysoPC (24:1 (15Z)), 2-phenylethanol, glucuronide, LysoPC (20:0), 12-oxo-LTB4 and 9-OxoODE are related to the occurrence of constipation. These metabolites may affect the metabolism of energy, lipids, proteins and amino acids in the body. The results of this trial are consistent with the findings reported in the literature.
The above results indicate that the metabolism of arachidonic acid, glycerophospholipid, sphingolipid and linoleic acid in lipid metabolism pathway of mice with constipation, mineral absorption, protein digestion and absorption, bile secretion in the digestive system, and phenylalanine, tyrosine and tryptophan biosynthesis, phenylalanine metabolism, arginine and proline metabolism in amino acid metabolism pathways are related. Highland barley vinegar intervention can significantly prevent abnormal changes to potential markers, indicating that improving lipid metabolism pathways, digestive system related metabolic pathways and amino acid metabolism pathways is a potential mechanism to improve constipation in mice.

5. Conclusions

In this study, the barley vinegar was confirmed to have a good laxative effect in vivo, participating in the regulation of intestinal function by regulating the production of enteric neurotransmitters and maintaining the homeostasis of intestinal environment, and we analyzed the mechanism of highland barley vinegar in improving constipation. This study found that highland barley vinegar can effectively regulate the key intestinal bacteria, among which the increase in the abundance of SCFA-producing bacteria further promotes the production of acetic acid and lactic acid, which effectively strengthens the intestinal function, proving that highland barley vinegar promotes the stability of the intestinal environment, maintains the benign cycle between the intestinal microecological environment and metabolism, and achieves the effect of improving constipation. Based on the intestinal function and intestinal metabolism of highland barley vinegar, the structure activity relationship was clarified, and the mechanism of highland barley vinegar improving constipation was systematically analyzed. This study found that highland barley vinegar has the function of improving constipation, which provides a theoretical basis for the development of functional foods or health foods with laxative functions such as dietary fiber beverages, biscuits or nutrition bars, and has very broad application prospects.

Author Contributions

Conceptualization, Y.L.; methodology, A.W.; investigation, M.N.; writing—original draft preparation, Z.C.; writing—review and editing, L.W. and L.L.; supervision, Y.L.; funding acquisition, F.W. and L.T. All authors have read and agreed to the published version of the manuscript.

Funding

This research was funded by the Special National Key Research and Development Plan (Grant No. 2021YFD1600101) and the Key Science and Technology Project of Qinghai Province (Grant No. 2021-0101NCC-0001).

Institutional Review Board Statement

Not applicable.

Informed Consent Statement

Not applicable.

Data Availability Statement

Data are contained within the article.

Conflicts of Interest

The authors declare no conflict of interest.

References

  1. Bharucha, A.E.; Lacy, B.E. Mechanisms, Evaluation, and Management of Chronic Constipation. Gastroenterology 2020, 158, 1232–1249.e3. [Google Scholar] [CrossRef]
  2. Drossman, D.A. The Functional Gastrointestinal Disorders and the Rome III Process. Gastroenterology 2019, 130, 1377–1390. [Google Scholar] [CrossRef]
  3. Wan, Y.; Zhang, D.; Xing, T.; Liu, Q.; Chi, Y.; Zhang, H.; Qian, H. The impact of visceral obesity on chronic constipation, inflammation, immune function and cognitive function in patients with inflammatory bowel disease. Aging 2021, 13, 6702–6711. [Google Scholar] [CrossRef]
  4. Ishiyama, Y.; Hoshide, S.; Mizuno, H.; Kario, K. Constipation-induced pressor effects as triggers for cardiovascular events. J. Clin. Hypertens. 2019, 21, 421–425. [Google Scholar] [CrossRef]
  5. Dimidi, E.; Scott, S.M.; Whelan, K. Probiotics and constipation: Mechanisms of action, evidence for effectiveness and utilisation by patients and healthcare professionals. Proc. Nutr. Soc. 2019, 79, 147–157. [Google Scholar] [CrossRef]
  6. Obata, Y.; Pachnis, V. The Effect of Microbiota and the Immune System on the Development and Organization of the Enteric Nervous System. Gastroenterology 2016, 151, 836–844. [Google Scholar] [CrossRef]
  7. Tremaroli, V.; Bäckhed, F. Functional interactions between the gut microbiota and host metabolism. Nature 2012, 489, 242–249. [Google Scholar] [CrossRef]
  8. Wang, L.; Hu, L.; Xu, Q.; Yin, B.; Fang, D.; Wang, G.; Zhao, J.; Zhang, H.; Chen, W. Bifidobacterium adolescentis Exerts Strain-Specific Effects on Constipation Induced by Loperamide in BALB/c Mice. Int. J. Mol. Sci. 2017, 18, 318. [Google Scholar] [CrossRef]
  9. Qu, C.; Yang, G.-H.; Zheng, R.-B.; Yu, X.-T.; Peng, S.-Z.; Xie, J.-H.; Chen, J.-N.; Wang, X.-F.; Su, Z.-R.; Zhang, X.-J. The immune-regulating effect of Xiao’er Qixingcha in constipated mice induced by high-heat and high-protein diet. BMC Complement. Altern. Med. 2017, 17, 185. [Google Scholar] [CrossRef]
  10. Morrison, D.J.; Preston, T.; Francis, T. Gut microbes formation of short chain fatty acids by the gut microbiota and their impact on human metabolism formation of short chain fatty acids by the gut microbiota and their impact on human metabolism. Gut Microbes 2017, 7, 189–200. [Google Scholar] [CrossRef]
  11. Brownlee, I. The impact of dietary fibre intake on the physiology and health of the stomach and upper gastrointestinal tract. Bioact. Carbohydr. Diet. Fibre 2014, 4, 155–169. [Google Scholar] [CrossRef]
  12. Vu, V.; Muthuramalingam, K.; Singh, V.; Choi, C.; Kim, Y.M.; Unno, T.; Cho, M. Schizophyllum commune-derived β-glucan improves intestinal health demonstrating protective effects against constipation and common metabolic disorders. Appl. Biol. Chem. 2022, 65, 9. [Google Scholar] [CrossRef]
  13. Zhuang, Z.; Chen, M.; Niu, J.; Qu, N.; Ji, B.; Duan, X.; Liu, Z.; Liu, X.; Wang, Y.; Zhao, B. The Manufacturing Process of Kiwifruit Fruit Powder with High Dietary Fiber and Its Laxative Effect. Molecules 2019, 24, 3813. [Google Scholar] [CrossRef]
  14. Li, G.; Wang, Q.; Qian, Y.; Zhou, Y.; Wang, R.; Zhao, X. Component analysis of Pu-erh and its anti-constipation effects. Mol. Med. Rep. 2014, 9, 2003–2009. [Google Scholar] [CrossRef]
  15. Scott, S.M.; Simrén, M.; Farmer, A.D.; Dinning, P.G.; Carrington, E.V.; Benninga, M.A.; Burgell, R.E.; Dimidi, E.; Eikree, A.; Ford, A. Chronic constipation in adults: Contemporary perspectives and clinical challenges. 1: Epidemiology, diagnosis, clinical associations, pathophysiology and investigation. Neurogastroenterol. Motil. 2021, 33, e14050. [Google Scholar] [CrossRef]
  16. De Jesus Raposo, M.F.; De Morais, A.M.M.B.; De Morais, R.M.S.C. Emergent Sources of Prebiotics: Seaweeds and Microalgae. Mar. Drugs 2016, 14, 27. [Google Scholar] [CrossRef]
  17. Zhang, X.; Yang, H.; Zheng, J.; Jiang, N.; Sun, G.; Bao, X.; Lin, A.; Liu, H. Chitosan oligosaccharides attenuate loperamide-induced constipation through regulation of gut microbiota in mice. Carbohydr. Polym. 2021, 253, 117218. [Google Scholar] [CrossRef]
  18. Knowles, C.H.; Farrugia, G. Gastrointestinal neuromuscular pathology in chronic constipation. Best Pract. Res. Clin. Gastroenterol. 2011, 25, 43–57. [Google Scholar] [CrossRef]
  19. Li, C.; Li, Z.; Wu, H.; Tang, S.; Zhang, Y.; Yang, B.; Yang, H.; Huang, L. Therapeutic effect of Moringa oleifera leaves on constipation mice based on pharmacodynamics and serum metabonomics. J. Ethnopharmacol. 2022, 282, 114644. [Google Scholar] [CrossRef]
  20. Yin, J.; Liang, Y.; Wang, D.; Yan, Z.; Yin, H.; Wu, D.; Su, Q. Naringenin induces laxative effects by upregulating the expression levels of c-Kit and SCF, as well as those of aquaporin 3 in mice with loperamide-induced constipation. Int. J. Mol. Med. 2018, 41, 649–658. [Google Scholar] [CrossRef]
  21. Yarullina, D.R.; Shafigullin, M.U.; Sakulin, K.A.; Arzamastseva, A.A.; Shaidullov, I.F.; Markelova, M.I.; Grigoryeva, T.V.; Karpukhin, O.Y.; Sitdikova, G.F. Characterization of gut contractility and microbiota in patients with severe chronic constipation. PLoS ONE 2020, 15, e0235985. [Google Scholar] [CrossRef]
  22. Mudgil, D. The Interaction between Insoluble and Soluble Fiber. 2017. Available online: https://www.researchgate.net/publication/322732961_The_Interaction_Between_Insoluble_and_Soluble_Fiber (accessed on 2 May 2021).
  23. Chen, T.; Chen, D.; Tian, G.; Zheng, P.; Mao, X.; Yu, J.; He, J.; Huang, Z.; Luo, Y.; Luo, J.; et al. Effects of soluble and insoluble dietary fiber supplementation on growth performance, nutrient digestibility, intestinal microbe and barrier function in weaning piglet. Anim. Feed. Sci. Technol. 2019, 260, 114335. [Google Scholar] [CrossRef]
  24. Su, H.; Chen, J.; Miao, S.; Deng, K.; Liu, J.; Zeng, S.; Zheng, B.; Lu, X. Lotus seed oligosaccharides at various dosages with prebiotic activity regulate gut microbiota and relieve constipation in mice. Food Chem. Toxicol. 2019, 134, 110838. [Google Scholar] [CrossRef]
  25. Xie, L.; Wang, Y.; Luo, G.; Zhou, W.; Miao, J.; Tang, S.; Jiang, Q.; Guan, Y.; Gao, X. Identification of the multiple bioactive derivatives and their endogenous molecular targets that may mediate the laxative effect of rhubarb in rats. J. Tradit. Chin. Med. Sci. 2020, 7, 210–220. [Google Scholar] [CrossRef]
  26. Weinheimer, C.J.; Lai, L.; Kelly, D.P.; Kovacs, A. Novel mouse model of left ventricular pressure overload and infarction causing predictable ventricular remodelling and progression to heart failure. Clin. Exp. Pharmacol. Physiol. 2015, 42, 33–40. [Google Scholar] [CrossRef]
  27. Suo, H.; Zhao, X.; Qian, Y.; Li, G.; Liu, Z.; Xie, J.; Li, J. Therapeutic Effect of Activated Carbon-Induced Constipation Mice with Lactobacillus fermentum Suo on Treatment. Int. J. Mol. Sci. 2014, 15, 21875–21895. [Google Scholar] [CrossRef]
  28. Zhai, X.; Lin, D.; Zhao, Y.; Yang, X. Bacterial Cellulose Relieves Diphenoxylate-Induced Constipation in Rats. J. Agric. Food Chem. 2018, 66, 4106–4117. [Google Scholar] [CrossRef]
  29. Liu, X.; Chen, S.; Yan, Q.; Li, Y.; Jiang, Z. Effect of Konjac mannan oligosaccharides on diphenoxylate-induced constipation in mice. J. Funct. Foods 2019, 57, 399–407. [Google Scholar] [CrossRef]
  30. Guerra, D.D.; Bok, R.; Lorca, R.A.; Hurt, K.J. Protein kinase A facilitates relaxation of mouse ileum via phosphorylation of neuronal nitric oxide synthase. Br. J. Pharmacol. 2020, 177, 2765–2778. [Google Scholar] [CrossRef]
  31. Li, Y.; Hao, Y.; Zhu, J.; Owyang, C. Serotonin released from intestinal enterochromaffin cells mediates luminal non–cholecystokinin-stimulated pancreatic secretion in rats. Gastroenterology 2000, 118, 1197–1207. [Google Scholar] [CrossRef]
  32. Lan, J.; Wang, K.; Chen, G.; Cao, G.; Yang, C. Effects of inulin and isomalto-oligosaccharide on diphenoxylate-induced constipation, gastrointestinal motility-related hormones, short-chain fatty acids, and the intestinal flora in rats. Food Funct. 2020, 11, 9216–9225. [Google Scholar] [CrossRef] [PubMed]
  33. Li, J.; Li, A.; Li, Y.; Cai, M.; Luo, G.; Wu, Y.; Tian, Y.; Xing, L.; Zhang, Q. PICRUSt2 functionally predicts organic compounds degradation and sulfate reduction pathways in an acidogenic bioreactor. Front. Environ. Sci. Eng. 2022, 16, 47. [Google Scholar] [CrossRef]
  34. Xu, Y.; Shao, M.; Fang, X.; Tang, W.; Zhou, C.; Hu, X.; Zhang, X.; Su, K.-P. Antipsychotic-induced gastrointestinal hypomotility and the alteration in gut microbiota in patients with schizophrenia. Brain Behav. Immun. 2022, 99, 119–129. [Google Scholar] [CrossRef] [PubMed]
  35. Ashafa, A.; Abass, A.; Sunmonu, T.; Ogbe, A. Laxative potential of the ethanolic leaf extract of Aloe vera (L.) Burm. f. in Wistar rats with loperamide-induced constipation. J. Nat. Pharm. 2011, 2, 158. [Google Scholar] [CrossRef]
  36. Ge, H.; Zhang, B.; Li, T.; Yu, Y.; Men, F.; Zhao, S.; Liu, J.; Zhang, T. Potential targets and the action mechanism of food-derived dipeptides on colitis: Network pharmacology and bioinformatics analysis. Food Funct. 2021, 12, 5989–6000. [Google Scholar] [CrossRef] [PubMed]
  37. Macho-González, A.; Garcimartín, A.; Redondo, N.; Cofrades, S.; Bastida, S.; Nova, E.; Benedí, J.; Sánchez-Muniz, F.J.; Marcos, A.; López-Oliva, M.E. Carob fruit extract-enriched meat, as preventive and curative treatments, improves gut microbiota and colonic barrier integrity in a late-stage T2DM model. Food Res. Int. 2021, 141, 110124. [Google Scholar] [CrossRef] [PubMed]
  38. Hurst, N.R.; Kendig, D.M.; Murthy, K.S.; Grider, J.R. The short chain fatty acids, butyrate and propionate, have differential effects on the motility of the guinea pig colon. Neurogastroenterol. Motil. Off. J. Eur. Gastrointest. Motil. Soc. 2015, 26, 1586–1596. [Google Scholar] [CrossRef]
  39. Shi, Y.; Chen, Q.; Huang, Y.; Ni, L.; Liu, J.; Jiang, J.; Li, N. Function and clinical implications of short-chain fatty acids in patients with mixed refractory constipation. Color. Dis. 2016, 18, 803–810. [Google Scholar] [CrossRef]
  40. Wang, J.-K.; Yao, S.-K. Roles of Gut Microbiota and Metabolites in Pathogenesis of Functional Constipation. Evid. Based Complement. Altern. Med. 2021, 2021, 5560310. [Google Scholar] [CrossRef]
  41. van der Hee, B.; Wells, J.M. Microbial Regulation of Host Physiology by Short-chain Fatty Acids. Trends Microbiol. 2021, 29, 700–712. [Google Scholar] [CrossRef]
  42. Qiao, Y.; Qiu, Z.; Tian, F.; Yu, L.; Zhao, J.; Zhang, H.; Zhai, Q.; Chen, W. Pediococcus acidilactici Strains Improve Constipation Symptoms and Regulate Intestinal Flora in Mice. Front. Cell. Infect. Microbiol. 2021, 11, 655258. [Google Scholar] [CrossRef] [PubMed]
  43. Liu, J.; Chang, R.; Zhang, X.; Wang, Z.; Wen, J.; Zhou, T. Non-isoflavones Diet Incurred Metabolic Modifications Induced by Constipation in Rats via Targeting Gut Microbiota. Front. Microbiol. 2018, 9, 3002. [Google Scholar] [CrossRef] [PubMed]
  44. Jeong, D.; Kim, D.-H.; Kang, I.-B.; Kim, H.; Song, K.-Y.; Kim, H.-S.; Seo, K.-H. Modulation of gut microbiota and increase in fecal water content in mice induced by administration of Lactobacillus kefiranofaciens DN1. Food Funct. 2017, 8, 680–686. [Google Scholar] [CrossRef] [PubMed]
  45. Chu, J.R.; Kang, S.-Y.; Kim, S.-E.; Lee, S.-J.; Lee, Y.-C.; Sung, M.-K. Prebiotic UG1601 mitigates constipation-related events in association with gut microbiota: A randomized placebo-controlled intervention study. World J. Gastroenterol. 2019, 25, 6129–6144. [Google Scholar] [CrossRef]
  46. Strati, F.; Cavalieri, D.; Albanese, D.; De Felice, C.; Donati, C.; Hayek, J.; Jousson, O.; Leoncini, S.; Renzi, D.; Calabrò, A.; et al. New evidences on the altered gut microbiota in autism spectrum disorders. Microbiome 2017, 5, 24. [Google Scholar] [CrossRef]
  47. Pardesi, B.; Roberton, A.M.; Lee, K.C.; Angert, E.R.; Rosendale, D.I.; Boycheva, S.; White, W.L.; Clements, K.D. Distinct microbiota composition and fermentation products indicate functional compartmentalization in the hindgut of a marine herbivorous fish. Mol. Ecol. 2022, 31, 2494–2509. [Google Scholar] [CrossRef]
  48. Nagano, A.; Ohge, H.; Tanaka, T.; Takahashi, S.; Uemura, K.; Murakami, Y.; Sueda, T. Effects of different types of dietary fibers on fermentation by intestinal Flora. Hiroshima J. Med. Sci. 2018, 67, 1–5. [Google Scholar] [CrossRef]
  49. Romick-Rosendale, L.E.; Haslam, D.B.; Lane, A.; Denson, L.; Lake, K.; Wilkey, A.; Watanabe, M.; Bauer, S.; Litts, B.; Luebbering, N.; et al. Antibiotic Exposure and Reduced Short Chain Fatty Acid Production after Hematopoietic Stem Cell Transplant. Biol. Blood Marrow Transplant. 2018, 24, 2418–2424. [Google Scholar] [CrossRef]
  50. Litvak, Y.; Byndloss, M.X.; Bäumler, A.J. Colonocyte metabolism shapes the gut microbiota. Science 2018, 362, eaat9076. [Google Scholar] [CrossRef]
  51. Pang, T.; Leach, S.T.; Katz, T.; Day, A.S.; Ooi, C.Y. Fecal Biomarkers of Intestinal Health and Disease in Children. Front. Pediatr. 2014, 2, 6. [Google Scholar] [CrossRef]
  52. Huda-Faujan, N.; Abdulamir, A.; Fatimah, A.; Anas, O.M.; Shuhaimi, M.; Yazid, A.; Loong, Y. The Impact of the Level of the Intestinal Short Chain Fatty Acids in Inflammatory Bowel Disease Patients Versus Healthy Subjects. Open Biochem. J. 2010, 4, 53–58. [Google Scholar] [CrossRef] [PubMed]
  53. Kashyap, P.C.; Marcobal, A.; Ursell, L.K.; Larauche, M.; Duboc, H.; Earle, K.A.; Sonnenburg, E.D.; Ferreyra, J.A.; Higginbottom, S.K.; Million, M.; et al. Complex Interactions Among Diet, Gastrointestinal Transit, and Gut Microbiota in Humanized Mice. Gastroenterology 2013, 144, 967–977. [Google Scholar] [CrossRef] [PubMed]
  54. Parthasarathy, G.; Chen, J.; Chen, X.; Chia, N.; O’Connor, H.M.; Wolf, P.G.; Gaskins, H.R.; Bharucha, A.E. Relationship Between Microbiota of the Colonic Mucosa vs. Feces and Symptoms, Colonic Transit, and Methane Production in Female Patients With Chronic Constipation. Gastroenterology 2016, 150, 367–379.e1. [Google Scholar] [CrossRef] [PubMed]
Figure 1. Effects on physiological parameters on constipated mice. The number of defecations (A), weight of feces (B), gastric emptying rate (C), and time of first black stool excretion (D) in mice. Note: All data are expressed as mean ± S.D. (n = 6), ## p < 0.01, and ### p < 0.001. The ND group outperforms the Mod group. * p < 0.05, ** p < 0.01, *** p < 0.001, compared with Mod group.
Fermentation 09 00962 g001
Figure 2. Effect of barley vinegar on intestinal barrier damage in constipated mice (magnification, 40×).
Fermentation 09 00962 g002
Figure 3. Effects of barley vinegar on the neurotransmitters of constipated mice, AChE (A), SP (B), VIP (C), 5-HT (D), MTL (E), NO (F). Note: All data are expressed as mean ± S.D. (n = 3), # p < 0.05, ## p < 0.01. The ND group outperforms the Mod group. * p < 0.05, ** p < 0.01, compared with the Mod group.
Fermentation 09 00962 g003
Figure 4. Effects of barley vinegar on intestinal microbiota diversity in constipated mice. OTU Venn diagram (A), intestinal flora β−diversity (B), intestinal flora α−diversity ((C): Chao index, (D): Ace index, (E): Simpson index, (F): Shannon index). Note: All data are expressed as mean ± S.D. (n = 6), # p < 0.05, ## p < 0.01. The ND group outperforms the Mod group. * p < 0.05, ** p < 0.01, compared with the Mod group.
Fermentation 09 00962 g004
Figure 5. Effects of barley vinegar on intestinal microbiota abundance in constipated mice. Histogram of species distribution of the gut microbe at the phylum level (A). Circos diagram of the relationship between samples and gut microbe at the phylum level (B). Histogram of species distribution of the gut microbe at the genus level (C). Circos diagram of the relationship between samples and gut microbe at the genus level (D).
Fermentation 09 00962 g005
Figure 6. Species analysis of intestinal flora at the phylum level between the Mod and HD groups (A). The Wilcoxon rank sum test was used for statistical analysis (n = 6), ** p < 0.01. Analysis of key bacteria at the phylum level (B,C). Note: All data are expressed as mean ± S.D. (n = 6), ### p < 0.001. The ND group outperforms the Mod group ** p < 0.01, *** p < 0.001, compared with the Mod group.
Fermentation 09 00962 g006
Figure 7. Species analysis of intestinal flora at the genus level between the Mod and HD groups (A). The Wilcoxon rank sum test was used for statistical analysis (n = 6), * p < 0.05, ** p < 0.01. Analysis of key bacteria at the genus level (B). Note: All data are expressed as mean ± S.D. (n = 6), ## p < 0.01,. The ND group outperforms the Mod group * p < 0.05, ** p < 0.01, *** p < 0.001, compared with Mod group.
Fermentation 09 00962 g007
Figure 8. Effects of fecal short−chain fatty acids (SCFAs) in constipated mice. SCFA content in feces (A,B). Statistical Pearson’s correlation of intestinal microbial and SCFAs (C), for which blue indicates a negative correlation and red indicates a positive correlation. Note: All data are expressed as mean ± S.D. (n = 6), # p < 0.05, ## p < 0.01, ### p < 0.001. The ND group outperforms the Mod group * p < 0.05, ** p < 0.01, *** p < 0.001, compared with the Mod group.
Fermentation 09 00962 g008
Figure 9. Principal component analysis as well as statistical analysis of differences between groups. Metabolite Venn plot of the difference between the control groups (A). The PLS−DA score plot in positive and negative states (B). Permutation test of 3 comparison groups (C). Volcanic map (D) and statistical map of differential metabolite change (E) of each comparison group.
Fermentation 09 00962 g009
Figure 10. Functional pathway statistics as well as analysis of potential metabolic pathways. Classification and statistics of different metabolites in each comparison group (A). Statistical diagram of functional pathways in each comparison group (B). Bubble diagram of metabolic pathway enrichment in each comparison group (C). Hierarchical clustering heatmap of different metabolites in lipid metabolism −related pathways in each group (D). Note: All data are expressed as mean ± S.D. (n = 6). The ND group outperforms the Mod group * p < 0.05, ** p < 0.01, compared with the Mod group.
Fermentation 09 00962 g010
Table 1. Weight changes in mice.
GroupDay 0Day 3Day 6Day 9Day 12Day 15
ND27.89 ± 2.7629.01 ± 1.5129.51 ± 1.7829.53 ± 1.1630.36 ± 2.4830.56 ± 1.04
Mod28.87 ± 2.8028.53 ± 1.5729.02 ± 2.3528.93 ± 1.2428.64 ± 2.6928.57 ± 1.14
HD29.41 ± 2.7629.72 ± 1.0330.46 ± 2.7430.53 ± 1.1230.85 ± 1.2431.41 ± 1.79
MD29.32 ± 2.3429.55 ± 2.6929.90 ± 1.1130.21 ± 1.2330.39 ± 1.3130.57 ± 2.44
LD28.77 ± 2.5929.11 ± 1.2629.33 ± 1.5629.67 ± 1.1529.91 ± 1.1030.08 ± 1.21
Note: All data are expressed as mean ± S.D. (n = 6).
Table 2. Effects of barley vinegar on the small intestinal ink propulsion rate of constipated mice.
GroupTotal Length of the Small Intestine (cm)Ink Propulsion Length (cm)Ink Propulsion Rate (%)
ND47.06 ± 3.5042.33 ± 4.5389.79 ± 2.94
Mod49.17 ± 3.9415.98 ± 4.12 ##32.15 ± 5.08 ###
HD49.00 ± 3.2641.20 ± 4.08 **83.99 ± 3.94 ***
MD47.42 ± 2.8427.26 ± 4.94 *57.26 ± 7.76 **
LD49.18 ± 1.9225.87 ± 6.5552.42 ± 12.09
Note: All data are expressed as mean ± S.D. (n = 6), ## p < 0.01, ### p < 0.001. The ND group outperforms the Mod group * p < 0.05, ** p < 0.01, *** p < 0.001, compared with the Mod group.
Disclaimer/Publisher’s Note: The statements, opinions and data contained in all publications are solely those of the individual author(s) and contributor(s) and not of MDPI and/or the editor(s). MDPI and/or the editor(s) disclaim responsibility for any injury to people or property resulting from any ideas, methods, instructions or products referred to in the content.

