Article

Effect of Skim Milk Powder and Whey Protein Concentrate Addition on the Manufacture of Probiotic Mozzarella Cheese

by
Khalid A. Alsaleem
1,*,
Mahmoud E. A. Hamouda
2,3,
Raed Reshaid Alayouni
1,2,
Mohamed Salem Elfaruk
2,4 and
Ahmed R. A. Hammam
2,3
1
Department of Food Science and Human Nutrition, College of Agriculture and Veterinary Medicine, Qassim University, Buraydah 51452, Saudi Arabia
2
Dairy and Food Science Department, South Dakota State University, Brooking, SD 57007, USA
3
Dairy Science Department, Faculty of Agriculture, Assiut University, Assiut 71515, Egypt
4
Medical Technology College, Nalut University, Nalut 00218, Libya
*
Author to whom correspondence should be addressed.
Fermentation 2023, 9(11), 948; https://doi.org/10.3390/fermentation9110948
Submission received: 15 October 2023 / Revised: 25 October 2023 / Accepted: 28 October 2023 / Published: 1 November 2023
(This article belongs to the Special Issue Probiotic Fermented Foods: An Overview)

Abstract

:
This work aimed to study the effect of adding skim milk powder (SMP) and whey protein concentrate (WPC) to probiotic mozzarella cheese. Pasteurized cow milk was heated to 55 °C and divided into five parts: PMC1 (control), PMC2 (1% SMP), PMC3 (1.5% SMP), PMC4 (1% WPC), and PMC5 (1.5% WPC). After mixing powders in the respective concentrations in the treatments, the milk was cooled to 35 °C, and Bifidobacterium bifidum culture (5%) was added. Proximate analysis, calcium, soluble nitrogen (SN), total Bifidobacterium bifidum count, cheese yield, hardness, and meltability tests were carried out at 0, 14, and 28 days of storage. The mozzarella cheese samples with WPC added had higher acidity, total solids, and protein content than the mozzarella cheese samples with SMP added and the control samples during storage. The addition of WPC led to a significant increase (p < 0.05) in the count of Bifidobacterium bifidum during storage at 5 °C. The cheeses with WPC added had increased meltability, higher hardness, and higher browning on pizza compared to those of the mozzarella cheese with SMP added. A sensory evaluation showed that the addition of WPC increased sensory scores, compared to the addition of SMP. As storage time progressed, there was a significant (p < 0.05) increase in the Bifidobacterium bifidum, meltability, and sensory scores of PMC in all treatments.

1. Introduction

Mozzarella cheese belongs to a cheese category that involves the principle of skillful expansion of the curd in hot water to obtain a soft texture in the cheese. The cheese is soft, white, and unripe and can be consumed directly after processing. The melting and functional properties of mozzarella cheese have high importance, especially in the pizza industry, in which it is a crucial ingredient [1]. This type of cheese is produced by coagulation, either by acid or rennet; separating whey; and stretching at pH 5.2–5.4 in hot water, which causes the curds to plasticize and gives the resulting cheese its fibrous structure and stretching properties.
Using buffalo milk to make mozzarella cheese provides some advantages, like the white color, a more aromatic flavor, and a higher cheese yield. Due to the lack of buffalo milk in most countries, cow’s milk is generally used for mozzarella cheese [2]. Mozzarella cheese made from cow’s milk is usually of inferior quality and is known to show lower cheese yield, and the weakness of the resulting curd directly leads to a lower meltability and higher oiling off [3], which are considered unsuitable properties in pizza processing.
Therefore, many studies tend to add several milk protein dried additives, such as skim milk powder (SMP) and milk protein concentrates (MPC), in the manufacturing of mozzarella cheese to raise the cheese yield, simultaneously improving cheese’s texture and melting properties [4,5,6,7]. SMP is commonly used as an additive in the manufacturing of cheese, but its high lactose content can negatively impact the resulting cheese [8].
WPC is one of the most critical high-protein by-products as it is a naturally high-purity by-product, making it one of the most important ingredients that can be used to manufacture cheese because of its higher solubility than milk casein [9]. It also contains the most immunological and beneficial proteins for human health [10]. WPCs are a cheap and readily available additive for which growth-enhancing activity on lactic acid bacteria has been described [11]. Pinto et al. [8] used WPC in the manufacturing of processed cheese spread. Additionally, Henriques et al. [9] used WPC in making fresh cheese and set yogurt to improve their functional and sensorial properties. Ismail et al. [10] used denatured whey proteins to enhance the properties of low-fat mozzarella cheese. Salama [11] used WPC at low levels (0.15 to 0.30%) to improve the functional properties of buffalo mozzarella cheese and stated that addition of WPC can play a role in decreasing the hardness and increasing the meltability of the resulting cheese.
While some studies have tended to use additives to improve the quality of mozzarella cheese, others have taken another direction by adding probiotics that have a high metabolism, which can enhance mozzarella cheese’s characteristics. Mukhtar et al. [12] found that the addition of probiotics while making mozzarella can extend the shelf life, improve the organoleptic properties of the cheese, and make the cheese a good delivery system for probiotics. The objective of our study was to enhance the quality of buffalo mozzarella cheeses by adding different ratios of WPC and SMP and to study the effects of these additives on the viability of Bifidobacterium bifidum during the storage period.

2. Materials and Methods

2.1. Experimental Design

Probiotic mozzarella cheese was manufactured from cow’s milk, as mentioned by Kosikowski [13], with some modifications. Pasteurized cow’s milk was heated to 55 °C for reconstituting SMP and WPC and divided into five lots (Table 1). After mixing WPC and SMP obtained from New Zealand (Leprino Foods company, Denver, CO, USA) in the respective concentrations in the treatments (Table 1), the milk was cooled to 35 °C. Bifidobacterium bifidum culture 5%, obtained from (Misr research center, Egypt), was added to each lot (at 33 °C for 15 min). Rennet (Chr. Hansen, Copenhagen, Denmark) was added at 35 °C (40–50 min). After coagulation was completed, the cheese was cut into 1 × 1 × 1 cm pieces, and the curd was stirred and heated to 40–45 °C for 50 min. Whey drainage was performed at pH 6.1–6.3. After draining the whey, the cheddaring process was conducted on the cheese for 60 min until the pH reached 5.3. Then, the curds were cut, masticated, and stretched in hot water at 85 °C for 4–5 min. The cheese was formed into balls and brined in cold salt solution (25%) for 1 h. Finally, the cheese was packed and stored at 5 ± 1 °C for 4 weeks.

2.2. Chemical Analysis

All chemicals used for this study were acquired from Sigma, BDH (St. Louis, MO, USA), and Prolabo (Radnor, PA, USA). Proximate analysis, titratable acidity, total solids, fat content, total protein (TP), soluble nitrogen (SN), ash content, and calcium content tests were carried out at 0, 14 and 28 days of storage at 5 ± 1 °C.
Titratable acidity was measured using sodium hydroxide 0.1 N and phenolphthalein as indicators [14]. The obtained results were calculated as the percentage of lactic acid. The total solids percentage was determined by evaporating the water at 103–104 °C/6 h using a forced-air oven, and the differences in the weight were referred to as the moisture content, as described by Horwitz [15]. The total protein (TP) was determined using the Kjeldahl method, as described by Barbano et al. [16] by digesting and titrating the cheese samples to calculate the nitrogen content and multiplying by 6.38 to obtain the protein content. The soluble nitrogen was measured, as mentioned by Hooi et al. [17]. The fat content was determined using the conventional Gerber’s method, as described by Kleyn et al. [18]. The ash content was estimated using a muffle oven at 550 °C, according to Ling [19]. The total calcium content was calculated using the method described by Graham [20].

2.3. Determination of Yield

The probiotic mozzarella cheese yield (PMCY) percentage was obtained as described by Sales et al. [9]. PMCY was calculated using the ratio between milk (kg) and cheese yield (kg), which represents the milk volume used to obtain one kg of cheese (PMCY = VMU/VCP, where VMU = volume of milk used in kilograms and VCP = volume of cheese produced in kilograms).

2.4. Schreiber Melt Test

The PMC were cut into cylinders with a 30 mm diameter × 8 mm height and placed in flat aluminum panels (100 mm diameter). The panels were transferred to an electric oven (Universal Company, Tokyo, Japan) at 90 °C for 7 min as described by Salunke et al. [21]. After that, the melted cheese samples were removed from the oven and allowed to cool at room temperature. The diameter of the melted PMC samples was determined in 4 different directions using a vernier caliper in millimeters. The meltability was expressed as the difference between the diameter of the PMC samples before and after melting. This test was conducted at 0 days, 2 weeks, and 4 weeks.

2.5. Texture Profile Analysis

The hardness of the PMC was estimated using the texture profile analysis as described by Rehman et al. [22]. The PMC was cut using metal cylinders to reach a 20 mm height. A texture analyzer (Brookfield, CT3, Middleboro, MA, USA) was equipped with a stainless-steel cylinder probe (Ref: TA-AACC 36) with a 38 mm diameter. The samples were compressed in the center to 20% deformation in two cycles with 2 mm/s. The highest force of the first bite was indicated to the hardness of the cheese. This test was repeated three times for each sample.

2.6. Sensory Evaluation

The sensory characteristics were evaluated as mentioned by Hamdy et al. [23]. The cheeses were judged for flavor (50 points), color and appearance (15 points), and body and texture (35 points) to obtain 100 points as total scores. The organoleptic characteristics were estimated at 0 days, 2 weeks, and 4 weeks of storage.

2.7. Color Characteristics and Browning Index of Baked Pizza with PMC

A pizza baking test was performed according to Metzger et al. [24] with some modifications. PMCs were placed on the surface of the pizza. The pizzas were put in an electric oven at about 260 °C for 10 min. After cooling at room temperature, the color of PMC samples on the pizzas was determined according to the method described by Yildiz et al., [25] using a Hunter colorimeter fitted with optical sensor (Momcolor Inc., Columbus, OH, USA) based on the CIE L*, a*, and b* color space. L* is a measure of lightness, from black (0) to white (100). Parameter a* describes red–green color, with positive a* values indicating redness and negative a* values indicating greenness; and parameter b* describes yellow–blue color, with positive b* values indicating yellowness and negative b* values indicating blueness. The browning index (BI) was calculated based on the values of the L*, a*, and b* parameters according to Abdalla et al. [26] using the Equation (1) as follows:
BI = [100(x − 0.31)]/0.172
where x = (a* + 1.75L*)/(5.645L* + a* − 3.012b*).

2.8. Bifidobacterium Count

Bifidobacterium bifidum (BB) numbers were estimated using an MRS-modified medium and a plat method as described by Brewer [27]. The plates were placed in an incubator at 40 °C for 48 h in anaerobic conditions. Colonies of BB were repeated at 0, 14 and 28 days of storage.

2.9. Statistical Analysis

All the obtained data for the experiment were subjected to the statistical analysis of a completely randomized design [28] using Costat 6.303 software. The significant means of any trait studied were compared using L.S.D at a 5% probability level.

3. Results and Discussions

3.1. Chemical Composition

The chemical compositions of the SMP and WPC used in this study are shown in Table 2. SMP had lower total protein, moisture, and lipids (37.10%, 3.80%, and 0.70%, respectively) than that of WPC, which contained 87.50%, 6.90%, and 1.10%, respectively. However, SMP had a high content of ash and lactose (6.60% and 51.30, respectively) compared with that of WPC (2.30% and 2.20, respectively).

3.2. Proximate Chemical Composition

The proximate chemical composition of PMC is shown in Table 3. For all cheese samples, acidity significantly (p < 0.05) increased as the storage increased. This may be due to the starters’ activity in breaking down the lactose into lactic acid in the cheese curd [29,30]. Furthermore, a decrease in pH could be due to fatty acids that form in varying amounts as the products of the probiotic bacteria pathway as described by Fooks et al. [31]. The acidity (%) of PMC (control) was the lowest compared to those of other samples, and this value increased from 0.81% to 1.13% through the 28 days of storage at 5 ± 1 °C. However, the acidity (%) of PMC5 (supplemented with 1.5% WPC) was higher (p < 0.05) than that of the other samples and increased from 0.95% to 1.34% during the storage time. It has been observed that the samples with WPC added (PMC4 and PMC5) recorded higher values of acidity than the samples with SMP added (PMC2 and PMC3). This could be because WPC is a growth-promoting substance that stimulates Bifidobacteria activity in breaking lactose into lactic acid [32]. It has been reported that the addition of WPC in mozzarella cheese manufacturing led to higher acidity values [33].
There was a significant (p < 0.05) increase in TS values in all cheeses. This may be attributed to the shrinkage of the curd as a result of the formation of lactic acid, which helps to remove whey from the cheese mass [34]. Data obtained showed that the samples with WPC added (PMC4 and PMC5) showed higher (p < 0.05) TS values than those of other treatments and ranged from 55.88% for PMC4 at 0 days to 58.40% for PMC5 at 28 days of storage. The high TS values in these samples could be associated with their higher acidity levels, making cheese expel more whey [35]. It has been reported that the addition of WPC to buffalo’s milk in manufacturing mozzarella cheese led to a slight increase in TS [30].
The fat content of the PMC samples positively correlated with the TS values, meaning that the samples of PMC that gained higher TS contained higher fat content. Similar results were obtained Metzger et al. [24]
A highly significant (p < 0.05) increase in TP% values was observed as storage time increased in all PMC samples. This could be due to moisture loss as a result of the acidity progress during storage. Although protein can break down into a soluble form in cheese by Bifidobacterium starter activity, soluble protein is still calculated as TP. Therefore, the addition of SMP or WPC in cheese led to a significant (p < 0.05) increase in TP values. However, the samples with WPC added (PMC4 and PMC5) had higher TP values than the samples with SMP added and ranged from 18.76% for PMC4 at 0 days to 22.78% for PMC5 after 28 days of storage. This was due to the high protein content in WPC (87.5%) compared with that of SMP, which contains 37.1%.
The soluble nitrogen (SN) values (Table 3) differed significantly (p < 0.05) between PMC samples. PMC1 (control) scored the lowest value of SN percentage and ranged from 0.24% when fresh to 0.29% after 28 days of storage. WPC and SMP addition led to a significant (p < 0.05) increase in total protein percentage values, which allowed the starter culture to break down more protein to SN; hence, the SN percentage values significantly (p < 0.05) increased [36]. The samples with WPC added (PMC3 and PMC4) recorded the highest values of SN percentage (ranged from 0.27% for PMC4 when fresh to 0.32% for PMC5 after 4 weeks of storage) compared to those of the samples with SMP added (PMC2 and PMC3). It has been reported that WPC is a growth-promoting substance that encourages Bifidobacterium in the breakdown of protein into SN [33,34]. The results also showed a significant increase (p < 0.05) in the SN values of PMC throughout the 28 days, which may be due to the activities of the starter or microflora that reached the cheese during storage and/or proteolysis with a proteolytic enzyme. It has been reported that the SN of white, soft cheeses made with probiotics shows an increase at the end of the storage period [35,36,37].
The ash values of the PMC samples indicated that a significant (p < 0.05) increase occurred in ash content as storage time progressed. This increase was a response to the progressive moisture loss that occurred during storage [38]. PMC1 (control) recorded the lowest value of ash compared to the other treatments and ranged from 3.46 to 4.42 during the 28-day storage period. Adding SMP and WPC significantly (p < 0.05) increased the total ash content in cheese samples. However, the samples with WPC added had lower ash content values than those of the samples with SMP added, which is considered very normal due to the high ash content in SMP (6.61%) compared to WPC, which contains 2.30%.
The calcium values showed a significant reduction in the calcium content of PMC samples when SMP or WPC was added, especially PMC5 (ranging from 0.75 when fresh to 0.87 at the end of shelf life). This may be due to the high acidity levels, which were formed by the addition of WPC to cheese milk during storage. Increasing the acidity of milk causes an increase in non-micellar calcium. In cheese production, the micellar calcium of milk is retained in the cheese, while the non-micellar calcium is lost in the serum. Therefore, as a result of the increased acidity of milk, a high level of non-micellar calcium caused the observed decrease in the calcium content of the cheese [39].

3.3. Determination of Yield Percentage of PMC

Yield is one of the essential economic parameters searched by manufacturers [40]. PMC yield values at 0 days are shown in Table 4. PMC1 (control) recorded the lowest yield values (13.67%) compared to those of other treatments. It was noted that by adding SMP at rate 1% and 1.5% in samples PMC2 and PMC3, respectively, the cheese yield increased to 15.11 (PMC2) and 16.54 (PMC3). Alternatively, when WPC was added in PMC4 and PMC5, the cheese yield increased but at a lower rate than in the samples with SMP added. It has been reported by [41] that adding 1% of WPC to cow’s milk increased the yield of mozzarella cheese.

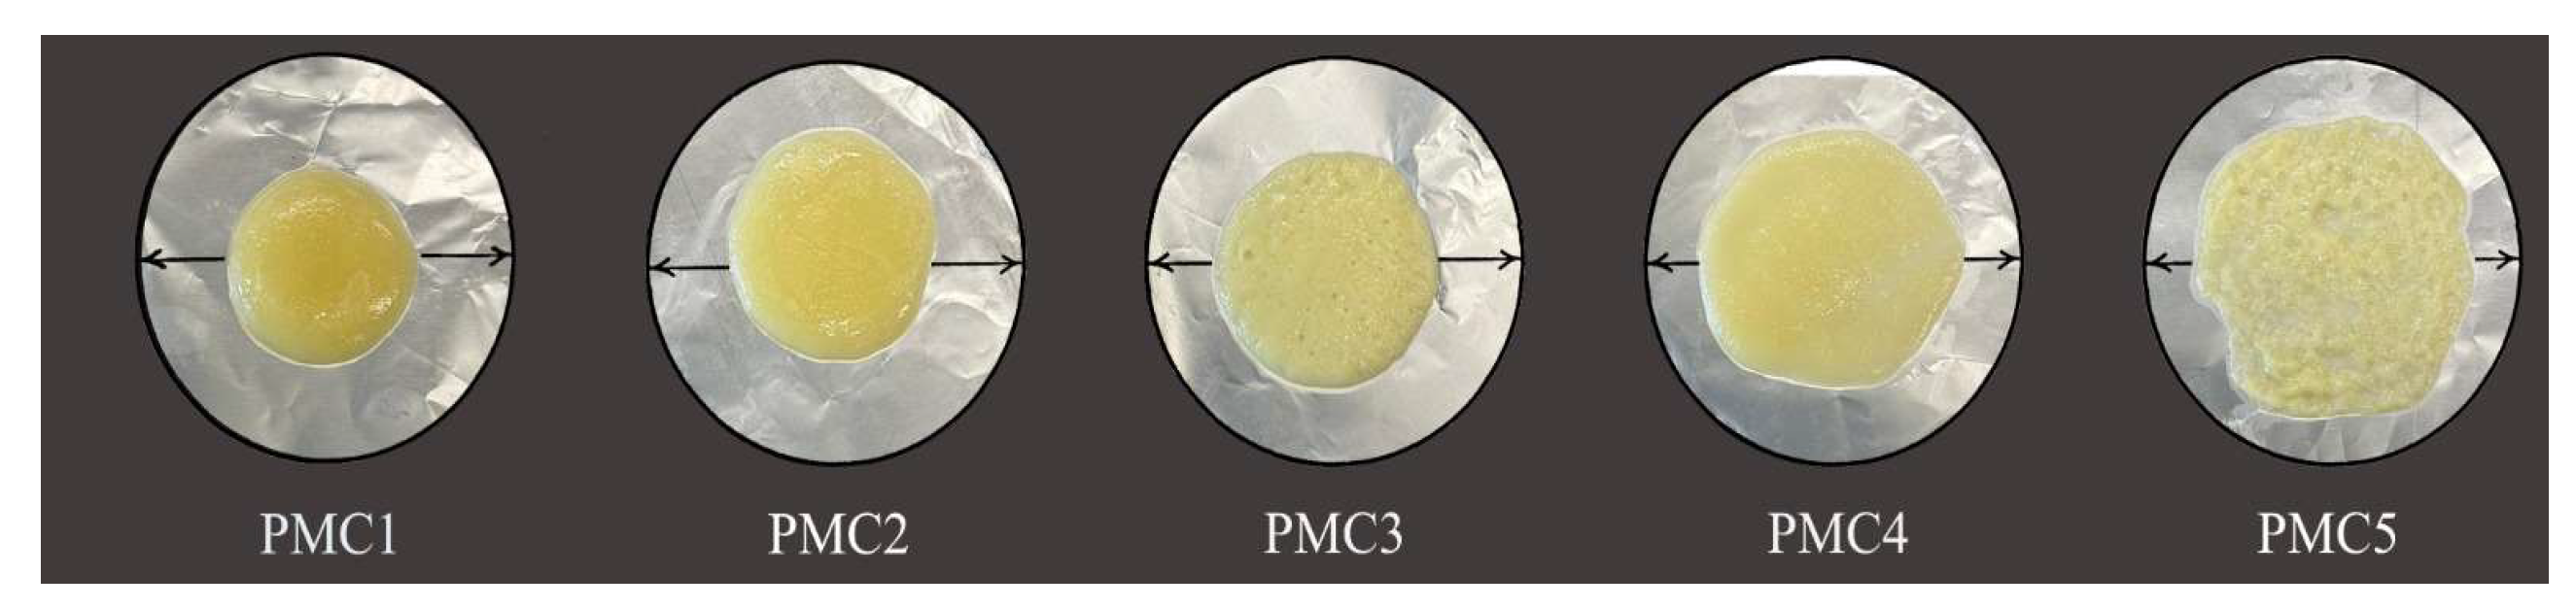
3.4. Schreiber Melt Test

Meltability is defined as the ability of cheese particles to flow together and form a continuous melted mass [42]. Mozzarella cheese is used for pizza; therefore, as meltability increases, mozzarella cheese quality improves [43]. Table 5 and Figure 1 depict that as storage time progressed, the meltability of the PMC samples also increased. This could be due to proteolysis and the degradation of the milk protein matrix [44]. PMC1 (control) recorded the lowest values of mutability compared to those of the other samples and ranged from 219.80 mm when fresh to 560.00 mm at 28 days of the storage period; this could be due to its low acidity levels in this treatment compared to those of the other samples [45,46]. Both SMP and WPC addition had a significant (p < 0.05) impact on increasing the meltability of cheese. However, the samples with WPC added (PMC4 and PMC5) had higher meltability values than the samples with SMP added (PMC2 and PMC3). This could be due to the fact that WPC stimulated starter culture in breaking down more protein and raising the acidity levels, which led to an increase in soluble calcium, which is partly removed. All of these factors had a crucial role in increasing the meltability of the cheese during the test [45,46,47,48]. It has been reported that the addition of WPC has a positive effect on the meltability rates of mozzarella cheese [49].

3.5. Hardness

The hardness of the PMC samples is shown in Table 5. PMC1 (control) scored the lowest hardness values compared to those of the other samples and rose from 1578.00 N at 0 days to 2128.00 N at the end of storage. This could be attributed to the high moisture content in the control samples as compared to the other samples. It is well known that hardness is negatively correlated with moisture content [50,51]. The hardness values also indicated that the addition of SMP and WPC in the manufacturing of PMC had a negative effect by increasing hardness. The samples with WPC added recorded higher hardness values (ranged from 2163.00 N for PMC4 at 0 days to 2681.00 N for PMC5 after 28 days of storage) than the samples with SMP added (ranged from 1845.00 N for PMC2 at 0 days to 2386.00 N for PMC3 after 28 days of storage). This was due to high acidity levels in the samples with WPC added, which led to more whey draining and moisture loss, and subsequently, an increase in hardness. The progressive storage time led to a significant (p < 0.05) increase in hardness values, which related back to the moisture loss.

3.6. Sensory Characteristics

The sensory properties of PMC are shown in Table 6. The color and appearance of all cheeses did not markedly change (p > 0.05) by adding SMP or WPC. This difference may be because they used rennet casein in their study, but we used whole cow milk. As storage time progressed, the color points significantly (p < 0.05) decreased in all cheese samples. This could be due to more protein breakdown by starter activity, which could negatively affect the cheese appearance [51].
In all PMC samples, the progressive storage time significantly (p < 0.05) improved the cheese texture. This could be because the hard casein matrix turned to a soft texture because of the slow proteolysis under the action of the endogenous enzymes, rennet enzymes, and the added starters proteolytic enzymes [27]. The samples with WPC added (PMC4 and PMC5) had the highest points for body and texture, compared to the samples with SMP added (ranged from 24.00/35.00 point for PMC2 when fresh to 33.00/35.00 for PMC3 at the end of storage). This could be due to the low moisture content in these samples. Additionally, WPC can stimulate the growth of Bifidobacteria, which separates proteolytic enzymes during storage [52,53,54,55,56,57].
The flavor of all cheeses was improved over 28 d of storage at 5 ± 1 °C. This could be due to the metabolic activities of starter cultures that may produce flavor compounds like those in fermented milk. Also, rennet and indigenous enzymes are vital to producing flavor in PMC during cheese ripening [53]. The trained panelists gave higher scores to the samples with WPC added compared to the samples with SMP added. This could be due to the role of WPC in the stimulation of the growth of Bifidobacteria, which led to more proteolysis enzymes that had an important effect on flavor [54,55].
The obtained data depicted that the highest scoring points (94/100) were for PMC5 for 4-week-old cheese, followed by PMC4 (91/100), then PMC3 (83/100), and lastly PMC2 (77/100).

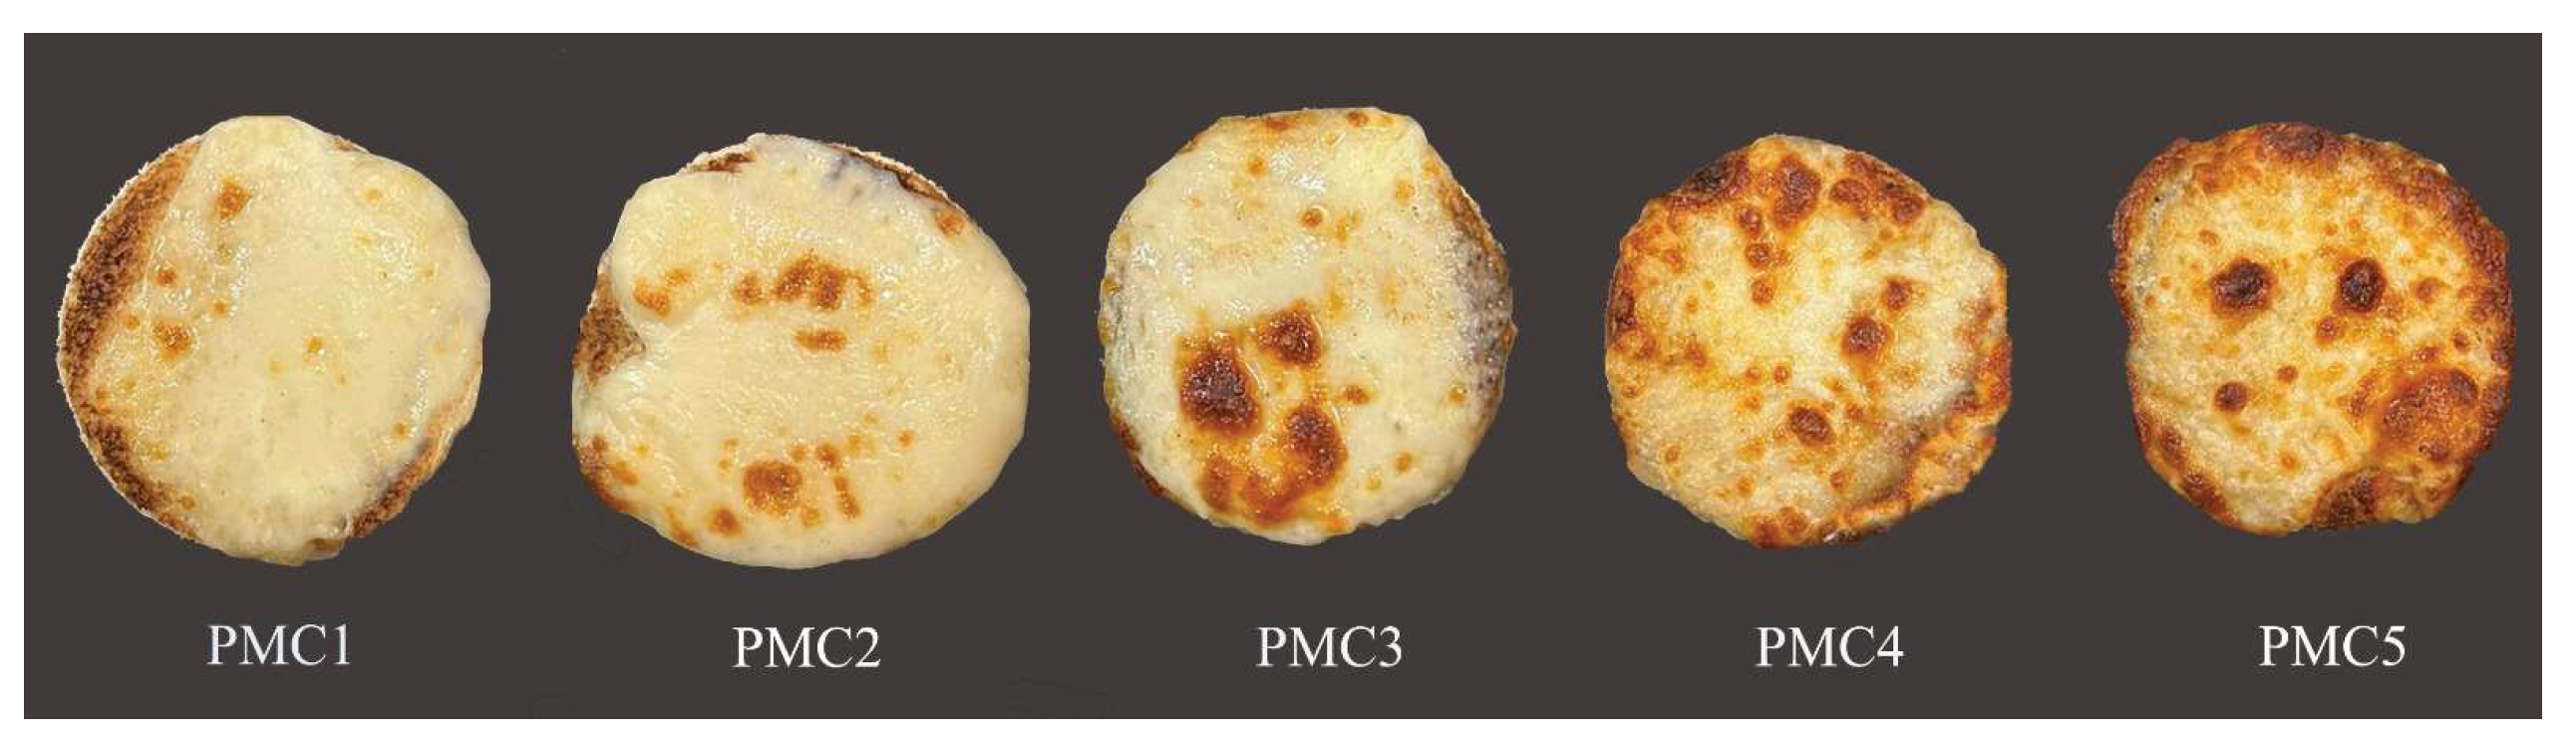
3.7. Color Characteristics of Baked Pizza

The color parameters are important because they have a major impact on the visual acceptability of consumers [56]. The color characteristics of the PMC samples after baking on a pizza are presented in Table 7 and Figure 2. The obtained data showed that the lightness (L*) value of PMC1 (control) was higher (p < 0.05) than that of the other samples. The addition of SMP and WPC led to a significant (p < 0.05) decrease in the lightness value (more browning) and an increase in redness (+a*) and yellowness (+b*). The samples with WPC added (PMC4 and PMC5) recorded the lowest values of lightness (54.12 and 51.23, respectively) and the highest values of redness (17.49 and 18.78, respectively) and yellowness (35.33 and 38.21, respectively), compared to the samples with SMP added. The browning of PMC is caused by the Maillard reaction and is closely related to its baking. Also, browning and blistering are important quality characteristics for a pizza’s baking performance [57,58,59,60,61]. Browning index (BI) results (Table 7) were calculated from all color parameters of PMC. The data revealed that mature, 28-day-old samples with WPC added (PMC4 and PMC5) had greater BI (browning index) values (120.86 and 146.48, respectively) than those of the samples with SMP added (PMC2 and PMC3), which recorded BI values (65.79 and 70.03, respectively). This indicated a higher concentration of non-enzymatic browning in mature cheeses made by WPC addition, which could be due to the greater proteolytic levels seen in the samples with WPC added. Higher proteolysis may lead to a greater concentration of accessible amino groups that participate in the Maillard browning reaction [56]. Additionally, the sugar consumed by starter culture can impact color in mozzarella [22]. A similar observation stated that brown color in mozzarella cheese increased as a pizza baked by adding WPC during mozzarella cheese manufacturing [62].

3.8. Bifidobacterium Count

The colonies of Bifidobacteria bifidum (BB) of PMC during 28 days of storage are illustrated in Table 8. The Bifidobacteria bifidum (BB) count significantly (p < 0.05) increased up to 14 days, followed by a decrease at the end of the storage period. The gradual decrease in BB counts was attributed to high acidity and the forming of lactic and acetic acids, which reduced the viability of BB counts [58,59]. Similar observations stated that the numbers of Bifidobacterium decreased slowly after the first 2 weeks, followed by a sharper decrease towards the end of the ripening period of soft cheese [61]. PMC1 (control) recorded the lowest number of BB compared to those of other samples during 28 days of storage and decreased from 6.45 cfu/g when fresh to 5.42 cfu/g at the end of storage. The addition of WPC had the positive effect of increasing the numbers of BB. This positive effect occurred by adding SMP but with a lower rate than WPC addition. For instance, PMC5, which contained 1.5% WPC, recorded the highest number of BB compared to PMC3, which contained 1.5% SMP; this could be due to the effect of whey protein in stimulating the growth of BB [62]. After 28 days of storage, it was observed that the numbers of BB were >6 log cfu/g in the samples with WPC added (PMC4 and PMC5) compared to the samples with SMP added (PMC2 and PMC3), which recorded 5.78 and 5.94, respectively, during the same storage period. It has been reported that for Bifidobacterium to exert their beneficial effects on the host, they must be able to survive and reach the GI tract in sufficient numbers, at least 106 cfu/g [63].

4. Conclusions

This study provides insights into the characteristics of PMC made by adding SMP and WPC using BB during storage at 5 ± 1 °C for 28 days. The study showed that adding WPC when making PMC led to producing mozzarella cheese with high meltability and browning index and more acceptable properties, while simultaneously increasing the vitality and growth of Bifidobacterium bacteria during the storage period when compared to PMC manufactured using SMP addition. Alternatively, the addition of SMP increased the yield of PMC and decreased the hardness of PMC.

Author Contributions

Conceptualization, K.A.A.; methodology, M.E.A.H.; software, A.R.A.H.; validation, M.E.A.H. and R.R.A.; formal analysis, M.E.A.H., R.R.A., K.A.A., M.S.E., and A.R.A.H.; investigation, M.E.A.H.; resources, M.E.A.H., R.R.A., K.A.A., M.S.E., and A.R.A.H.; data curation, M.E.A.H.; writing—original draft preparation, M.E.A.H.; writing—review and editing, M.E.A.H., R.R.A., K.A.A., M.S.E., and A.R.A.H.; visualization, M.E.A.H., R.R.A., K.A.A., M.S.E., and A.R.A.H.; supervision, M.E.A.H. and A.R.A.H.; project administration, M.E.A.H.; funding acquisition, M.E.A.H., R.R.A., K.A.A., M.S.E., and A.R.A.H. All authors have read and agreed to the published version of the manuscript.

Funding

The researchers would like to thank the Deanship of Scientific Research, Qassim University, for funding the publication of this project.

Institutional Review Board Statement

Not applicable.

Informed Consent Statement

Not applicable.

Data Availability Statement

Data are contained within the article.

Conflicts of Interest

The authors declare no conflict of interest.

References

  1. Jana, A. Mozzarella cheese and pizza–the compatible partners. Beverage Food World 2001, 28, 14–19. [Google Scholar]
  2. Becskei, Z.; Savić, M.; Ćirković, D.; Rašeta, M.; Puvača, N.; Pajić, M.; Đorđević, S.; Paskaš, S. Assessment of water buffalo milk and traditional milk products in a sustainable production system. Sustainability 2020, 12, 6616. [Google Scholar] [CrossRef]
  3. Ghosh, B.C.; Singh, S. Effect of different levels of titratable acidity in curd from buffalo milk at stretching on mozzarella cheese. J. Food Sci. Technol. 1996, 33, 70–72. [Google Scholar]
  4. Mazaherinasab, M.; Najafi, M.B.H.; Razavi, S.M.A. Physical, chemical and sensory properties of low-fat mozzarella cheese made from blend of two fat replacers. Iran. Food Sci. Technol. Res. J. 2012, 8, 103–114012. [Google Scholar]
  5. Kamau, S.M.; Cheison, S.C.; Chen, W.; Liu, X.; Lu, R. Alpha-lactalbumin: Its production technologies and bioactive peptides. Compr. Rev. Food Sci. Food Saf. 2010, 9, 197–212. [Google Scholar] [CrossRef]
  6. Ahmed, M.E.; Hamdy, A.M.; Hammam, A.R.A. Therapeutic Benefits and Applications of Whey Protein. Int. J. Curr. Microbiol. Appl. Sci. 2020, 9, 337–345. [Google Scholar] [CrossRef]
  7. Janer, C.; Pelaez, C.; Requena, T. Caseinomacropeptide and whey protein concentrate enhance Bifidobacterium lactis growth in milk. Food Chem. 2004, 86, 263–267. [Google Scholar] [CrossRef]
  8. Pinto, S.; Rathour, A.K.; Prajapati, J.P.; Jana, A.H.; Solanky, M.J. Utilization of whey protein concentrate in processed cheese spread. NIScPR Online Period. Repos. 2007, 6, 398–401. [Google Scholar]
  9. Sales, D.C.; Urbano, S.A.; Júnior, D.M.d.L.; Júnior, J.G.B.G.; Brito, A.F.; Cipolat-Gotet, C.; Borba, L.H.F.; Rangel, A.H.D.N. Factors affecting buffalo Mozzarella cheese yield: A study using regression analysis. Food Sci. Technol. 2020, 41, 852–855. [Google Scholar] [CrossRef]
  10. Ismail, M.; Ammar, E.; El-Metwally, R. Improvement of low fat mozzarella cheese properties using denatured whey protein. Int. J. Dairy Technol. 2011, 64, 207–217. [Google Scholar] [CrossRef]
  11. Salama, W.M. Influence whey proteins on the characteristics of buffalo Mozzarella cheese. Int. J. Dairy Sci. 2015, 10, 12–23. [Google Scholar] [CrossRef]
  12. Mukhtar, H.; Yaqub, S. Production of probiotic Mozzarella cheese by incorporating locally isolated Lactobacillus acidophilus. Ann. Microbiol. 2020, 70, 56. [Google Scholar] [CrossRef]
  13. Kosikowski, F.V. Cheese and Fermented Milk Foods, 3rd ed.; Edwards Bros. Inc.: Ann Arbor, MI, USA, 1982; pp. 562–563. [Google Scholar]
  14. Sadler, S.; Murphy, P. Chapter 13. pH and Titratable Acidity. In Food Analysis, 4th ed.; Springer Science+Business Media, LLC.: New York, NY, USA, 2010; pp. 219–238. [Google Scholar]
  15. Horwitz, W. Official Methods of Analysis, 222; Association of Official Analytical Chemists: Washington, DC, USA, 1975. [Google Scholar]
  16. Barbano, D.M.; Clark, J.L.; Dunham, C.E.; Flemin, R.J. Kjeldahl method for determination of total nitrogen content of milk: Collaborative study. J. Assoc. Off. Anal. Chem. 1990, 73, 849–859. [Google Scholar] [CrossRef]
  17. Hooi, R.; Barbano, D.M.; Bradley, R.L.; Budde, D.; Bulthaus, M.; Chettiar, M.; Lynch, J.; Reddy, R. Chemical and physical methods. Stand. Methods Exam. Dairy Prod. 2004, 17, 443–445. [Google Scholar]
  18. Kleyn, D.H.; Lynch, J.M.; Barbano, D.M.; Bloom, M.J.; Mitchell, M.W. Method: Collaborative Study. J. AOAC Int. 2001, 84, 1499–1508. [Google Scholar] [CrossRef]
  19. Ling, E.R. A Textbook of Dairy Chemistry; Chapman & Hall Ltd.: London, UK, 1963. [Google Scholar]
  20. Graham, H.G., Jr.; Mcright, T.C.; Frederick, E.D. Fertilizer Materials Analysis, Determination of Calcium in Phosphate Materials by Titration with EDTA in the Presence of Calcein Indicator. J. Agric. Food Chem. 1962, 10, 447–450. [Google Scholar] [CrossRef]
  21. Salunke, P.; Metzger, L.E. Functional characteristics of process cheese product as affected by milk protein concentrate and micellar casein concentrate at different usage levels. Int. Dairy J. 2022, 128, 105324. [Google Scholar] [CrossRef]
  22. Rehman, R.; Wang, Y.; Wang, J.; Geng, W. Physicochemical analysis of Mozzarella cheese produced and developed by the novel EPS-producing strain Lactobacillus kefiranofaciens ZW3. Int. J. Dairy Technol. 2018, 71, 90–98. [Google Scholar] [CrossRef]
  23. Hamdy, A.M.; Ahmed, M.E.; Mehta, D.; Elfaruk, M.S.; Hammam, A.R.A.; El-Derwy, Y.M.A. Enhancement of low-fat Feta cheese characteristics using probiotic bacteria. Food Sci. Nutr. 2021, 9, 62–70. [Google Scholar] [CrossRef]
  24. Metzger, L.E.; Barbano, D.M.; Kindstedt, P.S. Effect of milk preacidification on low fat Mozzarella cheese: III. Post-melt chewiness and whiteness. J. Dairy Sci. 2001, 84, 1357–1366. [Google Scholar] [CrossRef]
  25. Yildiz, G.; Rababah, T.M.; Feng, H. Ultrasound-assisted cutting of cheddar, mozzarella and Swiss cheeses–Effects on quality attributes during storage. Innov. Food Sci. Emerg. Technol. 2016, 37, 1–9. [Google Scholar] [CrossRef]
  26. Abdalla, A.; Abu-Jdayil, B.; Alsereidi, H.; Hamed, F.; Kamal-Eldin, A.; Huppertz, T.; Ayyash, M. Low-moisture part-skim mozzarella cheese made from blends of camel and bovine milk: Gross composition, proteolysis, functionality, microstructure, and rheological properties. J. Dairy Sci. 2022, 105, 8734–8749. [Google Scholar] [CrossRef] [PubMed]
  27. Brewer, J.H. Clear liquid mediums for the aerobic cultivation of anaerobes. J. Am. Med. Assoc. 1940, 115, 598–600. [Google Scholar] [CrossRef]
  28. Gomez, K.A.; Gomez, A.A. Statistical Procedures for Agricultural Research; John Wiley & Sons: Hoboken, NJ, USA, 1984. [Google Scholar]
  29. Mehanna, N.S.; Effat, B.A.; Dabiza, N.M.A.; Tawfik, N.F.; Sharaf, O.M. Incorporation and viability of some probiotic bacteria in functional dairy foods. Minufiya J. Agric. Res. 2002, 27, 225–241. [Google Scholar]
  30. Ahmed, M.E.; Rathnakumar, K.; Awasti, N.; Elfaruk, M.S.; Hammam, A.R.A. Influence of probiotic adjunct cultures on the characteristics of low-fat Feta cheese. Food Sci. Nutr. 2021, 9, 1512–1520. [Google Scholar] [CrossRef]
  31. Fooks, L.J.; Fuller, R.; Gibson, G.R. Prebiotics, probiotics and human gut microbiology. Int. Dairy J. 1999, 9, 53–61. [Google Scholar] [CrossRef]
  32. Moneeb, A.H.M.; Ali, A.K.; Ahmed, M.E.; Elderwy, Y. Characteristics of low-fat white soft cheese made with different ratios of Bifidobacterium bifidum. Assiut J. Agric. Sci. 2022, 53, 31–44. [Google Scholar] [CrossRef]
  33. El-Metwally, R.I.M. Manufacture of Mozzarella Cheese by Using Different Types of Milk. Master’s Thesis, Faculty of Agriculture, Ain Shams University, Cairo, Egypt, 2008. [Google Scholar]
  34. Gafour, W. Using of Soybean Extract to Produce Some Dairy Like Products. Ph.D. Thesis, Agriculture, Moshtohore, Zagazige University, Zagazig, Egypt, 2005. [Google Scholar]
  35. Effat, B.A.E.L.K.M.; Hassan, Z.M.R.; Mabrouk, A.M.M.; Sadek, Z.I.M.; Magdoub, M.N.I.; Tawfik, N.F. Properties of Low Salt Soft Cheese Supplemented with Probiotic Cultures. Int. J. Adv. Res. Biol. Sci. 2018, 5, 1–10. [Google Scholar]
  36. McCarthy, R.; Mills, S.; Ross, R.P.; Fitzgerald, G.F.; Stanton, C. Bioactive peptides from casein and whey proteins. Milk Dairy Prod. Funct. Foods 2014, 2, 23–54. [Google Scholar]
  37. Sun, W.; Shahrajabian, M.H.; Lin, M. Research Progress of Fermented Functional Foods and Protein Factory-Microbial Fermentation Technology. Fermentation 2022, 8, 688. [Google Scholar] [CrossRef]
  38. Elewa, N.A.H.; Degheidi, M.A.; Zedan, M.A.; Malim, M.A. Synergistic effects of inulin and cellulose in UF-probiotic white soft cheese. Egypt. J. Dairy Sci. 2009, 37, 85–100. [Google Scholar]
  39. Al Esawy, S.A. Studies on Probiotic Bacteria. Master’s Thesis, Faculty of Agriculture, Damietta University, Damietta, Egypt, 2017. [Google Scholar]
  40. Abdelmotilib, N.M.; Abdel-Azeem, A.M. An annotated bibliography of lactic acid bacteria in dairy products in Egypt. Microb. Biosyst. 2022, 7, 52–75. [Google Scholar] [CrossRef]
  41. Policastro, G.; Cesaro, A.; Fabbricino, M. Photo-fermentative hydrogen production from cheese whey: Engineering of a mixed culture process in a semi-continuous, tubular photo-bioreactor. Int. J. Hydrog. Energy 2023, 48, 21038–21054. [Google Scholar] [CrossRef]
  42. El-Tahra, R.I.; Ammar, M.A.; Ismail, M.M.; El-Metwally, R.I.M. Effect of adding CaCl2 or whey protein to cow’s milk on Mozzarella cheese properties. In Proceedings of the 4th Arab Mansoura Conference of Food and Dairy Science & Technology, Giza, Egypt, 10–14 November 2008. [Google Scholar] [CrossRef]
  43. Kindstedt, P.S. Functional properties of Mozzarella cheese on pizza: A review. Cult. Dairy Prod. J. 1991, 26, 27–31. [Google Scholar]
  44. IA, Z. Quality evaluation of Mozzarella cheese from different milk types. Alex. Sci. Exch. J. 2014, 35, 162–177. [Google Scholar]
  45. Fife, R.L.; McMahon, D.J.; Oberg, C.J. Functionality of Low Fat Mozzarella Cheese. J. Dairy Sci. 1996, 79, 1903–1910. [Google Scholar] [CrossRef]
  46. Jana, A.H.; Upadhyay, K.G. Mozzarella cheese-a review. Indian J. Dairy Sci. 1991, 44, 167–175. [Google Scholar]
  47. Yun, J.J.; Barbano, D.M.; Kindstedt, P.S. Impact of milk pH on chemical composition, soluble nitrogen and texture profile of Mozzarella cheese during refrigerated storage. J. Dairy Sci. 1991, 74, 98. [Google Scholar]
  48. Yun, J.J.; Barbano, D.M.; Larose, K.L.; Kindstedt, P.S. Mozzarella Cheese: Impact of Nonfat Dry Milk Fortification on Composition, Proteolysis, and Functional Properties. J. Dairy Sci. 1998, 81, 1–8. [Google Scholar] [CrossRef]
  49. Rudan, M.A.; Barbano, D.M.; Guo, M.R.; Kindstedt, P.S. Effect of the Modification of Fat Particle Size by Homogenization on Composition, Proteolysis, Functionality, and Appearance of Reduced Fat Mozzarella Cheese. J. Dairy Sci. 1998, 81, 2065–2076. [Google Scholar] [CrossRef]
  50. Dhanraj, P.; Jana, A.; Modha, H.; Aparnathi, K.D. Influence of using a blend of rennet casein and whey protein concentrate as protein source on the quality of Mozzarella cheese analogue. J. Food Sci. Technol. 2017, 54, 822–831. [Google Scholar] [CrossRef]
  51. Guichard, E.; Thomas-Danguin, T.; Buchin, S.; Perret, B.; Guillemin, H.; Pénicaud, C.; Salles, C. Relationships between cheese composition, rheological and sensory properties highlighted using the BaGaTel database. Int. Dairy J. 2021, 118, 105039. [Google Scholar] [CrossRef]
  52. Hamouda, M.E.A. Manufacturing of Probiotic Low Fat White Soft Cheese. Master’s Thesis, Assiut University, Asyut, Egypt, 2015. [Google Scholar] [CrossRef]
  53. Hammam, A.R.A.; Ahmed, M.S.I. Technological aspects, health benefits, and sensory properties of probiotic cheese. SN Appl. Sci. 2019, 1, 1113. [Google Scholar] [CrossRef]
  54. Pereira, C.I.; Gomes, E.O.; Gomes, A.M.P.; Malcata, F.X. Proteolysis in model Portuguese cheeses: Effects of rennet and starter culture. Food Chem. 2008, 108, 862–868. [Google Scholar] [CrossRef] [PubMed]
  55. Sfakianakis, P.; Tzia, C. Conventional and innovative processing of milk for yogurt manufacture; development of texture and flavor: A review. Foods 2014, 3, 176–193. [Google Scholar] [CrossRef]
  56. Endrizzi, I.; Cliceri, D.; Menghi, L.; Aprea, E.; Gasperi, F. Does the ‘Mountain Pasture Product’ claim affect local cheese acceptability? Foods 2021, 10, 682. [Google Scholar] [CrossRef] [PubMed]
  57. Ah, J.; Tagalpallewar, G.P. Functional properties of Mozzarella cheese for its end use application. J. Food Sci. Technol. 2017, 54, 3766–3778. [Google Scholar] [CrossRef]
  58. Hamad, M.N.F.; Abdul-Kader, Y.I.; El-Metwally, M.M.M. Mozzarella cheese from recombined cow milk. Indian J. Dairy Sci. 2017, 71, 360–367. [Google Scholar]
  59. Dave, R.I. Factors affecting viability of yoghurt and probiotic bacteria in commercial starter cultures. Ph.D. Thesis, Victoria University of Technology, Footscray, Australia, 1998. [Google Scholar]
  60. Vinderola, C.G.; Prosello, W.; Ghiberto, D.; Reinheimer, J.A. Viability of probiotic (Bifidobacterium, Lactobacillus acidophilus and Lactobacillus casei) and nonprobiotic microflora in Argentinian Fresco cheese. J. Dairy Sci. 2000, 83, 1905–1911. [Google Scholar] [CrossRef]
  61. Khalifa, S.A.A. Technological Studies on Cheese. Master’s Thesis, Food Science Department, Faculty of Agriculture, Zagazig University, Zagazig, Egypt, 2005. [Google Scholar]
  62. Osman, E.A.A. Using of Bifidobacterium Bifidum in Manufacture of Some Dairy Products. Ph.D. Thesis, Faculty of Agriculture, Assiut University, Assiut, Egypt, 2019. [Google Scholar]
  63. Picot, A.; Lacroix, C. Encapsulation of bifidobacteria in whey protein-based microcapsules and survival in simulated gastrointestinal conditions and in yoghurt. Int. Dairy J. 2004, 14, 505–515. [Google Scholar] [CrossRef]
Figure 1. Modified Schreiber test characteristics of PMC.
Fermentation 09 00948 g001
Figure 2. Pizza baking test characteristics of PMC.
Fermentation 09 00948 g002
Table 1. Formulations of probiotic mozzarella cheese supplemented with skim milk powder and whey protein concentrate.
TreatmentsSMP and WPC Addition Percentage
PMC1-
PMC21% SMP
PMC31.5% SMP
PMC41% WPC
PMC51.5% WPC
SMP: skim milk powder; WPC: whey protein concentrate.
Table 2. Mean values (n = 3) ± standard deviation of proximate chemical composition of SMP and WPC.
Chemical CompositionSMPWPC
Total proteins %37.10 b ± 1.2087.50 a ± 1.66
Moisture %3.80 b ± 0.456.90 a ± 0.31
Lipids %0.70 b ± 0.011.10 a ± 0.04
Total ash %6.60 a ± 0.202.30 b ± 0.06
Lactose %51.30 a ± 1.702.2 b ± 0.03
a,b Means in the same column not sharing a common superscript are different at p < 0.05.
Table 3. Mean values (n = 3) ± standard deviation of the proximate chemical composition of probiotic mozzarella cheese (PMC).
Chemical Composition PMC1PMC2PMC3PMC4PMC5
Acidity %00.81 Ce ± 0.020.86 Cc ± 0.010.85 Cd ± 0.030.91 Cb ± 0.030.95 Ca ± 0.04
140.94 Be ± 0.030.98 Bd ± 0.010.99 Bc ± 0.041.04 Bb ± 0.051.16 Ba ± 0.03
281.13 Ae ± 0.021.17 Ad ± 0.031.21 Ac ± 0.041.28 Ab ± 0.051.34 Aa ± 0.05
Total solids %054.43 Ce ± 0.0354.85 Cd ± 0.0155.39 Cc ± 0.0455.88 Cb ± 0.0556.32 Ca ± 0.03
1455.41 Be ± 0.0255.83 Bd ± 0.0456.37 Bc ± 0.0556.86 Bb ± 0.0457.30 Ba ± 0.03
2856.51 Ad ± 0.0456.93 Ae ± 0.0357.47 Ac ± 0.0457.96 Ab ± 0.0358.40 Aa ± 0.02
Fat %020.77 Ce ± 0.0922.21 Cc ± 0.0821.34 Bd ± 0.0722.65 Cb ± 0.0222.86 Ca ± 0.04
1421.61 Be ± 0.0123.05 Bc ± 0.0122.18 Cd ± 0.0723.49 Bb ± 0.0223.70 Ba ± 0.03
2822.63 Ae ± 0.0123.79 Ac ± 0.0123.21 Ad ± 0.0724.46 Ab ± 0.0224.75 Aa ± 0.01
Total protein %016.78 Ce ± 0.0117.10 Cd ± 0.0217.35 Cc ± 0.0818.76 Cb ± 0.0919.59 Ca ± 0.06
1418.33 Be ± 0.0218.52 Bd ± 0.0318.90 Bc ± 0.0120.10 Bb ± 0.0621.11 Ba ± 0.04
2819.65 Ae ± 0.0219.91 Ad ± 0.0120.22 Ac ± 0.0721.50 Ab ± 0.0822.78 Aa ± 0.04
Soluble nitrogen %00.24 Cd ± 0.010.25 Cc ± 0.000.25 Cc ± 0.010.27 Cb ± 0.020.28 Ca ± 0.03
140.27 Bd ± 0.000.27 Bd ± 0.000.28 Bc ± 0.010.29 Bb ± 0.010.3 Ba ± 0.01
280.29 Ad ± 0.000.29 Ad ± 0.000.30 Ac ± 0.010.31 Ab ± 0.010.32 Aa ± 0.01
Ash %03.46 Ce ± 0.053.54 Cd ± 0.033.61 Cc ± 0.093.73 Cb ± 0.053.79 Ca ± 0.04
143.97 Be ± 0.034.02 Bd ± 0.024.06 Bc ± 0.084.18 Bb ± 0.024.21 Ba ± 0.03
284.42 Ae ± 0.014.45 Ad ± 0.054.51 Ac ± 0.084.67 Ab ± 0.064.73 Aa ± 0.04
Calcium %00.77 Ca ± 0.000.77 Cb ± 0.000.76 Cc ± 0.000.75 Cd ± 0.000.74 Ce ± 0.00
140.86 Ba ± 0.000.85 Bb ± 0.000.84 Bc ± 0.000.83 Bd ± 0.000.82 Be ± 0.00
280.91 Aa ± 0.010.90 Ab ± 0.000.89 Ac ± 0.010.88 Ad ± 0.000.87 Ae ± 0.01
a–e Means in the same row not sharing a common superscript are different at p < 0.05. A–C Means in the same column not sharing a common superscript are different at p < 0.05. PMC1: control; PMC2: 1% SMP; PMC3: 1.5% SMP; PMC4: 1% WPC; and PMC5 1.5% WPC.
Table 4. Mean values (n = 3) ± standard deviation of yield% of probiotic mozzarella cheese (PMC).
TreatmentsYield%
PMC113.67 e ± 0.35
PMC215.11 c ± 0.21
PMC316.54 a ± 0.63
PMC413.96 d ± 0.31
PMC514.31 b ± 0.19
a–e Means in the same column not sharing a common superscript are different at p < 0.05. PMC1: control; PMC2: 1% SMP; PMC3: 1.5% SMP; PMC4: 1% WPC; and PMC5: 1.5% WPC.
Table 5. Mean values (n = 3) ± standard deviation of the texture characteristics of probiotic mozzarella cheese (PMC).
Parameters PMC1PMC2PMC3PMC4PMC5
Modified Schreiber test (mm2)0219.80 Ce ± 24.00266.90 Cd ± 15.00298.30 Cc ± 13.00329.00 Cb ± 9.00361.10 Ca ± 20.00
14369.80 Be ± 10.00466.90 Bd ± 18.00488.30 Bc ± 20.00509.00 Bb ± 14.00546.10 Ba ± 27.00
28560.00 Ae ± 25.00646.90 Ad ± 20.00668.30 Ac ± 12.00679.00 Ab ± 9.00736.10 Aa ± 30.00
Hardness (N)01578.00 Ce ± 30.001845.00 Cd ± 18.001956.00 Cc ± 25.002163.00 Cb ± 20.002231.00 Ca ± 15.00
141828.00 Be ± 30.001985.00 Bd ± 25.002116.00 Bc ± 20.002313.00 Bb ± 15.002381.00 Ba ± 10.00
282128.00 Ae ± 25.002235.00 Ad ± 20.002386.00 Ac ± 18.002563.00 Ab ± 15.002681.00 Aa ± 12.00
a–e Means in the same row not sharing a common superscript are different at p < 0.05. A–C Means in the same column not sharing a common superscript are different at p < 0.05. PMC1: control; PMC2: 1% SMP; PMC3: 1.5% SMP; PMC4: 1% WPC; and PMC5: 1.5% WPC.
Table 6. Mean values (n = 3) ± standard deviation of the sensory characteristics of probiotic mozzarella cheese (PMC).
Chemical Composition PMC1PMC2PMC3PMC4PMC5
Color and appearance (15)012.00 Ab ± 0.5013.00 Aa ± 0.0013.00 Aa ± 0.6012.00 Bb ± 0.5013.00 Aa ± 0.80
1411.00 Bc ± 0.7012.00 Bb ± 0.0012.00 Bb ± 0.7013.00 Aa ± 0.8013.00 Aa ± 0.00
289.00 Cc ± 0.8010.00 Cb ± 0.0010.00 Cb ± 0.8011.00 Ca ± 0.4011.00 Ba ± 0.00
Body and texture (35)021.00 Ce ± 2.0024.00 Cd ± 1.5026.00 Cc ± 1.6028.00 Cb ± 1.0029.00 Ca ± 1.40
1424.00 Be ± 3.0027.00 Bd ± 1.9.031.00 Bc ± 2.0033.00 Bb ± 1.8034.00 Ba ± 2.00
2827.00 Ae ± 1.5029.00 Ad ± 3.0033.00 Ac ± 1.0034.00 Ab ± 1.0035.00 Aa ± 1.3.00
Flavor (50)030.00 Ce ± 0.7032.00 Cd ± 0.2035.00 Cc ± 0.3039.00 Cb ± 0.2041.00 Ca ± 0.40
1433.00 Be ± 0.5036.00 Bd ± 0.1037.00 Bc ± 0.5042.00 Bb ± 0.7044.00 Ba ± 0.50
2836.00 Ae ± 0.2038.00 Ad ± 0.5040.00 Ac ± 0.6046.00 Ab ± 0.9048.00 Aa ± 0.60
Total (100)063.00 Ce ± 1.0069.00 Cd ± 0.0874.00 Cc ± 0.5579.00 Cb ± 1.0383.00 Ca ± 1.00
1468.00 Be ± 1.3375.00 Bd ± 1.2080.00 Bc ± 1.0188.00 Bb ± 1.1191.00 Ba ± 1.05
2872.00 Ae ± 1.0477.00 Ad ± 1.0483.00 Ac ± 0.8791.00 Ab ± 0.4994.00 Aa ± 1.02
a–e Means in the same row not sharing a common superscript are different at p < 0.05. A–C Means in the same column not sharing a common superscript are different at p < 0.05. PMC1: control; PMC2: 1% SMP; PMC3: 1.5% SMP; PMC4: 1% WPC; and PMC5: 1.5% WPC.
Table 7. Mean values (n = 3) ± standard deviation of the color characteristics of probiotic mozzarella cheese after baking (PMC).
Color IndicatorPMC1PMC2PMC3PMC4PMC5
L*62.77 a ± 0.0460.97 b ± 0.0460.34 b ± 0.0154.12 c ± 0.4251.23 d ± 0.05
a*12.19 d ± 0.0114.25 c ± 0.0814.23 c ± 0.0517.49 b ± 0.0718.78 a ± 0.01
b*22.86 e ± 0.0524.12 d ± 0.0725.41 c ± 0.0235.33 b ± 0.0438.21 a ± 0.11
Browing index58.0965.7970.03120.86146.48
Parameters: L* = black (0) to white (100); a* = green (−) to red (+); b* = blue (−) to yellow (+). a–e Means in the same column not sharing a common superscript are different at p < 0.05. PMC: control; PMC2: 1% SMP; PMC3: 1.5% SMP; PMC4: 1% WPC; and PMC5: 1.5% WPC.
Table 8. Mean values (n = 3) ± standard deviation of Bifidobacteria probiotic mozzarella during 28 days of storage.
Bifidobacteria CountPMC1PMC2PMC3PMC4PMC5
06.45 Be ± 0.016.57 Bd ± 0.036.69 Bc ± 0.086.84 Ab ± 0.026.94 Ba ± 0.05
146.85 Ae ± 0.016.92 Ad ± 0.016.98 Ac ± 0.157.02 Ab ± 0.027.34 Aa ± 0.01
285.42 Ce ± 0.025.78 Cd ± 0.025.94 Cc ± 0.026.11 Cb ± 0.016.25 Ca ± 0.11
a–e Means in the same row not sharing a common superscript are different at p < 0.05. A–C Means in the same column not sharing a common superscript are different at p < 0.05. PMC: control; PMC2: 1% SMP; PMC3: 1.5% SMP; PMC4: 1% WPC; and PMC5: 1.5% WPC.
Disclaimer/Publisher’s Note: The statements, opinions and data contained in all publications are solely those of the individual author(s) and contributor(s) and not of MDPI and/or the editor(s). MDPI and/or the editor(s) disclaim responsibility for any injury to people or property resulting from any ideas, methods, instructions or products referred to in the content.

