Article

Investigating Yeast–Lactobacilli Interactions through Co-Culture Growth and Metabolite Analysis

1
Department of Biology, University of Florence, Via Madonna del Piano 6, 50019 Firenze, Italy
2
NEUROFARBA Department, Section of Pharmaceutical and Nutraceutical Sciences, University of Florence, Via U. Schiff 6, 50019 Firenze, Italy
*
Author to whom correspondence should be addressed.
Fermentation 2023, 9(11), 933; https://doi.org/10.3390/fermentation9110933
Submission received: 30 September 2023 / Revised: 20 October 2023 / Accepted: 24 October 2023 / Published: 26 October 2023
(This article belongs to the Special Issue Perspectives on Microbial Ecology of Fermented Foods)

Abstract

:
The various forms of interactions that microorganisms engage in within fermented foods result in distinct metabolic product patterns. Fermentation products often feature both yeasts and bacteria, each possessing characteristics that can enhance the overall quality of the food, thus benefiting consumers. Kefir, a fermented milk originating from grains containing a unique and intricate blend of bacteria and yeasts living in a symbiotic relationship, is a valuable model for studying the evolution of the interactions between yeasts and bacteria. Targeted metagenomics was applied to investigate the microbiome of a batch of traditional Romanian kefir and further examine the growth and metabolic properties of the dominant yeast and bacterial strains isolated from this batch. In contrast to yeast, which is either unaffected or harmed by the presence of bacteria, our study revealed that a specific strain of Lactobacillus (L. rhamnosus) derived from the kefir batch benefited from the presence of Saccharomyces cerevisiae. The analysis of short-chain fatty acids (SCFAs) produced by in vitro cultures of these two chosen strains indicated significant changes in SCFA levels compared to single cultures. The dynamic interactions described in this and other studies on kefir emphasize the importance of a more profound comprehension of the ecological mechanisms governing interactions between yeast, bacterial, and mammalian cells.

1. Introduction

The health and disease status of the host is strongly related to its microbiota, not only in terms of composition but also in the interactions established between the different microorganisms [1]. These interactions can develop between members belonging to the same kingdom or different kingdoms, and, regardless of this, they can be distinguished into symbiotic, antagonistic, or additive interplays. In environmental-related conditions, the survival of specific strains within a microbial community depends on the metabolic products excreted by others [2]. Therefore, both the stability and functionality of a microbial community strictly rely on the nutritional interactions between various members [3]. However, the way that microorganisms establish interactions with each other is currently not fully understood. This is due to the great difficulties that still exist in the effective quantifications of the metabolites exchanged within different members of a microbial community [2]. As known, S. cerevisiae and Lactobacillus spp. represent important members of the human gut microbiota and, at the same time, are often found to coexist in fermented food products, such as kimchi, kefir, wine, cheese, sourdough bread, etc. [4]. Kefir is a dairy product obtained from the symbiotic fermentation of milk by lactic acid bacteria, in particular, Lactobacillus spp., and yeasts contained in an exopolysaccharide and protein complex called kefir wheat. The microbial composition of kefir has been investigated with both classical and metagenomic approaches. A previous analysis [5] showed an extremely complex microbial community in traditional kefir products from the Yaghnob Valley in Tajikistan, while other works on kefir products showed a more simplified microbial composition [6,7,8,9,10]. Regardless of the geographic origin or type of preparation, it has been found that certain genera, if not species, are almost constantly present within kefir [11], namely Lactobacillus and Saccharomyces.
Similar to other fermented dairy products, kefir has been associated with several health benefits, such as cholesterol metabolism, angiotensin-converting enzyme inhibition, antimicrobial protection, tumor suppression, and modulation of the immune system, such as the mitigation of allergic and asthmatic symptoms [12]. Most of the health-beneficial metabolites produced can be attributed precisely to the complex microbiological consortium that is characteristic of kefir. This was our main motivation to investigate the interactions between S. cerevisiae and Lactobacillus spp. obtained from fermented products. We aimed to unveil their contribution to the improvement of human health. The complex interconnections that exist between yeast and bacteria within these foods are not yet fully understood. However, several studies have highlighted that some yeast strains were unable to grow efficiently without bacterial strains when the bacterial communities were removed from kefir [13,14,15]. Thanks to their high ability to metabolize lactose, bacterial strains belonging to the genus Lactococcus grow faster than yeast in lactose-based media, such as milk [16,17]. Lactococcus strains hydrolyze lactose, producing lactic acid, therefore making a suitable environment for the growth of yeasts. Yeasts, on the other hand, can synthesize B complex vitamins and hydrolyze milk proteins by using oxygen to produce carbon dioxide and ethanol [17,18]. During their growth, these microorganisms can either compete for nutrients or produce metabolites that modulate the growth of other microorganisms [19]. Some yeast strains are proteolytic and/or lipolytic, releasing amino acids and fatty acids into the environment, which can be taken from bacterial communities promoting their growth [20].
The intake of foods containing probiotics has been shown to influence the intestinal microbiota significantly. Thanks to the studies of Markowiak and Śliżewska [19], it is now known that probiotic-based foods promote health benefits in populations with a high risk of developing chronic inflammatory diseases and that these benefits may also vary according to probiotic strains. Bifidobacteria and lactobacilli, commonly found in kefir, can produce SCFAs (short-chain fatty acids) through the fermentation of metabolites such as carbohydrates and pyruvate, both produced during the glycolytic pathway and the phosphoketolase pathway in heterofermentative conditions [21]. The production of SCFAs by these bacteria plays an important role in gut physiology [22], regulating intestinal epithelial cell function and affecting their proliferation and differentiation, as well as the function of certain subpopulations [23]. Moreover, SCFAs proved to impact gut motility and strengthen the gut barrier functions, as well as host metabolism [24]. Recent findings show that SCFAs and, in particular, butyrate, also have important intestinal and immuno-modulatory functions [25,26].
This study consists of an exploratory examination of potential competitive or cooperative interactions that may arise in vitro when kefir-derived Saccharomyces cerevisiae and Lactobacillus species coexist and grow within the same environment. These two species are well recognized as beneficial constituents of the human gut microbiota and play essential roles in traditional fermented foods, which are associated with significant health benefits. The microbial isolation procedures were carried out on a locally produced kefir batch, resulting in the assessment of numerous yeast and bacterial strains. These strains were subjected to morphological and physiological characterizations to determine their suitability for growth under conditions related to the human stomach and gut.
We established co- and single cultures of an S. cerevisiae strain and an L. rhamnosus strain for one month in different media to evaluate their production of potential health-promoting metabolites, such as short-, medium-, and long-chain fatty acids. We identified significant changes in the levels of SCFAs between co-cultures, single cultures, and media alone. Therefore, the main purpose of this work was to research and outline the experimental methods that can be used for a detailed study of these interactions, with particular regard to growth methods in co-culture and the analysis of secreted metabolites. Several other studies remain to be performed on the dynamics in relationships between commensal or probiotic species within host microbiota, including in vitro and in vivo analyses of the immunomodulation properties of microorganisms that grow together in ecological communities such as kefir, which already proved to exert beneficial effects for human’s health.

2. Materials and Methods

2.1. Isolation of Yeasts and Bacteria on Differential Media

The experiment was carried out using microbial strains isolated from a single sample of commercially available kefir milk, provided by Fabio Picchi from Cibio. The original culture used for backslopping came from the Cluj region in Romania. To proceed with the isolation, aliquots were spread-plated on Petri dishes containing different solid culture media specific for bacterial growth, such as LB (Lysogeny Broth) under aerobic conditions and MRS (DeMan, Rogosa, Sharpe) under anaerobic conditions, and other specific media for yeasts, such as MRS under aerobic condition, YPD under aerobic condition, and MEA under aerobic condition (0.05% cysteine was added in both MRS). The anaerobic conditions were achieved with the Thermo Scientific Oxoid AnaeroGen anaerobic atmosphere generation system (code AN0025A) in Oxoid AnaeroJar jars (code AG0025A) and monitored with the resazurin indicator (Thermo Scientific Oxoid, Thermo Fisher Scientific, Waltham, MA, USA, code BR0055B). After 48 h, the grown colonies on the plates were selected by morphology and isolated on Petri dishes containing the same media in which they were initially plated. The colonies were left for about 48 h at a controlled temperature and then analyzed under an optical microscope and stereomicroscope. The chosen isolates were then stored in a 15% glycerol solution at −80 °C.

2.2. Genomic DNA Extraction and Quantification

The DNA of bacterial and yeast strains was extracted using the Wizard Genomic DNA Purification Kit (Promega, Madison, WI, USA), making some modifications to the protocol indicated by the manufacturer, such as the use of a combination of proteinase K and lysozyme, necessary to overcome the difficulties associated with the disruption of the Gram-positive bacteria wall [27]. The glycerol-preserved strains were inoculated into 5 mL of liquid medium—the same kind of medium in which they were first isolated—and left at their optimum growth temperature for 24 h. Subsequently, they were centrifuged at 13,000 rpm for 2 min, and their pellets were resuspended in 480 µL of 50 mM EDTA. After having added 120 µL of lysozyme (20 mg/mL) and 4 µL of proteinase K (20 mg/mL) to the suspensions, the solutions were incubated for 3 h at 37 °C. At the end of the incubation, the extraction procedure was completed according to the protocol provided by the manufacturer. Total DNA extraction for metagenomic analysis was performed on three replicates of the kefir batch, 1 mL each, using the DNeasy PowerSoil Pro Kit (Qiagen, Germantown, MD, USA), according to the manufacturer’s specifications, as described elsewhere [28]. The quality of extracted gDNA was checked with 1% w/v agarose gel electrophoresis. The dsDNA concentration (ng/μL) was measured using a Qubit™ 4 Fluorometer and the 1× dsDNA High Sensitivity Assay Kit (Thermo Fisher Scientific).

2.3. Library Preparation and Sequencing

For each DNA sample, the bacterial 16S rRNA gene was amplified using a primer set specific for the V3–V4 hypervariable regions 341F (5′-TCGTCGGCAGCGTCAGATGTGTATAAGAGACAGCCTACGGGNGGCWGCAG-3′) and 805R (5′-TCGTCGGCAGCGTCAGATGTGTATAAGAGACAGGACTACNVGGGTWTCTAATCC-3′) [29], while the fungal internal transcribed spacer (ITS) was amplified using a primer set specific for the ITS1 rDNA region ITS1F (5′-TCGTCGGCAGCGTCAGATGTGTATAAGAGACAGCTTGGTCATTTAGAGGAAGTAA-3′) and ITS2R (5′-TCGTCGGCAGCGTCAGATGTGTATAAGAGACAGGCTGCGTTCTTCATCGATGC-3′) [30], with overhang Illumina adapters (bold). Targeted libraries were prepared according to Illumina protocols, respectively, 16S Metagenomic Sequencing Library Preparation Protocol (Part # 15044223 Rev. B, Illumina, 2013) for bacterial community and Fungal Metagenomic Sequencing Demonstrated Protocol (Document #1000000064940 v01, Illumina, 2019) for fungal community. Sequencing was performed on the Illumina MiSeq (Illumina, San Diego, CA, USA) with the v3 chemistry 600 cycles, 300 bp paired-end reads protocol, at the Department of Biology, University of Florence (Italy). The raw reads of the metagenomic analysis described in this work were deposited in the “Sequence Read Archive” (SRA), under the accession PRJNA892524.

2.4. Sequencing Data Processing

The Sanger sequencing reaction products, suitably purified, were analyzed on the SeqStudioTM Genetic Analyzer System (Thermo Fisher Scientific) and visualized with the Chromas Version 2.6.6 software. To identify the isolated strains, the obtained sequences were used to perform a homology search, which was conducted using the BLAST version 2.10.0+ software.
After metagenomic sequencing, demultiplexed sample libraries were quality-checked using QIIME 2 software [31], and primers were trimmed using CUTADAPT [32]. Reads were further processed using the DADA2 pipeline [33] for merging and filtering the reads, chimera checking, and selection of operational taxonomic unit (OTU)/sequence variant (SV). Reference database cleaning and taxonomic assignments were performed with RESCRIPt [34], using the Silva 138.1 [35] (for the 16S) and UNITE 9.0 [36] (for the ITS) databases. The following analyses were performed in R (v.3.42), employing phyloseq v.1.42.0 [37] and vegan v.2.6.4 [38] packages to import and handle OTUs and taxonomy tables.

2.5. Taxonomic Identification of Isolated Strains

The taxonomic identification of the isolated strains was carried out by Sanger sequencing of molecular markers for bacteria and yeasts (16S rRNA gene and ITS region, respectively). After amplification of the selected regions with the primers 27F (5′-‘GAGTM’GATCCTGGCTCA-3′) and 1525R (5′-AGAAAGGAGGTGATCCAGCC-3′) [39] for the 16S and ITS1F (5′-TCCGTAGGTGAACCTGCGG-3′) and ITS4R (5′-TCCTCCGCTTATTGATATGC-3′) [30], PCR products were purified with 4 µL of ExoSAP-IT Express PCR Product Cleanup (Thermo Fisher Scientific). The Sanger sequencing reaction was performed with purified products, for which the BigDyeTM Terminator v3.1 Cycle Sequencing Kit (Thermo Fisher Scientific) was used. The purification of the reaction products was performed with BigDye XTerminator Purification Kit (Thermo Fisher Scientific) according to the protocol provided by the manufacturer, by adding 55 µL of the mixture of SAM™ Solution and Bigdye XTerminator Solution to 10 µL of the sequencing reaction product. The Sanger sequences described in this work were deposited in GenBank, under the accession numbers OP681672-OP681680 and OP683217-OP683221.

2.6. Physiological Characterization

The growth curve of each isolated strain in the selected conditions was obtained by measuring the optical density of a liquid culture at 600 nm with the Infinite 200 PRO plate reader (Tecan Italia S.r.l., Milan, Italy). Each curve was obtained through a series of 25 readings over 24 h. These conditions were chosen to resemble human stomach-like—and gut-like— environments to understand which strains could have the potential to survive the digestion process and eventually colonize the gut.
The growth of yeast strains was tested in the following conditions:
  • 37 °C in yeast extract + peptone + dextrose 2%;
  • 30 °C pH 2,5 in yeast extract + peptone + dextrose 2%;
  • 30 °C pH 4,5 in yeast extract + peptone + dextrose 2%;
  • 30 °C in yeast extract + peptone + dextrose 2%;
  • 30 °C in yeast extract + peptone + lactic acid 1%;
  • 30 °C in yeast extract + peptone + sucrose 2%;
  • 30 °C in yeast extract + peptone + lactose 2%.
The growth of bacterial strains was tested in the following conditions:
  • 37 °C in LB;
  • 37 °C in MRS + L-cysteine 0.05%;
  • 37 °C in LB + dextrose 2%;
  • 37 °C in MRS + L-cysteine 0.05% + dextrose 2%;
  • 37 °C in LB + lactic acid 1%;
  • 37 °C in MRS + L-cysteine 0.05% + lactic acid 1%;
  • 37 °C in LB + sucrose 2%;
  • 37 °C in MRS + L-cysteine 0.05% + sucrose 2%;
  • 37 °C in LB + lactose 2%;
  • 37 °C in MRS + L-cysteine 0.05% + lactose 2%;
  • 30 °C in LB;
  • 30 °C in MRS + L-cysteine 0.05%.
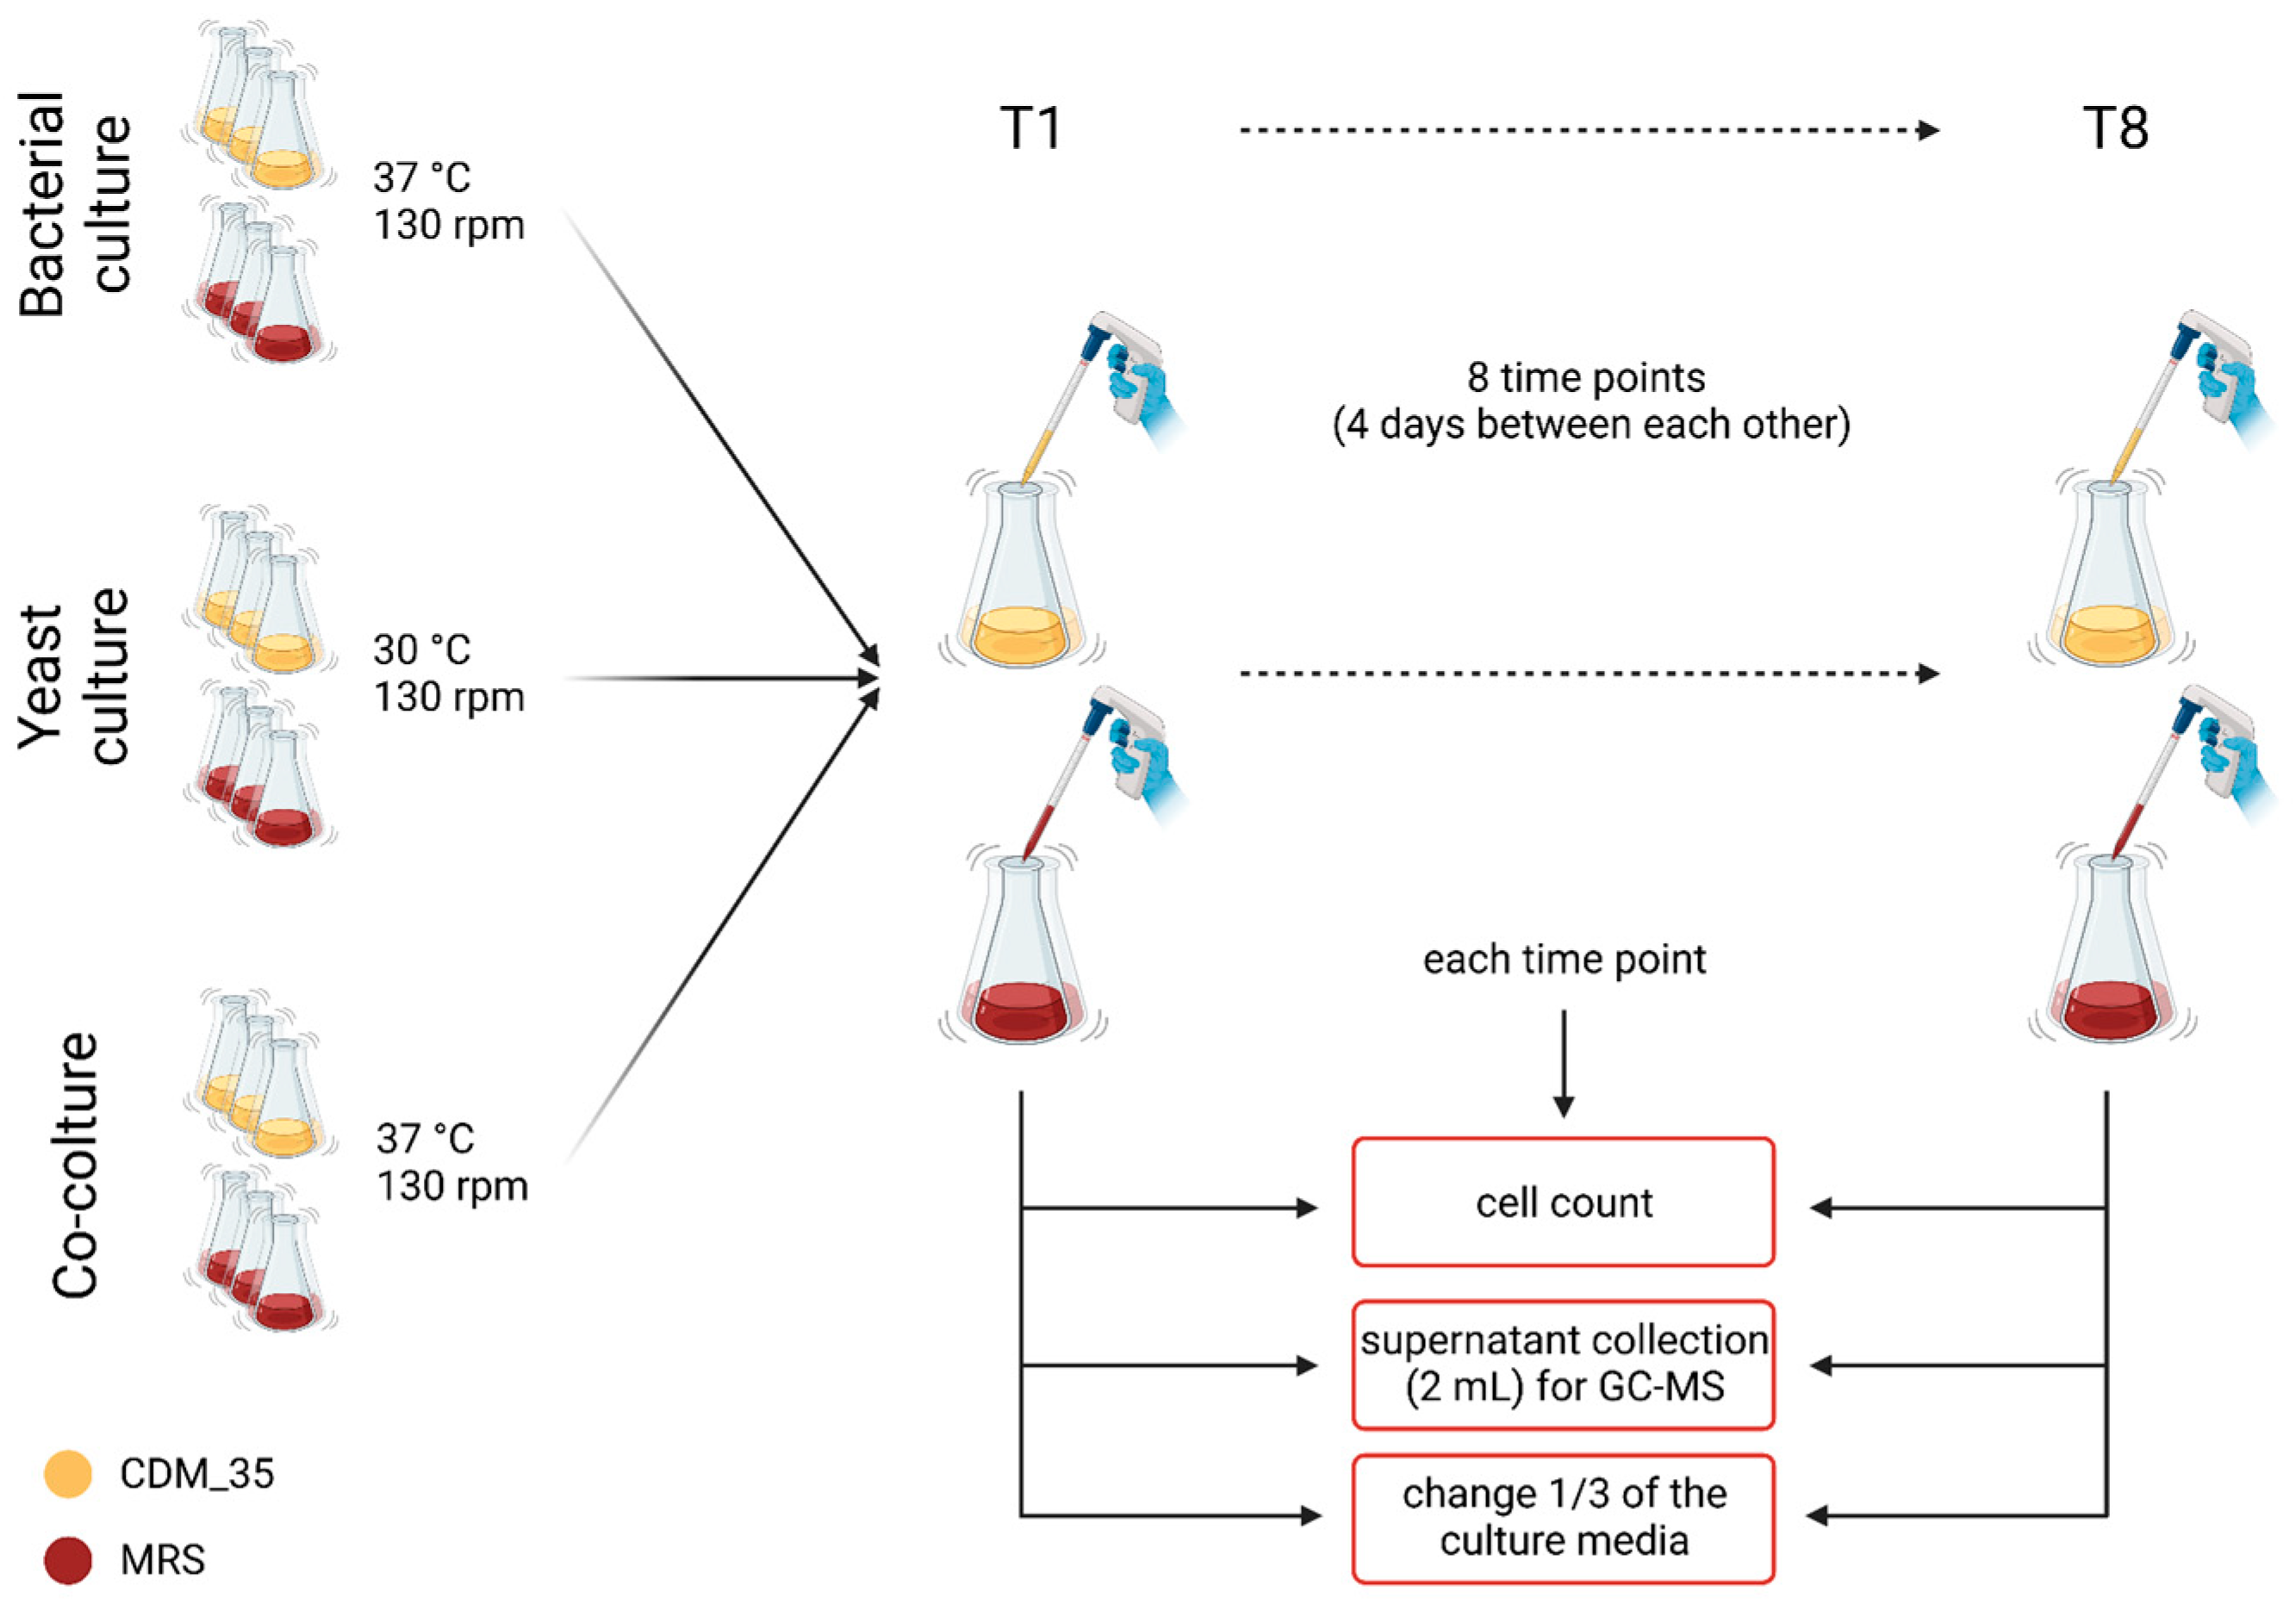
2.7. Cell Cultures

2.7.1. Co-Culture Setup

Given the similarity in growth dynamic occurring between KLB3L (S. cerevisiae) and KLB3B (L. rhamnosus) and the existing studies on co-cultivation of these two species [40], both strains were selected to analyze the differences between single cultures and co-cultures in terms of fatty acid production. The experiment setup (Figure 1) consisted of single cultures and co-cultures of KLB3L (S. cerevisiae) and KLB3B (L. rhamnosus) in two different culture media selective for lactobacilli growth: MRS + L-cysteine 0.05% and CDM35, which is a chemically defined medium that was previously used and validated [2] for the co-culture of yeasts and lactobacilli. CDM35 is easily degradable after a few days, so we chose to substitute one-third of the medium after 4 days to ensure that the correct amount of nutrition substrates was available to the cells. To preserve the reproducibility of the conditions, we followed the same protocol for the MRS cultures too. The growths were conducted for 4 weeks at 30 °C, during which 2 mL samples of the cultures’ supernatants were collected at 8 separate time points (before each substitution of the medium) and conserved at −80 °C before being analyzed with a gas chromatography–mass spectrometry system (GC-MS). Moreover, growth curves were performed by reading the optical density at 600 nm with the Infinite 200 PRO (Tecan) instrument at the beginning of each week to check the mortality rate of the cells. The growths were conducted for 4 weeks at 30 °C, after which the supernatants were collected and conserved at −80 °C before being analyzed using GC-MS. Single cultures and co-cultures were prepared starting from the single isolated strains in a concentration of 106 cells/mL for yeasts and 107 cells/mL for bacteria. In co-cultures, the yeast-to-bacteria ratio was 1:10, and all the conditions were set up in triplicate.

2.7.2. Cell Counts

The trends of cell growth in both co-cultures and single cultures were determined by cell counting with a Burker chamber, using the standard microbial counting protocol. Each culture was counted twice a week, for a total minimum of six time points.

2.7.3. Lab Media Growth of the Kefir Community

The growth of the whole kefir community was conducted in three different media commonly used for microbial cultivation in vitro: YPD, LB, and MRS + L-cysteine 0.05%. Then, 100 μL of resuspended kefir was inoculated in each of the three replicates of the selected liquid media. The growths were conducted for 4 weeks at 30 °C, in triplicates, after which the supernatants were collected and conserved at −80 °C before being analyzed using GC-MS.

2.8. Chemical Analysis

2.8.1. Chemicals

Methanol and tert-butyl methyl ether (MTBE, Chromasolv grade), sodium bicarbonate, sodium chloride and hydrochloric acid (Reagent grade), [2H3]acetic, [2H5]propionic, [2H7]iso-butyric, [2H9]iso-valeric (used as internal standards or ISTDs), acetic, propionic, butyric, iso-butyric, valeric, iso-valeric, 2-methylbutyric, hexanoic, heptanoic, octanoic, and nonanoic acids (analytical standards grade) were purchased by Sigma-Aldrich (Milan, Italy). MilliQ water 18 MΩ cm was obtained from Millipore’s Simplicity system (Milan, Italy). Ionic FFAs’ signals and reference internal standards are shown in Supplementary Material, Table S1.

2.8.2. Fatty Acids Quantification

The qualitative and quantitative evaluation of short, medium, and long fatty acids (free fatty acids, FFAs) was performed by using an isotopic dilution (ID) GC-MS method that assures the sensitivity, specificity, and reliability of the determination of FFAs in complex matrices by using a low-resolution instrument that is normally present in most research laboratories. The ID/GC-MS analyses were carried out using an Agilent GC-MS system with a 5971 5973 single quadrupole mass spectrometer, a 5890 gas-chromatograph, and a 7673 autosampler, through our previously described ID/GC-MS method [41]. Further information is reported in the Supplementary Materials. The FFAs were extracted as follows: an aliquot of 2 mL of culture medium sample was added to 50 μL of ISTD mixture, 1 mL of MTBE, and 100 μL of 6 M HCl + 0.5 M NaCl solution in a 2 mL centrifuge tube. Afterward, each tube was stirred in a vortex for 2 min and centrifuged at 10,000 rpm for 5 min; finally, the solvent layer was transferred into an autosampler vial and analyzed.

2.9. Culture Data Analysis

For the analysis of fatty acid concentrations measured during 8 time points in single and co-culture, in both CDM35 and MRS, the data were managed using Microsoft Office Excel 16.5, Graphpad Prism 9.5, and R software 4.3.1. The fatty acid values of the controls (media without cells) were subtracted from the concentration values of the fatty acids measured in the three different cultures during the respective 8-time intervals. In order to test the significant difference between the fatty acid production in a single culture and the same in a co-culture, we performed a two-way ANOVA test, and p < 0.05 was considered to be the statistically significant threshold. Growth patterns were visually explored using R’s ggplot2 package. Here, a linear regression curve was calculated (using the stats package) and added to the plots [42].

3. Results

3.1. Metabarcoding of Kefir Samples

Three independent kefir samples were extracted and sequenced. Results are shown in Figure 2. The analysis of the bacterial component, performed using targeted metagenomics of the 16S V3-V4 region, showed how 98,49% of the reads belonged to the Lactobacillus genus, while the remaining 1.5% was represented by Limosilactobacillus (0.984%), Bifidobacterium (0.377%), Streptococcus (0.14%), and Ketobacter (0.0058%). This type of analysis does not allow for us to obtain significant information below the genus level; thus, strain-level data were derived from culture-based approaches. The analysis of the ITS1 region in kefir samples showed a large number of reads (99,973%) belonging to the Saccharomyces genus. A total of 0.0155% of the reads were assigned to Debaryomyces, and the remaining reads were assigned to an unclassified genus of the Psathyrellaceae family, Typhula, and Psathyrella.
The complete results of the metabarcoding analyses are shown in Supplementary Materials Table S2.

3.2. Strain Isolation and Sequencing

After aerobic and anaerobic isolation on solid media (see Section 2 for additional details), nine yeast strains and five bacterial strains were selected based on their morphological features. Then, after sequencing and bioinformatic analyses, a species-level taxonomic assignment for each strain was assessed (results from BLAST depicted in Table 1 and Table 2). The taxonomic assignment from the BLAST algorithm highlighted the presence of strains belonging to two yeast species, Saccharomyces cerevisiae and Pichia kudriavzevii; and three bacterial species, Lacticaseibacillus rhamnosus, Limosilactobacillus fermentum, and Lactobacillus helveticus.

3.3. Physiological Characterization

Growth curves of isolated strains were made to test their viability in different conditions in terms of temperature, carbon source, and pH, in order to figure out the adaptive abilities of the selected bacterial and yeast strains to the human gastric and intestinal tracts (see description in Section 2). All the yeast strains showed standard growth dynamics at 30 °C (which is the standard temperature for the growth of these yeast strains where not otherwise specified), 37 °C, and pH 4.5 (Supplementary Materials Figure S1), reaching an asymptote between 1.2 and 1.4 in the absorbance scale. On the contrary, some differences among yeast species were displayed in the other conditions (Supplementary Materials Figure S2). All the P. kudriavzevii strains managed to grow in all four conditions: sucrose, lactic acid, and lactose as carbon sources at pH 2.5. KEA1 proved to have the fastest growth rate in each condition and also reached the highest final absorbance value at pH 2.5. S. cerevisiae strains showed more difficulties in these four conditions: the only one that allowed all the strains to grow was sucrose, although with different outcomes, whereas in the other three conditions, there was no visible growth for all the strains except for KEA2. It is noticeable that the KEA2 strain was able to grow in lactose, despite the natural absence of the lactase enzyme in S. cerevisiae.
Concerning the bacterial strains, growth curves were made in eight different conditions at 37 °C (where not otherwise specified), showing several differences in both inter- and intra-species (Supplementary Materials Figure S3). For example, L. fermentum and L. helveticus display a similar growth pattern in the tested conditions, while L. rhamnosus differs from the others. The two L. fermentum strains reached the highest asymptote at 1.4 (in terms of absorbance) in the two temperatures tested (30 °C and 37 °C) with glucose. All of the strains showed a growth near the baseline in lactic acid as a carbon source at pH 2.5. Interestingly, the KLB3B strain showed a growth near the baseline in almost all conditions, except for glucose at pH 2.5, where it reached an absorbance level of 0.8 and 0.6 respectively, which are the lower values of all the analyzed strains. Moreover, lactose as a carbon source caused a prolonged lag phase in the KLB3B growth curve.

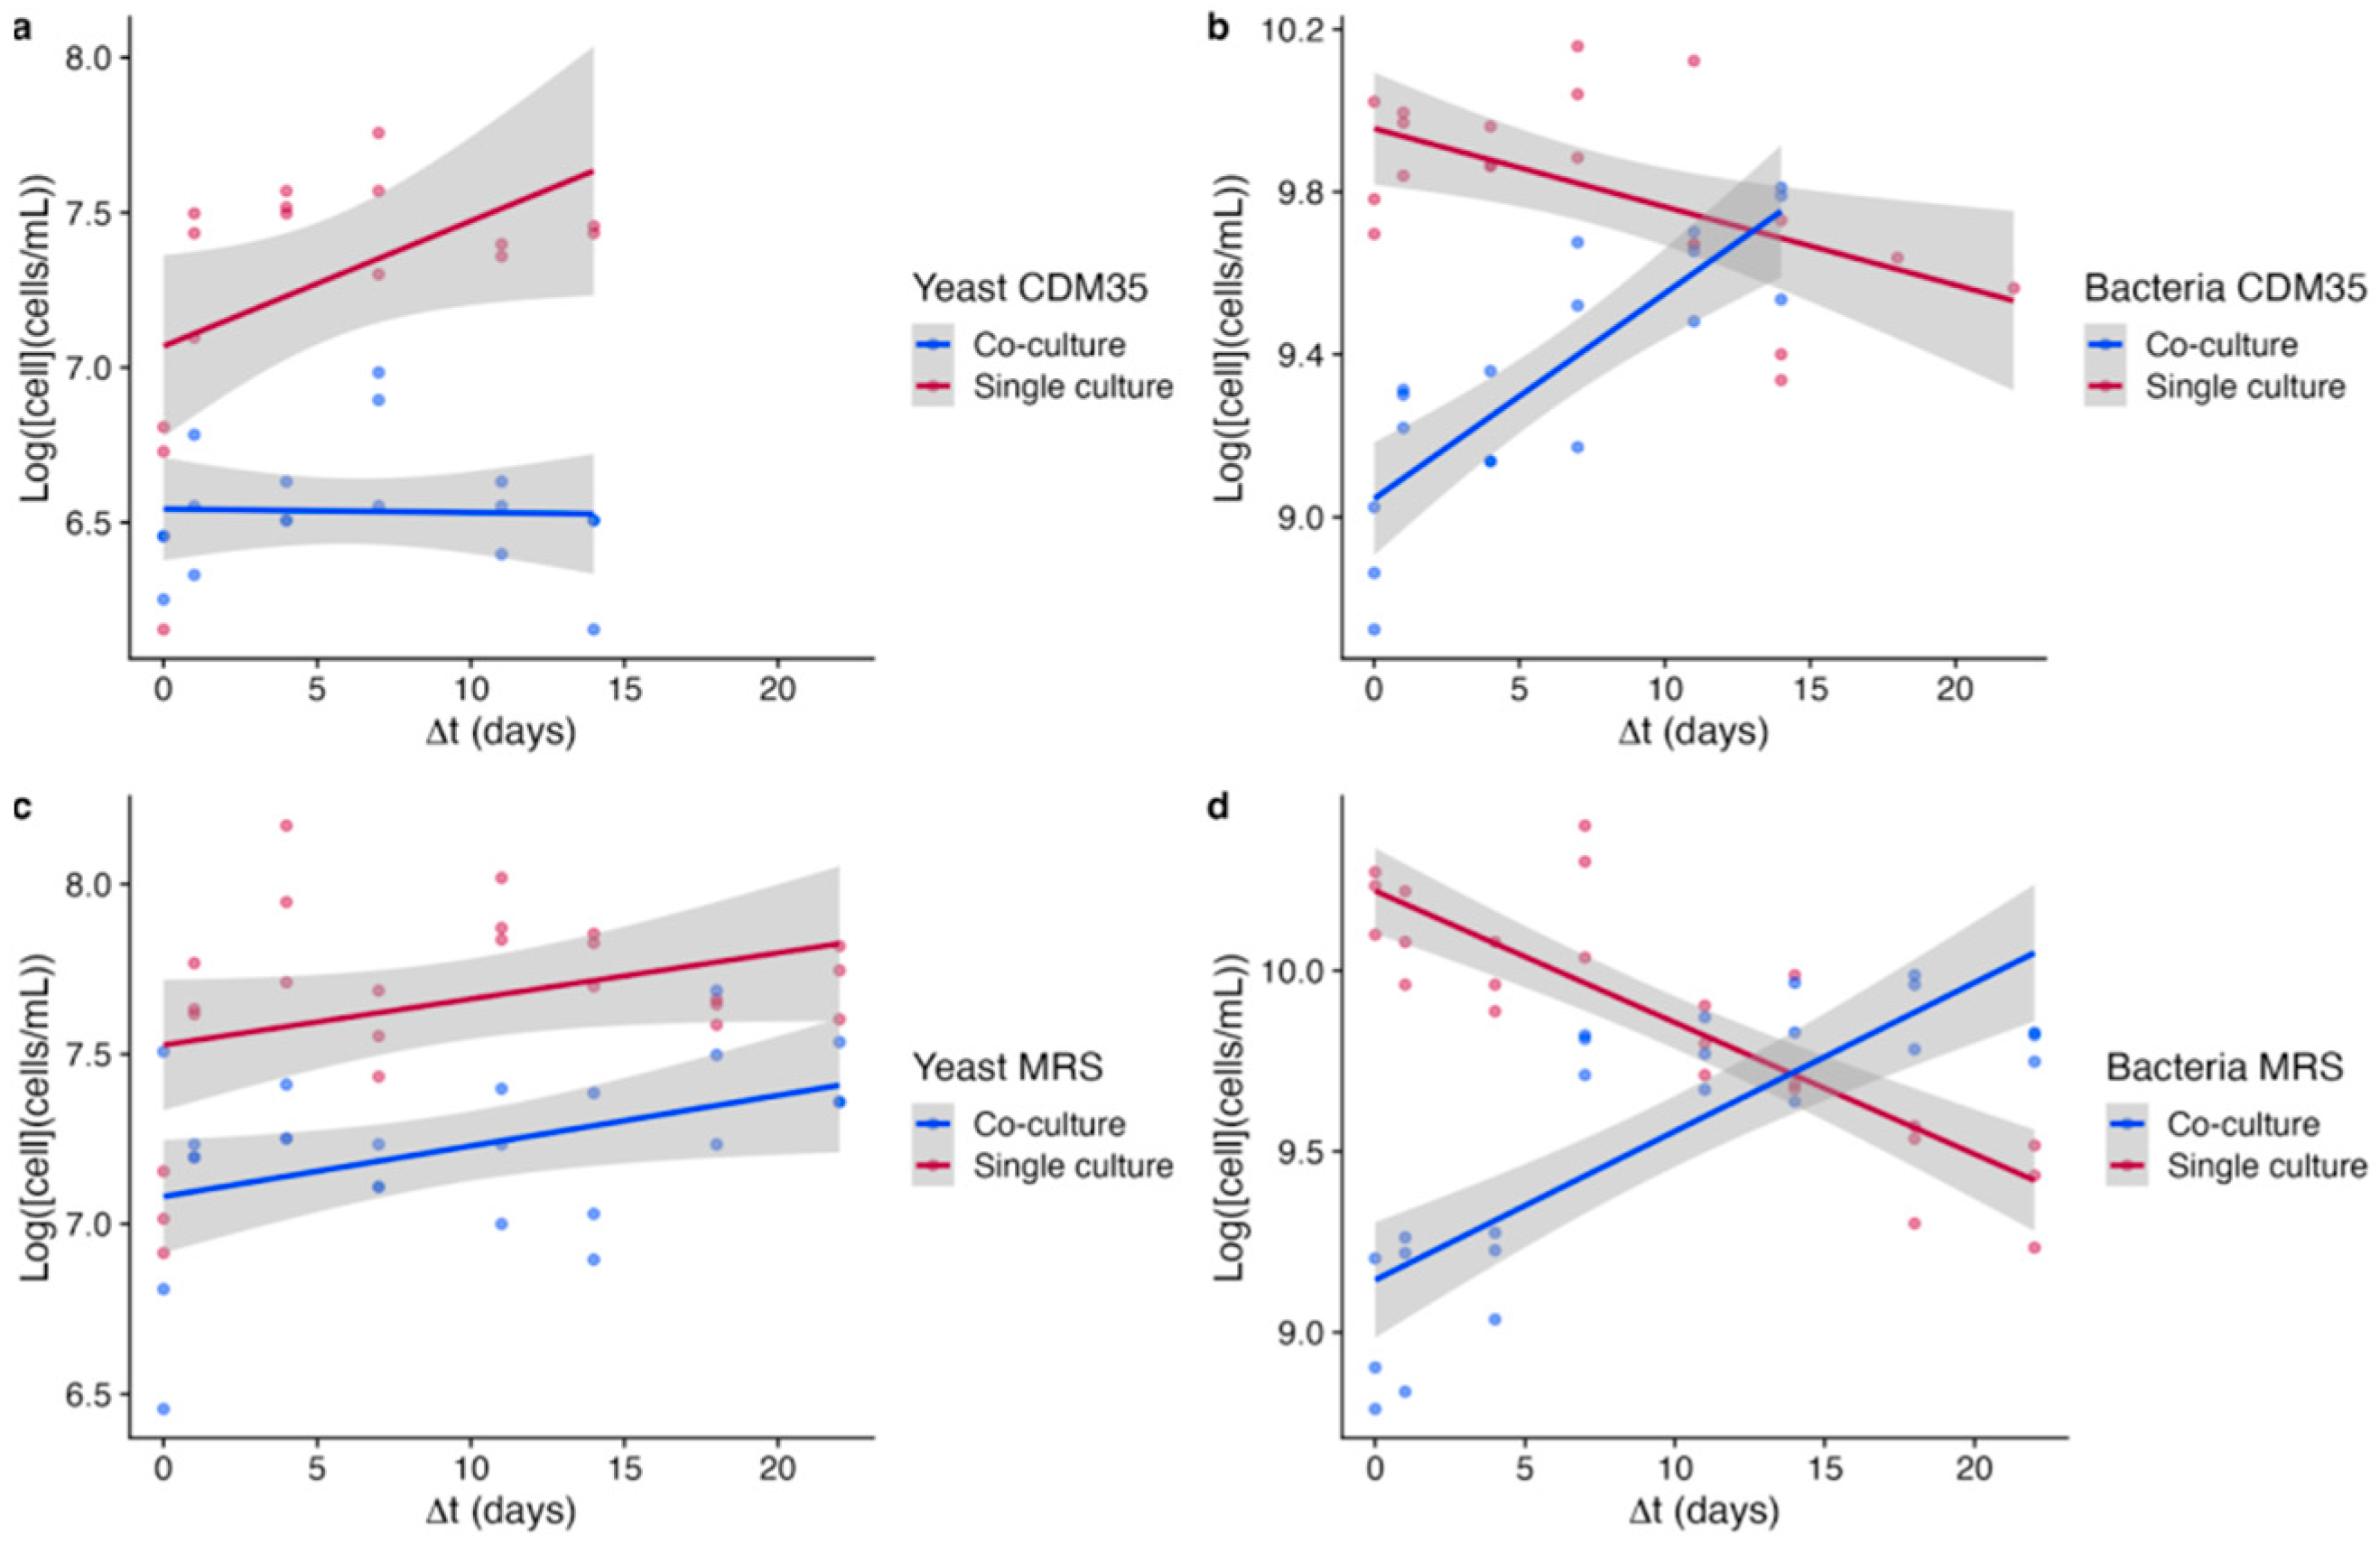
3.4. Dynamics of Cell Growths

The curve trends suggest that yeasts did not benefit from the interaction with bacteria (Figure 3a,c), especially in CDM35, where the trend of yeast growth in co-culture is even negative. In contrast, bacteria largely benefited from the interaction with yeast regardless of the medium used (Figure 3b,d). In fact, our results suggest that yeast plays an important role in bacterial survival.

3.5. GC-MS Analysis

3.5.1. Fatty Acids Production in Rich Media by the Kefir Community

We conducted a one-month culture of a small kefir aliquot in rich laboratory media to assess the total production of fatty acids (short, medium, and long chains). The results are shown in Supplementary Materials Figure S4. There were noticeable reductions in the concentrations of hexanoic, octanoic, and decanoic acids, which are used during the microbial catabolism, compared to media alone. Moreover, there was also an increase in the production of phenylalanine, a common product of peptidic digestion. Regarding short-chain fatty acids (SCFAs), the co-cultures showed an increase in the production of butyric, isobutyric, isovaleric, and 2-methylbutyric acids.

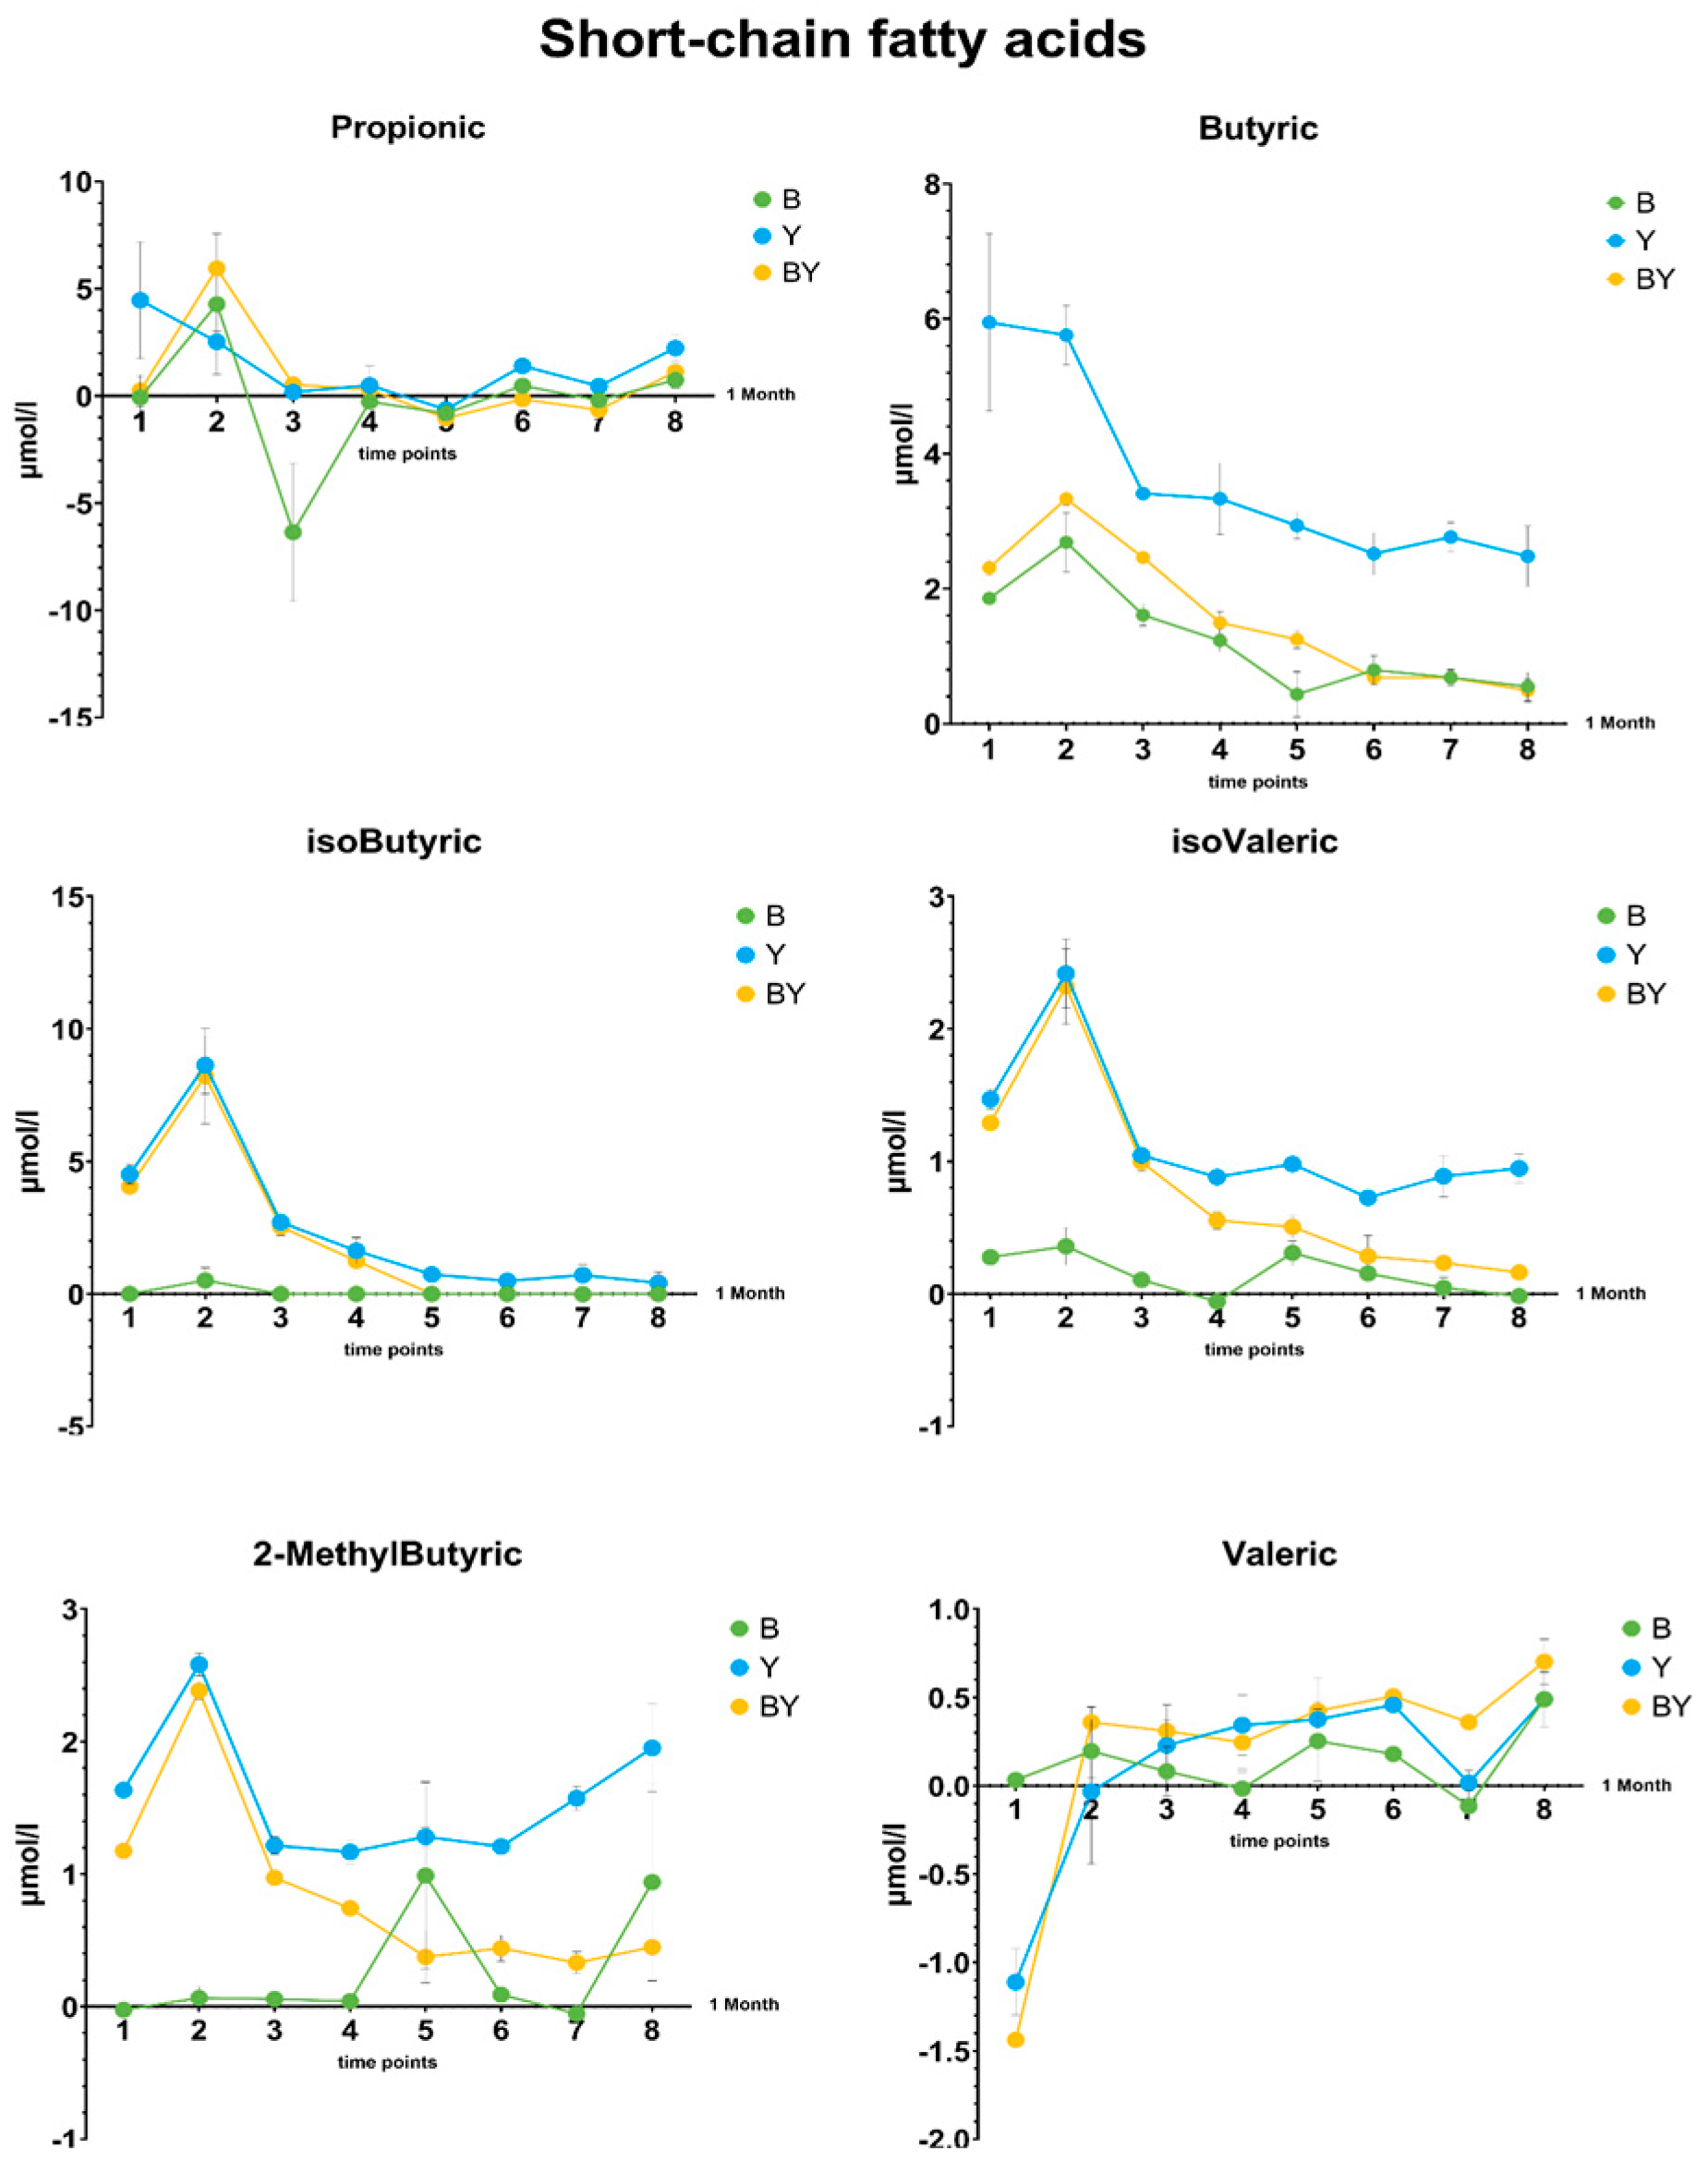
3.5.2. Differences in Short-Chain Fatty Acid Production between Single and Co-Cultures in Selective Media

Differences in short-chain fatty acid production during the 8 time points by single and co-cultures of KBL3B and KBL3L in CDM35 are displayed in Figure 4 as line charts (with means and SDs). Line charts and box plots of all the fatty acids produced by the strains in both CDM35 and MRS, as well as statistical analyses, are available in Supplementary Materials Figures S5–S8 and Table S3. The culture type (bacterial, yeast, or co-culture, named “Treatment” in Figure 4) was shown to be a factor that significantly influenced the differences in the production of all the SCFAs, except for propionic and valeric acid. It can be seen that there is a generally higher production of fatty acids in the yeast single cultures. The production of 2-methylbutyric and isovaleric acid was higher in yeast single cultures than in co-cultures, and, for these molecules, co-cultures also demonstrated significantly higher concentrations than bacterial single cultures.

4. Discussion

Gut microbiota exerts protective and metabolic functions, directly participating in the absorption processes of otherwise indigestible compounds for human beings, as well as in immune system modulation and protection against pathogens [43]. Therefore, the scientific community has given a great deal of attention to host health impairments associated with alterations in microbiota composition. On the contrary, the study of interactions amongst microorganisms that colonize the gut environment has not gained much interest, except for antagonistic or synergistic relationships between commensals and pathogens that have a direct impact on infections [1]. The host health state depends on connections that exist between the whole gut community, including those that involve the only beneficial members, since they affect the stability of the entire microbiota [3,44]. The gut microbiome includes species introduced through diet, especially the consumption of fermented and probiotic foods. In a large part of the cases, these microorganisms lack the physiological and biochemical properties that would allow them to become a stable member of the gut community, but their presence in the transient microbiota is now largely reported [45]. Some yeasts, such as S. cerevisiae, are known to contribute to the gut microbiome if introduced through diet [46], becoming colonizers only in disease conditions [47]. Therefore, fermented beverages such as kefir represent an important resource of bacterial and yeast cells with potential benefits for the human gut and a potential source of novel probiotic strains. This study focused on the isolation and characterization of kefir-derived microorganisms, as well as exploring the interplay that could occur between them.
We started by analyzing a milk-based beverage produced with the backslopping method, using kefir grains from the Cluj region in Romania. The results of the metagenomic analyses (Figure 2) showed a clear dominance of the Saccharomyces genus for yeasts and the Lactobacillus genus for bacteria. Following the metagenomics analysis, we isolated bacteria and yeast strains, screening them through aerobic and anaerobic selection on solid media, optical microscopy, and PCR-based methods. After that, Sanger sequencing and the following bioinformatic analysis allowed us to perform species-level taxonomic assignment for all strains, which comprised Saccharomyces cerevisiae and Pichia kudriavzevii (for yeast); and Lacticaseibacillus rhamnosus, Limosilactobacillus fermentum, and Lactobacillus helveticus (for bacteria). To understand the adaptation dynamics of selected strains to the human gastrointestinal tract, we performed 24-h growth assays, using human stomach- and gut-related conditions for temperature, pH, and carbon sources. Notably, one S. cerevisiae strain showed a growth in lactose comparable to the one in glucose as a carbon source, despite this species being naturally unable to metabolize lactose. Similar strains had previously been reported as having been isolated from kefir [5], suggesting that kefir could be a potential source of S. cerevisiae strains with peculiar traits. Bacterial strains showed differences in both intra- and inter-species, and one of the L. rhamnosus strains (KLB3B) gained our attention by displaying slow or absent growth in almost all conditions. This feature led us to choose that strain so that we could test its ability to grow together with an S. cerevisiae strain (KLB3L) and its production of fatty acids in both single and co-cultures. Based on these results, among all species, we paid particular attention to the dynamics within a co-culture of the two selected strains belonging to the Saccharomyces and Lactobacillus genera, which, besides our specific isolation source, are both commonly found in a large number of fermented foods, including kefir, wine, bread, and cheese, as well as commercial probiotics [4,5,12,48]. During a one-month growth, eight time points (one every 3–4 days) were chosen to collect supernatants of both single and co-culture for fatty acid production analyses with GC-MS and to count cells to determine strain fitness. Speaking of the latter, cell counts displayed opposite trends between bacteria and yeast (Figure 3): the yeast strain did not benefit from the co-culture, because its growth trends were either equal to the single culture (in the rich medium MRS) or even worse than that (in the chemically defined medium CDM35). On the contrary, bacterial growth showed a decreasing trend in single cultures and an increasing one in co-cultures (both in CDM35 and in MRS). This evidence suggests that the bacterial fitness benefits from the co-cultures with the S. cerevisiae strain independently from substrate availability. Regarding fatty acid production, GC-MS analyses showed significant differences between single and co-culture. In the chemically defined medium, where it is possible to know the exact amount of the starting compounds, the general trend was that of a higher production of fatty acids by yeast cells rather than bacteria, as might be expected. Finally, we focused our analysis on the production of SCFAs, due to the beneficial potential of these compounds on human gastrointestinal health. Butyric acid is well known for the exertion of anti-inflammatory and antitumoral effects, whereas isovaleric and 2-methylbutyric acids (which are two isomeric forms of the 5-C fatty acid) have been shown to possess immunomodulatory properties in several studies [49,50]. The statistical analysis on the influence of both time and treatment on SCFAs’ production revealed that the type of culture (“treatment”) is a statistically significant factor for every SCFA, except for propionic and valeric acid. The time showed to be a statistically significant factor for every SCFA production, and it is noticeable that, for the majority of them (with the same exception of propionic and valeric acid), the production peaks were registered within the first week of culture. This result raises questions about the long-term dynamics of microbial communities, since they seem to reduce their fatty acid production over time, despite a stable number of cells and organic substrates. Aside from the single factors, the absolute production of SCFAs resulted in being far lower compared to that of the small aliquot of kefir (Supplementary Figure S4). Thus, it seems clear that, despite being isolated from a kefir batch, the co-culture resulting from a single strain of yeast and a single strain of Lactobacillus is not sufficient to produce the synergistic effect in terms of SCFAs’ production that has been shown by the complex community within the kefir grains. Despite that, the study of single co-culture in vitro remains crucial to understanding the dynamics of the growth of microorganisms, as well as the changes in metabolic and molecular processes. Another important aspect of the study of microbial dynamics is the choice of the culture conditions and, more specifically, the growth media. While rich media like MRS offer abundant nutrients that support the robust growth of both lactobacilli and yeasts, they are less ideal for metabolic analyses due to the challenge of distinguishing the production of specific compounds, such as fatty acids, from those already present in the media. Therefore, we used rich media (MRS, YPD, and LB) for the growth of kefir aliquots during a month of co-culture, and then we performed a more controlled experiment using a chemically defined medium in order to manage each nutrient supplementation. This second experiment allowed us to follow the co-culture dynamics and, at the same time, precisely assess the differences in the production of fatty acids without the interference of all the components of a rich medium. Thus, we can conclude that the choice of co-culture medium strongly depends on the subsequent analysis that has to be performed; MRS is a perfectly suitable rich media for studying the growth of a co-culture in the absence of competition for nutrients, whereas we can confirm that CDM_35 is a chemically defined medium that allows for the precise quantification of the metabolites without negatively affecting the growth.
Altogether, our findings demonstrated that Lactobacillus rhamnosus, a common bacterium in fermented beverages like kefir, benefits from the presence of the yeast Saccharomyces cerevisiae, especially in terms of its growth. In contrast, the yeast is either unaffected or negatively impacted by the presence of bacteria. Furthermore, our study revealed intriguing results regarding short-chain fatty acids (SCFAs). While SCFAs were notably abundant in a one-month culture of the kefir community in laboratory media in vitro, the same outcome was not observed in a co-culture of yeast and Lactobacillus isolated from the same batch. SCFAs were produced more in yeast single cultures than in bacterial single and co-cultures. This suggests that yeast may employ SCFAs as a means of communication with other species in its environment, potentially explaining the decrease in SCFA concentration in the co-culture due to the bacterial uptake of these metabolites from the media. The lower expression of SCFAs in bacterial single cultures supports this hypothesis, along with the observation that bacteria benefit from the presence of yeast for their own growth.

5. Conclusions

This research offers insights into the cooperative behaviors of the microbial communities in kefir. Nevertheless, our results underscore the still-limited understanding of interactions between yeasts and bacteria, not only due to insufficient technologies for the simulation and study of a complex microbial community but also to the need for optimization in choosing the best culture conditions to analyze complex microbial metabolic dynamics. The findings highlight the potential for exploring the microbial diversity of kefir to select strains that are capable of producing metabolites relevant to human health, with a focus on community-level effects rather than individual strains. Overall, the dynamic interactions described in this study and other kefir studies emphasize the critical need for a deeper understanding of the ecological mechanisms governing interactions between yeast, bacteria, and mammalian cells.

Supplementary Materials

The following supporting information can be downloaded at: https://www.mdpi.com/article/10.3390/fermentation9110933/s1, Table S1: Ionic FFAs’ signals and reference internal standards used for the quantitation of each FFAs; Figure S1: Growth curves for each yeast strain together with standard deviations; Figure S2: Line chart depicting the growth rate of yeast strains; Figure S3: Line chart depicting the growth rate of yeast strains; Figure S4: SCFA analysis of kefir community in 3 different laboratory media; Table S2: Statistical analyses on short-chain fatty acids; Table S3: Statistical analyses on short-chain fatty acids; Figure S5: Fatty acids production represented as line charts by yeast and bacteria co-cultures compared to single cultures in CMD_35; Figure S6: Fatty acids production represented as box plots by yeast and bacteria co-cultures compared to single cultures in CDM_35; Figure S7: Fatty acids production represented as line charts by yeast and bacteria co-cultures compared to single cultures in MRS; Figure S8: Fatty acids production represented as box plots by yeast and bacteria co-cultures compared to single cultures in CDM_35.

Author Contributions

Conceptualization, S.N., A.R.-C., G.L.B. and D.C.; methodology, S.N., A.R.-C., M.P., G.L.B. and D.C.; validation, S.N., B.C. and N.M.; formal analysis, S.N., A.R.-C., M.P., A.G., B.C., S.R. and A.D.; investigation, S.N., A.R.-C., M.P., B.C. and S.R.; resources, G.L.B. and D.C.; data curation, S.N. and A.R.-C.; writing—original draft preparation, S.N., A.R.-C., M.P., A.G. and S.R.; writing—review and editing, N.M., G.L.B. and D.C.; visualization, S.N., A.R.-C. and A.G.; supervision, G.L.B. and D.C.; project administration, S.N. and D.C.; funding acquisition, G.L.B. and D.C. All authors have read and agreed to the published version of the manuscript.

Funding

This work was supported by Regione Toscana—Bando Salute 2018 RISKCROHNBIOM project (grant number G84I18000160002); and by the Italian Ministry of Agriculture, Food, and Forestry Policies (MiPAAF), within the trans-national project INTIMIC–Knowledge Platform on food, diet, and intestinal microbiomics. The funders had no role in the study design, data collection, and interpretation; or the decision to submit the work for publication.

Data Availability Statement

The Sanger sequences described in this work were deposited in GenBank, under the accession numbers OP681672-OP681680 and OP683217-OP683221. The raw reads of the metagenomic analysis described in this work were deposited in the “Sequence Read Archive” (SRA), under the accession PRJNA892524.

Acknowledgments

This work is dedicated to the memory of Fabio Picchi (Cibreo and CiBio) who heartfully supported this project and recently passed away.

Conflicts of Interest

The authors declare no conflict of interest.

References

  1. Kruger, S.; Ilmer, M.; Kobold, S.; Cadilha, B.L.; Endres, S.; Ormanns, S.; Schuebbe, G.; Renz, B.W.; D’Haese, J.G.; Schloesser, H.; et al. Advances in Cancer Immunotherapy 2019—Latest Trends. J. Exp. Clin. Cancer Res. 2019, 38, 268. [Google Scholar] [CrossRef]
  2. Ponomarova, O.; Gabrielli, N.; Sévin, D.C.; Mülleder, M.; Zirngibl, K.; Bulyha, K.; Andrejev, S.; Kafkia, E.; Typas, A.; Sauer, U.; et al. Yeast Creates a Niche for Symbiotic Lactic Acid Bacteria through Nitrogen Overflow. Cell Syst. 2017, 5, 345–357.e6. [Google Scholar] [CrossRef] [PubMed]
  3. Seth, E.C.; Taga, M.E. Nutrient Cross-Feeding in the Microbial World. Front. Microbiol. 2014, 5, 350. [Google Scholar] [CrossRef] [PubMed]
  4. Gobbetti, M.; Corsetti, A.; Rossi, J. The Sourdough Microflora. Interactions between Lactic Acid Bacteria and Yeasts: Metabolism of Amino Acids. World J. Microbiol. Biotechnol. 1994, 10, 275–279. [Google Scholar] [CrossRef] [PubMed]
  5. Qvirist, L.A.; De Filippo, C.; Strati, F.; Stefanini, I.; Sordo, M.; Andlid, T.; Felis, G.E.; Mattarelli, P.; Cavalieri, D. Isolation, Identification and Characterization of Yeasts from Fermented Goat Milk of the Yaghnob Valley in Tajikistan. Front. Microbiol. 2016, 7, 1690. [Google Scholar] [CrossRef]
  6. Kazou, M.; Grafakou, A.; Tsakalidou, E.; Georgalaki, M. Zooming into the Microbiota of Home-Made and Industrial Kefir Produced in Greece Using Classical Microbiological and Amplicon-Based Metagenomics Analyses. Front. Microbiol. 2021, 12, 621069. [Google Scholar] [CrossRef]
  7. Tenorio-Salgado, S.; Castelán-Sánchez, H.G.; Dávila-Ramos, S.; Huerta-Saquero, A.; Rodríguez-Morales, S.; Merino-Pérez, E.; Roa de la Fuente, L.F.; Solis-Pereira, S.E.; Pérez-Rueda, E.; Lizama-Uc, G. Metagenomic Analysis and Antimicrobial Activity of Two Fermented Milk Kefir Samples. MicrobiologyOpen 2021, 10, e1183. [Google Scholar] [CrossRef]
  8. Liu, S.; Lu, S.-Y.; Qureshi, N.; Enshasy, H.A.E.; Skory, C.D. Antibacterial Property and Metagenomic Analysis of Milk Kefir. Probiotics Antimicrob. Proteins 2022, 14, 1170–1183. [Google Scholar] [CrossRef]
  9. Kalamaki, M.S.; Angelidis, A.S. High-Throughput, Sequence-Based Analysis of the Microbiota of Greek Kefir Grains from Two Geographic Regions. Food Technol. Biotechnol. 2020, 58, 138–146. [Google Scholar] [CrossRef]
  10. Serafini, F.; Turroni, F.; Ruas-Madiedo, P.; Lugli, G.A.; Milani, C.; Duranti, S.; Zamboni, N.; Bottacini, F.; van Sinderen, D.; Margolles, A.; et al. Kefir Fermented Milk and Kefiran Promote Growth of Bifidobacterium Bifidum PRL2010 and Modulate Its Gene Expression. Int. J. Food Microbiol. 2014, 178, 50–59. [Google Scholar] [CrossRef]
  11. Plessas, S.; Nouska, C.; Mantzourani, I.; Kourkoutas, Y.; Alexopoulos, A.; Bezirtzoglou, E. Microbiological Exploration of Different Types of Kefir Grains. Fermentation 2017, 3, 1. [Google Scholar] [CrossRef]
  12. Bourrie, B.C.T.; Willing, B.P.; Cotter, P.D. The Microbiota and Health Promoting Characteristics of the Fermented Beverage Kefir. Front. Microbiol. 2016, 7, 647. [Google Scholar] [CrossRef]
  13. Cheirsilp, B.; Shoji, H.; Shimizu, H.; Shioya, S. Interactions between Lactobacillus Kefiranofaciens and Saccharomyces Cerevisiae in Mixed Culture for Kefiran Production. J. Biosci. Bioeng. 2003, 96, 279–284. [Google Scholar] [CrossRef]
  14. Farnworth, E.R.; Mainville, I. Kefir—A Fermented Milk Product; Routledge Handbooks Online: London, UK, 2008; ISBN 978-1-4200-5326-5. [Google Scholar]
  15. McSweeney, P.L.H.; McNamara, J.P. Encyclopedia of Dairy Sciences, 3rd ed.; Elsevier: Amsterdam, The Netherlands, 2022; ISBN 978-0-12-818767-8. [Google Scholar]
  16. Rea, M.C.; Lennartsson, T.; Dillon, P.; Drinan, F.D.; Reville, W.J.; Heapes, M.; Cogan, T.M. Irish Kefir-like Grains: Their Structure, Microbial Composition and Fermentation Kinetics. J. Appl. Bacteriol. 1996, 81, 83–94. [Google Scholar] [CrossRef]
  17. Tamime, A. Fermented Milks: A Historical Food with Modern Applications–a Review. Eur. J. Clin. Nutr. 2002, 56, S2–S15. [Google Scholar] [CrossRef] [PubMed]
  18. Lopitz-Otsoa, F.; Rementeria, A.; Elguezabal, N.; Garaizar, J. Kefir: A Symbiotic Yeasts-Bacteria Community with Alleged Healthy Capabilities. Rev. Iberoam. Micol. 2006, 23, 67–74. [Google Scholar] [CrossRef]
  19. Markowiak, P.; Śliżewska, K. Effects of Probiotics, Prebiotics, and Synbiotics on Human Health. Nutrients 2017, 9, 1021. [Google Scholar] [CrossRef] [PubMed]
  20. Encyclopedia of Dairy Sciences—2nd Edition. Available online: https://shop.elsevier.com/books/encyclopedia-of-dairy-sciences/fuquay/978-0-12-374402-9 (accessed on 1 September 2023).
  21. Pessione, E. Lactic Acid Bacteria Contribution to Gut Microbiota Complexity: Lights and Shadows. Front. Cell. Infect. Microbiol. 2012, 2, 86. [Google Scholar] [CrossRef]
  22. Samuel, B.S.; Shaito, A.; Motoike, T.; Rey, F.E.; Backhed, F.; Manchester, J.K.; Hammer, R.E.; Williams, S.C.; Crowley, J.; Yanagisawa, M.; et al. Effects of the Gut Microbiota on Host Adiposity Are Modulated by the Short-Chain Fatty-Acid Binding G Protein-Coupled Receptor, Gpr41. Proc. Natl. Acad. Sci. USA 2008, 105, 16767–16772. [Google Scholar] [CrossRef]
  23. Matsuki, T.; Pédron, T.; Regnault, B.; Mulet, C.; Hara, T.; Sansonetti, P.J. Epithelial Cell Proliferation Arrest Induced by Lactate and Acetate from Lactobacillus Casei and Bifidobacterium Breve. PLoS ONE 2013, 8, e63053. [Google Scholar] [CrossRef]
  24. Martin-Gallausiaux, C.; Marinelli, L.; Blottière, H.M.; Larraufie, P.; Lapaque, N. SCFA: Mechanisms and Functional Importance in the Gut. Proc. Nutr. Soc. 2021, 80, 37–49. [Google Scholar] [CrossRef] [PubMed]
  25. Kaisar, M.M.M.; Pelgrom, L.R.; van der Ham, A.J.; Yazdanbakhsh, M.; Everts, B. Butyrate Conditions Human Dendritic Cells to Prime Type 1 Regulatory T Cells via Both Histone Deacetylase Inhibition and G Protein-Coupled Receptor 109A Signaling. Front. Immunol. 2017, 8, 1429. [Google Scholar] [CrossRef] [PubMed]
  26. Schulthess, J.; Pandey, S.; Capitani, M.; Rue-Albrecht, K.C.; Arnold, I.; Franchini, F.; Chomka, A.; Ilott, N.E.; Johnston, D.G.W.; Pires, E.; et al. The Short Chain Fatty Acid Butyrate Imprints an Antimicrobial Program in Macrophages. Immunity 2019, 50, 432–445.e7. [Google Scholar] [CrossRef] [PubMed]
  27. Alimolaei, M.; Golchin, M. An Efficient DNA Extraction Method for Lactobacillus Casei, a Difficult-to-Lyse Bacterium. Int. J. Enteric Pathog. 2016, 4, e32472. [Google Scholar] [CrossRef]
  28. Shaffer, J.P.; Carpenter, C.S.; Martino, C.; Salido, R.A.; Minich, J.J.; Bryant, M.; Sanders, K.; Schwartz, T.; Humphrey, G.; Swafford, A.D.; et al. A Comparison of Six DNA Extraction Protocols for 16S, ITS and Shotgun Metagenomic Sequencing of Microbial Communities. BioTechniques 2022, 73, 34–46. [Google Scholar] [CrossRef]
  29. Takahashi, S.; Tomita, J.; Nishioka, K.; Hisada, T.; Nishijima, M. Development of a Prokaryotic Universal Primer for Simultaneous Analysis of Bacteria and Archaea Using Next-Generation Sequencing. PLoS ONE 2014, 9, e105592. [Google Scholar] [CrossRef]
  30. White, T.J.; Bruns, T.; Lee, S.; Taylor, J. Amplification and Direct Sequencing of Fungal Ribosomal RNA Genes for Phylogenetics. In PCR Protocols; Elsevier: Amsterdam, The Netherlands, 1990; pp. 315–322. ISBN 978-0-12-372180-8. [Google Scholar]
  31. Bolyen, E.; Rideout, J.R.; Dillon, M.R.; Bokulich, N.A.; Abnet, C.C.; Al-Ghalith, G.A.; Alexander, H.; Alm, E.J.; Arumugam, M.; Asnicar, F.; et al. Reproducible, Interactive, Scalable and Extensible Microbiome Data Science Using QIIME 2. Nat. Biotechnol. 2019, 37, 852–857. [Google Scholar] [CrossRef] [PubMed]
  32. Martin, M. Cutadapt Removes Adapter Sequences from High-Throughput Sequencing Reads. EMBnet. J. 2011, 17, 10. [Google Scholar] [CrossRef]
  33. Callahan, B.J.; McMurdie, P.J.; Rosen, M.J.; Han, A.W.; Johnson, A.J.A.; Holmes, S.P. DADA2: High-Resolution Sample Inference from Illumina Amplicon Data. Nat. Methods 2016, 13, 581–583. [Google Scholar] [CrossRef]
  34. Robeson, M.S.; O’Rourke, D.R.; Kaehler, B.D.; Ziemski, M.; Dillon, M.R.; Foster, J.T.; Bokulich, N.A. RESCRIPt: Reproducible Sequence Taxonomy Reference Database Management. PLOS Comput. Biol. 2021, 17, e1009581. [Google Scholar] [CrossRef]
  35. Quast, C.; Pruesse, E.; Yilmaz, P.; Gerken, J.; Schweer, T.; Yarza, P.; Peplies, J.; Glöckner, F.O. The SILVA Ribosomal RNA Gene Database Project: Improved Data Processing and Web-Based Tools. Nucleic Acids Res. 2012, 41, D590–D596. [Google Scholar] [CrossRef]
  36. Kõljalg, U.; Larsson, K.-H.; Abarenkov, K.; Nilsson, R.H.; Alexander, I.J.; Eberhardt, U.; Erland, S.; Høiland, K.; Kjøller, R.; Larsson, E.; et al. UNITE: A Database Providing Web-Based Methods for the Molecular Identification of Ectomycorrhizal Fungi. New Phytol. 2005, 166, 1063–1068. [Google Scholar] [CrossRef] [PubMed]
  37. McMurdie, P.J.; Holmes, S. Phyloseq: An R Package for Reproducible Interactive Analysis and Graphics of Microbiome Census Data. PLoS ONE 2013, 8, e61217. [Google Scholar] [CrossRef]
  38. Oksanen, J.; Kindt, R.; Legendre, P.; O’Hara, B.; Stevens, M.H.H.; Oksanen, M.J.; Suggests, M.A.S.S. The vegan package. Community Ecol. Package 2007, 10, 719. [Google Scholar]
  39. Rainey, F.A.; Ward-Rainey, N.; Kroppenstedt, R.M.; Stackebrandt, E. The Genus Nocardiopsis Represents a Phylogenetically Coherent Taxon and a Distinct Actinomycete Lineage: Proposal of Nocardiopsaceae Fam. Nov. Int. J. Syst. Bacteriol. 1996, 46, 1088–1092. [Google Scholar] [CrossRef] [PubMed]
  40. Moens, F.; Duysburgh, C.; van den Abbeele, P.; Morera, M.; Marzorati, M. Lactobacillus Rhamnosus GG and Saccharomyces Cerevisiae Boulardii Exert Synergistic Antipathogenic Activity in Vitro against Enterotoxigenic Escherichia coli. Benef. Microbes 2019, 10, 923–935. [Google Scholar] [CrossRef]
  41. Niccolai, E.; Baldi, S.; Ricci, F.; Russo, E.; Nannini, G.; Menicatti, M.; Poli, G.; Taddei, A.; Bartolucci, G.; Calabrò, A.S.; et al. Evaluation and Comparison of Short Chain Fatty Acids Composition in Gut Diseases. World J. Gastroenterol. 2019, 25, 5543–5558. [Google Scholar] [CrossRef]
  42. Wickham, H. Ggplot2: Elegant Graphics for Data Analysis, 2nd ed.; Use R! Springer International Publishing: Cham, Switzerland, 2016; ISBN 978-3-319-24277-4. [Google Scholar]
  43. Browne, H.P.; Neville, B.A.; Forster, S.C.; Lawley, T.D. Transmission of the Gut Microbiota: Spreading of Health. Nat. Rev. Microbiol. 2017, 15, 531–543. [Google Scholar] [CrossRef]
  44. Lebeer, S.; Vanderleyden, J.; De Keersmaecker, S.C.J. Genes and Molecules of Lactobacilli Supporting Probiotic Action. Microbiol. Mol. Biol. Rev. 2008, 72, 728–764. [Google Scholar] [CrossRef]
  45. Rezac, S.; Kok, C.R.; Heermann, M.; Hutkins, R. Fermented Foods as a Dietary Source of Live Organisms. Front. Microbiol. 2018, 9, 1785. [Google Scholar] [CrossRef]
  46. Raimondi, S.; Amaretti, A.; Gozzoli, C.; Simone, M.; Righini, L.; Candeliere, F.; Brun, P.; Ardizzoni, A.; Colombari, B.; Paulone, S.; et al. Longitudinal Survey of Fungi in the Human Gut: ITS Profiling, Phenotyping, and Colonization. Front. Microbiol. 2019, 10, 1575. [Google Scholar] [CrossRef]
  47. Di Paola, M.; Rizzetto, L.; Stefanini, I.; Vitali, F.; Massi-Benedetti, C.; Tocci, N.; Romani, L.; Ramazzotti, M.; Lionetti, P.; De Filippo, C.; et al. Comparative Immunophenotyping of Saccharomyces Cerevisiae and Candida Spp. Strains from Crohn’s Disease Patients and Their Interactions with the Gut Microbiome. J. Transl. Autoimmun. 2020, 3, 100036. [Google Scholar] [CrossRef] [PubMed]
  48. Rinninella, E.; Raoul, P.; Cintoni, M.; Franceschi, F.; Miggiano, G.; Gasbarrini, A.; Mele, M. What Is the Healthy Gut Microbiota Composition? A Changing Ecosystem across Age, Environment, Diet, and Diseases. Microorganisms 2019, 7, 14. [Google Scholar] [CrossRef] [PubMed]
  49. Lian, W.-S.; Wang, F.-S.; Chen, Y.-S.; Tsai, M.-H.; Chao, H.-R.; Jahr, H.; Wu, R.-W.; Ko, J.-Y. Gut Microbiota Ecosystem Governance of Host Inflammation, Mitochondrial Respiration and Skeletal Homeostasis. Biomedicines 2022, 10, 860. [Google Scholar] [CrossRef] [PubMed]
  50. Almeida, C.V.D.; Camargo, M.R.d.; Russo, E.; Amedei, A. Role of Diet and Gut Microbiota on Colorectal Cancer Immunomodulation. World J. Gastroenterol. 2018, 25, 151–162. [Google Scholar] [CrossRef]
Figure 1. Schematic representation of yeast and bacteria co-cultures. The scheme represents the experimental setup of the single and co-cultures of bacteria and yeast both in the rich medium (MRS) and in the chemically defined medium (CDM35). During each time point (4 days between each one, from T1 to T8), cell growth was evaluated using the Burker chamber, and 2 mL of supernatant was collected for GC-MS analyses.
Fermentation 09 00933 g001
Figure 2. Taxonomy representation of kefir batch microbial composition. (A) Kefir bacterial composition at the genus level. (B) Kefir yeast composition at the genus level. Legends are displayed close to bar plots.
Fermentation 09 00933 g002
Figure 3. Linear regression model depicting the cell growth in single and co-culture conditions monitored on timescales. Graphs (a,b) represent the growth of yeast and bacteria in CDM35, respectively, whereas graphs (c,d) represent the growth of yeast and bacteria in MRS. Data were logarithmized and fit a linear model, using R’s Stats package. Cell concentration was reported on the y-axis, while time variation in days was reported on the x-axis.
Fermentation 09 00933 g003
Figure 4. Short-chain fatty acid production is represented as line charts by yeast and bacteria co-cultures compared to single cultures in CMD_35. The production of the six SCFAs is shown as concentrations (μmol/L) for each of the eight time points from the three different culture conditions (B, bacterial culture; Y, yeast culture; BY, co-culture) in CDM35. Concentration values of the media alone (CDM35) were subtracted from the value of each point. Line charts show means + SDs. Statistical analysis (two-way ANOVA) is shown in Supplementary Materials Table S3.
Fermentation 09 00933 g004
Table 1. BLAST results for sequenced ITS regions from yeast-isolated strains. Columns of the table show the features (query cover and percentage identity) of the top BLAST result for each sample (names of samples are written in the first column).
SampleSpeciesSeq. ID Gene BankQuery CoverPercentage IdentityQuery Length
KYP1Pichia kudriavzeviiMT539198.1100%100%430
KYP3Saccharomyces cerevisiaeCP006391.1100%99.25%804
KLB1Pichia kudriavzeviiMT539198.199%99.76%424
KLB3LSaccharomyces cerevisiaeCP006391.199%99.52%823
KRSAN1Saccharomyces cerevisiaeCP006391.1100%99.49%780
KEA1Pichia kudriavzeviiMT539198.1100%99.30%426
KEA2Saccharomyces cerevisiaeCP006391.199%99.51%823
KMRA1Pichia kudriavzeviiMT539198.199%99.76%424
KMRA2LSaccharomyces cerevisiaeCP006391.196%98.50%828
Table 2. BLAST results for sequenced 16S genes from bacterial isolated strains. Columns of the table show the features (query cover and percentage identity) of the top BLAST result for each sample (names of samples are written in the first column).
SampleSpeciesSeq. ID Gene BankQuery CoverPercentage IdentityQuery Length
KLB3BLacticaseibacillus rhamnosusCP053619.1100%99.93%1494
KMRA2BLimosilactobacillus fermentumCP047584.198%99.48%1494
KRSAN2Lactobacillus helveticusCP031018.199%99.47%1518
KRSAN3Limosilactobacillus fermentumCP047584.199%99.60%1522
KRSAN4Lacticaseibacillus rhamnosusCP053619.1100%99.67%1508
Disclaimer/Publisher’s Note: The statements, opinions and data contained in all publications are solely those of the individual author(s) and contributor(s) and not of MDPI and/or the editor(s). MDPI and/or the editor(s) disclaim responsibility for any injury to people or property resulting from any ideas, methods, instructions or products referred to in the content.

