Article

Evaluation of the Black Tea Taste Quality during Fermentation Process Using Image and Spectral Fusion Features

1
Tea Research Institute, Shandong Academy of Agricultural Sciences, Jinan 250033, China
2
Intelligent Equipment Research Center, Beijing Academy of Agriculture and Forestry Sciences, Beijing 100097, China
3
College of Engineering and Technology, Southwest University, Chongqing 400715, China
*
Authors to whom correspondence should be addressed.
Fermentation 2023, 9(10), 896; https://doi.org/10.3390/fermentation9100896
Submission received: 7 September 2023 / Revised: 28 September 2023 / Accepted: 28 September 2023 / Published: 7 October 2023
(This article belongs to the Section Fermentation for Food and Beverages)

Abstract

:
The rapid and intelligent evaluation of black tea taste quality during the fermentation process is an unsolved problem because of the complexity and hysteretic of the current taste evaluation method. Common infrared spectroscopy and machine vision technologies can rapidly evaluate the taste quality of black tea, but they can not obtain comprehensive sample information. To obtain comprehensive sample information and achieve the rapid evaluation of the taste quality of black tea, the fusion data from hyperspectral images of fermentation samples were applied to predict the taste quality. The successive projection algorithm (SPA) and ant colony optimization (ACO) were used to select effective bands for spectral data. Subsequently, the color images were synthesized using three carefully selected effective bands obtained through the SPA and ACO. The 18 image features were extracted from each synthesized color image and fused with spectral effective bands. The fusion data and three different algorithms, such as partial least squares regression (PLSR), support vector machine regression (SVR), and extreme learning machine (ELM), were employed to establish the regression model for taste quality. Specifically, the fusion-SPA-PLSR model exhibited the best performance. This study provides a novel method for the intelligent evaluation of taste quality during black tea fermentation and lays a theoretical foundation for the intelligent processing and control of black tea.

1. Introduction

Black tea is renowned for its appealing flavor. Consumers place great importance on the quality of black tea taste quality, as it is considered a major factor in evaluating its overall quality. Generally, the taste quality is related to the content of some major components of black tea, including soluble sugar, caffeine, catechins, and amino acids. Caffeine and catechins are considered to be the main components of the bitterness [1,2]. The amino acids present the umami taste of tea leaves, especially theanine [3,4]. The soluble sugar produces the sweet and mellow taste of the finished tea [5]. Remarkably, the complicated manufacturing craft is a crucial factor in forming the appealing flavor of black tea, especially in the fermentation process. From a biochemical perspective, catechins undergo significant oxidation–reduction reactions, leading to the formation of tea pigments and various volatile aromatic compounds. Additionally, during the fermentation process, several crucial components relating to the taste of finished tea, including caffeine, catechins, amino acids, and tea polyphenols, undergo significant changes [2]. Therefore, fermentation is regarded as a crucial step in developing the appealing taste of black tea. Moreover, the mellow taste of black tea emerges from the intricate interplay of several key chemical components, and consumers might not be able to distinguish it in their taste evaluation. Consequently, during black tea fermentation, the control and assessment of taste quality become essential tasks.
Generally, the assessment of black tea’s taste quality relies on professional tea experts [6]. In addition, this evaluation method exhibits strong subjectivity and is easily influenced by some external factors, i.e., weather, mood, and the experience of tea experts. Consequently, the results often lack objectivity and consistency. In contrast, many scholars accurately obtained some major components using some sophisticated instruments, i.e., HPLC and LC-MS [7,8]. While these methods can offer accurate detection results, they are complex and time-consuming. Hence, a convenient, rapid, and nondestructive detection strategy should be developed.
Some artificial intelligence methods and detection technologies were applied for the quantitative prediction of major components [9,10,11]. Among these technologies, infrared spectroscopy was utilized for the detection of tea pigments, catechins, caffeine, and tea polyphenols by leveraging the overtones of major functional groups [9,12,13]. Unfortunately, this technology is limited to obtaining partial sample information. In contrast, computer vision technology (CVS) offers a broader range of sample information acquisition [14]. However, the CVS could only capture the appearance information of tea samples, which display poor penetration ability. Consequently, both infrared spectroscopy technology and CVS have their respective limitations. Hyperspectral imaging technology allows simultaneous acquisition of both spectral and image information. Some researchers have successfully achieved the visualization of some components based on hyperspectral image information [2,15]. However, in most cases, only the spectral data are utilized for the construction of models, and the full potential of hyperspectral images remains untapped. In our previous studies, we have successfully explored the hyperspectral images of tea samples to accurately evaluate the black tea fermentation degree [16]. While this study successfully obtained a relatively comprehensive set of sample information, it did not encompass the sensory information that consumers typically prioritize. Furthermore, some sensory qualities, such as aroma quality [17], overall sensory quality [18], and bitterness and astringency scores [19], have been successfully evaluated. Notably, only a limited number of studies focused on evaluating the black tea taste quality during tea processing, with particular emphasis on the fermentation process.
In this study, we aimed to acquire comprehensive sample information based on hyperspectral imaging technology and evaluated the taste quality using effective fusion information. The framework of this study was (1) to obtain the hyperspectral imaging of different fermentation samples, (2) to establish a taste score model using spectral data, (3) to select effective bands based on different feature selection algorithms, (4) to synthesize color images based on three selected bands and establish the taste score model using color and texture features, and (5) to establish a taste score model using fusion data, linear and nonlinear models.

2. Materials and Methods

2.1. Samples

A total of 25 kg fresh tea leaves of the ‘Mount Wuyi population species’ variety, comprising one bud and two leaves, were harvested on 6 May 2022. These leaves were carefully plucked and placed in a breathable box with ice bags for immediate transportation to the laboratory. Then, these fresh leaves were handled based on the black tea standard processing crafts (GB/T 35810–2018). When the rolling process was completed, these rolled leaves were accumulated in a fermentation room. The temperature and humidity were 30 °C and 90%, respectively. The fermentation experiments were carried out for 7 h. The 25 parallel samples were randomly collected every hour. Furthermore, 200 g leaves were dried every hour for a sensory evaluation experiment to acquire taste scores. The experimental framework is illustrated in Figure 1.

2.2. Sensory Evaluation of Black Tea Taste Quality

The sensory evaluation was carried out by 5 professional tea tasters based on the standard evaluation method (GB/T 23776–2018). Subsequently, all the taste scores from these tea tasters were recorded and averaged to obtain the final taste scores for each fermentation time.

2.3. Acquisition of Hyperspectral Images

To obtain more comprehensive sample information, all collected fermentation samples were scanned for hyperspectral images. The details of the hyperspectral imaging system can be found in the supplementary materials, and it obtained sample information in the range of 400–1000 nm through line scanning. After our repeated experiments, the advance speed and resolution of the conveyor system and hyperspectral images were 2.8 mm/s and 1632 × 2562 pixels, respectively. The camera captured hyperspectral images with an exposure time of 4.2 ms. Before collecting sample hyperspectral images at each fermentation moment, the white reference and dark current were acquired. When these parameters were determined, 200 g fermentation leaves were laid flat on the precision conveying device so that they maintain consistency for obtaining hyperspectral images. Subsequently, each collected fermentation sample was scanned with hyperspectral images. To eliminate the influence of the dark current in the CCD camera and the spatial light intensity conversion in the halogen lamp, these hyperspectral images needed to be calibrated, and the details of the correction method were provided in supplementary materials. Finally, 200 calibrated hyperspectral images were obtained.

2.4. Data Processing

2.4.1. Extraction of Spectral Data

The hyperspectral images of the samples contain a vast amount of information. However, not all this information is relevant to the taste quality. To focus on the relevant information, a threshold segmentation method was applied to separate the calibrated sample hyperspectral images from the background, effectively removing background information. Subsequently, the spectra of all pixel points within the sample area were extracted and averaged to obtain the raw spectral information of the fermentation samples. The obtained raw spectral data underwent standard normal variable (SNV) transformation for preprocessing. This preprocessing step eliminated the impact of optical path scattering, thereby improving the modeling performance.

2.4.2. Selection of Characteristic Spectral Information

Although the preprocessed spectra eliminated the impact of optical path scattering, multi-dimensional information may still contain strong redundancy. Consequently, the selection of effective spectral information becomes a particularly crucial step. Two effective spectral selection methods, SPA and ACO, were employed. SPA could efficiently integrate all sample information using only a small number of variables [20]. The ACO strategy incorporates the concept of cooperative pheromone accumulation and effectively eliminates irrelevant features based on the Monte Carlo method [21]. Crucially, the ACO strategy displayed different running results due to the Monte Carlo approach. To ensure robustness, the ACO strategy was repeated 100 times, recording all selected variables and their repetition frequencies. Ultimately, the bands with repetition frequencies higher than 30 were selected.

2.4.3. Image Acquisition and Feature Extraction

As is all known, each band of hyperspectral image represents a grayscale image. The SPA and ACO algorithms have selected effective variables. Among them, 3 selected bands using SPA and 3 selected bands using ACO were synthesized into color images. As for the selection of 3 synthesized bands for SPA and ACO algorithms, according to our previous experiments, we found that when the R, G, and B channels are 658.37 nm, 553.07 nm, and 449.33 nm, respectively, the synthesized color image is considerable similar to the raw fermentation samples [16]. Hence, 3 bands closest to the R (658.37 nm), G (553.07 nm), and B region (449.33 nm) were selected from these effective bands selected by SPA and ACO algorithms. For the SPA algorithm, the color image was synthesized when R = 686.63 nm, G = 540.34 nm and B = 448.29 nm. For the ACO algorithm, when R = 555.19 nm, G = 552.01 nm, and B = 405.30 nm, three grayscale images were synthesized into a color image. Subsequently, all the synthesized color images were extracted from 12 color features, such as R, G, B, H, S, V, L*, a*, b*, 2G-R-B, R/G, hab*, and 6 texture features, i.e., m, δ, r, μ, U, and e. The detailed descriptions of these image features are presented in supplementary materials.

2.4.4. Data Fusion and Dimension Reduction

The data fusion can enhance the robustness of the prediction model by leveraging complementary information sources, thus promoting the synergy of different technologies. Data fusion could be classified into low, middle, and high levels [22]. These data fusion methods were introduced in supplementary materials. The low-level fusion obtains comprehensive sample information, but a large amount of redundant information can affect the computational speed of the prediction model. Compared with the low-level fusion strategy, this strategy eliminates redundant information from fusion data and improves the performance of the prediction model. However, the high-level fusion exhibits extremely high requirements for the prediction results of each data. Hence, the middle-level fusion was carried out. In this work, the effective spectral information and 18 color texture features were combined into a new matrix. However, there is still a significant correlation between these obtained variables, indicating that the information expressed by some variables could be replaced by other variables. The redundant information could potentially impact the accuracy and robustness of the established models. In general, fewer variables involved in modeling lead to faster model execution. Additionally, the rapid discrimination and prediction ability of equipment are vital factors for wide application in actual production. Therefore, to enhance modeling robustness, accuracy, and speed, a data dimensionality reduction strategy should be applied for the fusion of different information. Principal component analysis (PCA) is a classical method which not only reduces the dimension of fused multidimensional data but also preserves most of the raw variable information [23]. Orthogonal transformation projects the raw variables that might be correlated onto selected vectors to form a new set of variables (principal components, PCs), which represents most of the effective information of raw data. In this study, the PCA was applied to compress fused multidimensional data.

2.4.5. Regression Models

In this study, classical PLSR, SVR, and ELM methods were employed to establish regression models for the black tea taste quality. For the PLSR model, the optimal principal components (PCs) were selected using the smallest sum squares errors obtained through cross-validation [10]. The SVR is a nonlinear supervised learning algorithm that only focuses on the sample points with the smallest error margin, and these sample points are known as support vectors. The SVR algorithm aims to create a model that minimizes the difference between the output value and the target value. Unlike traditional methods, SVR calculates losses only when the difference between the output and target values exceeds the preset error. This approach allows the model to focus on accurately predicting values near the target value [24]. The radial basis function (RBF) was applied as the kernel function. In addition, the penalty factor c and kernel parameter g were optimized to establish a taste quality regression model of black tea. The ELM is a strategy that is used to train a single hidden layer feedforward neural network. The ELM algorithm could use random input layer weights and deviations rather than backward propagation methods and retain good generalization ability [25]. The evaluation factors and statistical analysis software were introduced in supplementary materials.

3. Results

3.1. Taste Evaluation Results

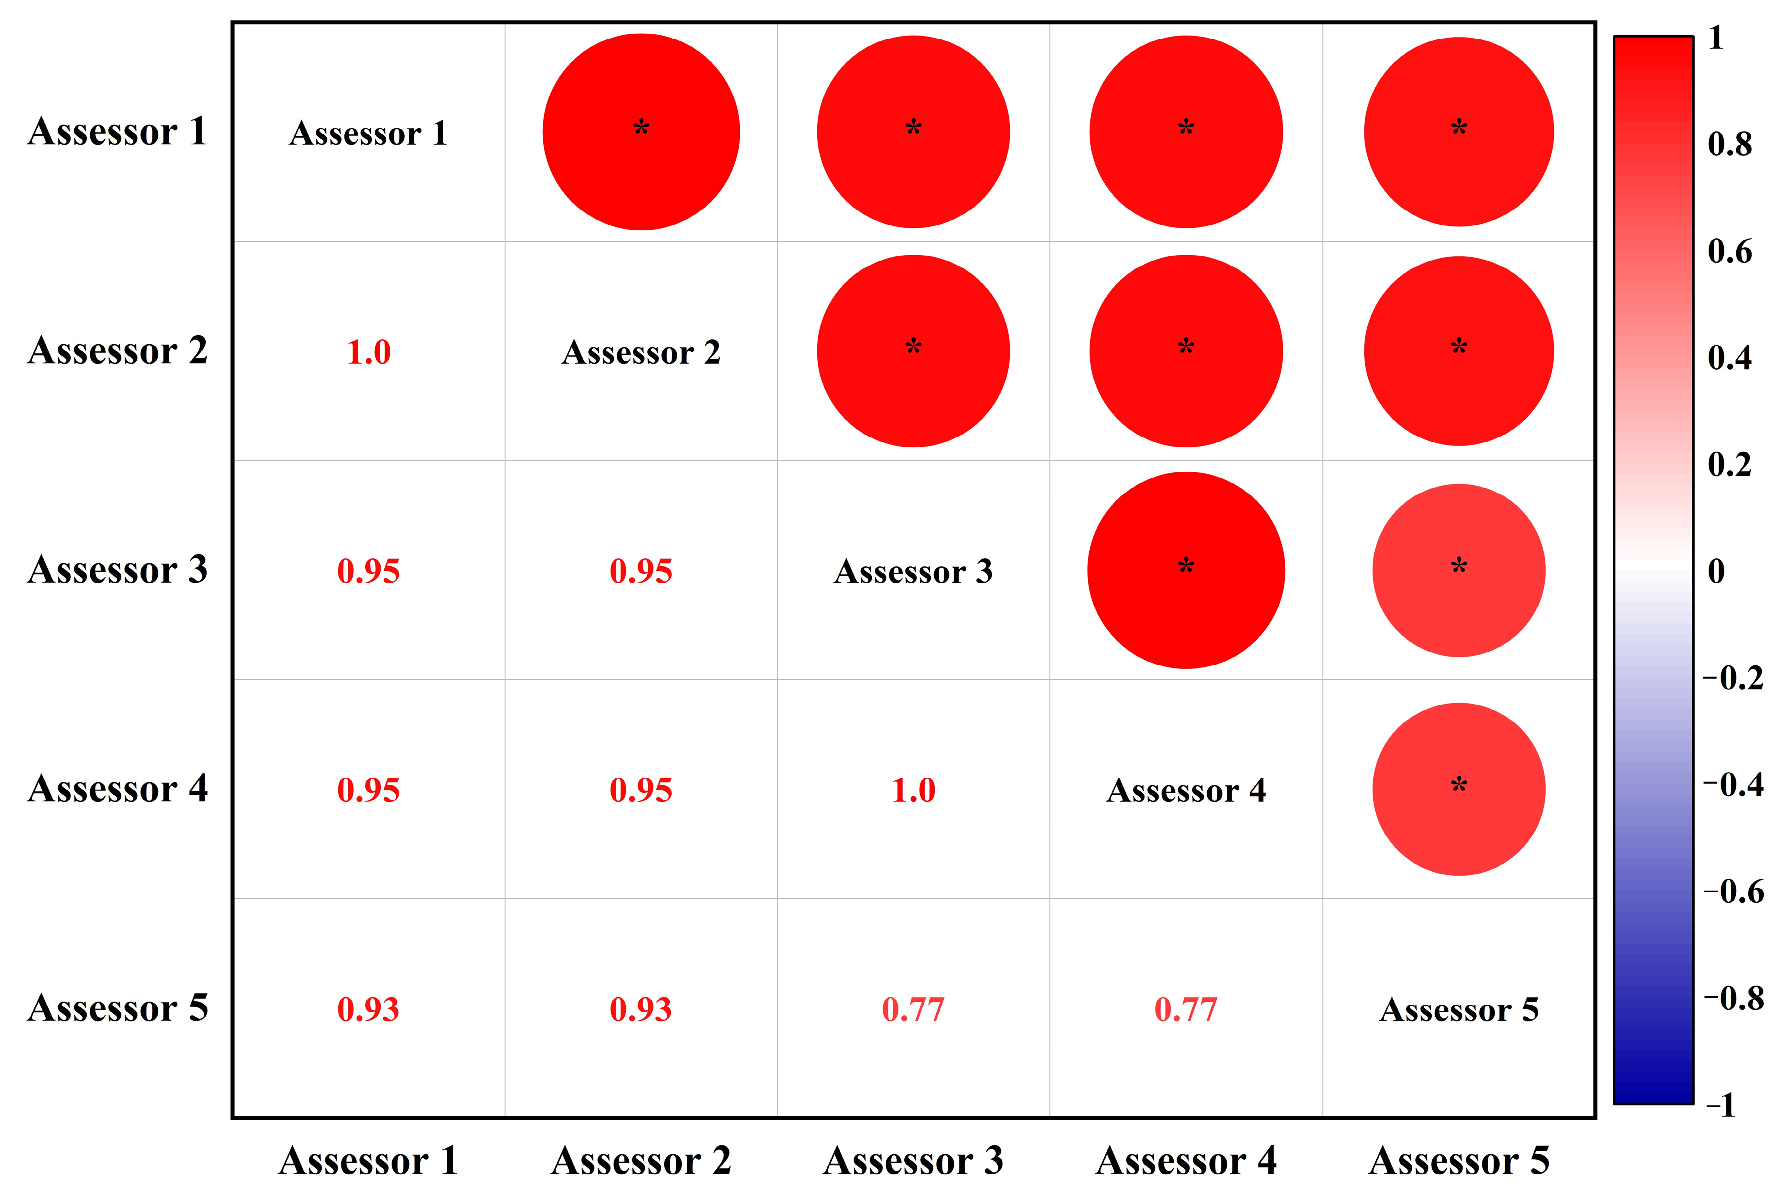
In this work, the taste quality of tea samples was evaluated by five professional tea tasters, and these obtained taste scores were shown in supplementary materials. At the initial stage of fermentation, the taste quality displayed relatively low scores because obvious astringency remained in the tea infusion, and the sweet flavor was not fully presented. The strong astringency observed in the tea samples at the beginning of fermentation might be attributed to the high concentration of epigallocatechin gallate (EGCG) [19]. Subsequently, the astringency of tea samples decreased, and the sweet flavor was completely presented. Therefore, during the moderate fermentation stage, the taste quality of the tea samples obtained a satisfactory score, which is a common occurrence. However, with prolonged fermentation, the taste scores decreased, mainly due to the gradual increase in sour flavor. This sourness could be attributed to the accumulation of organic acids resulting from the oxidation and polymerization of polyphenols [26]. Hence, these taste scores can be interpreted with confidence. As can be seen in Figure 2, the Pearson correlation analysis was carried out by five professional tea tasters. It is evident that all the correlation coefficients for taste scores exceeded 0.77, and these taste scores were significantly correlated (p < 0.01). This indicates that the evaluations provided by the tea tasters are highly consistent in assessing taste quality. Thus, these obtained taste score by five professional tea tasters is reliable and could represent the taste quality of fermentation samples.

3.2. Response Spectra of Fermentation Samples

The raw two-dimensional response spectra of tea samples are depicted in Figure 1 and Figure 3a. As shown in Figure 1, the reflectance intensity of the absorption peak in the visible region decreases over time. This may result from the enzymatic oxidation reaction, as this reaction results in the reduction of chlorophyll and the formation of tea pigments, i.e., theaflavins (TFs) and thearubigins (TRs) [16,27]. Moreover, the same is true in the near-infrared region, which might be related to the overtone of X-H groups [2]. To mitigate the impact of optical path scattering, all raw spectra underwent SNV, and the preprocessed spectra are presented in Figure 3b,c. It is evident from Figure 3c that the spectral trends are more clearly described. In the range of 600–700 nm and 880–1000 nm, the reflectance intensity increases over fermentation time. However, the opposite trend is presented in the range of 720–880 nm. This spectral information exhibits a regular trend within a specific range.

3.3. Hierarchical Clustering Analysis (HCA) of Sample Spectra

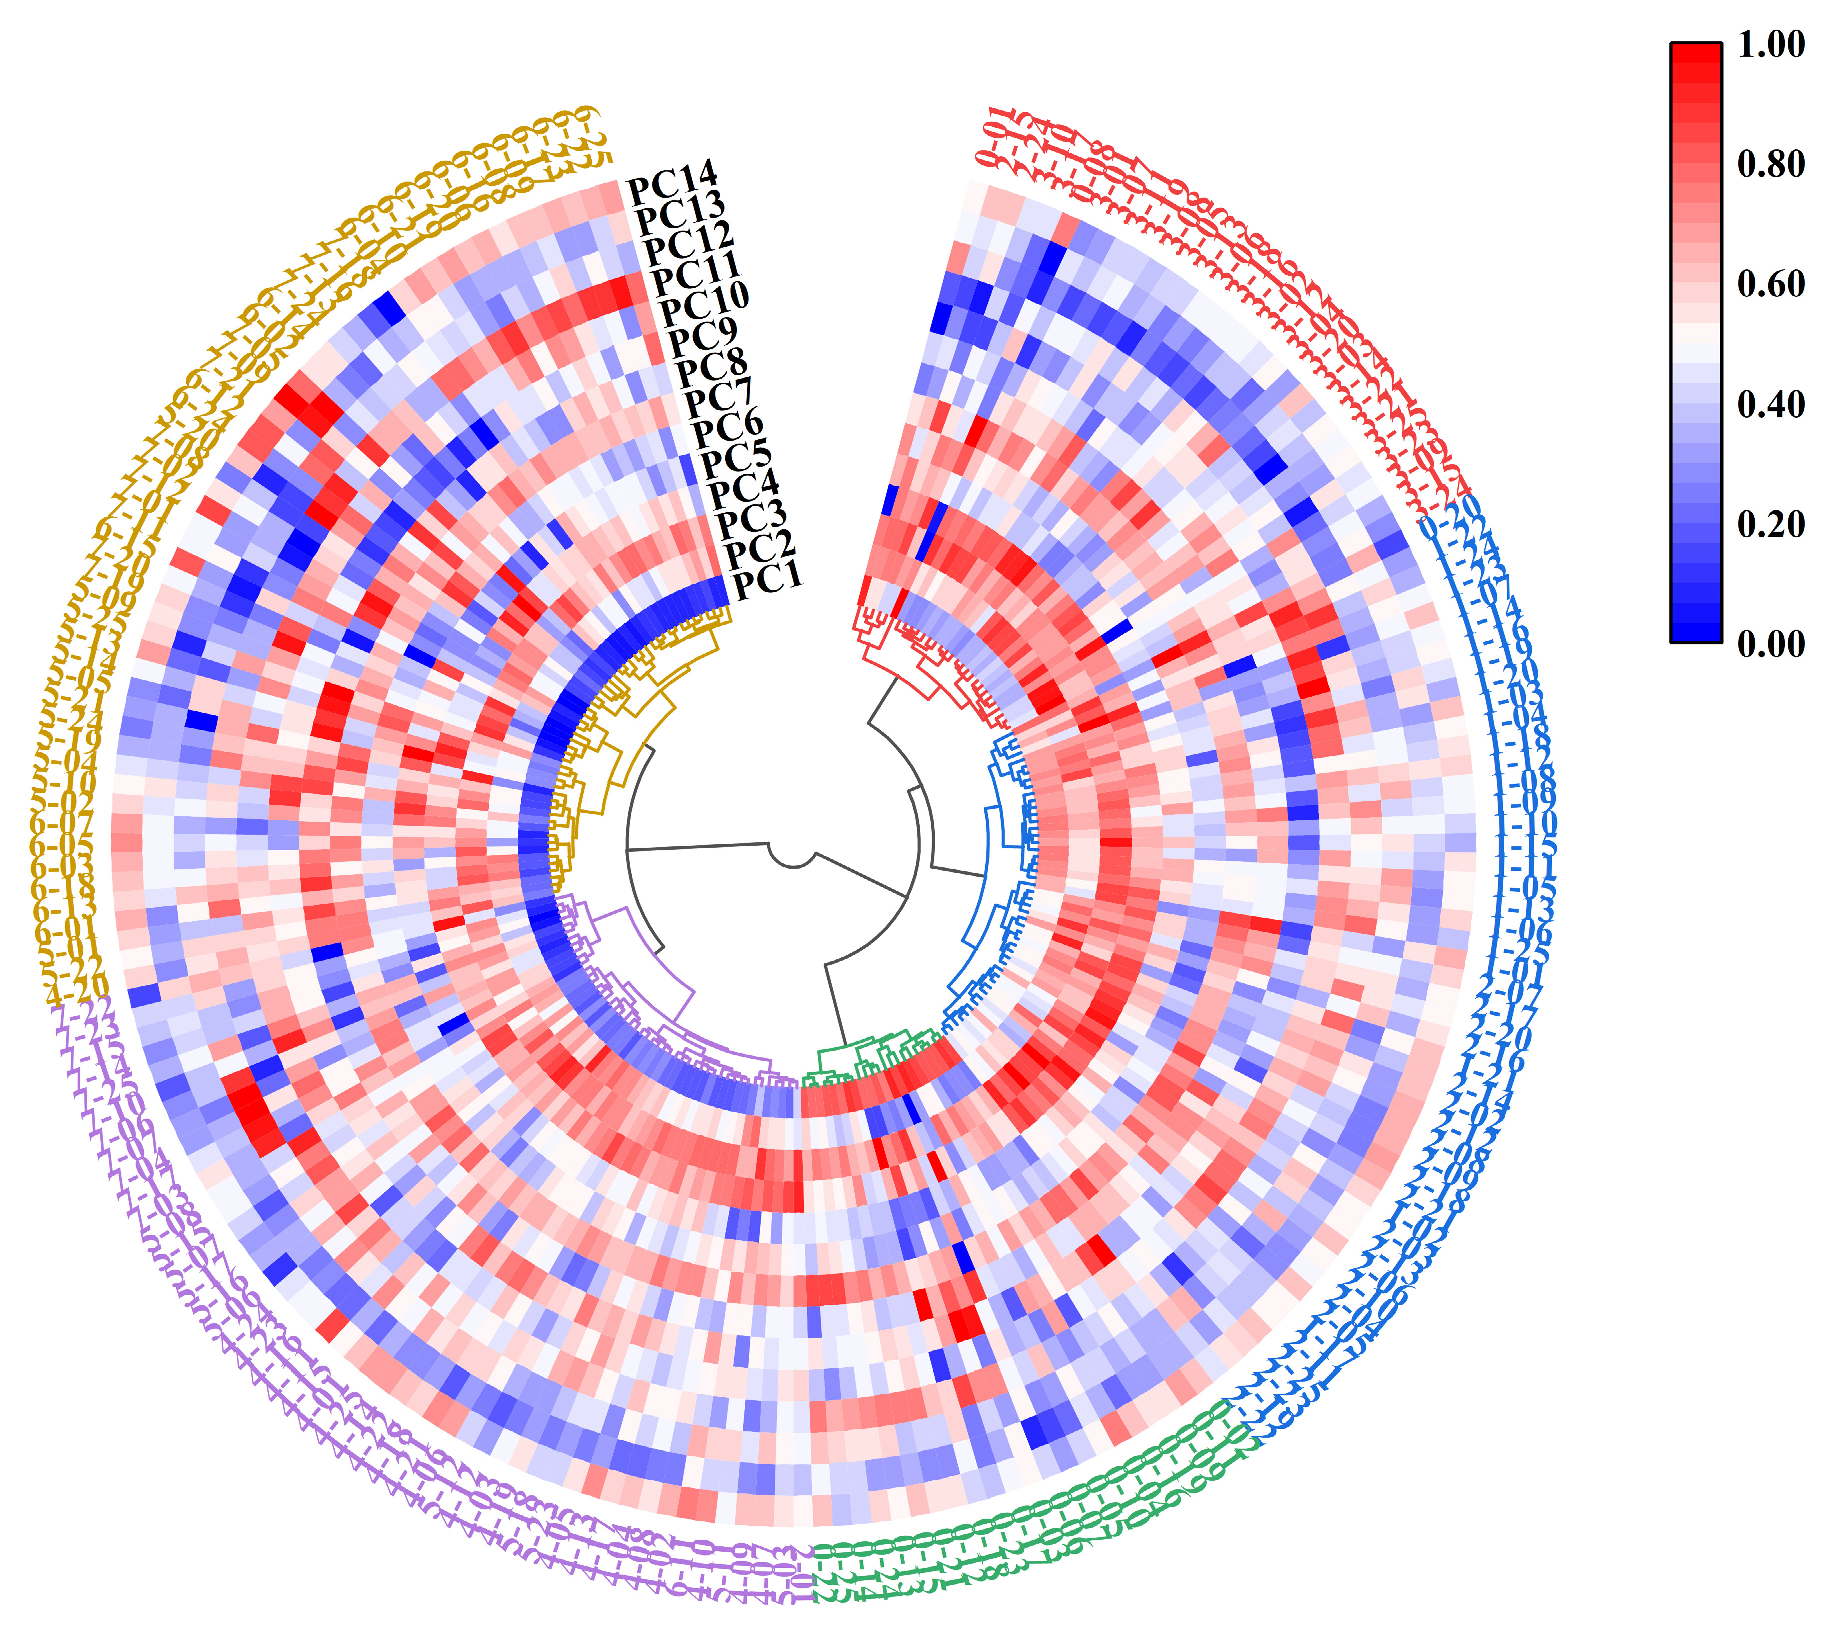
All the sample spectra were subject to PCA, and then the first 14 PCs were carried out HCA. Notably, the first 14 principal components (PCs) were selected as they collectively captured 99.9% of the information contained in the preprocessed sample spectra. In this study, all the sample spectra were categorized into five groups. The result of HCA with different taste quality is displayed in Figure 4. Unfortunately, the results of HCA for sample spectral information are not satisfactory. The spectral information from adjacent fermentation time points was divided into the same category rather than based on the taste quality scores, indicating that the spectral information at different fermentation times had poor recognition ability for the taste quality of black tea. In addition, the HCA is an unsupervised class analysis strategy, which could not effectively evaluate unknown samples, and the new HCA map containing this new sample information should be recreated [28]. Therefore, some effective supervised quantitative regression algorithms, such as PLSR, SVR, and ELM, were further developed and applied.

3.4. Quantitative Prediction Models with Single Data

3.4.1. Regression Model Based on Full Bands

To rapidly and accurately evaluate the taste quality during black tea fermentation, the sample spectra with full bands were applied to establish a taste quality score regression model. Before modeling, all the spectral data were divided into a calibration set (133 samples) and a prediction set (67 samples) with the radio of 2:1. Subsequently, the PLSR model of raw and preprocessed spectral data with full bands was established, and the results are presented in Table 1. The Rp and RMSEP values for the raw and preprocessed spectra were 0.763, 0.897, and 0.827, 0.778, respectively. Obviously, the established linear regression model using preprocessed spectra exhibited better prediction performance due to the high Rp values and low RMSEP values, demonstrating that the raw spectra contained some interferences, which might be caused by optical path scattering. Hence, appropriate preprocessing methods play a crucial role in establishing supervised regression models. Although the preprocessed spectral data improved the model accuracy, the performance of the taste quality model was still poor because of the existence of some redundant information. Therefore, some effective variables should be selected to establish a more accurate taste quality evaluation model.

3.4.2. Regression Model Based on Effective Bands

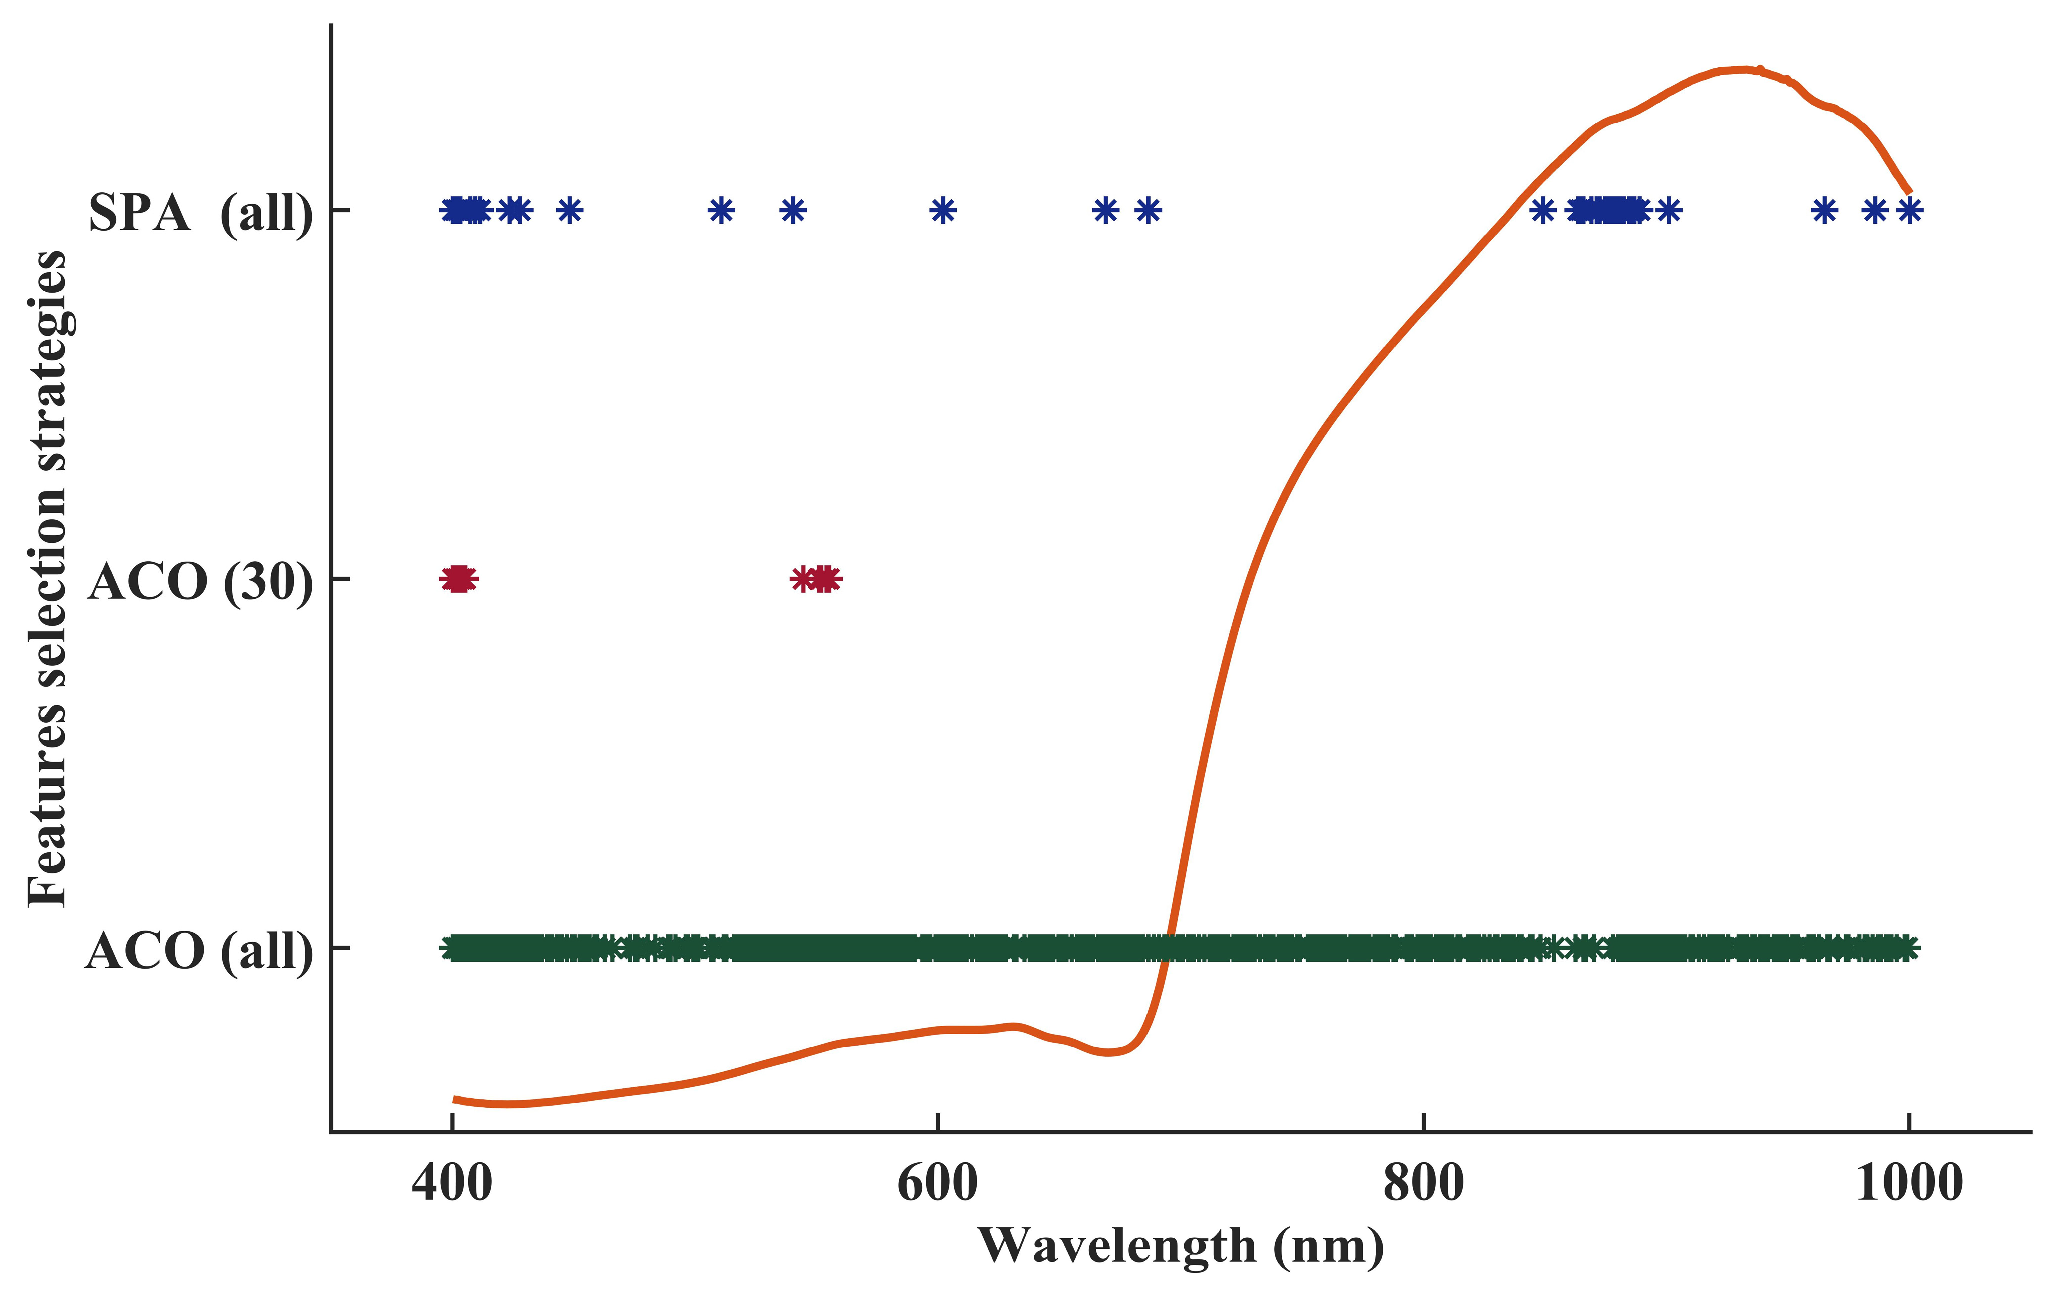
In this work, the SPA and ACO methods were applied for the selection of effective bands to establish the taste quality model during black tea fermentation. The model performance and the selected effective bands are presented in Table 1 and Figure 5, respectively.
For the SPA methods, 38 effective bands were selected to establish the PLSR model. After the SPA processing, the performance of the established model showed a significant improvement compared to the SNV model, as indicated by the higher correlation coefficients. The Rc, RMSEC, Rp, and RMSEP for the established PLSR model were 0.909, 0.585, 0.927 and 0.553, respectively.
In the ACO selection strategy, the total number of ants, the number of generations, and the maximum number of factors were 20, 50, and 4, respectively. However, different effective bands would be selected when the ACO algorithm was repeatedly executed, which might be related to the applied random selection strategy to avoid stagnation. Hence, the ACO algorithm was carried out 100 times, and all the selected effective bands and selection frequencies were recorded. During 100 runs of the ACO algorithm, a total of 411 variables were selected. However, the selected frequencies of each variable exhibited certain differences. To obtain more representative variables, the cutoff line was set to 30, and 11 effective variables were selected. The performance of the taste quality model for 11 and 411 bands using the ACO algorithm is displayed in Table 1. The Rc, RMSEC, Rp, and RMSEP for the established PLSR model using 411 bands were 0.857, 0.723, 0.833, and 0.767, respectively. The Rc, RMSEC, Rp, and RMSEP for the established PLSR model using 11 bands were 0.903, 0.602, 0.923, and 0.543, respectively. Obviously, the PLSR model using 11 bands showed better performance because of high Rc and Rp values, showing that selected high-frequency variables improved the precision and robustness of the prediction model, and a large number of redundant information was eliminated. Remarkably, the performance of the spectral regression model using SPA and ACO (cutoff line = 30) algorithms was similar. In addition, the model performance is worth further improvement because the Rp values were less than 0.95. Hence, the taste quality prediction model during black tea fermentation should be further developed.

3.4.3. Regression Models Based on Image Features

To further explore the methods for the improvement of the taste quality model performance, the image information of tea samples was applied. Among these selected bands using SPA and ACO (cutoff line = 30), after repeated experiments, some grayscale images of effective variables were selected to synthesize color images of tea samples because the synthesized color images were most similar to the raw sample. For the SPA method, when R = 686.63 nm, G = 540.34 nm, and B = 448.29 nm, the color images were acquired. For the ACO (cutoff line = 30), the color images were synthesized when R = 555.19 nm, G = 552.01 nm and B = 405.30 nm. Subsequently, 18 image features of each obtained color image were extracted. The results of established PLSR models of taste scores using image information from SPA and ACO methods are displayed in Table 1. Obviously, the performance of established PLSR models using image information was poor because the Rp values were less than 0.6 and the RMSEP values were higher than 1.0, indicating that 18 image features of tea samples could not represent complete taste quality information and accurately evaluate the taste quality during black fermentation. In addition, the Pearson correlation analysis between these features and the taste scores is presented in Figure 1. Most color features were found to be strongly related to the taste scores, indicating their potential significance for taste quality evaluation. In contrast to the color features, few texture features displayed weak correlations with the taste scores. Moreover, significant correlations were exhibited between different color and texture features. Hence, the poor model performance using image information might be caused by the interference of irrelevant variables and incomplete sample information.

3.5. Regression Models with Fusion Data

To acquire a more robust and accurate taste quality evaluation model, data fusion was applied to obtain comprehensive sample information, and the PCA method was used to reduce the dimensions of fusion data and retain the most effective sample information. Therefore, the black tea taste quality was evaluated based on fusion information and different regression algorithms. In this study, the selected effective bands using SPA and ACO (cutoff line = 30) algorithms and the extracted 18 features based on synthesized color images using three selected bands from SPA and ACO (cutoff line = 30) strategies were directly connected. Subsequently, the PCA algorithm was carried out to reduce the dimensions of fusion data. The compression rates with the SPA and ACO (cutoff line = 30) methods for the fused information were 90.26% and 94.96%, respectively. Notably, when the maximum PCs for the fusion data from SPA and ACO (cutoff line = 30) were set to 22 and 15, respectively, these selected PCs could effectively represent 99.99% of the raw fusion data information. Finally, some classic regression algorithms, including PLSR, SVR, and ELM, were applied for the evaluation of taste quality. In Table 2, for the PLSR model, the values of Rp for the fusion data using SPA and ACO (cutoff line = 30) strategies were 0.978 and 0.910, respectively. For the SVR algorithm, the model achieved the optimal level when both the c and g parameters were 256. The values of Rp for the fusion-SPA and fusion-ACO (cutoff line = 30) strategies were 0.969 and 0.930, respectively. For the ELM algorithm, the number of neurons was optimized to obtain the best model. When the neurons were 75 and 35 for the fusion-SPA and fusion-ACO (cutoff line = 30), the models displayed the best predictive ability. The values of Rp for the black tea taste quality prediction models were 0.969 and 0.928, respectively. In addition, all the RPD values were higher than 2.20, and RMSEP values were less than 0.60, indicating that all established prediction models could accurately evaluate the black tea taste quality.

4. Discussion

Some classical regression models using individual data and fused information were developed. A performance comparison of these models is demonstrated in Figure 6. Each dot represents one model, the Rp, and the RPD values provide the coordinates of the dot center, and the radius corresponds to the RMSEP values of the prediction set. If the dot is far from the origin and the radius of the dot is smaller, the corresponding model would exhibit better prediction performance. As can be seen in Table 1 and Table 2 and Figure 6, the conclusions and main reasons can be summarized as follows. The established taste quality prediction model using single spectral features showed better predictive ability than the single image model. This phenomenon occurs because spectral data contain more information than 18 image features. Additionally, the image features exhibited weak correlations with the black tea taste quality. On the contrary, the most effective bands were selected by artificial intelligence algorithms, including SPA and ACO strategies, and they might be related to some key components, which corresponded to changes in black tea taste quality. For instance, some effective bands were selected by the SPA algorithm, which were located at 780–1000 nm. Furthermore, these selected effective bands were attributable to the third and fourth overtone of group C-H [29]. However, black tea fermentation involves changes in some major components, such as catechins, soluble sugar, caffeine, and amino acids, corresponding to the black tea taste quality. The taste quality of tea infusion is the result of the interaction of some major components. Hence, more comprehensive information should be applied to establish a taste quality evaluation model. Interestingly, certain common bands were selected by both SPA and ACO algorithms, and they were situated in the visible region. They are associated with the significant color changes observed in fermentation samples, indicating that color features play a crucial role in evaluating the taste quality during black tea fermentation. In addition, the correlation analysis of image features also demonstrated similar results. Therefore, most established fusion models of taste quality achieved better prediction performance than single information models. To identify the optimal prediction model for taste quality during black tea fermentation, particular attention should be directed towards Table 2 and Figure 6. Obviously, the established PLSR model using the fusion-SPA strategy was far from the origin, and the radius of the dot was smaller because this model exhibited the highest Rp (0.978), RPD (4.118), and the lowest RMSEP (0.282) values. Although the calibration model did not display the highest Rc (0.986), it was able to demonstrate better predictive ability for unknown samples. Hence, the fusion-SPA-PLSR model was considered the best prediction model. This result might be caused by the following reasons. Fermentation follows changes in some major components, such as catechin (C), catechin gallate (CG), epicatechin (EC), epigallocatechin (EGC), epicatechin gallate (ECG), epigallocatechin gallate (EGCG), soluble sugar and gallic acid, corresponding to the taste quality of finished tea. The mellow taste of black tea is attributed to the interaction of these components. These components exhibited a linear changing trend with the increasing fermentation time [30]. Hence, the classic linear PLSR model could display better performance. Compared with the ACO algorithm, some selected effective bands using the SPA algorithm were located in the near-infrared region, and they were related to the stretching and vibration of group X-H, which can better explain the linear trend of these major components. In addition, three selected effective bands using the SPA algorithm, which was applied to synthesize color images, were closer target bands (R = 658.37 nm, G = 553.07 nm, and B = 449.33 nm) compared with three selected bands using the ACO algorithm. The synthesized color images using SPA-selected bands were more similar to the raw fermentation samples and contained more effective information than the synthesized color images using the ACO (cutoff line = 30) selected bands. Based on the combined effects of the above factors, the fusion-SPA-PLSR model exhibited the best performance.
The unique taste of black tea is caused by various bioactive compounds. For instance, the ester-type catechins are related to the astringency of black tea, especially for EGCG [19]. The soluble sugar and caffeine are the main contributors to the sweetness and bitterness, respectively [2]. A large amount of TFs is beneficial for the formation of a mellow taste [30]. The effects of different fermentation times on the content of soluble sugar, catechin, caffeine, and theaflavins (TFs) in black tea are displayed in Figure S1. The catechins gradually decreased over fermentation time. TFs showed a trend of first increasing and then decreasing over time. During short fermentation time, the catechins were less oxidized, which was not conducive to the formation of TFs and TRs. When the moderate fermentation stage was reached, the catechins exhibited moderate oxidative polymerization and isomerization. A large number of TFs and TRs were formed to improve the mellow taste of black tea. Subsequently, the TFs and TRs were further oxidative polymerized, and a large number of TBs were formed, resulting in tasteless black tea liquors. The soluble sugar displayed a trend of decreasing first, subsequently increasing, and then decreasing over fermentation time. The polysaccharides could be hydrolyzed into monosaccharides, leading to the increase in soluble sugar. At the same time, the monosaccharides were applied for the respiration of fermentation leaves, resulting in the decrease in soluble sugar. Hence, the content of soluble sugar would be decreased when fermentation time was prolonged. However, the caffeine did not change obviously, which was related to its stable chemical properties. The trends of these components could be contacted with the taste scores of fermentation samples. Before fermentation for 3 h, the taste scores of fermentation samples were poor, corresponding to the insufficient conversion of catechins, leading to high TFs and catechins. The taste score reached the highest value at fermentation 3 h. Obviously, the content of soluble sugar and TFs also reached a relatively high value at fermentation 3 h. These phenomena indicated that taste scores were the result of the combined action of multiple components. Hence, the evaluation of one component, such as caffeine, cannot provide guidance for actual fermentation production. After preliminary investigation, we have learned that most consumers are more concerned about the taste of tea. Furthermore, to some extent, the taste scores could reflect the content of major components and the optimal fermentation time [30]. Therefore, the rapid and intelligent evaluation of the taste quality of black tea using non-destructive detection technology can provide guidance for actual fermentation production.
In Table S2, some nondestructive detection technologies were applied to evaluate the tea quality. Ren et al. [31] applied the e-tongue to obtain characteristic potential signals of black tea samples and converted them into relative characteristic taste values. Finally, the grades of black tea were accurately discriminated using five taste features and the LS-SVM model. However, modern consumers are more concerned about the authentic taste quality of tea rather than labeled tea grade. Hence, to quantify the taste quality of tea leaves is a very important assignment. Dong et al. [18] and Wang et al. [19] used computer visions (CVS) and NIR technology to successfully evaluate the appearance sensory scores and bitterness and astringency scores, respectively. In addition, Chen et al. [5] established the quantitative prediction model of taste scores and eight major components for black tea. In the process of black tea fermentation, most studies focus on the evaluation of major components. Few research has been reported to evaluate sensory quality during black tea fermentation. Dong et al. [14] applied CVS technology to accurately predict tea pigments and sensory scores in the process of black tea fermentation. Although these studies successfully evaluated tea taste quality, which consumers were more concerned about, some issues still existed. For instance, the taste quality is the result of the interaction of some major components, and the tea leaves also underwent considerable changes (appearance and components) during the process of the formation for the unique tea quality. Hence, the single sensor could not obtain comprehensive sample information. Ren et al. [32] established an accurate discriminative model for black tea grade using the fusion information of NIRS and E-Tongue, showing that the proposed data fusion strategy contained more comprehensive sample information and exhibited better discriminative performance. As can be seen in Table S2, our study was compared with other previous studies. Compared with these quantitative analysis studies, the established model using our proposed method showed better predictive performance due to a large taste score gradient. Because these researches focused on finished tea, there was little difference in taste scores between different samples. In contrast to the finished tea, tea samples with different fermentation times could exhibit a larger taste score gradient. In Table S2, most of the above studies mainly focused on the finished tea and overlooked the complicated manufacture crafts of black tea, especially the fermentation process. Especially compared with Dong’s research [14], our strategy could achieve better results in the process of black tea fermentation because our strategy could obtain more comprehensive digital information. It was noted that the sensory score contained appearance score, liquor color score, aroma score, taste score, and infused leaf score. Although sensory scores were different from taste scores, to a certain extent, it could display the trend of taste scores. However, the study corresponding to the taste score during black fermentation has not been reported. In this work, the taste quality during black tea fermentation was evaluated based on the fusion data of spectral and image information. To the best of our knowledge, this is the first study to use the fusion information from sample HIS data to evaluate the taste quality during black tea fermentation.
Although our study exhibited a satisfactory result, some shortcomings also need to be improved. For instance, our study only proved the feasibility of the fusion data using spectral and image information from sample hyperspectral images, but the predictive potential of different varieties needed to be further explored. It is worth noting that some previous studies have demonstrated that infrared spectra, hyperspectral imaging, and machine vision technology can accurately predict major components corresponding to the taste quality and sensory scores based on different tea varieties [2,5,14]. These references demonstrated the feasibility of the above non-destructive detection technology in evaluating the quality of different tea varieties. During black tea fermentation, these major components and sensory scores displayed similar trends with different tea varieties [30]. Our proposed strategy also had similar digital information and evaluation indicators and contained more comprehensive information features. These phenomena provide a theoretical basis for the application to other tea varieties. However, both single variety and full-variety models require a large amount of data accumulation. Hence, more fermentation experiments based on different tea varieties should be conducted, which will be the focus of our next work. In addition, it is important to explore further the methodology of sensory analysis. Traditional sensory evaluation experiments require professional tea reviewers to evaluate the appearance score, liquor color score, aroma score, taste score, and infused leaf score [30]. The comprehensive effect of these factors determines the sensory quality of tea samples. Therefore, these indicators information should be comprehensively obtained and evaluated. Furthermore, this method is hysteresis and subjective. Compared with traditional sensory evaluation, the non-destructive detection technology could rapidly and objectively evaluate the sample sensory quality [5,14,19]. Importantly, different sensors should be applied to acquire the appearance, liquor color, aroma, taste, and infused leaf information. Subsequently, the experiences of professional tea reviewers are learned by artificial intelligence models to evaluate the appearance score, liquor color score, aroma score, taste score, and infused leaf score. Hence, some sensors with integrated functions for obtaining the appearance, liquor color, aroma, taste, and infused leaf information should be developed. The collected information will be combined with artificial intelligence models with professional tea reviewers’ experience to achieve the rapid and objective analysis of sample sensory quality.

5. Conclusions

In this study, using the fusion information based on spectral and image data, which were from sample hyperspectral images, for evaluating the taste quality during black tea fermentation was demonstrated to be feasible. Some conclusions are as follows:
Three selected bands using the SPA and ACO algorithms were determined to synthesize color images. For the SPA algorithm, 686.63 nm (R), 540.34 nm (G), and 448.29 nm (B) were selected. For the ACO algorithm, 555.19 nm (R), 552.01 nm (G), and 405.30 nm (B) were obtained.
For the single data source, the Spectra-SNV-SPA showed the best modeling performance. The Rc, RMSEC, Rp, and RMSEP values were 0.909, 0.585, 0.927 and 0.553, respectively.
The data fusion strategy significantly improves the prediction precision of models. Specifically, the fusion-SPA-PLSR model presented the best prediction performance, with Rc, RMSEC, Rp, RMSEP, and RPD being 0.986, 0.239, 0.978, 0.282, and 4.118, respectively. Compared with the Spectra-SNV-SPA model, The Rc and Rp values increased 0.077 and 0.051, respectively.
In the future, hyperspectral imaging equipment with data fusion and quantitative evaluation of the taste quality of black tea should be developed.

Supplementary Materials

The following supporting information can be downloaded at https://www.mdpi.com/article/10.3390/fermentation9100896/s1. Table S1: The obtained taste scores of black tea at different fermentation times by 5 professional tea tasters. Table S2: Comparison with previous studies. Figure S1: Effects of different fermentation times on the content of catechin, soluble sugar, caffeine and theaflavins (TFs) in black tea.

Author Contributions

Conceptualization, T.A. and C.Y. (Chongshan Yang); methodology, T.A. and J.Z.; software, Z.W. and Y.F.; validation, S.F. and W.H.; formal analysis, C.Y. (Chongshan Yang), S.F. and W.H.; investigation, T.A.; resources, X.T. and Y.F.; data curation, T.A. and J.Z.; writing—original draft preparation, T.A.; writing—review and editing, T.A.; visualization, Z.W. and C.Y. (Changbo Yuan); supervision, C.D.; project administration, D.Q.; funding acquisition, C.D., C.Y. (Changbo Yuan) and X.T. All authors have read and agreed to the published version of the manuscript.

Funding

This research was funded by the National Natural Science Foundation of China, grant number: 31972466. The Research start-up funds-TRI-SAAS, grant number: CXGC2023F18 and CXGC2023G33. China Postdoctoral Science Foundation, grant number: 323241. The Key R&D Projects in Zhejiang Province, grant number: 2022C02044 and 2023C02043. The Key Projects of Science and Technology Cooperation in Jiangxi Province, grant number:20212BDH80025. The APC was funded by National Natural Science Foundation of China, grant number: 31972466.

Institutional Review Board Statement

Not applicable.

Informed Consent Statement

Not applicable.

Data Availability Statement

The datasets generated and/or analyzed during the current study are not publicly available due the data would be used to develop equipment with integrated functions but are available from the corresponding author on reasonable request.

Acknowledgments

This study was supported by the National Natural Science Foundation of China (31972466). The Research start-up funds-TRI-SAAS (CXGC2023F18, CXGC2023G33). Project funded by China Postdoctoral Science Foundation (323241). The Key R&D Projects in Zhejiang Province (2022C02044, 2023C02043) and the Key Projects of Science and Technology Cooperation in Jiangxi Province (20212BDH80025).

Conflicts of Interest

No conflicts of interest exist in the submission of this manuscript, and the manuscript is approved by all authors for publication. All the authors listed have approved the manuscript that is enclosed.

References

  1. Dong, C.; Ye, Y.; Yang, C.S.; An, T.; Jiang, Y.; Ye, Y.; Li, Y.; Yang, Y. Rapid detection of catechins during black tea fermentation based on electrical properties and chemometrics. Food Biosci. 2021, 40, 100855. [Google Scholar] [CrossRef]
  2. Yang, C.S.; Zhao, Y.; An, T.; Liu, Z.Y.; Jiang, Y.W.; Li, Y.Q.; Dong, C.W. Quantitative prediction and visualization of key physical and chemical components in black tea fermentation using hyperspectral imaging. LWT.-Food Sci. Technol. 2021, 141, 110975. [Google Scholar] [CrossRef]
  3. Feng, L.; Gao, M.J.; Hou, R.Y.; Hu, X.Y.; Zhang, L.; Wan, X.C.; Wei, S. Determination of quality constituents in the young leaves of albino tea cultivars. Food Chem. 2014, 155, 98–104. [Google Scholar] [CrossRef] [PubMed]
  4. Ye, Y.L.; Yan, J.N.; Cui, J.L.; Mao, S.H.; Li, M.F.; Liao, X.L.; Tong, H.R. Dynamic changes in amino acids, catechins, caffeine and gallic acid in green tea during withering. J. Food Compos. Anal. 2018, 66, 98–108. [Google Scholar] [CrossRef]
  5. Chen, Q.S.; Chen, M.; Liu, Y.; Wu, J.Z.; Wang, X.Y.; Ouyang, Q.; Chen, X.H. Application of FT-NIR spectroscopy for simultaneous estimation of taste quality and taste-related compounds content of black tea. J. Food Sci. Tech-Mys. 2018, 55, 4363–4368. [Google Scholar] [CrossRef] [PubMed]
  6. Chen, Q.S.; Sun, C.C.; Ouyang, Q.; Wang, Y.X.; Liu, A.P.; Li, H.H.; Zhao, J.W. Classification of different varieties of Oolong tea using novel artificial sensing tools and data fusion. LWT.-Food Sci. Technol. 2015, 60, 781–787. [Google Scholar] [CrossRef]
  7. Su, H.; Wu, W.Q.; Wan, X.C.; Ning, J.M. Discriminating geographical origins of green tea based on amino acid, polyphenol, and caffeine content through high-performance liquid chromatography: Taking Lu’an guapian tea as an example. Food Sci. Nutr. 2019, 7, 2167–2175. [Google Scholar] [CrossRef]
  8. Li, C.F.; Ma, J.Q.; Huang, D.J.; Ma, C.L.; Jin, J.Q.; Yao, M.Z.; Chen, L. Comprehensive Dissection of Metabolic Changes in Albino and Green Tea Cultivars. J. Agri. Food Chem. 2018, 66, 2040–2048. [Google Scholar] [CrossRef]
  9. Lee, M.S.; Hwang, Y.S.; Lee, J.; Choung, M.G. The characterization of caffeine and nine individual catechins in the leaves of green tea (Camellia sinensis L.) by near-infrared reflectance spectroscopy. Food Chem. 2014, 158, 351–357. [Google Scholar] [CrossRef]
  10. An, T.; Yu, S.Y.; Huang, W.Q.; Li, G.L.; Tian, X.; Fan, S.X.; Dong, C.W.; Zhao, C.J. Robustness and accuracy evaluation of moisture prediction model for black tea withering process using hyperspectral imaging. Spectrochim. Acta A 2022, 269, 120791. [Google Scholar] [CrossRef]
  11. Li, L.J.; Huang, W.Q.; Wang, Z.L.; Liu, S.Q.; He, X.; Fan, S.X. Calibration transfer between developed portable Vis/NIR devices for detection of soluble solids contents in apple. Postharvest Biol. Tec. 2022, 183, 111720. [Google Scholar] [CrossRef]
  12. Panigrahi, N.; Bhol, C.S.; Das, B.S. Rapid assessment of black tea quality using diffuse reflectance spectroscopy. J. Food Eng. 2016, 190, 101–108. [Google Scholar] [CrossRef]
  13. Luo, W.; Tian, P.; Fan, G.Z.; Dong, W.T.; Zhang, H.L.; Liu, X.M. Non-destructive determination of four tea polyphenols in fresh tea using visible and near-infrared spectroscopy. Infrared Phys. Technol. 2022, 123, 104037. [Google Scholar] [CrossRef]
  14. Dong, C.W.; Liang, G.Z.; Hu, B.; Yuan, H.B.; Jiang, Y.W.; Zhu, H.K.; Qi, J.T. Prediction of Congou Black Tea Fermentation Quality Indices from Color Features Using Non-Linear Regression Methods. Sci. Rep. 2018, 8, 10535. [Google Scholar] [CrossRef]
  15. Dong, C.W.; An, T.; Yang, M.; Yang, C.S.; Liu, Z.Y.; Li, Y.; Duan, D.D.; Fan, S.X. Quantitative prediction and visual detection of the moisture content of withering leaves in black tea (Camellia sinensis) with hyperspectral image. Infrared Phys. Technol. 2022, 123, 104118. [Google Scholar] [CrossRef]
  16. An, T.; Huang, W.Q.; Tian, X.; Fan, S.X.; Duan, D.D.; Dong, C.W.; Zhao, C.J.; Li, G.L. Hyperspectral imaging technology coupled with human sensory information to evaluate the fermentation degree of black tea. Sens. Actuators B Chem. 2022, 366, 131994. [Google Scholar] [CrossRef]
  17. An, T.; Li, Y.; Tian, X.; Fan, S.X.; Duan, D.D.; Zhao, C.J.; Huang, W.Q.; Dong, C.W. Evaluation of aroma quality using multidimensional olfactory information during black tea fermentation. Sens. Actuators B Chem. 2022, 371, 132518. [Google Scholar] [CrossRef]
  18. Dong, C.W.; Zhu, H.K.; Zhao, J.W.; Jiang, Y.W.; Yuan, H.B.; Chen, Q.S. Sensory quality evaluation for appearance of needle-shaped green tea based on computer vision and nonlinear tools. J. Zhejiang Univ. Sci. B 2017, 18, 544–548. [Google Scholar] [CrossRef]
  19. Wang, Y.J.; Li, T.H.; Li, L.Q.; Ning, J.M.; Zhang, Z.Z. Evaluating taste-related attributes of black tea by micro-NIRS. J. Food Eng. 2021, 290, 110181. [Google Scholar] [CrossRef]
  20. Galvao, R.K.H.; Araujo, M.C.U.; Silva, E.C.; Jose, G.E.; Soares, S.F.C.; Paiva, H.M. Cross-validation for the selection of spectral variables using the successive projections algorithm. J. Brazil Chem. Soc. 2007, 18, 1580–1584. [Google Scholar] [CrossRef]
  21. Allegrini, F.; Olivieri, A.C. A new and efficient variable selection algorithm based on ant colony optimization. Applications to near infrared spectroscopy/partial least-squares analysis. Anal. Chim. Acta 2011, 699, 18–25. [Google Scholar] [CrossRef] [PubMed]
  22. Borras, E.; Ferre, J.; Boque, R.; Mestres, M.; Acena, L.; Busto, O. Data fusion methodologies for food and beverage authentication and quality assessment—A review. Anal. Chim. Acta 2015, 891, 1–14. [Google Scholar] [CrossRef]
  23. Gewers, F.L.; Ferreira, G.R.; De Arruda, H.F.; Silva, F.N.; Comin, C.H.; Amancio, D.R.; Costa, L.D. Principal Component Analysis: A Natural Approach to Data Exploration. ACM Comput. Surv. 2021, 54, 672. [Google Scholar] [CrossRef]
  24. Li, X.l.; He, Y. Evaluation of Least Squares Support Vector Machine Regression and other Multivariate Calibrations in Determination of Internal Attributes of Tea Beverages. Food Bioprocess Technol. 2010, 3, 651–661. [Google Scholar] [CrossRef]
  25. Liu, X.; Lin, S.B.; Fang, J.; Xu, Z.B. Is extreme learning machine feasible? A theoretical assessment (part I). IEEE Trans. Neural Netw. Learn. 2015, 26, 7–20. [Google Scholar] [CrossRef] [PubMed]
  26. Yu, F.; Chen, C.; Chen, S.N.; Wang, K.X.; Huang, H.T.; Wu, Y.Y.; He, P.M.; Tu, Y.Y.; Li, B. Dynamic changes and mechanisms of organic acids during black tea manufacturing process. Food Control 2022, 132, 108535. [Google Scholar] [CrossRef]
  27. Huang, M.; Wang, Q.G.; Zhang, M.; Zhu, Q.B. Prediction of color and moisture content for vegetable soybean during drying using hyperspectral imaging technology. J. Food Eng. 2014, 128, 24–30. [Google Scholar] [CrossRef]
  28. Li, L.Q.; Li, M.H.; Liu, Y.; Cui, Q.Q.; Bi, K.Y.; Jin, S.S.; Wang, Y.J.; Ning, J.M.; Zhang, Z.Z. High-sensitivity hyperspectral coupled self-assembled nanoporphyrin sensor for monitoring black tea fermentation. Sens. Actuators B: Chem. 2021, 346, 130541. [Google Scholar] [CrossRef]
  29. Li, X.L.; Jin, J.J.; Sun, C.J.; Ye, D.P.; Liu, Y.F. Simultaneous determination of six main types of lipid-soluble pigments in green tea by visible and near-infrared spectroscopy. Food Chem. 2019, 270, 236–242. [Google Scholar] [CrossRef]
  30. Wang, H.J.; Shen, S.; Wang, J.J.; Jiang, Y.W.; Li, J.; Yang, Y.Q.; Hua, J.J.; Yuan, H.B. Novel insight into the effect of fermentation time on quality of Yunnan Congou black tea. LWT.-Food Sci. Technol. 2022, 155, 112939. [Google Scholar] [CrossRef]
  31. Ren, G.X.; Li, T.H.; Wei, Y.M.; Ning, J.M.; Zhang, Z.Z. Estimation of Congou black tea quality by an electronic tongue technology combined with multivariate analysis. Microchem. J. 2021, 163, 105899. [Google Scholar] [CrossRef]
  32. Ren, G.X.; Zhang, X.S.; Wu, R.; Yin, L.L.; Hu, W.Y.; Zhang, Z.Z. Rapid Characterization of Black Tea Taste Quality Using Miniature NIR Spectroscopy and Electronic Tongue Sensors. Biosensors 2023, 13, 92. [Google Scholar] [CrossRef] [PubMed]
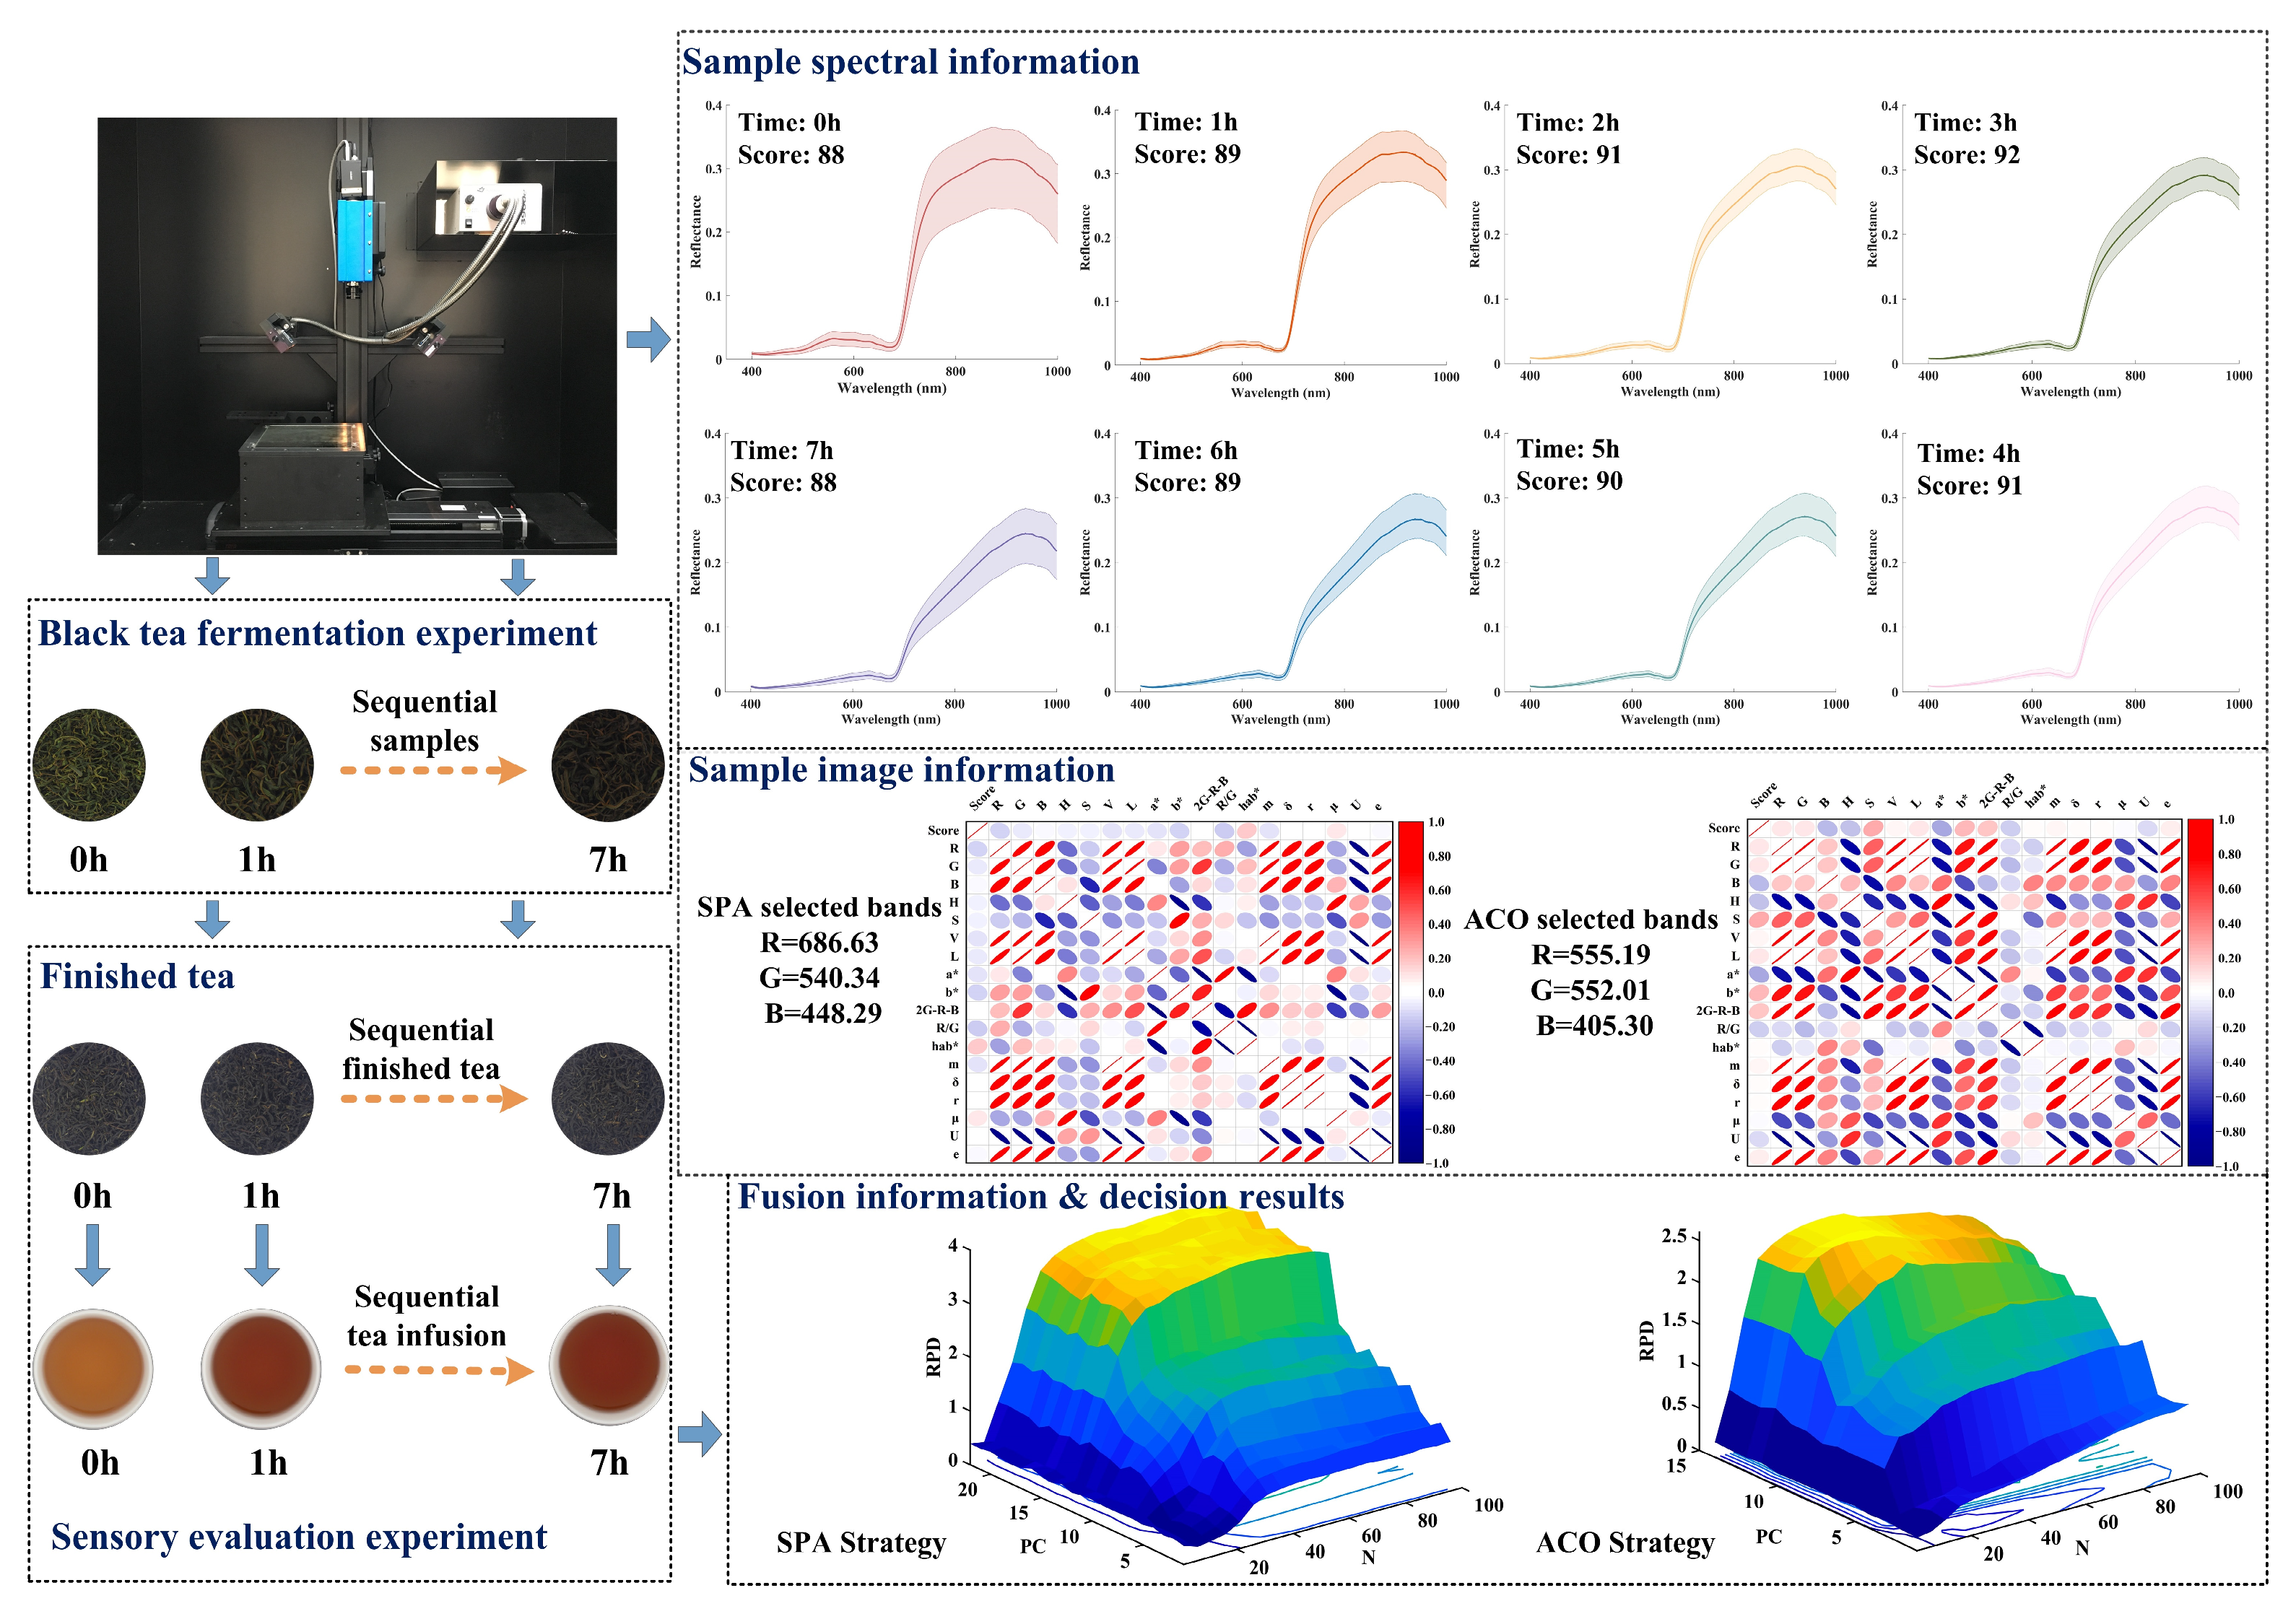
Figure 1. The flow diagram of black tea fermentation experiment and data analysis. For the sample image information, the red color indicates positive correlation and the blue color shows negative correlation. For the fusion information & decision results, the yellow color means high RPD value, the green color means middle RPD value, the blue color means low RPD value.
Fermentation 09 00896 g001
Figure 2. The Pearson correlation analysis of taste scores from 5 professional tea tasters. The “*” means that the compared results are significantly correlated. The red color indicates positive correlation and the blue color shows negative correlation. The red color font means the correlation coefficient.
Fermentation 09 00896 g002
Figure 3. The spectral curves of all fermentation samples obtained using (a) raw data, (b) SNV preprocessed data, and (c) averaged data of tea samples at different fermentation times. The different color lines mean different spectra of fermentation samples in Figure 3a,b.
Fermentation 09 00896 g003
Figure 4. The HCA heatmap based on spectral data of the first 14 PCs.
Fermentation 09 00896 g004
Figure 5. The selected effective bands based on SPA and ACO algorithms. The lines mean the average spectra of all fermentation samples. The selected effective bands using SPA, ACO (cutoff line = 30) and ACO were represented by blue, red and green color symbols, respectively.
Fermentation 09 00896 g005
Figure 6. The comparison of the fusion prediction models and other models.
Fermentation 09 00896 g006
Table 1. PLSR models for taste score of fermentation leaves based on individual data.
DataMethodNo.of VariablesParameterCalibration SetPrediction Set
LVsRcRMSECRpRMSEP
Spectranone55750.7880.8680.7630.897
SpectraSNV55750.8540.7310.8270.778
SpectraSNV + SPA3850.9090.5850.9270.553
SpectraSNV + ACO (30)1140.9030.6020.9230.543
SpectraSNV + ACO (all)41150.8570.7230.8330.767
ImageSPA18100.6431.0550.4521.279
ImageACO18140.6980.9930.5541.101
Table 2. Classical linear and nonlinear models for taste score of fermentation leaves based on fusion data.
ModelMethodsNo. of VariablesParameterCalibration SetPrediction Set
RcRMSECRpRMSEPRPD
PLSRFusion (SPA)56LV = 180.9860.2390.9780.2824.118
Fusion (ACO)29LV = 150.9470.4480.9100.5382.267
SVRFusion (SPA)56LV = 13, c = 256, g = 2560.9930.1740.9690.3243.748
Fusion (ACO)29LV = 9, c = 256, g = 2560.9440.4500.9300.4872.422
ELMFusion (SPA)56LV = 20, n = 750.9920.1740.9690.3173.748
Fusion (ACO)29LV = 11, n = 350.9490.4410.9280.4812.547
Disclaimer/Publisher’s Note: The statements, opinions and data contained in all publications are solely those of the individual author(s) and contributor(s) and not of MDPI and/or the editor(s). MDPI and/or the editor(s) disclaim responsibility for any injury to people or property resulting from any ideas, methods, instructions or products referred to in the content.