Article

Optimization of Alkaline Hydrogen Peroxide Pretreatment and Enzymatic Hydrolysis of Wheat Straw for Enhancing Sugar Yields

School of Life Sciences, Liaocheng University, Liaocheng 252000, China
*
Author to whom correspondence should be addressed.
Current Address: Liaocheng Agricultural and Rural Bureau, Liaocheng 252000, China.
Fermentation 2023, 9(10), 871; https://doi.org/10.3390/fermentation9100871
Submission received: 10 September 2023 / Revised: 23 September 2023 / Accepted: 25 September 2023 / Published: 27 September 2023
(This article belongs to the Special Issue Enzymes, Biocatalysis and Biosynthesis)

Abstract

:
Optimization of alkaline hydrogen peroxide (AHP) pretreatment and enzymatic hydrolysis of wheat straw (WS) was carried out to enhance fermentable sugar yields with the use of glucose and xylose yields from the pretreated WS as responses. In the first step, variables including temperature, hydrogen peroxide concentration and time during pretreatment were detected to have significant effects on the sugar yields. The results indicate that maximal sugar yields could be obtained while the WS was pretreated using 71 g/L hydrogen peroxide solution with 200 g/L of solid loading at 50 °C for 7.6 h. The corresponding cellulose recovery, hemicellulose recovery and lignin removal were 97.5%, 84.3% and 75.0%, respectively. In the second step, enzymatic hydrolysis of the pretreated WS was optimized. The results show that the reaction time, enzyme loading and biomass loading during enzymatic hydrolysis also had significant effects on the sugar yields. The final maximum yields of glucose (552.7 mg/gds (mg/g dry substrate)) and xylose (223.6 mg/gds) could be obtained while enzymatic hydrolysis was carried out at 50 °C for 37.0 h using 10.8 FPU/gds (filter paper activity unit per gram dry substrate) of enzyme loading, 88 g/L of biomass loading and 0.3% (w/v) of Tween-80. The corresponding cellulose conversion and hemicellulose conversion were 94.0% and 83.5%, respectively.

1. Introduction

Lignocellulosic biomass is a long-term feedstock with immense potential for the production of bioethanol, which can alleviate the global energy crisis and environmental quality deterioration [1]. Lignocellulosic substrates mainly contain three types of components, namely, cellulose, hemicellulose and lignin. Holocellulose, including cellulose and hemicellulose, can be hydrolyzed to sugar monomers, such as glucose and xylose, which can be utilized to produce ethanol during the fermentation process [2]. However, the presence of lignin can hinder the utilization of holocellulose by enzymes. Therefore, pretreatment is necessary to break down the lignocellulosic structure, reduce the lignin content, reduce the crystallinity of cellulose, increase the accessible surface area for the action of enzymes and enhance the enzymatic digestibility of holocellulose [3]. Among the different pretreatment methods, alkaline pretreatment can dissolve most of the lignin and the various produced uronic acid substitutions, which can inhibit the accessibility of cellulose during enzymatic hydrolysis [4]. Hydrogen peroxide is commonly used in the pulping and bleaching industries. It can react with the chromophores present in lignin, which results in the bleaching of substrates [5]. In fact, an alkali reagent can be combined with hydrogen peroxide, which is named alkaline hydrogen peroxide (AHP) pretreatment. AHP pretreatment has many favorable properties, such as mild temperature and pressure, readily available reagents with low toxicity and low environmental impact, downstream processing compatibility and high efficiency [6]. In previous reports, AHP was adopted to pretreat some lignocellulosic substrates, such as corn stover [7], rice husk [8] and sugarcane bagasse [9], and it was shown to be an effective pretreatment method. Under alkaline conditions, especially close to pH 11.5, hydrogen peroxide will dissociate to produce hydroperoxyl anion (HOO), which is responsible for the corresponding carbonyl and ethylene groups’ oxidative reactions and is an initiator for radical formation. The hydroperoxyl anions (HOO) will react with hydrogen peroxide to produce the highly reactive hydroxyl radical (HO·) and superoxide anion radical (O2·), which can cause lignin to be oxidized and depolymerized into low-molecular-weight fragments [10]. It is noteworthy that hydroperoxyl anions (HOO) are more selective than radicals to attack lignin rather than holocellulose, which can reduce the degradation of holocellulose. Furthermore, the action of hydrogen peroxide can be optimized with the use of modeling [11]. Even so, the optimization of an AHP pretreatment is also crucial to further reduce the input cost of pretreatment, retain a larger amount of holocellulose and realize higher delignification simultaneously.
During the enzymatic hydrolysis of the pretreated lignocellulosic substrates for fermentable sugar production, cellulases and xylanases are always used. Cellulose can be hydrolyzed via the synergy actions of β-1, 4-endoglucanases (EC 3.2.1.4); β-1, 4-exoglucanases, which are also named cellobiohydrolases (EC 3.2.1.91); and β-D-glucosidases (EC 3.2.1.21). Hemicellulose (xylan) can be hydrolyzed through the coordination of endoxylanases (EC 3.2.1.8) and β-xylosidases (EC 3.2.1.37). No matter what type of enzymes are used, enzymatic activities can be influenced by factors including temperature, pH, enzyme loading and biomass loading. Therefore, it is necessary to optimize the enzymatic hydrolysis of the pretreated substrates to enhance sugar yields and enzymatic hydrolysis efficiency. In addition, the adoption of inexpensive enzymes and substrates during enzymatic hydrolysis can reduce the input cost of hydrolysis.
Wheat straw (WS) is an abundant and cheap lignocellulosic residue in North China, which makes it possible to be applied to fermentable sugar production at a large scale. Response surface methodology (RSM) is a statistical modeling technique that can establish a multivariate equation based on quantitative data in the designed experiments [12,13]. With the use of RSM, the objective of this work was to optimize the AHP pretreatment of WS and enzymatic hydrolysis of the pretreated WS to enhance fermentable sugar yields for bioethanol production.

2. Materials and Methods

2.1. Biomass and Chemicals

WS was obtained from a nearby farm in Liaocheng, Shandong Province, China. The WS was cut to 1–2 cm in length without grinding and was dried at 85 °C until a constant weight was achieved. Sodium hydroxide (AR), hydrogen peroxide (30%, w/w, AR), D-glucose (AR), acetic acid (AR), sodium acetate (AR) and Tween-80 (CP) were purchased from Xilong Scientific Co., Ltd., Shantou, China. D-xylose (BR) was purchased from Sinopharm Chemical Reagent Co., Ltd., Shanghai, China.

2.2. Enzymes Production, Extraction and Activities Assays

The cellulase preparation was achieved with Aspergillus niger HQ-1 (accession number of ITS sequence: HQ891869) in a laboratory according to methods described in our previous report [14] and the Supplementary Materials. Cellulase and xylanase activities were also assayed and defined according to the methods in the Supplementary Materials. After the optimization of the cellulases extraction (Tables S1–S6), the cellulases preparation containing 6.13 filter paper activity units/mL (6.13 FPU/mL) and 889.18 xylanase activity unit/mL (889.18 XU/mL) was obtained.

2.3. Optimization of Alkaline Hydrogen Peroxide Pretreatment

With the use of 250 mL triangle flasks, pretreatment was carried out by soaking WS in 100 mL hydrogen peroxide solution at pH 11.5, which was adjusted using a 5.0 M sodium hydroxide solution. Different pretreatment conditions were designed based on the Plackett–Burman design (PBD), and five variables, namely, pretreatment temperature, solid loading, hydrogen peroxide concentration, agitation speed and pretreatment time, were adopted in the PBD (Table S7). Two levels, namely, low level (−1) and high level (+1), of the tested variables—pretreatment time (25 °C, 35 °C), solid loading (100, 200, g/L), hydrogen peroxide concentration (10, 25, g/L), agitation speed (100 rpm, 150 rpm) and pretreatment time (3.0 h, 5.0 h)—were adopted. The pretreated WS was washed and filtered with double-distilled water till neutrality. After being dried in an oven at 80 °C for 24 h, the pretreated WS was hydrolyzed under initial conditions (Section 2.5.1). The produced glucose and xylose yields from the pretreated WS were adopted as responses for the optimization of pretreatment. Based on the analysis of the PBD, significant variables for pretreatment, including temperature, hydrogen peroxide concentration and time, were screened and their optimal regions were detected using the method of steepest ascent (Table S8). Finally, the optimal values of the variables were determined using a Box–Behnken design (BBD) (Table S9). Each variable was investigated at three levels, namely, low level (−1), middle level (0) and high level (+1). Twelve experimental trials with different combinations of three variables, namely, temperature (43 °C, 49 °C and 55 °C), hydrogen peroxide concentration (55, 70 and 85 g/L) and time (6.9 h, 7.5 h and 8.1 h), along with three replication trials of the center points were designed. All experiments were performed in triplicate and the obtained data were used with the least squares method to fit the second-order polynomial model, as given by the following Equation (1):
Y = β0 + ∑βixi + ∑βiixi2 + ∑βijxixj
in which Y is the predicted response, β0 is the intercept term, βi is the linear coefficient, βii is the squared coefficient and βij is the interaction coefficient.

2.4. Chemical Composition Analyses and Calculations

The contents of cellulose, hemicellulose and lignin in the obtained WS pretreated under the optimized conditions and raw WS were determined three times according to the methods described by Aravantinos-Zafiris et al. (1994) [15]. Solid recovery, cellulose recovery, hemicellulose recovery and lignin removal were calculated based on the following equations:
Solid recovery (%) = (DW1/DW0) × 100%
where DW1 is the dry weight of WS recovered after pretreatment (g) and DW0 is the dry weight of WS before pretreatment (g);
Cellulose recovery (%) = (RCPT-WS × SR/CWS) × 100%
where SR is the solid recovery after pretreatment and CWS and RCPT-WS are the amounts of cellulose in raw and pretreated WS expressed in g/g, respectively;
Hemicellulose recovery (%) = [RHCPT-WS × SR/HCWS] × 100%
where SR is the solid recovery after pretreatment and HCWS and RHCPT-WS are the amounts of hemicellulose in raw and pretreated WS expressed in g/g, respectively;
Lignin removal (%) = [(LWS − RLPT-WS × SR)/LWS] × 100%
where SR is the solid recovery after pretreatment and LWS and RLPT-WS are the amounts of lignin in raw and pretreated WS expressed in g/g, respectively.

2.5. Initial Enzymatic Hydrolysis Conditions and Optimization of Enzymatic Hydrolysis

2.5.1. Initial Enzymatic Hydrolysis Conditions

At first, the pretreated WS was incubated in 100 mL sodium acetate buffer (50 mM, pH 4.4) containing 0.3% (w/v) Tween-80 at 20 g/L of biomass loading in 250 mL Erlenmeyer flasks. The antibiotics tetracycline (40 µg/mL) and cycloheximide (30 µg/mL) were supplemented in the mixture to prevent microbial contamination. Then, the enzyme preparation was added mainly according to 5.0 FPU/gds (filter paper activity unit per gram dry substrate) of enzyme loading in the reaction mixture. Enzymatic hydrolysis was performed at 50 °C and 120 rpm for 26.0 h. Finally, the residues were separated via centrifugation at 13,980× g (10,000 rpm) for 10 min and the obtained supernatant was collected to determine the monosaccharide contents. The monosaccharides (glucose and xylose) were determined via HPLC (Agilent 1200 series; Hewlett-Packard, Palo Alto, CA, USA) equipped with an Aminex HPX-87H ion exclusion column (300 × 7.8 mm; Bio-Rad Laboratories, Hercules, CA, USA) and a differential refraction detector using 5.0 mM H2SO4 as an eluent at a flow rate of 0.6 mL/min. The yields of glucose and xylose were expressed as milligrams per gram of dry substrate (mg/gds). The control of each reaction mixture was performed by replacing the active crude enzymes with heat-inactivated (100 °C, 10 min) enzymes.

2.5.2. Optimization of Enzymatic Hydrolysis

In the first step, PBD was also adopted to investigate the effects of the variables during enzymatic hydrolysis (Table S10). Two levels, namely, low level (−1) and high level (+1), of six variables, namely, reaction time (26.0 h, 30.0 h), reaction temperature (50.0 °C, 55.0 °C), enzyme loading (3.0 FPU/gds, 7.0 FPU/gds), reaction pH (4.4, 4.8), biomass loading (20, 40 g/L) and Tween-80 concentration (0.3%, 0.5% w/v), were adopted. The glucose and xylose yields were determined and regarded as responses during the optimization. Based on the analysis of the PBD, significant variables, including the reaction time, enzyme loading and biomass loading, were measured and their optimal regions were investigated using the method of steepest ascent (Table S11). Lastly, a central composite design (CCD) with twenty trials was employed to determine the optimal values of the significant variables (Table S12). Five levels, namely, −1.682, −1, 0, +1 and +1.682 (coded values), of the significant variables, namely, reaction time (29.3 h, 32.0 h, 36.0 h, 40.0 h and 42.7 h), enzyme loading (4.95 FPU/gds, 7.0 FPU/gds, 10.0 FPU/gds, 13.0 FPU/gds and 15.05 FPU/gds) and biomass loading (56.4, 70, 90, 110 and 123.6 g/L), were designed. All experiments were performed in triplicate and yields of glucose and xylose were used as responses. The obtained data were analyzed using the least squares method to fit the second-order polynomial model given by the following Equation (6):
Y = β0 + β1X1 + β2X2 + β3X3 + β11X12 + β22X22 + β33X32 + β12X1X2 + β13X1X3 + β23X2X3
in which Y is the predicted response; X1, X2 and X3 are the coded variables; β0 is the intercept; β1, β2 and β3 are the linear coefficients; β11, β22 and β33 are the squared coefficients; and β12, β13 and β23 are the interaction coefficients.

2.6. Calculations for Enzymatic Hydrolysis

The cellulose conversion and hemicellulose conversion were calculated according to the following equations:
Cellulose conversion (%) = (Mg × 0.9/Mc) × 100%
Hemicellulose conversion (%) = (Mx × 0.88/Mh) × 100%
where Mg is the amount of glucose from the pretreated WS (mg/gds); Mc is the amount of cellulose in the pretreated WS (mg/gds); Mx is the amount of xylose from the pretreated WS (mg/gds); Mh is the amount of hemicellulose in the pretreated WS (mg/gds); and 0.9 and 0.88 are the conversion factors of glucose and xylose, respectively.

2.7. Statistical Analysis

Minitab (14.12) statistical software package and Statistical Analysis System (SAS, 8.0) were used for the experimental design and analysis of the results. The significance was tested at various probability levels using the F test (p ≤ 0.05).

3. Results and Discussions

3.1. Optimization of Alkaline Hydrogen Peroxide Pretreatment of Wheat Straw

The degradation of holocellulose occurs along with delignification, which indicates that holocellulose recovery and lignin removal are not suitable responses during pretreatment. The main aim of pretreatment is to enhance the enzymatic digestibility of substrates for higher yields of fermentable sugar during the following enzymatic hydrolysis. Therefore, glucose and xylose yields during enzymatic hydrolysis of the pretreated WS were more suitable responses for the pretreatment optimization. It was reported that a mild temperature (<100 °C) can achieve significant delignification and high glucan enrichment during AHP pretreatment [16,17]. In addition, too high of a temperature can result in more carboxylic acids, such as acetic acid, because acetyl groups are removed from hemicellulose during pretreatment. The produced acids can markedly change the pH in a reaction mixture from pH 11.9 to pH 5.63 [10]. During AHP pretreatment, pH 11.5 is always adopted, as hydrogen peroxide will dissociate to produce the hydroperoxyl anion (HOO), which is responsible for delignification [10]. Therefore, a mild temperature (<100 °C) and pH 11.5 were prioritized in this work.
According to the analysis of the PBD (Table 1), the pretreatment temperature, hydrogen peroxide concentration and pretreatment time had significant effects on the sugar production. The temperature and time also have significant effects during the pretreatment of corn stover [18] and wheat straw [19]. The temperature had a positive effect on the sugar production, as a higher temperature could enhance the reaction rate constant. A high temperature can also improve the pretreatment efficiency of oil palm trunks [20] and corn stover [21,22], respectively. In addition, the hydrogen peroxide concentration also had a positive effect on sugar production, as a higher concentration of it could improve the delignification degree. The other factors, including the solid loading and agitation speed, had insignificant effects on the sugar yields. The optimization of the significant factors was carried out in subsequent experiments by adopting a lower agitation speed (100 rpm) and higher solid loading (200 g/L).
The results indicate that both the glucose and xylose yields reached a plateau while the pretreatment temperature, hydrogen peroxide concentration and pretreatment time were 49.0 °C, 70 g/L and 7.5 h, respectively. Too low levels of the three factors can result in lower delignification and too high levels can degrade more holocellulose, along with produce higher delignification, which is also not conducive to fermentable sugar yields. The statistical analysis of the BBD (Table 2) indicated that the linear terms, namely, x1, x2 and x3, and the square terms, namely, x12, x22 and x32, had significant effects on the glucose and xylose yields. The interaction terms, namely, x1x2, x1x3 and x2x3, had insignificant effects on the glucose yield, whereas only x1x3 had a significant effect on the xylose yield. F values of the models (F = 86.69, F = 94.83) and lack of fit (F = 6.23, F = 7.83), along with p-values of the models (p = 0.000, p = 0.000) and lack of fit (p = 0.141, p = 0.115), indicate that the obtained experimental data for glucose and xylose yields were a good fit with the models, respectively. The values of R2 (99.4%, 99.4%) and adjusted R2 (98.2%, 98.4%) also indicate the accuracy of the models.
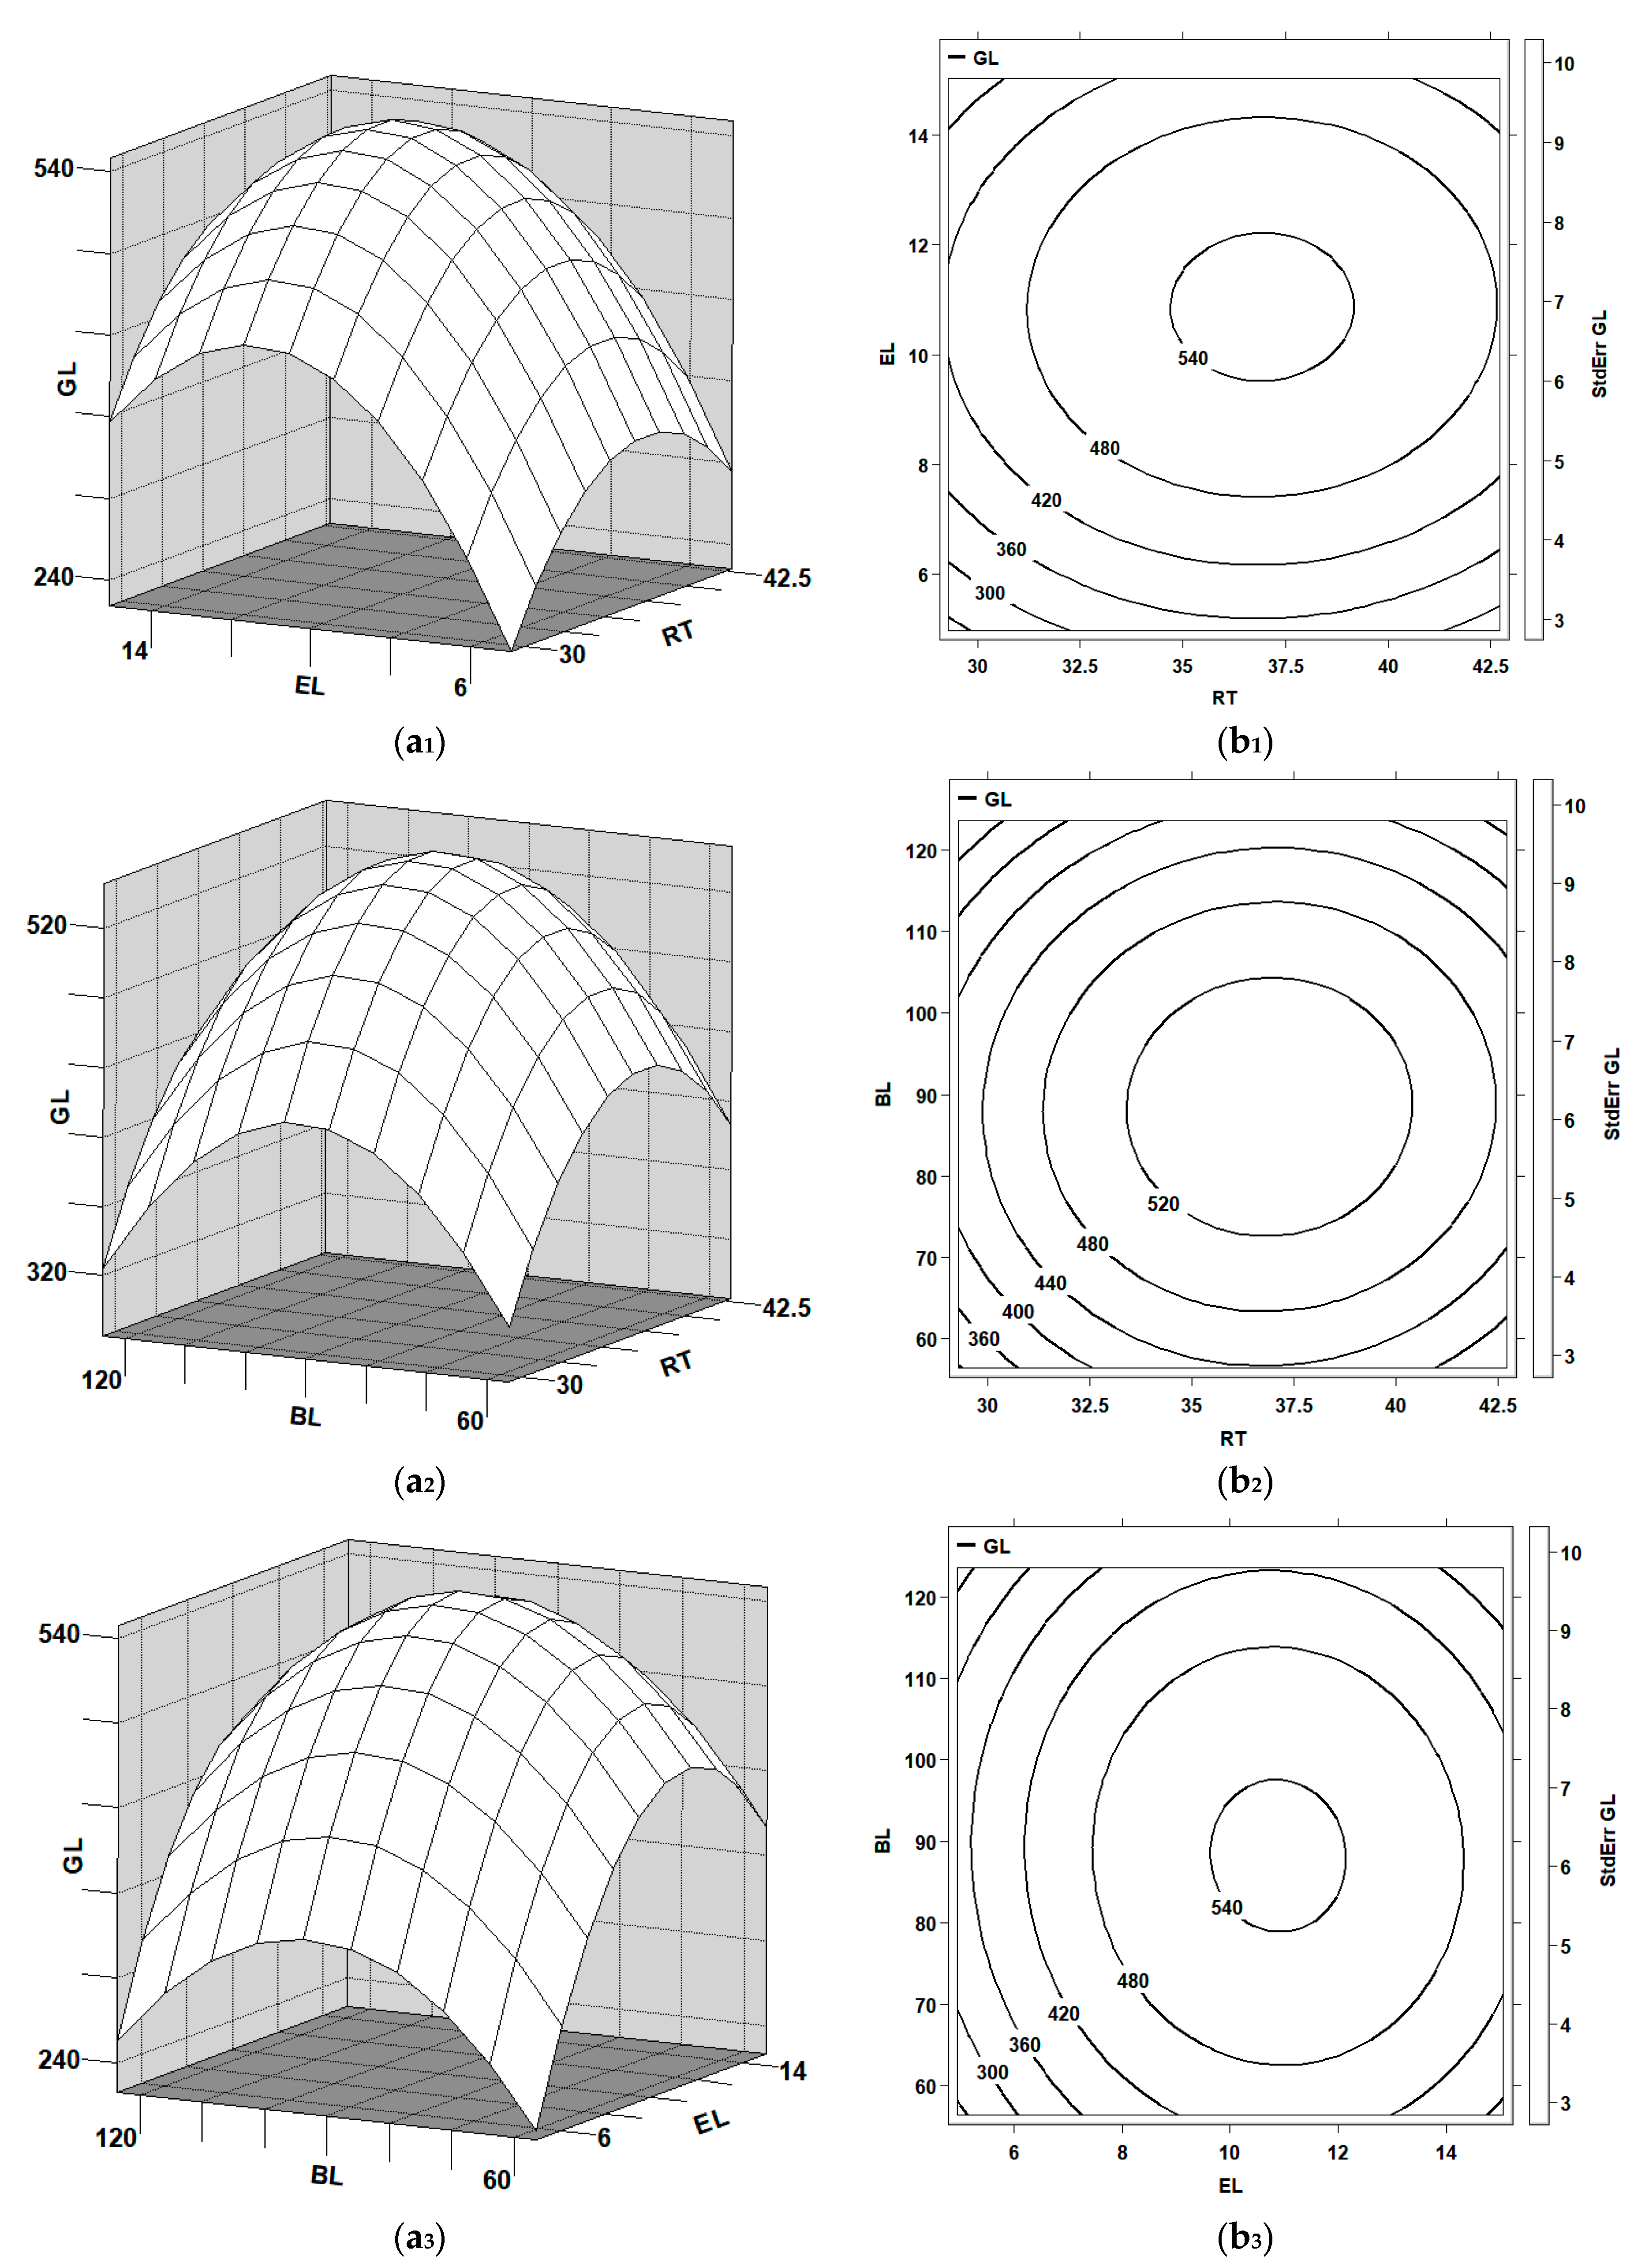
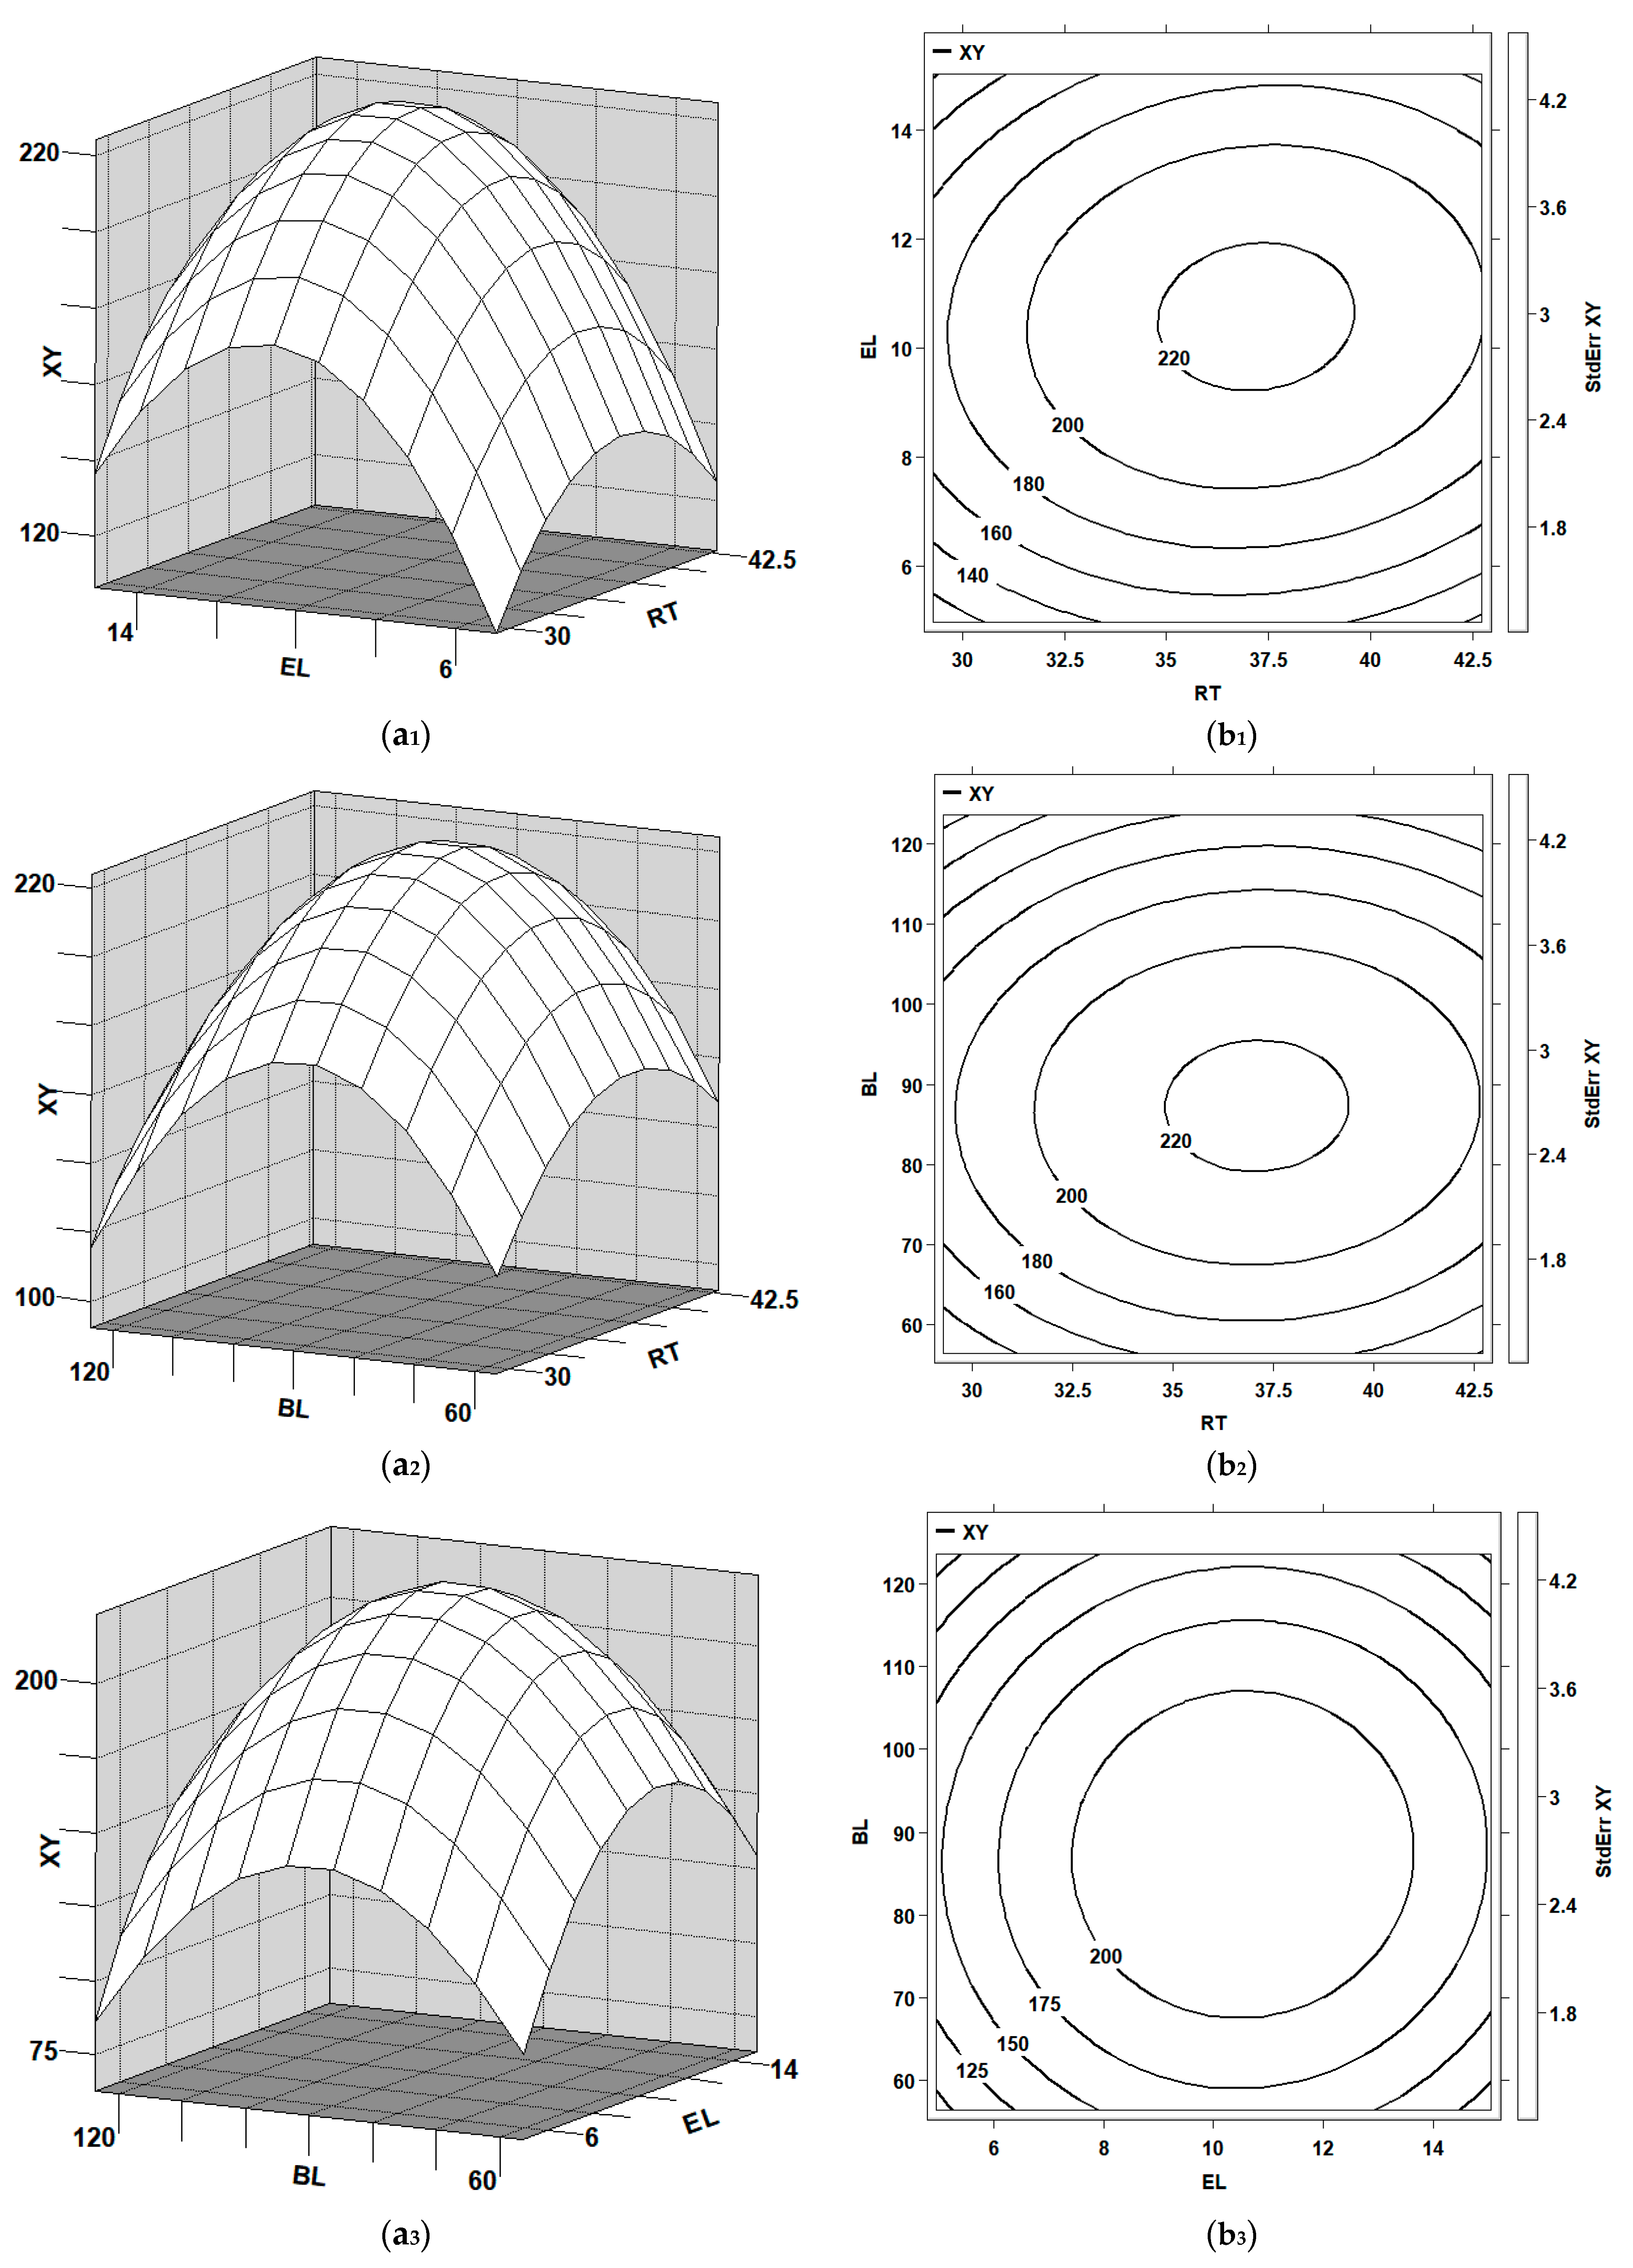
Three-dimensional response surface plots and the corresponding contour plots were used to demonstrate the combined effects of each variable’s pair on yields of glucose and xylose, as shown in Figure 1 and Figure 2, respectively. As shown in Figure 1(a1,b1) and Figure 2(a1,b1), while the time was fixed at its middle level (7.5 h), the optimal regions of the temperature and hydrogen peroxide concentration for the yields of glucose and xylose were 48 °C–50 °C and 70 g/L–75 g/L, respectively. As shown in Figure 1(a2,b2), while the hydrogen peroxide concentration was set to be its middle level (70 g/L), the optimal regions of the temperature and time for the glucose yield were 48 °C–50 °C and 7.4 h–7.6 h, respectively. Under the same conditions in Figure 2(a2,b2), the optimal regions of the temperature and time for the xylose yield were 48 °C–50 °C and 7.6 h–7.8 h, respectively. As shown in Figure 1(a3,b3), while the temperature was fixed at its middle level (49 °C), the optimal regions of the hydrogen peroxide concentration and time for the glucose yield were 70 g/L–75 g/L and 7.4 h–7.6 h, respectively. Under the same conditions in Figure 2(a3,b3), the optimal regions of the hydrogen peroxide concentration and time for the xylose yield were 70 g/L–75 g/L and 7.6 h–7.8 h, respectively.
According to canonical analysis, the maximal glucose (233.7 mg/gds) could be obtained while WS was pretreated using 71 g/L hydrogen peroxide solution (x2 = 0.084) at 49.5 °C (x1 = 0.085) for 7.5 h (x3 = 0.056). The maximal xylose (91.9 mg/gds) could be obtained while WS was pretreated using 72 g/L hydrogen peroxide solution (x2 = 0.14405) at 49.6 °C (x1 = 0.11218) for 7.7 h (x3 = 0.25303).
To validate the predicted conditions, the WS was pretreated using 71 g/L hydrogen peroxide solution at 50 °C for 7.6 h. After the enzymatic hydrolysis, the yields of glucose (234.2 mg/gds) and xylose (92.5 mg/gds) (average of three replicates) were obtained, which were close to the predicted values from the models.
In addition, the contents of cellulose, hemicellulose and lignin in the raw WS (dry weight 20.00 g) were 43.52%, 22.41% and 9.80%, respectively. After pretreatment, the contents of cellulose, hemicellulose and lignin in the pretreated WS (dry weight 16.04 g) were 52.92%, 23.56% and 3.05%, respectively. After the calculation, the pretreatment resulted in 80.2% solid recovery, 97.5% cellulose recovery, 84.3% hemicellulose recovery and 75.0% lignin removal, respectively. Comparisons of the above parameters in this work with those in other previous reports are shown in Table 3.
It was obvious that cellulose recovery (97.5%) and hemicellulose recovery (84.3%) in this work were the most competitive among the different reports. Though the lignin removal of other studies, namely, 95.2% [23] and 78.7% [24], were higher than that (75.0%) in this work, the cellulose recovery (92.59%, 83.1%) and hemicellulose recovery (31.39%, 45.4%) in the two previous reports were lower than those (97.5%, 84.3%) in this work. This indicates that higher delignification could result in more degradation of holocellulose. Compared with the lignin removal in other studies, including 56.5% [25], 62.1% [26], 67.6% [27] and 71.4% [28], the lignin removal (75.0%) in this work was more competitive, which could facilitate the enzymatic digestibility of holocellulose. In conclusion, the optimized pretreatment conditions in this work could retain holocellulose in a large amount, along with simultaneously producing a relatively considerable lignin removal.
Relative to the pretreatment conditions in different reports in Table 3, the solid loading (200 g/L) adopted in this work was the most competitive, which could enhance pretreatment efficiency and reduce the requirement of reaction vessels. Of course, direct comparisons of temperature and time were not available, as higher temperature always corresponded with shorter time and lower temperature corresponded with longer time, respectively. Even so, the pretreatment temperature (50 °C) in this work was similar to that (50 °C) described by Yu et al. (2020) [24]. Meanwhile, the time (7.6 h) in this work was shorter than that (24 h) in the work described by Yu et al. (2020) [24], which indicates that the optimized pretreatment conditions in this work could enhance the pretreatment efficiency and reduce the energy cost for pretreatment. Although the time (7.6 h) in this work was longer than that (6.0 h) described by Zhao et al. (2017) [27], the higher solid loading (200 g/L) and lower temperature (50 °C) in this work were more competitive. Furthermore, compared with pretreatment conditions described by Li et al. (2019) [23], Yu et al. (2020) [24], Chen et al. (2018) [25] and Yuan et al. (2018) [26], the uncomplicated experimental operations in this work could reduce manual operations and facilitate large-scale application.

3.2. Optimization of Enzymatic Hydrolysis of the Pretreated Wheat Straw

Tween-80 can protect the activation of cellulases, which may be decreased by lignin; swell the fiber; increase the surface area; and improve the adsorption of enzyme to cellulose [29]. Therefore, it was adopted during the enzymatic hydrolysis in this work. The statistical analysis of PBD in Table 4 indicated that the reaction time, enzyme loading and biomass loading had significant effects on glucose and xylose yields. Gupta and Parkhey (2014) [30] and Pandey and Negi (2015) [31] reported similar results for the enzymatic hydrolysis of fallen pine foliage and rice straw, respectively. The reaction time plays an important role during enzymatic hydrolysis. Insufficient reaction time can result in low sugar yields, whereas sugar yields always decrease in the later stage of enzymatic hydrolysis due to the recrystallization of cellulose and attachment of enzymes on the amorphous regions of cellulose. Enzyme loading always has an important effect on sugar yields. Too low of an enzyme loading is unfavorable to sugar yields, whereas too high of an enzyme loading is also adverse to sugar yields by increasing the rate of transglycosylation reactions, along with hydrodynamic instability, improper mixing and suspension of slurry [32]. Biomass loading also has an important role during enzymatic hydrolysis. Too low of a biomass loading can enhance the requirement of reaction vessels. Too high of a biomass loading can result in poor stirring, enzymatic feedback inhibition by end-products and a decrease in the synergistic action of cellulases. In this work, the Tween-80 concentration had an insignificant effect on the sugar yields, which was similar to the results reported by Jin et al. (2016) [33]. In addition, the reaction temperature had a negative effect and the reaction pH had a positive effect on sugar yields. Meanwhile, the reaction temperature had a significant on sugar yields during the enzymatic hydrolysis of sugarcane bagasse [34]. The reaction pH had a significant effect on the enzymatic hydrolysis of cotton stalk [35]. Different effects of the same factors on sugar yields were perhaps related to differences in substrates and cellulase properties. Based on the above results, enzymatic hydrolysis was carried out at 50 °C and pH 4.8 with a supplement of Tween-80 (0.3%, w/v) in the following steps.
The results of the steepest ascent method indicate that the glucose and xylose yields reached a plateau while the reaction time, enzyme loading and biomass loading were 36.0 h, 10.0 FPU/gds and 90 g/L, respectively. The analysis results of the CCD are shown in Table 5. It indicates that the linear terms, namely, X1, X2 and X3, and square terms, namely, X12, X22 and X32, had significant effects on the glucose and xylose yields. The interaction terms, namely, X1X2, X1X3 and X2X3, had insignificant effects on the glucose yield. Meanwhile, only X1X2 had a significant effect on the xylose yield. High F values of the models (199.12, 203.66) and lack of fit (3.40, 3.25), along with p-values of the models (p = 0.000, p = 0.000) and lack of fit (p = 0.103, p = 0.111), indicate that the obtained data were a good fit with the models. High values of R2 (99.4%, 99.5%) and adjusted R2 (98.9%, 99.0%) also demonstrated the accuracy of the models.
Three-dimensional response surface plots and the corresponding contour plots to demonstrate the combined effects of each variable’s pair on glucose and xylose yields are shown in Figure 3 and Figure 4, respectively. As shown in Figure 3(a1,b1) and Figure 4(a1,b1), the optimal region of the reaction time was 35.0 h–37.5 h and that of the enzyme loading was 10.0 FPU/gds–12.0 FPU/gds while the biomass loading was fixed at its middle level (90 g/L). As shown in Figure 3(a2,b2) and Figure 4(a2,b2), the optimal region of the reaction time was 35.0 h–37.5 h and that of the biomass loading was 80 g/L–90 g/L while the enzyme loading was fixed at its middle level (10.0 FPU/gds). As shown in Figure 3(a3,b3) and Figure 4(a3,b3), the optimal region of enzyme loading was 10.0 FPU/gds–12.0 FPU/gds and that of biomass loading was 80 g/L–90 g/L while reaction time was fixed at its middle level (36.0 h).
According to canonical analysis, the maximal glucose yield (551.1 mg/gds) could be obtained while the pretreated WS was hydrolyzed at 50 °C and pH 4.8 for 36.9 h (X1 = 0.22817) with 10.9 FPU/gds of enzyme loading (X2 = 0.29383) and 88 g/L of biomass loading (X3 = −0.08301). The maximal xylose (224.9 mg/gds) could be obtained while the pretreated WS was hydrolyzed at 50 °C and pH 4.8 for 37.2 h (X1 = 0.29130) by adopting 10.6 FPU/gds of enzyme loading (X2 = 0.19146) and 87 g/L of biomass loading (X3 = −0.12648) with a supplement of Tween-80 (0.3% w/v).
After an adjustment, three confirmatory experiments for enzymatic hydrolysis were carried out at 50 °C and pH 4.8 for 37.0 h with the use of 10.8 FPU/gds of enzyme loading and 88 g/L of biomass loading. The average yields of glucose (552.7 mg/gds) and xylose (223.6 mg/gds) could be obtained, which were close to the predicted values. Compared with the yields of glucose (234.2 mg/gds) and xylose (92.5 mg/gds) before optimization, the optimization resulted in a 1.36-fold increase in the glucose yield and a 1.42-fold increase in the xylose yield. After the calculation, cellulose and hemicellulose conversion were 94.0% and 83.5%, respectively.
Comparisons of sugar yields, along with enzymatic hydrolysis conditions, between different reports are shown in Table 6. It is obvious that the glucose yield (562.9 mg/gds) described by Yu et al. (2020) [24] was higher than that (552.7 mg/gds) in this work. Compared with the other six reports, the glucose yield (552.7 mg/gds) in this work was more competitive. As shown in Table 6, the xylose yield (223.6 mg/gds) in this work was higher than those in the other five reports. Though the higher glucose yield (562.9 mg/gds) and shorter reaction time (12 h) described by Yu et al. (2020) [24] were more competitive than those in this work, the adoption of commercial cellulases and lower biomass loading (30 g/L) could increase the enzyme cost and requirement of reaction vessels. Compared with the biomass loading and reaction time in the other six reports, the higher biomass loading (88 g/L) and shorter reaction time (37.0 h) in this work could reduce the enzymatic hydrolysis cost and enhance hydrolysis efficiency. Direct comparisons of enzyme loading in different reports were not available, as the enzyme assay conditions differed from each other. Even so, the enzyme loading (10.8 FPU/gds) in this work was lower than 66.3 FPU/gds [24], 38.2 FPU/gds [27,28], 40.4 FPU/gds [36], 39.7 FPU/gds [37] and 53.9 FPU/gds [38]. The adoption of lower enzyme loading could reduce the enzyme input cost. Though 10.0 FPU/gds adopted by Patel et al. (2017) [39] was lower than that (10.8 FPU/gds) in this work, the adoption of commercial cellulases in that work could enhance the enzyme input cost. In addition, the cellulose and hemicellulose conversions (94.0%, 83.5%) in this work were the most competitive among the reports in Table 6. Higher cellulose conversion and hemicellulose conversion were related to higher enzymatic digestibility of holocellulose in the pretreated WS. Therefore, the optimized enzymatic hydrolysis conditions could enhance the sugar yields, along with higher cellulose and hemicellulose conversion, by using a lower enzyme loading, higher biomass loading and shorter reaction time.

4. Conclusions

The adoption of high solid loading (200 g/L) under the optimized pretreatment conditions and biomass loading (88 g/L) under the optimized enzymatic hydrolysis conditions could reduce the vessel and input costs for sugar production. Satisfactory levels of cellulose recovery (97.5%), hemicellulose recovery (84.3%) and lignin removal (75.0%) could be obtained under the optimized pretreatment conditions. Considerable glucose (552.7 mg/gds) and xylose (223.6 mg/gds) yields, along with higher cellulose conversion (94.0%) and hemicellulose conversion (83.5%), could be obtained under the optimized enzymatic hydrolysis conditions. In addition, the adoption of self-produced cellulases for enzymatic hydrolysis in this work could also reduce the enzyme cost for sugar production. In the future, the optimization of bioethanol production utilizing fermentable sugar from the pretreated WS will be carried out to investigate the application prospects of the results found in this work.

Supplementary Materials

The following supporting information can be downloaded from https://www.mdpi.com/article/10.3390/fermentation9100871/s1, Supplementary materials S1: Materials and methods for optimization of cellulases extraction from Aspergillus niger HQ-1; Supplementary materials S2: Results of optimization of cellulases extraction from Aspergillus niger HQ-1; Table S1: Codes and levels of four variables and Plackett-Burman design (PBD) along with filter paper activity during optimization of cellulases extraction; Table S2: Coefficients of regression for filter paper activity by Aspergillus niger HQ-1; Table S3: Design of the steepest ascent method along with filter paper activity during optimization of cellulases extraction; Table S4: Codes and levels of variables and BBD along with filter paper activity during optimization of cellulases extraction; Table S5: Estimated regression coefficients for filter paper activity during optimization of cellulases extraction; Table S6: Analysis of variance (ANOVA) for the fitted quadratic polynomial model for cellulases extraction; Table S7: Codes and levels of five variables and Plackett-Burman design (PBD) along with glucose and xylose yields during optimization of pretreatment; Table S8: Design of the steepest ascent method along with glucose and xylose yields during optimization of pretreatment; Table S9: Codes and levels of variables and BBD along with glucose and xylose yields during optimization of pretreatment; Table S10: Codes and levels of six variables and Plackett-Burman design (PBD) along with glucose and xylose yields during optimization of enzymatic hydrolysis; Table S11: Design of the steepest ascent method along with glucose and xylose yields during optimization of enzymatic hydrolysis; Table S12. Codes and levels of variables and CCD along with glucose and xylose yields during optimization of enzymatic hydrolysis.

Author Contributions

H.Z. conceived and designed all the experiments. H.Z. performed the pretreatment optimization experiments and analyzed the data. J.W. performed the experiments including optimization of enzymatic hydrolysis and cellulases extraction by A. niger HQ-1 and analyzed the data. H.Z. wrote, reviewed and edited the manuscript. All authors have read and agreed to the published version of the manuscript.

Funding

This research was financially supported by projects from the Natural Science Foundation of Shandong Province, China (ZR2010CQ042).

Institutional Review Board Statement

This article does not contain any studies with animals performed by any of the authors.

Informed Consent Statement

Not applicable.

Data Availability Statement

All data are incorporated into the article and its online Supplementary Materials.

Acknowledgments

The authors Hui Zhang and Junhui Wu greatly thank Zhilin Yuan from the Research Institute of Subtropical Forestry, China Academy of Forestry, for his valuable assistance in the determination of glucose and xylose in the hydrolysate from the pretreated wheat straw powder using high-performance liquid chromatography (HPLC).

Conflicts of Interest

The authors declare that the article is original, and they have no competing financial interests or personal relationships that could have appeared to influence the work reported in this paper. It is not under consideration for publication elsewhere, and if accepted, the article will not be published elsewhere in the same form, in any language, without the written consent of the publisher.

Abbreviations

AHPAlkaline hydrogen peroxide
WSWheat straw
RSMResponse surface methodology
PBDPlackett–Burman design
CCDCentral composite design
BBDBox–Behnken design
FPU/mLFilter paper activity unit per milliliter
XU/mLXylanase activity unit per milliliter
FPU/gdsFilter paper activity unit per gram dry substrate
mg/gdsMilligram per gram dry substrate
SRSolid recovery
CRCellulose recovery
HRHemicellulose recovery
LRLignin removal
PTEPretreatment temperature
HPCHydrogen peroxide concentration
PTIPretreatment time
GLGlucose
XYXylose
RTReaction time
ELEnzyme loading
BLBiomass loading

References

  1. Aditiya, H.B.; Mahlia, T.M.I.; Chong, W.T.; Nur, H.; Sebayang, A.H. Second generation bioethanol production: A critical review. Renew. Sustain. Energy Rev. 2016, 66, 631–653. [Google Scholar] [CrossRef]
  2. Asghar, U.; Irfan, M.; Iram, M.; Huma, Z.; Nelofer, R.; Nadeem, M.; Syed, Q. Effect of alkaline pretreatment on delignification of wheat straw. Nat. Prod. Res. 2015, 29, 125–131. [Google Scholar] [CrossRef] [PubMed]
  3. Irfan, M.; Asghar, U.; Nadeem, M.; Nelofer, R.; Syed, Q.; Shakir, H.A.; Qazi, J.I. Statistical Optimization of Saccharification of Alkali Pretreated Wheat Straw for Bioethanol Production. Waste Biomass Valorization 2016, 7, 1389–1396. [Google Scholar] [CrossRef]
  4. Khuong, L.D.; Kondo, R.; Leon, R.D.; Anh, T.K.; Shimizu, K.; Kamei, I. Bioethanol production from alkaline-pretreated sugarcane bagasse by consolidated bioprocessing using Phlebia sp. MG-60. Int. Biodeterior. Biodegrad. 2014, 88, 62–68. [Google Scholar] [CrossRef]
  5. Tofani, G.; Cornet, I.; Tavernier, S. Estimation of hydrogen peroxide effectivity during bleaching using the Kappa number. Chem. Pap. 2021, 75, 5749–5758. [Google Scholar] [CrossRef]
  6. Silva Martins, L.H.; Rabelo, S.C.; Costa, A.C. Effects of the pretreatment method on high solids enzymatic hydrolysis and ethanol fermentation of the cellulosic fraction of sugarcane bagasse. Bioresour. Technol. 2015, 191, 312–321. [Google Scholar] [CrossRef]
  7. Banerjee, G.; Car, S.; Liu, T.; Williams, D.L.; Meza, S.L.; Walton, J.D.; Hodge, D.B. Scale-up and integration of alkaline hydrogen peroxide pretreatment, enzymatic hydrolysis, and ethanolic fermentation. Biotechnol. Bioeng. 2012, 109, 922–931. [Google Scholar] [CrossRef]
  8. Díaz, A.B.; Blandino, A.; Belleli, C.; Caro, I. An effective process for pretreating rice husk to enhance enzyme hydrolysis. Ind. Eng. Chem. Res. 2014, 53, 10870–10875. [Google Scholar] [CrossRef]
  9. Meléndez-Hernández, P.A.; Hernández-Beltrán, J.U.; Hernández-Guzmán, A.; Morales-Rodríguez, R.; Torres-Guzmán, J.C.; Hernández-Escoto, H. Comparative of alkaline hydrogen peroxide pretreatment using NaOH and Ca(OH)2 and their effects on enzymatic hydrolysis and fermentation steps. Biomass Convers. Biorefinery 2021, 11, 1897–1907. [Google Scholar] [CrossRef]
  10. Ho, M.C.; Ong, V.Z.; Wu, T.Y. Potential use of alkaline hydrogen peroxide in lignocellulosic biomass pretreatment and valorization-A review. Renew. Sustain. Energy Rev. 2019, 112, 75–86. [Google Scholar] [CrossRef]
  11. Tofani, G.; Cornet, I.; Tavernier, S. Multiple linear regression to predict the brightness of waste fibre mixtures before bleaching. Chem. Pap. 2022, 76, 4351–4365. [Google Scholar] [CrossRef]
  12. Hu, Y.; Du, C.; Pensupa, N.; Lin, C.S.K. Optimisation of fungal cellulase production from textile waste using experimental design. Process Saf. Environ. 2018, 118, 133–142. [Google Scholar] [CrossRef]
  13. Saha, S.P.; Ghosh, S. Optimization of xylanase production by Penicillium citrinum xym2 and application in saccharification of agro-residues. Biocatal. Agric. Biotechnol 2014, 3, 188–196. [Google Scholar] [CrossRef]
  14. Zhang, H.; Sang, Q.; Zhang, W. Statistical optimization of cellulases production by Aspergillus niger HQ-1 in solid-state fermentation and partial enzymatic characterization of cellulases on hydrolyzing chitosan. Ann. Microbiol. 2012, 62, 629–645. [Google Scholar] [CrossRef]
  15. Aravantinos-Zafiris, G.; Oreopoulou, V.; Tzia, C.; Thomopoulos, C.D. Fibre fraction from orange peel residues after pectin extraction. LWT-Food Sci. Technol. 1994, 27, 468–471. [Google Scholar] [CrossRef]
  16. Costa, S.; Rugiero, I.; Larenas Uria, C.; Pedrini, P.; Tamburini, E. Lignin degradation efficiency of chemical pre-treatments on banana rachis destined to bioethanol production. Biomolecules 2018, 8, 141. [Google Scholar] [CrossRef]
  17. Yuan, Z.; Wei, W.; Li, G.; Kapu, N.S. High titer ethanol production from combined alkaline/alkaline hydrogen peroxide pretreated bamboo at high solid loading. Waste Biomass Valorization 2020, 11, 2795–2805. [Google Scholar] [CrossRef]
  18. Qin, L.; Liu, Z.H.; Jin, M.; Li, B.Z.; Yuan, Y.G. High temperature aqueous ammonia pretreatment and post-washing enhance the high solids enzymatic hydrolysis of corn stover. Bioresour. Technol. 2013, 146, 504–511. [Google Scholar] [CrossRef] [PubMed]
  19. Tsegaye, B.; Balomajumder, C.; Roy, P. Optimization of microwave and NaOH pretreatments of wheat straw for enhancing biofuel yield. Energy Convers. Manag. 2019, 186, 82–92. [Google Scholar] [CrossRef]
  20. Jung, Y.H.; Kim, I.J.; Kim, J.J.; Oh, K.K.; Han, J.I.; Choi, I.G.; Kim, K.H. Ethanol production from oil palm trunks treated with aqueous ammonia and cellulase. Bioresour. Technol. 2011, 102, 7307–7312. [Google Scholar] [CrossRef] [PubMed]
  21. Zhu, Y.; Lee, Y.Y.; Elander, R.T. Dilute-acid pretreatment of corn stover using a high-solids percolation reactor. Appl. Biochem. Biotechnol. 2004, 117, 103–114. [Google Scholar] [CrossRef] [PubMed]
  22. Nahar, N.; Pryor, S.W. Effects of reduced severity ammonia pretreatment on pelleted corn stover. Ind. Crops Prod. 2017, 109, 163–172. [Google Scholar] [CrossRef]
  23. Li, H.; Xiong, L.; Chen, X.; Luo, M.; Chen, X.; Wang, C.; Huang, C.; Chen, X. Enhanced enzymatic hydrolysis of wheat straw via a combination of alkaline hydrogen peroxide and lithium chloride/N, N-dimethylacetamide pretreatment. Ind. Crops Prod. 2019, 137, 332–338. [Google Scholar] [CrossRef]
  24. Yu, G.; Liu, S.; Feng, X.; Zhang, Y.; Liu, C.; Liu, Y.J.; Li, B.; Cui, Q.; Peng, H. Impact of ammonium sulfite-based sequential pretreatment combinations on two distinct saccharifications of wheat straw. RSC Adv. 2020, 10, 17129–17142. [Google Scholar] [CrossRef]
  25. Chen, X.; Li, H.; Sun, S.; Cao, X.; Sun, R. Co-production of oligosaccharides and fermentable sugar from wheat straw by hydrothermal pretreatment combined with alkaline ethanol extraction. Ind. Crops Prod. 2018, 111, 7885. [Google Scholar] [CrossRef]
  26. Yuan, Z.; Wen, Y.; Li, G. Production of bioethanol and value added compounds from wheat straw through combined alkaline/alkaline-peroxide pretreatment. Bioresour. Technol. 2018, 259, 228–236. [Google Scholar] [CrossRef]
  27. Zhao, Z.; Yang, Y.; Abdeltawab, A.A.; Yakout, S.M.; Chen, X.; Yu, G. Cholinium amino acids-glycerol mixtures: New class of solvents for pretreating wheat straw to facilitate enzymatic hydrolysis. Bioresour. Technol. 2017, 245, 625–632. [Google Scholar] [CrossRef]
  28. Zhao, Z.; Chen, X.; Ali, M.F.; Abdeltawab, A.A.; Yakout, S.M.; Yu, G. Pretreatment of wheat straw using basic ethanolamine-based deep eutectic solvents for improving enzymatic hydrolysis. Bioresour. Technol. 2018, 263, 325–333. [Google Scholar] [CrossRef]
  29. Zhang, H.; Lyu, G.; Zhang, A.; Li, X.; Xie, J. Effects of ferric chloride pretreatment and surfactants on the sugar production from sugarcane bagasse. Bioresour. Technol. 2018, 265, 93–101. [Google Scholar] [CrossRef] [PubMed]
  30. Gupta, P.; Parkhey, P. A two-step process for efficient enzymatic saccharification of rice straw. Bioresour. Technol. 2014, 173, 207–215. [Google Scholar] [CrossRef] [PubMed]
  31. Pandey, A.K.; Negi, S. Impact of surfactant assisted acid and alkali pretreatment on lignocellulosic structure of pine foliage and optimization of its saccharification parameters using response surface methodology. Bioresour. Technol. 2015, 192, 115–125. [Google Scholar] [CrossRef] [PubMed]
  32. Alrumman, S.A. Enzymatic saccharification and fermentation of cellulosic date palm wastes to glucose and lactic acid. Braz. J. Microbiol. 2016, 47, 110–119. [Google Scholar] [CrossRef] [PubMed]
  33. Jin, W.; Chen, L.; Hu, M.; Sun, D.; Li, A.; Li, Y.; Hu, Z.; Zhou, S.; Tu, Y.; Xia, T.; et al. Tween-80 is effective for enhancing steam-exploded biomass enzymatic saccharification and ethanol production by specifically lessening cellulase absorption with lignin in common reed. Appl. Energy 2016, 175, 82–90. [Google Scholar] [CrossRef]
  34. Ferraz, J.L.A.A.; Souza, L.O.; Soares, G.A.; Coutinho, J.P.; Oliveira, J.R.; Oliveira, E.A.; Franco, M. Enzymatic saccharification of lignocellulosic residues using cellulolytic enzyme extract produced by Penicillium roqueforti ATCC 10110 cultivated on residue of yellow mombin fruit. Bioresour. Technol. 2018, 248, 214–220. [Google Scholar] [CrossRef]
  35. Du, S.; Su, X.; Yang, W.; Wang, Y.; Kuang, M.; Ma, L.; Fang, D.; Zhou, D. Enzymatic saccharifcation of high pressure assist-alkali pretreated cotton stalk and structural characterization. Carbohydr. Polym. 2016, 140, 279–286. [Google Scholar] [CrossRef]
  36. Tang, W.; Wu, X.; Huang, C.; Ling, Z.; Lai, C.; Yong, Q. Comprehensive understanding of the effects of metallic cations on enzymatic hydrolysis of humic acid-pretreated waste wheat straw. Biotechnol. Biofuels 2021, 14, 25. [Google Scholar] [CrossRef]
  37. Tang, W.; Wu, X.; Huang, C.; Ling, Z.; Lai, C.; Yong, Q. Natural surfactant-aided dilute sulfuric acid pretreatment of waste wheat straw to enhance enzymatic hydrolysis efficiency. Bioresour. Technol. 2021, 324, 124651. [Google Scholar] [CrossRef]
  38. Wu, X.; Huang, C.; Zhai, S.; Liang, C.; Huang, C.; Lai, C.; Yong, Q. Improving enzymatic hydrolysis efficiency of wheat straw through sequential autohydrolysis and alkaline post-extraction. Bioresour. Technol. 2018, 251, 374–380. [Google Scholar] [CrossRef]
  39. Patel, H.; Divecha, J.; Shah, A. Microwave assisted alkali treated wheat straw as a substrate for co-production of (hemi) cellulolytic enzymes and development of balanced enzyme cocktail for its enhanced saccharification. J. Taiwan Inst. Chem. Eng. 2017, 71, 298–306. [Google Scholar] [CrossRef]
Figure 1. Response surface plots (a) and contour plots (b) of interaction effect of each independent variable’s pair on glucose (GL, mg/gds). (a1,b1) PTE (pretreatment temperature, °C) and HPC (hydrogen peroxide concentration, g/L); (a2,b2) PTE (pretreatment temperature, °C) and PTI (pretreatment time, h); (a3,b3) HPC (hydrogen peroxide concentration, g/L) and PTI (pretreatment time, h).
Fermentation 09 00871 g001
Figure 2. Response surface plots (a) and contour plots (b) of interaction effect of each independent variable’s pair on xylose (XY, mg/gds). (a1,b1) PTE (pretreatment temperature, °C) and HPC (hydrogen peroxide concentration, g/L); (a2,b2) PTE (pretreatment temperature, °C) and PTI (pretreatment time, h); (a3,b3) HPC (hydrogen peroxide concentration, g/L) and PTI (pretreatment time, h).
Fermentation 09 00871 g002
Figure 3. Response surface plots (a) and contour plots (b) of interaction effect of each independent variable’s pair on glucose (GL, mg/gds). (a1,b1) RT (reaction time, h) and EL (enzyme loading, FPU/gds); (a2,b2) RT (reaction time, h) and BL (biomass loading, g/L); (a3,b3) EL (enzyme loading, FPU/gds) and BL (biomass loading, g/L).
Fermentation 09 00871 g003
Figure 4. Response surface plots (a) and contour plots (b) of interaction effect of each independent variable’s pair on xylose (XY, mg/gds). (a1,b1) RT (reaction time, h) and EL (enzyme loading, FPU/gds); (a2,b2) RT (reaction time, h) and BL (biomass loading, g/L); (a3,b3) EL (enzyme loading, FPU/gds) and BL (biomass loading, g/L).
Fermentation 09 00871 g004
Table 1. Coefficients of regression for glucose and xylose yields during pretreatment optimization.
TermsY1 (Glucose, mg/gds)Y2 (Xylose, mg/gds)
Constant88.43731.268
A: Pretreatment temperature9.848 SS2.527 SS
B: Solid loading0.0670.259
C: Hydrogen peroxide concentration7.527 SS1.731 SS
D: Agitation speed−0.632−0.102
E: Pretreatment time6.895 SS2.964 SS
R298.07%96.79%
Adj-R296.63%94.38%
Lack of fit0.1180.138
Outline criterion: 0.05; SS significant at 1% level.
Table 2. Estimated regression coefficients for glucose and xylose yields during pretreatment optimization.
TermsGlucose (Y1) Xylose (Y2)
Constant233.21391.1433
Pretreatment temperature (x1)5.165 SS2.7813 SS
Hydrogen peroxide concentration (x2)3.090 S2.6913 SS
Pretreatment time (x3)3.280 S3.3475 SS
Pretreatment temperature × pretreatment temperature (x1 × x1)−30.647 SS−9.3917 SS
Hydrogen peroxide concentration × hydrogen peroxide concentration (x2 × x2)−18.622 SS−8.0867 SS
Pretreatment time × pretreatment time (x3 × x3)−28.842 SS−5.7692 SS
Pretreatment temperature × hydrogen peroxide concentration (x1 × x2)0.765−0.6000
Pretreatment temperature × pretreatment time (x1 × x3)0.060−2.3225 SS
Hydrogen peroxide × pretreatment time (x2 × x3)−0.425−1.1625
R299.4%99.4%
Adj-R298.2%98.4%
Lack of fit0.1410.115
Outline criterion: 0.05; S significant at 5% level; SS significant at 1% level.
Table 3. Comparisons of removal or recovery of main components in wheat straw, along with pretreatment conditions in different reports.
SubstratesPretreatment ConditionsCR (%)HR (%)LR (%)References
Wheat strawFirst step: alkaline hydrogen peroxide 3.0% (w/v), solid loading 40 g/L, 70 °C for 3.0 h; second step: lithium chloride/N, N-dimethylacetamide (LiCl/DMAc) solution (8.0%, w/w), solid loading 25 g/L, 110 °C for 2.5 h and room temperature for 12.0 h.92.5931.3995.2[23]
Wheat strawFirst step: ammonium sulfite solution 20.0% (w/w), solid loading 167 g/L, 160 °C for 60 min; Second step: pretreatment using xylanase (66 U/gds), solid loading 50 g/L, 50 °C for 24.0 h.83.145.478.7[24]
Wheat strawFirst step: toluene ethanol (2:1, v/v) for 6.0 h; second step: hot deionized water, solid loading 100 g/L, 200 °C for 0.5 h; third step: ethanol (70%, v/v) containing sodium hydroxide (1.0%, w/v), solid loading 50 g/L, 90 °C for 2.0 h.67.4056.5[25]
Wheat strawSodium hydroxide solution 1.0% (w/v), solid loading 100 g/L, 30 °C for 6.0 h; mixture of sodium hydroxide solution (1.0%, w/v) and H2O2 (4.0 g/L), solid loading 100 g/L, 30 °C for 15.0 h.96.873.662.1[26]
Wheat straw50% cholinium alanine-glycerol, solid loading 50 g/L, 90 °C for 6.0 h.95.182.167.6[27]
Wheat strawMixture of choline chloride and monoethanolamine (1:6), solid loading 50 g/L, 70 °C for 9.0 h.93.757.971.4[28]
Wheat strawAlkaline hydrogen peroxide solution 71 g/L, solid loading 200 g/L, 50 °C for 7.6 h.97.584.375.0This work
CR: cellulose recovery; HR: hemicellulose recovery; LR: lignin removal.
Table 4. Coefficients of regression for glucose and xylose yields during optimization of enzymatic hydrolysis.
TermsY3 (Glucose, mg/gds)Y4 (Xylose, mg/gds)
Constant278.67111.630
A: Reaction time (h)25.63 SS9.403 SS
B: Reaction temperature (°C)−1.15−1.582
C: Enzyme loading (FPU/gds)16.47 SS8.090 SS
D: Reaction pH1.030.127
E: Biomass loading (g/L)25.47 SS8.032 SS
F: Tween-80 concentration (%, w/v)−0.721.278
R299.59%97.82%
Adj-R299.18%95.64%
Lack of fit0.1030.103
Outline criterion: 0.05; SS significant at 1% level.
Table 5. Estimated regression coefficients for glucose and xylose yields during the optimization of enzymatic hydrolysis.
TermsGlucose (Y3)Xylose (Y4)
Constant544.510222.743
Reaction time (X1)15.597 SS6.926 SS
Enzyme loading (X2)30.767 SS7.912 SS
Biomass loading (X3)−6.564 SS−6.681 SS
Reaction time × reaction time (X1 × X1)−34.607 SS−12.535 SS
Enzyme loading × enzyme loading (X2 × X2)−53.179 SS−22.314 SS
Biomass loading × biomass loading (X3 × X3)−42.215 SS−24.478 SS
Reaction time × enzyme loading (X1 × X2)1.1162.625 S
Reaction time × biomass loading (X1 × X3)1.6040.992
Enzyme loading × biomass loading (X2 × X3)−2.7591.045
R299.4%99.5%
Adj-R298.9%99.0%
Lack of fit0.1030.111
Outline criterion: 0.05; S significant at 5% level; SS significant at 1% level.
Table 6. Comparisons of enzymatic hydrolysis conditions of wheat straw along with glucose and xylose yields in different reports.
SubstratesEnzyme SourcesEnzymatic Hydrolysis ConditionsGlucose (mg/gds)Xylose (mg/gds)Cellulose Conversion (%)Hemicellulose Conversion (%)References
Wheat strawCommercial cellulases from Qingdao Vland Biotech Inc. Qingdao, China.Enzyme loading 66.3 FPU/gds, biomass loading 30 g/L, 12 h.562.990.3[24]
Wheat strawCellulast 1.5 L® from NovozymesEnzyme loading 38.2 FPU/gds, biomass loading 10 g/L, 72 h.500.33209.4889.770.9[27]
Wheat strawCellulast 1.5 L® from NovozymesEnzyme loading 38.2 FPU/gds, biomass loading 10 g/L, 72 h.478.93131.0589.862.0[28]
Wheat strawCellic® CTec2 from NovozymesEnzyme loading 40.4 FPU/gds, biomass loading 50 g/L, 72 h.425.277.3[36]
Wheat strawCellic® CTec2 from NovozymesEnzyme loading 39.7 FPU/gds, biomass loading 50 g/L, 72 h.505.12≈092.9≈ 0[37]
Wheat strawCommercial cellulases from Hunan Youtell Biochemical Co., Ltd. Yueyang, China.Enzyme loading 53.9 FPU/gds, biomass loading 50 g/L, 72 h.484.5101.778.354.1[38]
Wheat strawCommercial cellulase (SIGMA) and crude cellulases by Aspergillus niger ADH-11Enzyme loading (5.0 FPU/gds of SIGMA cellulase and 5.0 FPU/gds of crude cellulase), biomass loading 25 g/L, 72.0 h.301.2203.253.959.6[39]
Wheat strawAspergillus niger HQ-1Enzyme loading 10.8 FPU/gds, biomass loading 88 g/L, 37.0 h.552.7223.694.083.5This work
Disclaimer/Publisher’s Note: The statements, opinions and data contained in all publications are solely those of the individual author(s) and contributor(s) and not of MDPI and/or the editor(s). MDPI and/or the editor(s) disclaim responsibility for any injury to people or property resulting from any ideas, methods, instructions or products referred to in the content.

