Article

Physiological and Molecular Characterization of Yeast Cultures Pre-Adapted for Fermentation of Lignocellulosic Hydrolysate

1
Division of Applied Microbiology, Department of Chemistry, Lund University, 221 00 Lund, Sweden
2
Department of Chemical Engineering, Lund University, 221 00 Lund, Sweden
3
Institute of Molecular Systems Biology, ETH Zürich, 8049 Zurich, Switzerland
*
Author to whom correspondence should be addressed.
Current address: Microbial Genetics and Biotechnology Laboratory, EMBRAPA Agroenergy, Parque Estação Biológica, PqEB–W3 Norte Final, Brasília 70.770-901, Brazil.
Current address: Novozymes A/S, Biologiens Vej 2, 2800 Kgs. Lyngby, Denmark.
Fermentation 2023, 9(1), 72; https://doi.org/10.3390/fermentation9010072
Submission received: 28 November 2022 / Revised: 5 January 2023 / Accepted: 13 January 2023 / Published: 14 January 2023
(This article belongs to the Special Issue Bioprocess and Metabolic Engineering)

Abstract

:
Economically feasible bioethanol process from lignocellulose requires efficient fermentation by yeast of all sugars present in the hydrolysate. However, when exposed to lignocellulosic hydrolysate, Saccharomyces cerevisiae is challenged with a variety of inhibitors that reduce yeast viability, growth, and fermentation rate, and in addition damage cellular structures. In order to evaluate the capability of S. cerevisiae to adapt and respond to lignocellulosic hydrolysates, the physiological effect of cultivating yeast in the spruce hydrolysate was comprehensively studied by assessment of yeast performance in simultaneous saccharification and fermentation (SSF), measurement of furaldehyde reduction activity, assessment of conversion of phenolic compounds and genome-wide transcription analysis. The yeast cultivated in spruce hydrolysate developed a rapid adaptive response to lignocellulosic hydrolysate, which significantly improved its fermentation performance in subsequent SSF experiments. The adaptation was shown to involve the induction of NADPH-dependent aldehyde reductases and conversion of phenolic compounds during the fed-batch cultivation. These properties were correlated to the expression of several genes encoding oxidoreductases, notably AAD4, ADH6, OYE2/3, and YML131w. The other most significant transcriptional changes involved genes involved in transport mechanisms, such as YHK8, FLR1, or ATR1. A large set of genes were found to be associated with transcription factors (TFs) involved in stress response (Msn2p, Msn4p, Yap1p) but also cell growth and division (Gcr4p, Ste12p, Sok2p), and these TFs were most likely controlling the response at the post-transcriptional level.

1. Introduction

An economically feasible bioethanol process from lignocellulose requires efficient hydrolysis of lignocellulosic biomass and fermentation of all sugars present in the hydrolysate [1,2]. However, in the hydrolysis of lignocellulose, or more specifically in the pretreatment step, by-products that are inhibitory to microbial fermentation, are often formed and released [3,4]. Baker’s yeast Saccharomyces cerevisiae is a common choice of microbe for many industrial bioprocesses because of its inherent robustness and tolerance to harsh process conditions such as low pH and high osmotic stress [5,6]. Nevertheless, lignocellulosic hydrolysates have proven to be a harsh environment also for S. cerevisiae [5]. When exposed to these pretreated feedstocks, the yeast is challenged with a variety of inhibitors that can principally be grouped into furaldehydes, weak acids, and phenolic compounds. These compounds affect the cell metabolism in different ways: the furaldehydes, i.e., 5-hydroxymethylfurfural (HMF) and 2-furaldehyde (furfural) are known to reduce the viability of S. cerevisiae [7,8], affect fermentation rate, inhibit growth and/or prolong lag phase [9]. In addition, under oxygen-limited conditions, furfural has been shown to cause reactive oxygen species (ROS) to increase, which leads to damage to cellular structures [10]. The weak acids, primarily acetic and formic acid, cause a reduction of biomass yield [11] due to the uncoupling of energy metabolism to maintain pH homeostasis via, notably, the activation of stress-signaling pathways [12]. Phenolic compounds form a very heterogenic group and hydrolysis of different raw materials will result in rather different mixtures of soluble compounds [4,8]. Similar to the case of furaldehydes, phenolic compounds reduce fermentation rate and growth [13,14].
Yeast tolerance towards lignocellulosic hydrolysate inhibitors can be improved by evolutionary engineering experiments, in which S. cerevisiae strains are exposed to increasing concentrations of a lignocellulosic hydrolysate inhibitor, which gradually improved their ability to grow in that environment (see, e.g., [8,15,16]). Alternatively, genetic engineering strategies based on the identification of genes important for strain tolerance and their subsequent overexpression in S. cerevisiae have been used (recently reviewed in [17]). A meta-evaluation of the genes, the deletion of which was reported to confer increased or decreased tolerance to one or several of these inhibitors was also recently performed and it concluded that the improvement to inhibitor tolerance was strain and condition dependent, and highlighted the key role of regulators, transporters, and detoxifying enzymes in the inhibitor tolerance phenotype [18].
In addition to long-term tolerance that can be acquired via evolution or genetic engineering, it is also possible to perform a short-term adaptation by aerobically propagating the cells in the presence of hydrolysate inhibitors prior to the anaerobic fermentation in non-detoxified hydrolysate, which has been shown to result in increased ethanol productivity [19]. This is particularly relevant for the simultaneous saccharification and fermentation (SSF) process, in which new yeast biomass production is required for each batch. Recently, an RNAseq study has investigated the metabolic and regulatory changes behind the short-adaptation phenotype for a xylose-utilizing industrial yeast grown on wheat straw hydrolysate [20]. It notably concluded on the importance of the oxidative stress mechanisms, the thiamine and biotin biosynthesis, the furaldehyde reductases and specific drug:H+ antiporters, for the response and adaptation to this type of raw material. However, as the tolerance of a given yeast strain varies depending on the evaluated hydrolysate [21] and the employed fermentation mode [22], it is relevant to pursue the characterization of the short-term adaptation response for other types of hydrolysates and strains.
In the present study, we focused on the response to non-detoxified spruce hydrolysate for the industrial S. cerevisiae strain TMB3500 that previously showed the best ability to adapt to different lignocellulosic hydrolysates in a screening of several industrial strains [21]. First, fed-batch cultivation of an industrial S. cerevisiae strain was performed using either spruce hydrolysate or a sugar-based medium as feed and the yeast adaptation to the hydrolysate was evaluated by comparing the fermentation capacity of the yeast cells in SSF experiments. To elucidate the molecular response to spruce hydrolysate during fed-batch propagation, in vitro measurements of furaldehyde (furfural and HMF) reductase activities, furfural and HMF conversion over time, and genome-wide transcription analysis were performed for yeast cultivated in hydrolysate and in sugar medium. The conversion of phenolic compounds during fed-batch propagation in the hydrolysate was also investigated to get a more comprehensive picture of the adaptation.

2. Materials and Methods

2.1. Raw Material and Pretreatment

Spruce wood chips were impregnated for 20 min with 2.5% w/wmoisture SO2. The chips were then steam-pretreated at 210 °C for 5 min in a 10 L reactor. The composition of the pretreated spruce is shown in Table 1. The water-insoluble and liquid fractions from the different hydrolysate batches used for the study were analyzed using NREL (National Renewable Energy Laboratories) standard procedures [23,24].

2.2. Yeast Cultivation

The Saccharomyces cerevisiae strain used in this work was the industrial strain TMB3500 [21]. The strain was grown on agar plates containing yeast nitrogen base medium (Difco YNB).
The yeast was inoculated in 300 mL cotton plugged shake flasks containing 100 mL media with, per liter of solution, 16.5 g glucose, 7.5 g (NH4)2SO4, 3.5 g KH2PO4, 0.75 g MgSO4·7H2O, 30 mg EDTA, 9 mg CaCl2·2H2O, 9 mg ZnSO4·7H2O, 6 mg FeSO4·7H2O 2 mg H3BO3, 1.55 mg MnCl2·2H2O, 0.8 mg Na2MoO4·2H2O, 0.6 mg CoCl2·2H2O, 0.6 mg CuSO4·5H2O, 0.2 mg KI, 50 μg d-biotin, 0.2 mg p-aminobenzoic acid, 1 mg nicotinic acid, 1.0 mg calcium pantothenate, 1.0 mg pyridoxine hydrochloride, 1.0 mg thiamine hydrochloride, 25 mg m-inositol. The cells were grown for 24 h at 30 °C and pH 5 in a rotary shaker at 160 rpm. Fed-batch propagation were started with an aerobic batch cultivation phase at 30 °C, pH 5 and 750 rpm with a working volume of 0.7 L using a 2.5 L fermenter (Biostat A, B. Braun Biotech International, Melsungen, Germany) aerated with 1000 mL/min. The batch medium contained 20 g/L glucose, 20 g/L (NH4)2SO4, 10 g/L KH2PO4, 2 g/L MgSO2∙7H2O. Trace metals and vitamins were also added to reach the same concentration as for the shake flask cultivations above, at the final volume reached after the fed-batch completion. The fed-batch phase was started at the point of glucose and ethanol depletion, visualized by the carbon evolution rate profile using a CP460 gas analyzer (Belach Bioteknik AB, Solna, Sweden). The reactor was continuously fed with non-detoxified pretreatment liquid spruce hydrolysate (SH; Table 1). NaOH pastilles were used to adjust pH of the liquid to 4.7. The hydrolysate feed started at 0.04 L/h and was linearly increased to 0.10 L/h during 16 h. After 16 h, 1 L had been added, giving a final volume of 1.7 L. The temperature and pH were automatically controlled (30 °C, pH 5) during cultivation. The stirring speed and aeration were 750 rpm and 1400 mL/min, respectively. The corresponding reference/control cultivations were performed with pure sugars (glucose, mannose, and xylose) with sugar concentrations similar to that of the spruce hydrolysate used in the fed-batch stage; this medium is henceforth referred to as Sugar Medium (SM). The cultivations were performed in biological duplicates.
Samples were taken at different time points during the fed-batch cultivation depending on the sample type. Samples for metabolites, biomass, and crude cell extract were taken at 0 h (end of batch phase), 3 h, 9 h, 15 h, and at the end of cultivation (17 h for the sugar mixture and approximately 17.5 h for the hydrolysate). Samples for microarray analysis were taken at 9 h and at the end of cultivation (approx. 17 h). The fermentation performance of the yeast cells at the end of fed-batch cultivation in hydrolysate and in sugar medium was also evaluated through SSF experiments.

2.3. Enzymatic Activity in Crude Cell Extracts

Samples for enzymatic activity measurements were immediately centrifuged at 4 °C for 3 min and the cell pellets were stored at −80 °C. Cell extracts were prepared with Y-PER reagent (Pierce, Rockford, IL, USA) following the protocol of the supplier. In vitro HMF and furfural reduction activity was determined with a spectrophotometer by following NAD(P)H oxidation as described previously [25].

2.4. Microarray Experiments

Samples for microarray analysis were immediately centrifuged at 5000× g for 3 min at 4 °C and the cells were frozen in liquid nitrogen and stored at −80 °C. RNA extraction was performed using TRIZOL® Reagent (Invitrogen, Groningen, The Netherlands) following the recommendations of the supplier. Briefly, yeast cells were re-suspended in 1.5 mL of Trizol and mixed with half volume of 0.1 mm glass beads. Then, cells were disrupted using a homogenizer for 3 min, with intervals of one minute in ice between homogenizations. The insoluble material was removed by centrifugation at 12,000× g for 10 min at 4 °C. The supernatant was transferred to a fresh tube and incubated for 5 min at 15 to 30 °C, after that 0.3 mL of chloroform was added to the tube, which was agitated vigorously for 15 s and incubated at 15 to 30 °C for 2 to 3 min. Samples were centrifuged at 12,000× g for 15 min at 4 °C. Following centrifugation, RNA was precipitated with 0.75 mL isopropyl alcohol. The RNA pellet was obtained by centrifugation at 12,000× g for 10 min at 2 to 8 °C. Finally, the RNA pellet was washed once with 75% ethanol and dissolved in RNase-free water.
RNA quality and concentration were measured using Agilent 2100 bioanalyzer and Nanodrop ND-1000, respectively. Two micrograms total RNA was processed following the GeneChip® Expression 3′-Amplification Reagents One-cycle cDNA synthesis kit instructions (Affymetrix Inc, Santa Clara, CA, USA) to produce double-stranded cDNA. This was used as template to generate biotin-targeted cRNA, following the manufacturer’s specifications. Fifteen micrograms of the biotin-labeled cRNA were fragmented into strands of 35 to 200 bases in length, 10 micrograms of which were hybridized onto the GeneChip® Yeast Genome 2.0 Array overnight in the GeneChip® Hybridization oven 6400 using standard procedures. Arrays were washed and then stained in a GeneChip® Fluidics Station 450. Scanning was performed with the GeneChip® Scanner 3000 and image analysis was performed using GeneChip® Operating Software.

2.5. Analysis of Microarray Data

The microarray datasets from the Affymetrix Yeast Genome 2.0 array were analyzed with R (v4.2.1; [26]), using the Bioconductor packages Affy (v1.74.0; [27]) and Limma (v3.52.4; [28]). The raw data were normalized using the Robust Multichip Average (RMA) method [29] by using the rma() function of Affy. The treat() function [30] in Limma was used to filter probes by a log2 ≥2 fold-change threshold and decideTests(p = 0.05, adjust.method = ‘BH’, method = “global”), also from Limma, was used to identify differentially expressed (DE) genes with a false discovery rate threshold of Benjamini–Hochberg adjusted p < 0.05.
The microarray probes were annotated with the yeast2.db (v3.2.3; [31]) R package; this version of the package was based on data from the Saccharomyces Genome Database [32] dated 25 October 2019. Chromosome coordinate data for each gene was obtained from Ensembl using the biomaRt (v2.52.0; [33]) package with the option dataset = scerevisiae_gene_ensembl. Three of the probes (1780120_at, 1773015_at, 1770115_at) lacked S. cerevisiae gene annotation in the Ensembl dataset, and their chromosome coordinate data thus had to be manually added based on information from the Saccharomyces Genome Database [32]. One probe (1777823_s_at) completely lacked annotation in any of the R packages and was annotated based on the Yeast_2.na36.annot file for the yeast2.0 Affymetrix array, as provided by ThermoFisher Scientific on their homepage. Organism annotation for each probe was also obtained from this file. The final, processed data are available in Supplementary Information 2; the raw and processed data have also been deposited in the Gene Expression Omnibus [34] database, with accession number GSE218764.
All statistical tests were performed on the total set of probes. For the figures, however, only the probes annotated with S. cerevisiae (5814 probes) were used, i.e., omitting all Schizosaccharomyces pombe and bacterial control probes that also were present on the microarray chip. Principal component analysis was performed with the prcomp() function in R. Volcano plots were generated with Enhanced volcano (v 1.14.0; [35]).
Gene Ontology (GO) enrichment analysis was performed with PANTHER (v17.0; [36,37]) at the GO Consortium homepage (http://geneontology.org/; access date: 11 November 2022; [38,39]). Two sets of analyses were performed, using the significant DE genes identified by decideTests(): one with the 25 genes from the 9 h comparison, and one with the 307 genes from the 17 h comparison. The analysis was performed using PANTHER’s Overrepresentation Test (Release 20221013), the 1 July 2022 release of the GO Ontology database, the biological process ontology, and the S. cerevisiae reference list. Statistical tests were called using the PANTHER options Fisher’s exact and calculate false discovery rate (FDR). A cut-off of FDR p < 0.05 was used for selecting the final enrichment results.
The YEASTRACT+ database [40] was used to analyze the significant DE genes for their known association with transcription factors (TFs).

2.6. Identification of Phenolic Compounds

Samples for analysis of phenolic compounds were supplemented with two internal standard compounds (para-Nitrobenzyl alcohol and para-Chlorophenyl acetic acid) and extracted twice with ethylacetate. After evaporation, the remaining solids were re-dissolved in pyridin and dried over Na2SO4. For good GC separation, the inhibitors were sililated by the addition of an equal volume of N-(Trimethylsilyl)acetamide at 40 °C for 30 min. These samples were then injected into a GC (Agilent 6890N), which was coupled to a time-of-flight mass spectrometer (LECO Pegasus III).
Separation of the compounds on the GC was achieved with the following program: temperature was held at 60 °C for 30 s before ramping to 100 °C at a rate of 40 °C/min. Then, the temperature was increased to 300 °C at a rate of 7 °C/min. Finally, the temperature was held at 300 °C for 2 min.
The collected spectra were matched to a NIST library (www.nist.gov) to identify the compounds. The identity of selected compounds was asserted by injecting the pure substances purchased from Sigma. For relative quantification, the unique mass traces for all compounds were integrated (LECO ChromaTof 2.32) and related to the internal standard compound integrals. Two technical replicates were done from each sample.

2.7. SSF Experiments

After fed-batch cultivation, cells were harvested by centrifugation at 4000× g for 3 min in 700 mL flasks using a HERMLE Z 513K centrifuge (HERMLE Labortechnik, Wehingen, Germany). Pellets were resuspended in 0.9% NaCl solution to a concentration of 75 g dw/L.
SSF experiments were performed batch-wise on pretreated spruce at 10% water-insoluble solids (WIS) content in 2.5 L bioreactors (Biostat A, B. Braun Biotech International, Melsungen, Germany and Biostat A plus, Sartorius, Melsungen, Germany) with a working weight of 1.4 kg. Experiments were carried out at 34 °C, pH 5 for 120 h. The SSF medium was supplemented with 0.5 g/L NH4H2PO4, 0.025 g/L MgSO4·7H2O, and 1.0 g/L yeast extract. Experiments were initiated by addition of 4.4 g dw/L cells, 30 FPU/g glucan cellulases (Celluclast), and 60 IU/g glucan β-glucosidases (Novozyme 188). Enzymes were generously provided by Novozymes A/S, Bagsvaerd, Denmark. SSF experiments were performed in biological duplicates.

2.8. Yield Calculations

The ethanol yield in the SSF was calculated based on the initial amount of fermentable sugars, i.e., the sum of available glucose, mannose, and galactose in the slurry, including both monomers, oligomers, and polymers (glucan fibers). The yield is presented as the percentage of maximum theoretical ethanol yield (0.51 g/g).

2.9. Biomass and Metabolite Analysis

For the determination of biomass concentration, 2 to 5 mL of culture were filtered under vacuum, washed with distilled water, and dried on Gelman filters (ø 47 mm Supor-450, 0.45 µm) in microwave oven (350 W) for 8 min and weight. In SSF experiments, biomass concentration could not be accurately determined, due to the fiber content in the medium.
Samples for metabolite measurements were immediately centrifuged, filtered through 0.2 µm filters, and stored at −20 °C. Ethanol, acetic acid, HMF, and furfural were analyzed using an HPLC system (Waters, Milford, MA, USA) equipped with an Aminex HPX-87H column (Bio-Rad, Hercules, CA, USA), at 65 °C. Sulfuric acid 5 mM was used as mobile phase at a flow rate of 0.6 mL/min. The concentration of glucose, mannose, galactose, xylose, xylitol, and glycerol was determined with an Aminex HPX-87P column (Bio-Rad, Hercules, CA, USA) at 85 °C, with ultra-pure water at 0.6 mL/min as mobile phase. All compounds were detected with a refractive index detector (Waters 410, Millipore, Milford, MA, USA), except for HMF and furfural which were detected with a UV detector (210 nm).

3. Results

The purpose of this work was to understand the molecular mechanisms involved in yeast short-term adaptation to non-detoxified spruce hydrolysates during the cell cultivation stage prior to a SSF process and to compare the findings with already reported studies on short-term adaptation or expression studies with other yeast strains and types of hydrolysates. Aerobic fed-batch yeast propagation on spruce hydrolysate (SH) or in a sugar medium control (SM) was made under similar conditions using the industrial strain TMB3500, and the performance of the produced yeast in subsequent SSF was compared. Samples were taken during the fed-batch cell cultivation (which lasted for about 17 h) for in vitro enzymatic activity measurements, analysis of phenolic compounds, and transcriptome analysis.

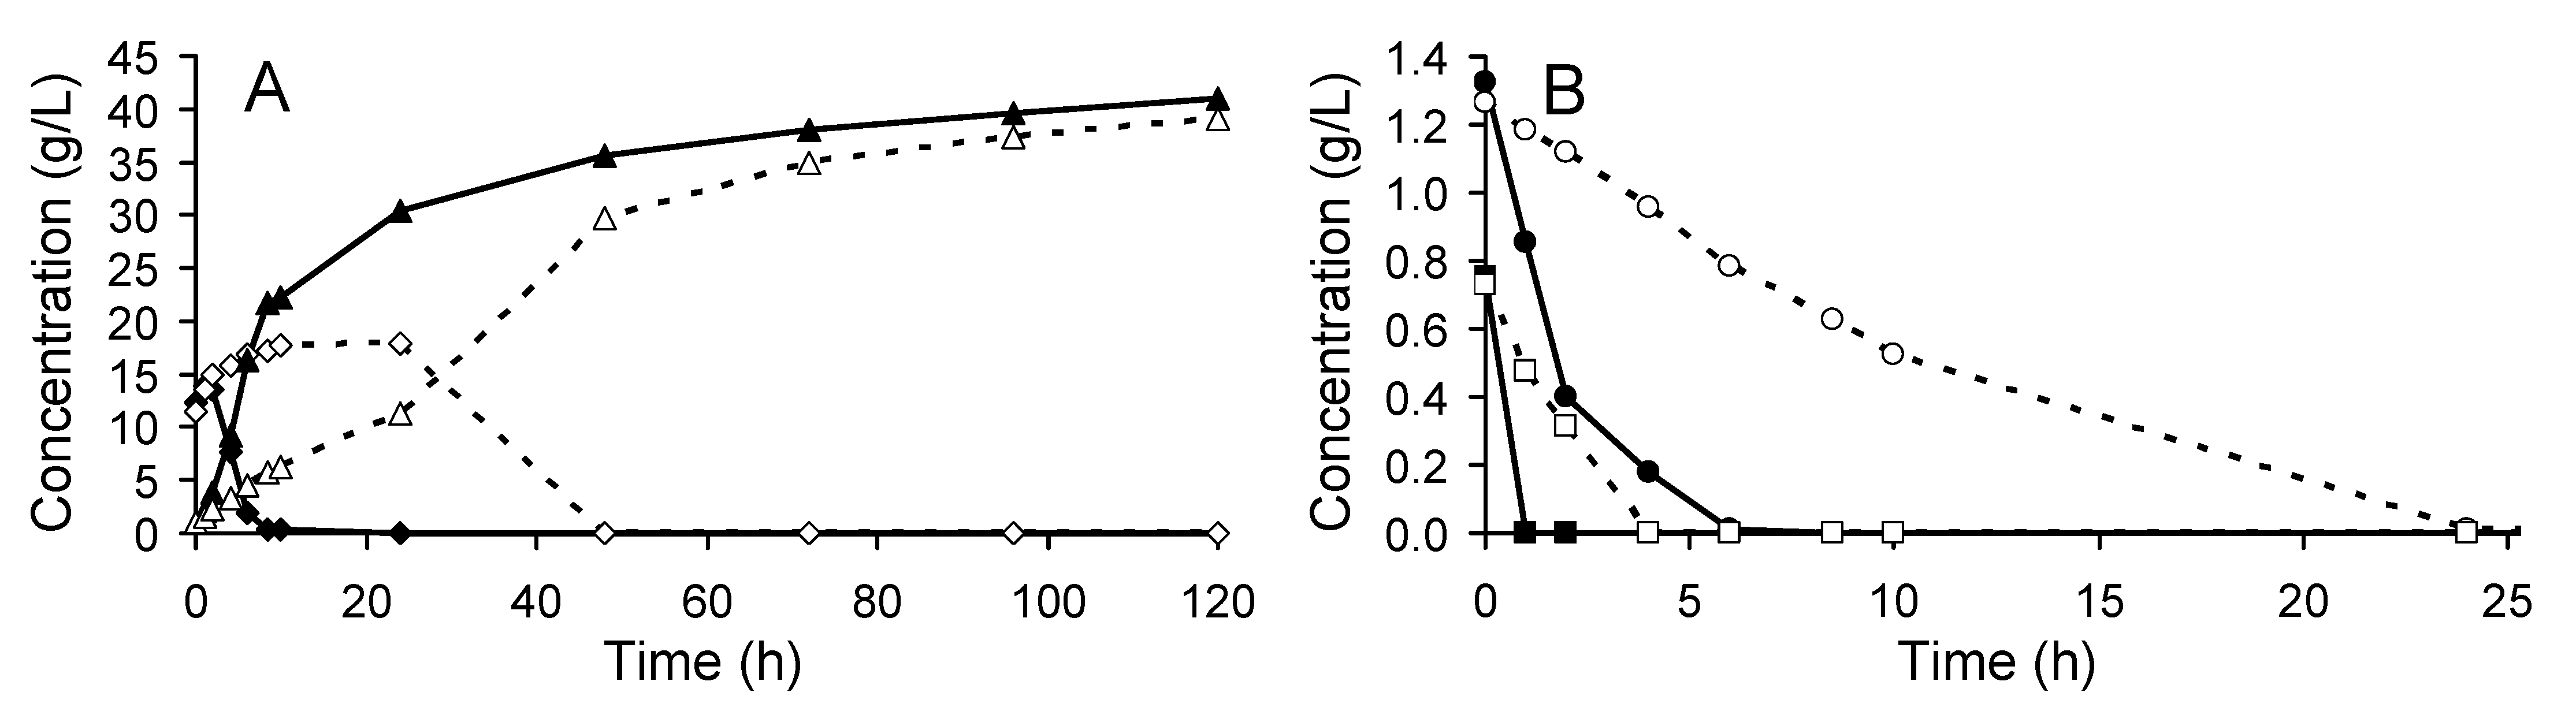
3.1. Yeast Performance in the SSF Experiments

Prior to the analysis of the cell propagation step, the fermentation performance of S. cerevisiae strain TMB3500, harvested after propagation in either spruce hydrolysate or the control sugar medium, was compared in SSF on pretreated spruce at 10% WIS content. It confirmed that the spruce hydrolysate-grown cells were more effective in converting the sugars in this harsh environment, particularly during the first 24 h (Figure 1). For the sugar medium-grown yeast, the rate of glucose uptake was lower than the rate of glucose release, which resulted in glucose accumulation during the first 24 h of fermentation. In contrast, for the spruce hydrolysate-grown yeast, the rate of glucose uptake was higher, and glucose accumulated only in the first 2 h of fermentation (Figure 1A). The ethanol profiles indicated that the sugar medium-grown yeast gradually adapted to the SSF-medium during the first 24 h of SSF, whereas the spruce hydrolysate-grown yeast fermented efficiently already from the start (Figure 1A). The furfural and the HMF reduction rates were also higher in the SSF with spruce hydrolysate-grown yeast (Figure 1B). The most significant difference between the spruce hydrolysate- and sugar medium-grown yeast was in the initial ethanol productivity. However, the difference remained throughout the full duration of the SSF experiments (Table 2), and the higher final yields of ethanol and glycerol indicated that more sugar was utilized by the yeast pre-cultivated on spruce hydrolysate.

3.2. Effects of Hydrolysate on Yeast Pre-Cultures

To elucidate the rapid adaptation mechanisms behind the increased tolerance by the yeast propagated in spruce hydrolysate as compared to the control medium, the levels of biomass, substrate, metabolites, and inhibitors as well as furaldehyde reduction activities were measured throughout the experiment. The Transcriptome profile of spruce hydrolysate- vs. sugar medium fed-batch-grown cells was also compared at two time points of the yeast cultivation.

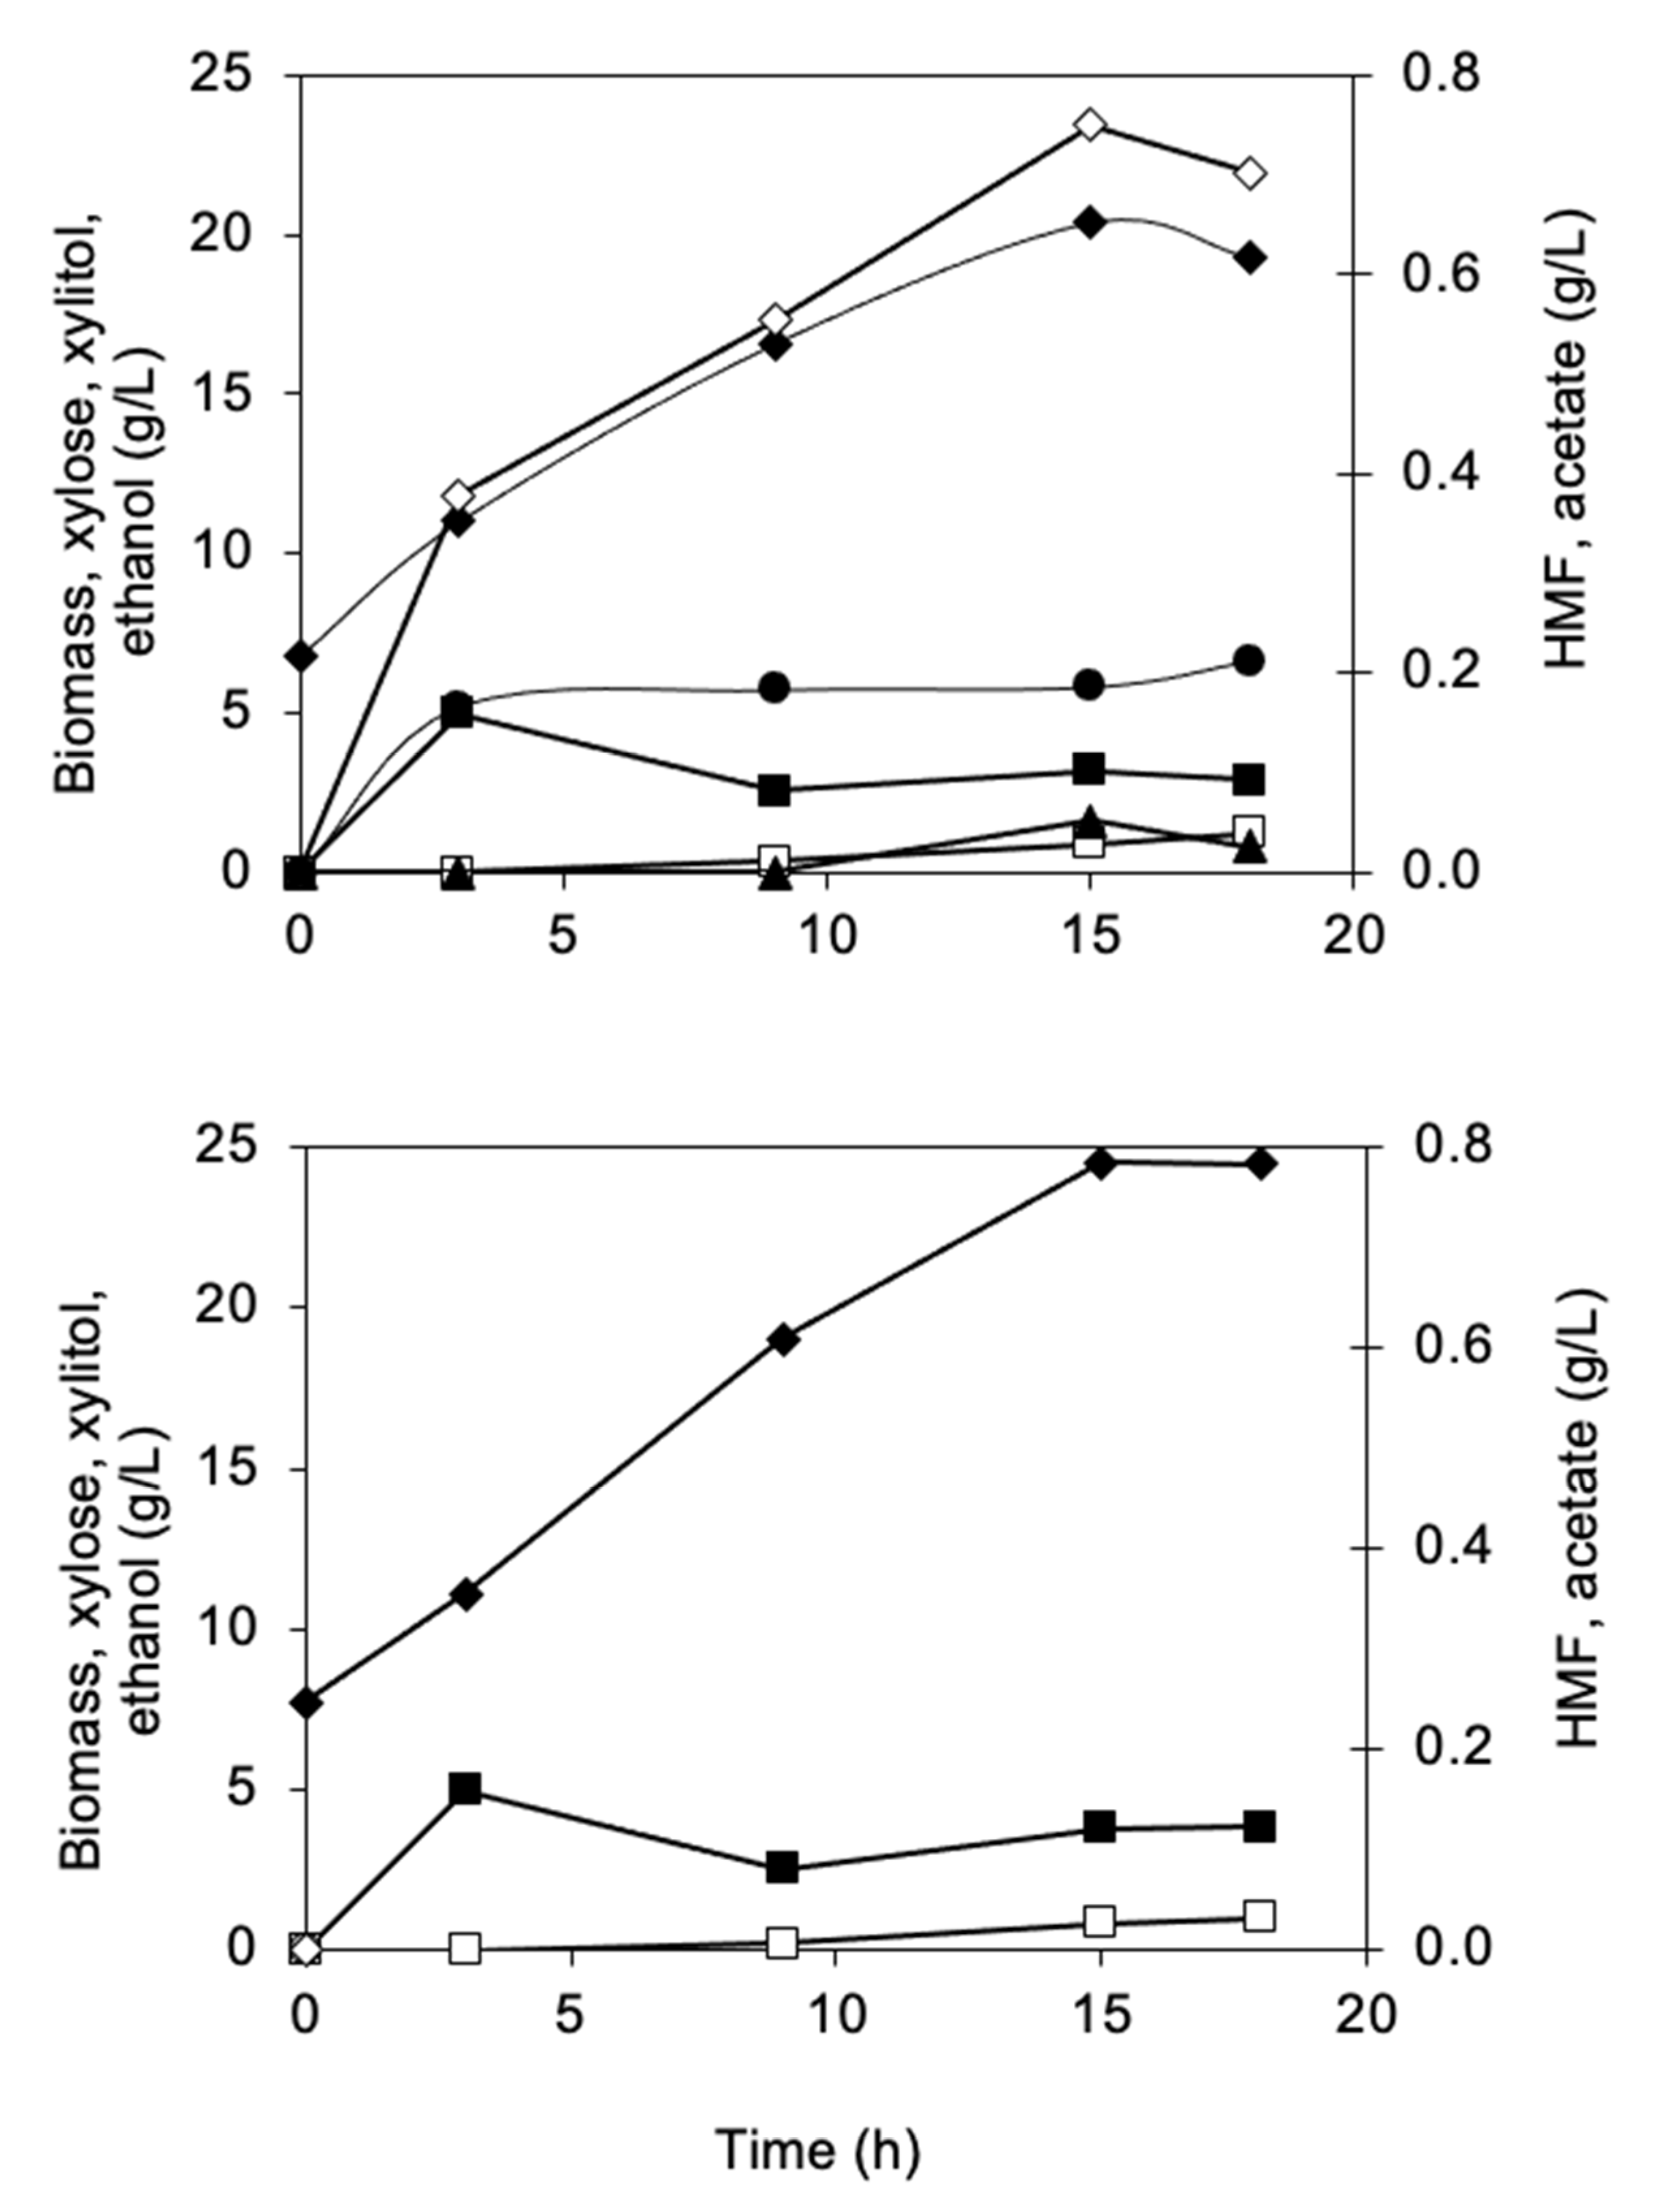
3.2.1. Biomass and Metabolite Analysis

The concentrations of hexose sugars (glucose, mannose, and galactose) were below the detection limit (<0.1 g/L) throughout the fed-batch cultivation for both spruce hydrolysate- and the control sugar medium-grown yeast, meaning that they were immediately consumed by the yeast. In contrast, as TMB3500 was not engineered for xylose utilization, xylose concentration increased during both the cultivation in spruce hydrolysate and sugar medium due to low xylose conversion (Figure 2). Some xylitol accumulation was also observed, likely as a result of the conversion of xylose to xylitol by endogenous reductases [41]. Although the yeast consumed all fermentable sugars, a lower final biomass concentration and a changed product distribution reflected the inhibitory effects of the spruce hydrolysate (Figure 2). The final biomass concentration was reduced from 24 g/L (±0.7) with sugar medium to 19.7 g/L (±0.5) with spruce hydrolysate. In addition, ethanol was detected at low concentrations at 15 h in spruce hydrolysate, but not in the sugar medium. Finally, due to the presence of acetate in the hydrolysate, the acetate concentration increased in the spruce hydrolysate propagation, but not in the sugar medium.

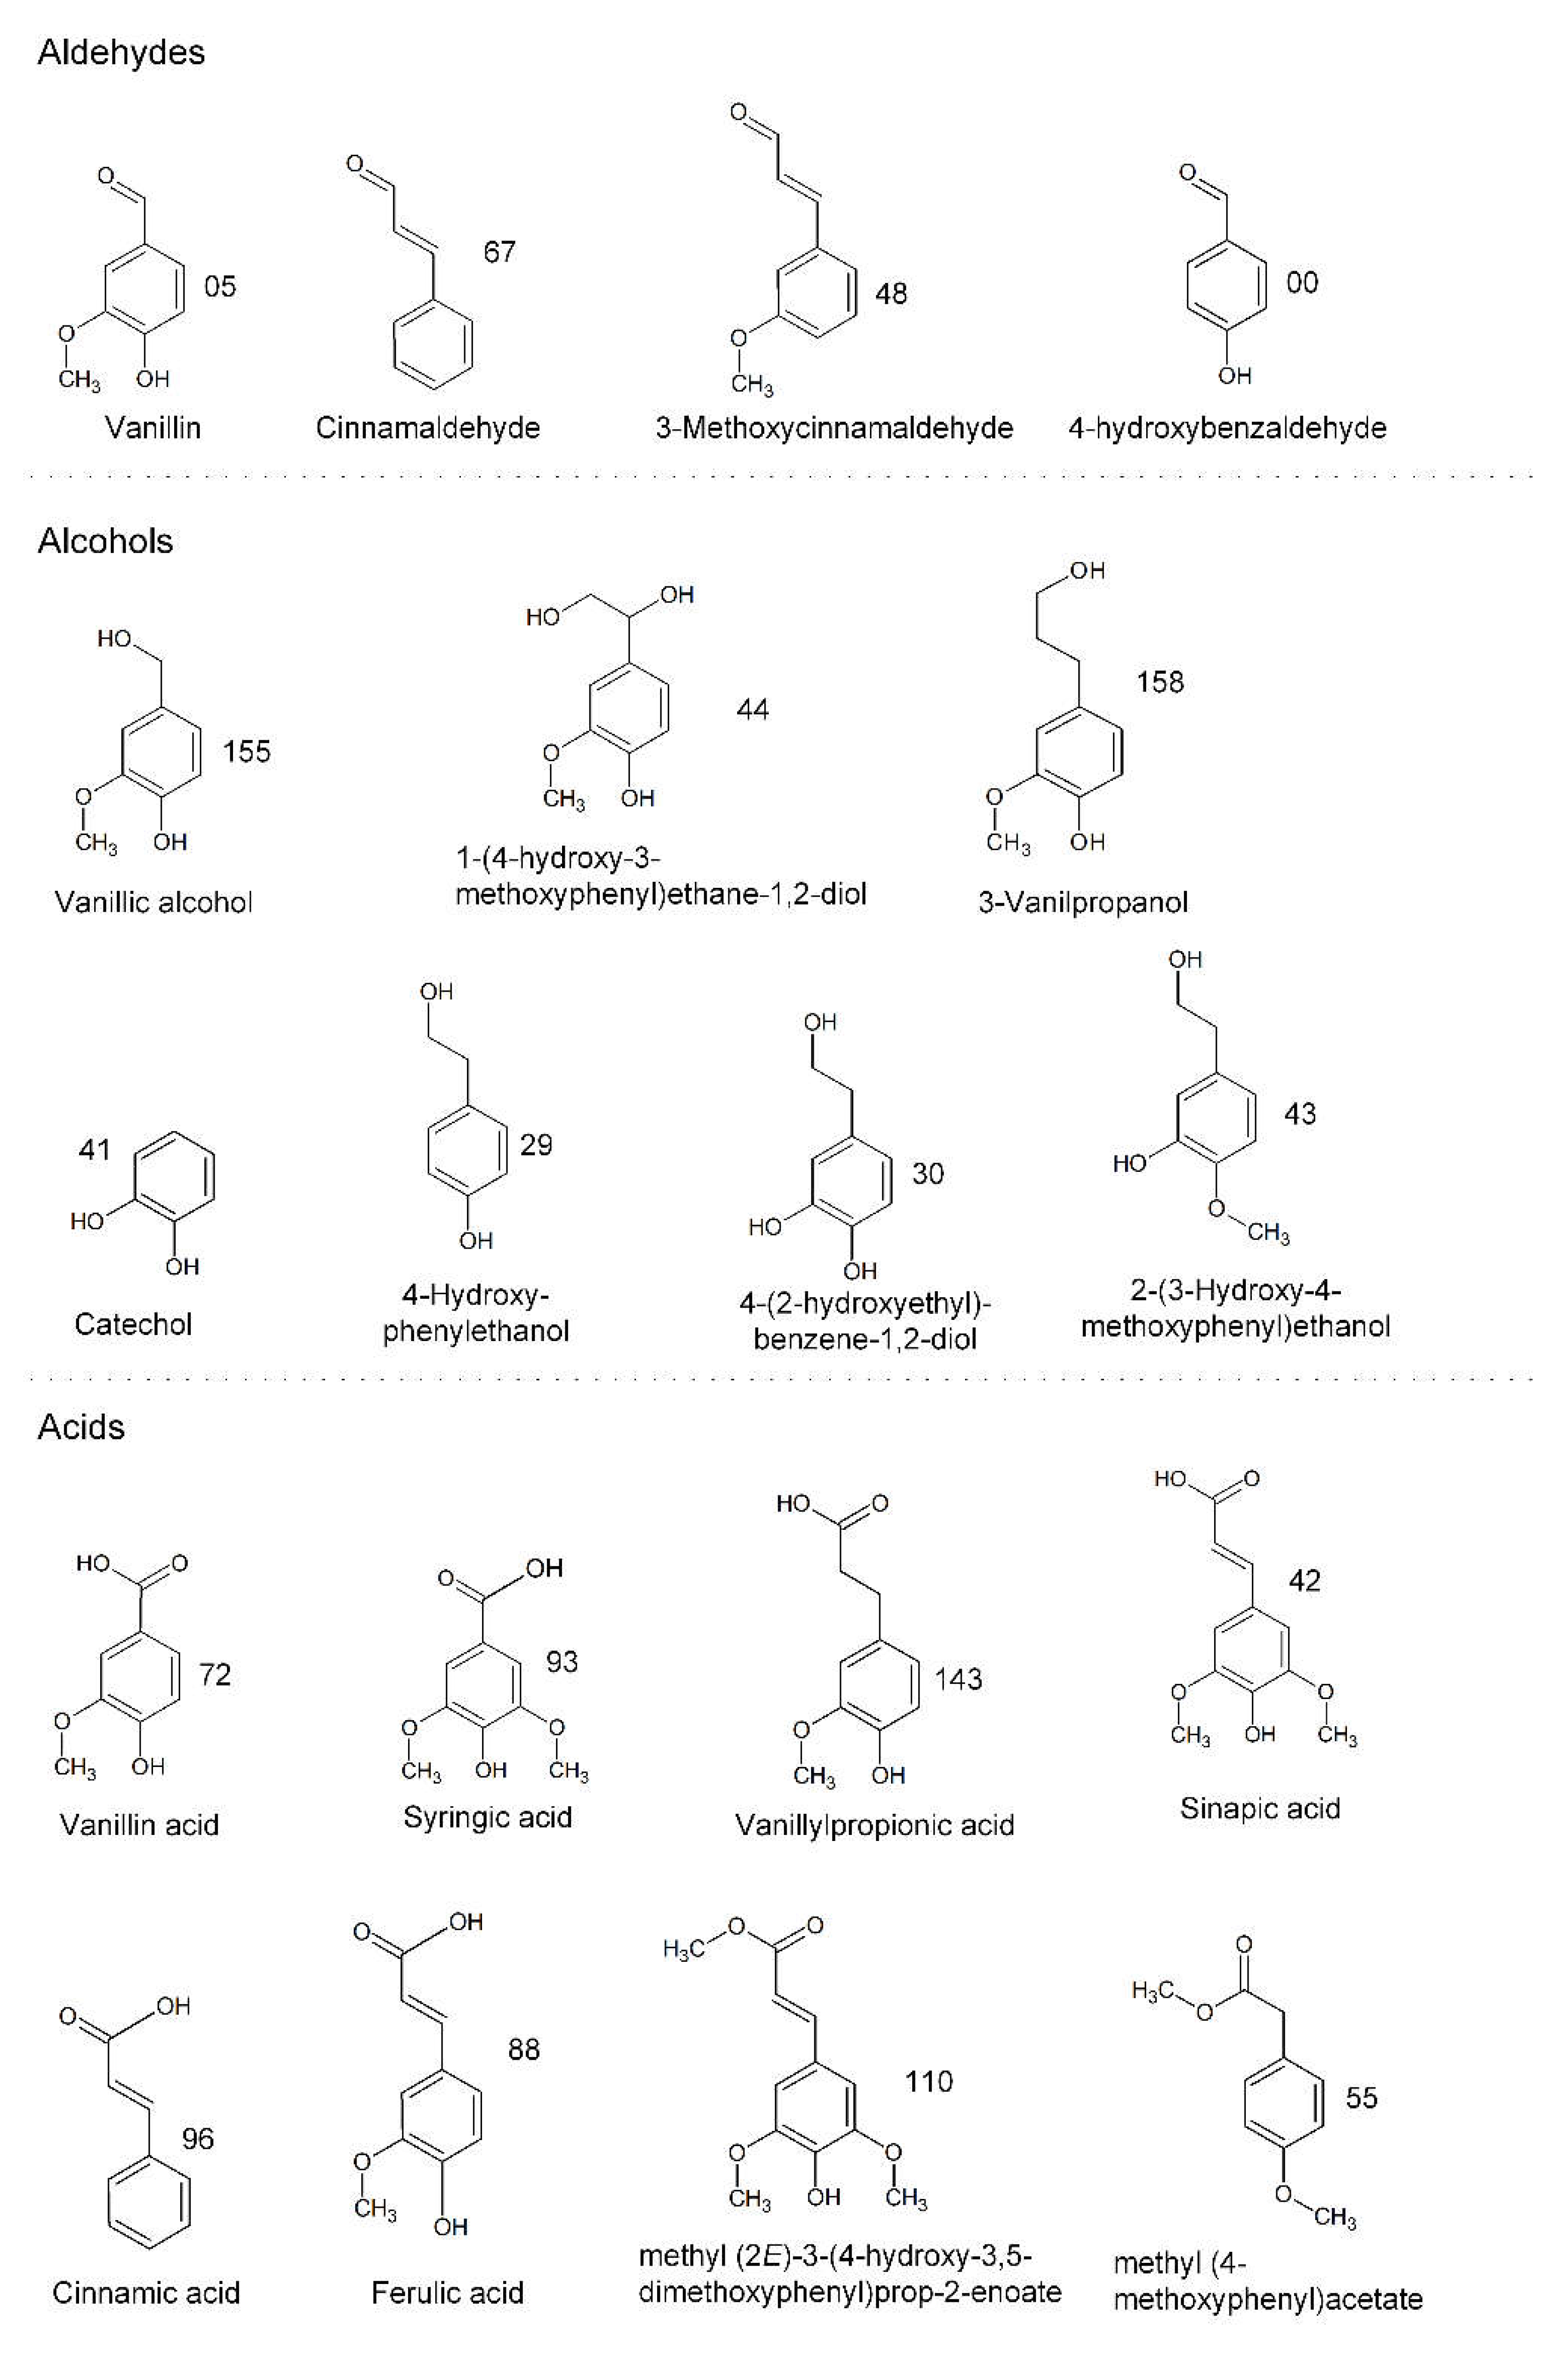
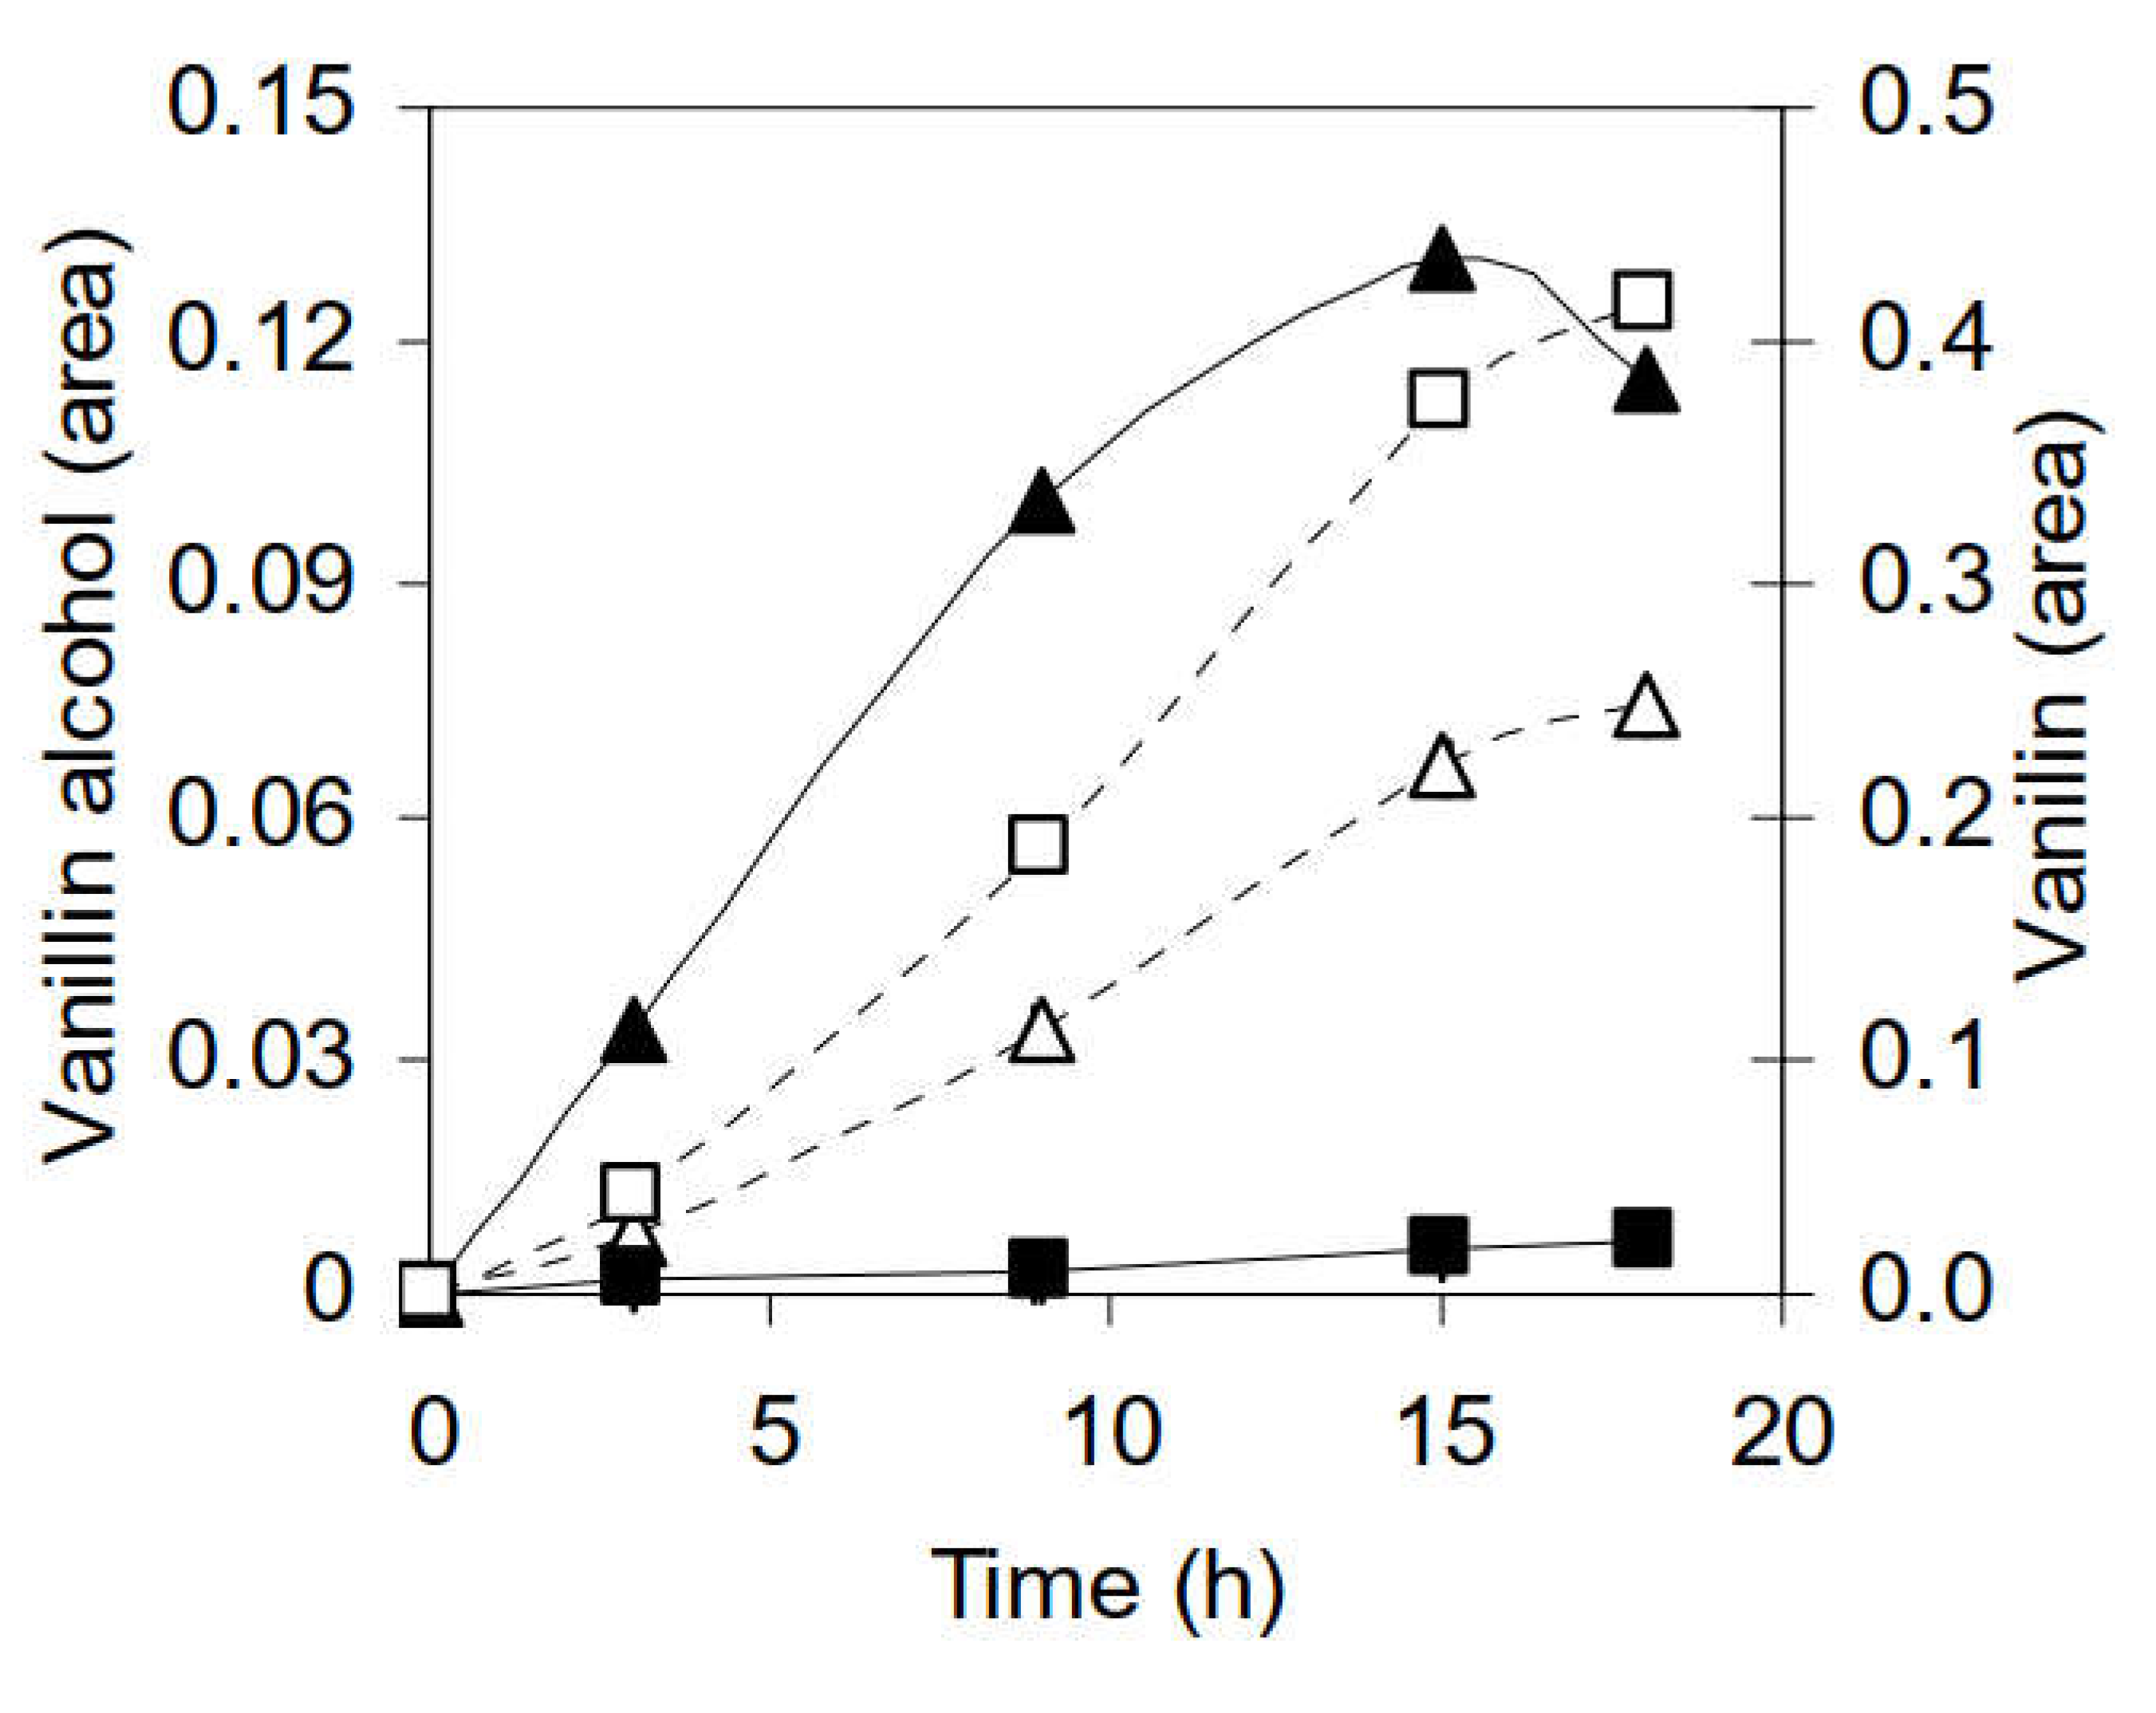
3.2.2. Identification of Phenolic Compounds in the Propagation Step on Spruce Hydrolysate Medium

Approximately 60 different phenolic compounds were found in the spruce hydrolysate. Among these, 19 compounds with a similarity score in the NIST library above 730 could be identified (Figure 3). The comparison of the relative concentration of each compound during the cultivation in spruce hydrolysate with the relative amount added during cultivation indicated that some of these compounds were metabolized by the cells (Figure 3). Notably, the relative amounts of added vanillin and vanillic alcohol compared to the amounts measured during the fed-batch cultivation suggested that the aldehyde group of vanillin was reduced to an alcohol resulting in vanillyl/vanillic alcohol (Figure 4). The remaining approximately 40 compounds did not give any significant library hits and could thus not be identified. However, the fragmentation profiles indicated that almost all compounds were phenolic derivatives.

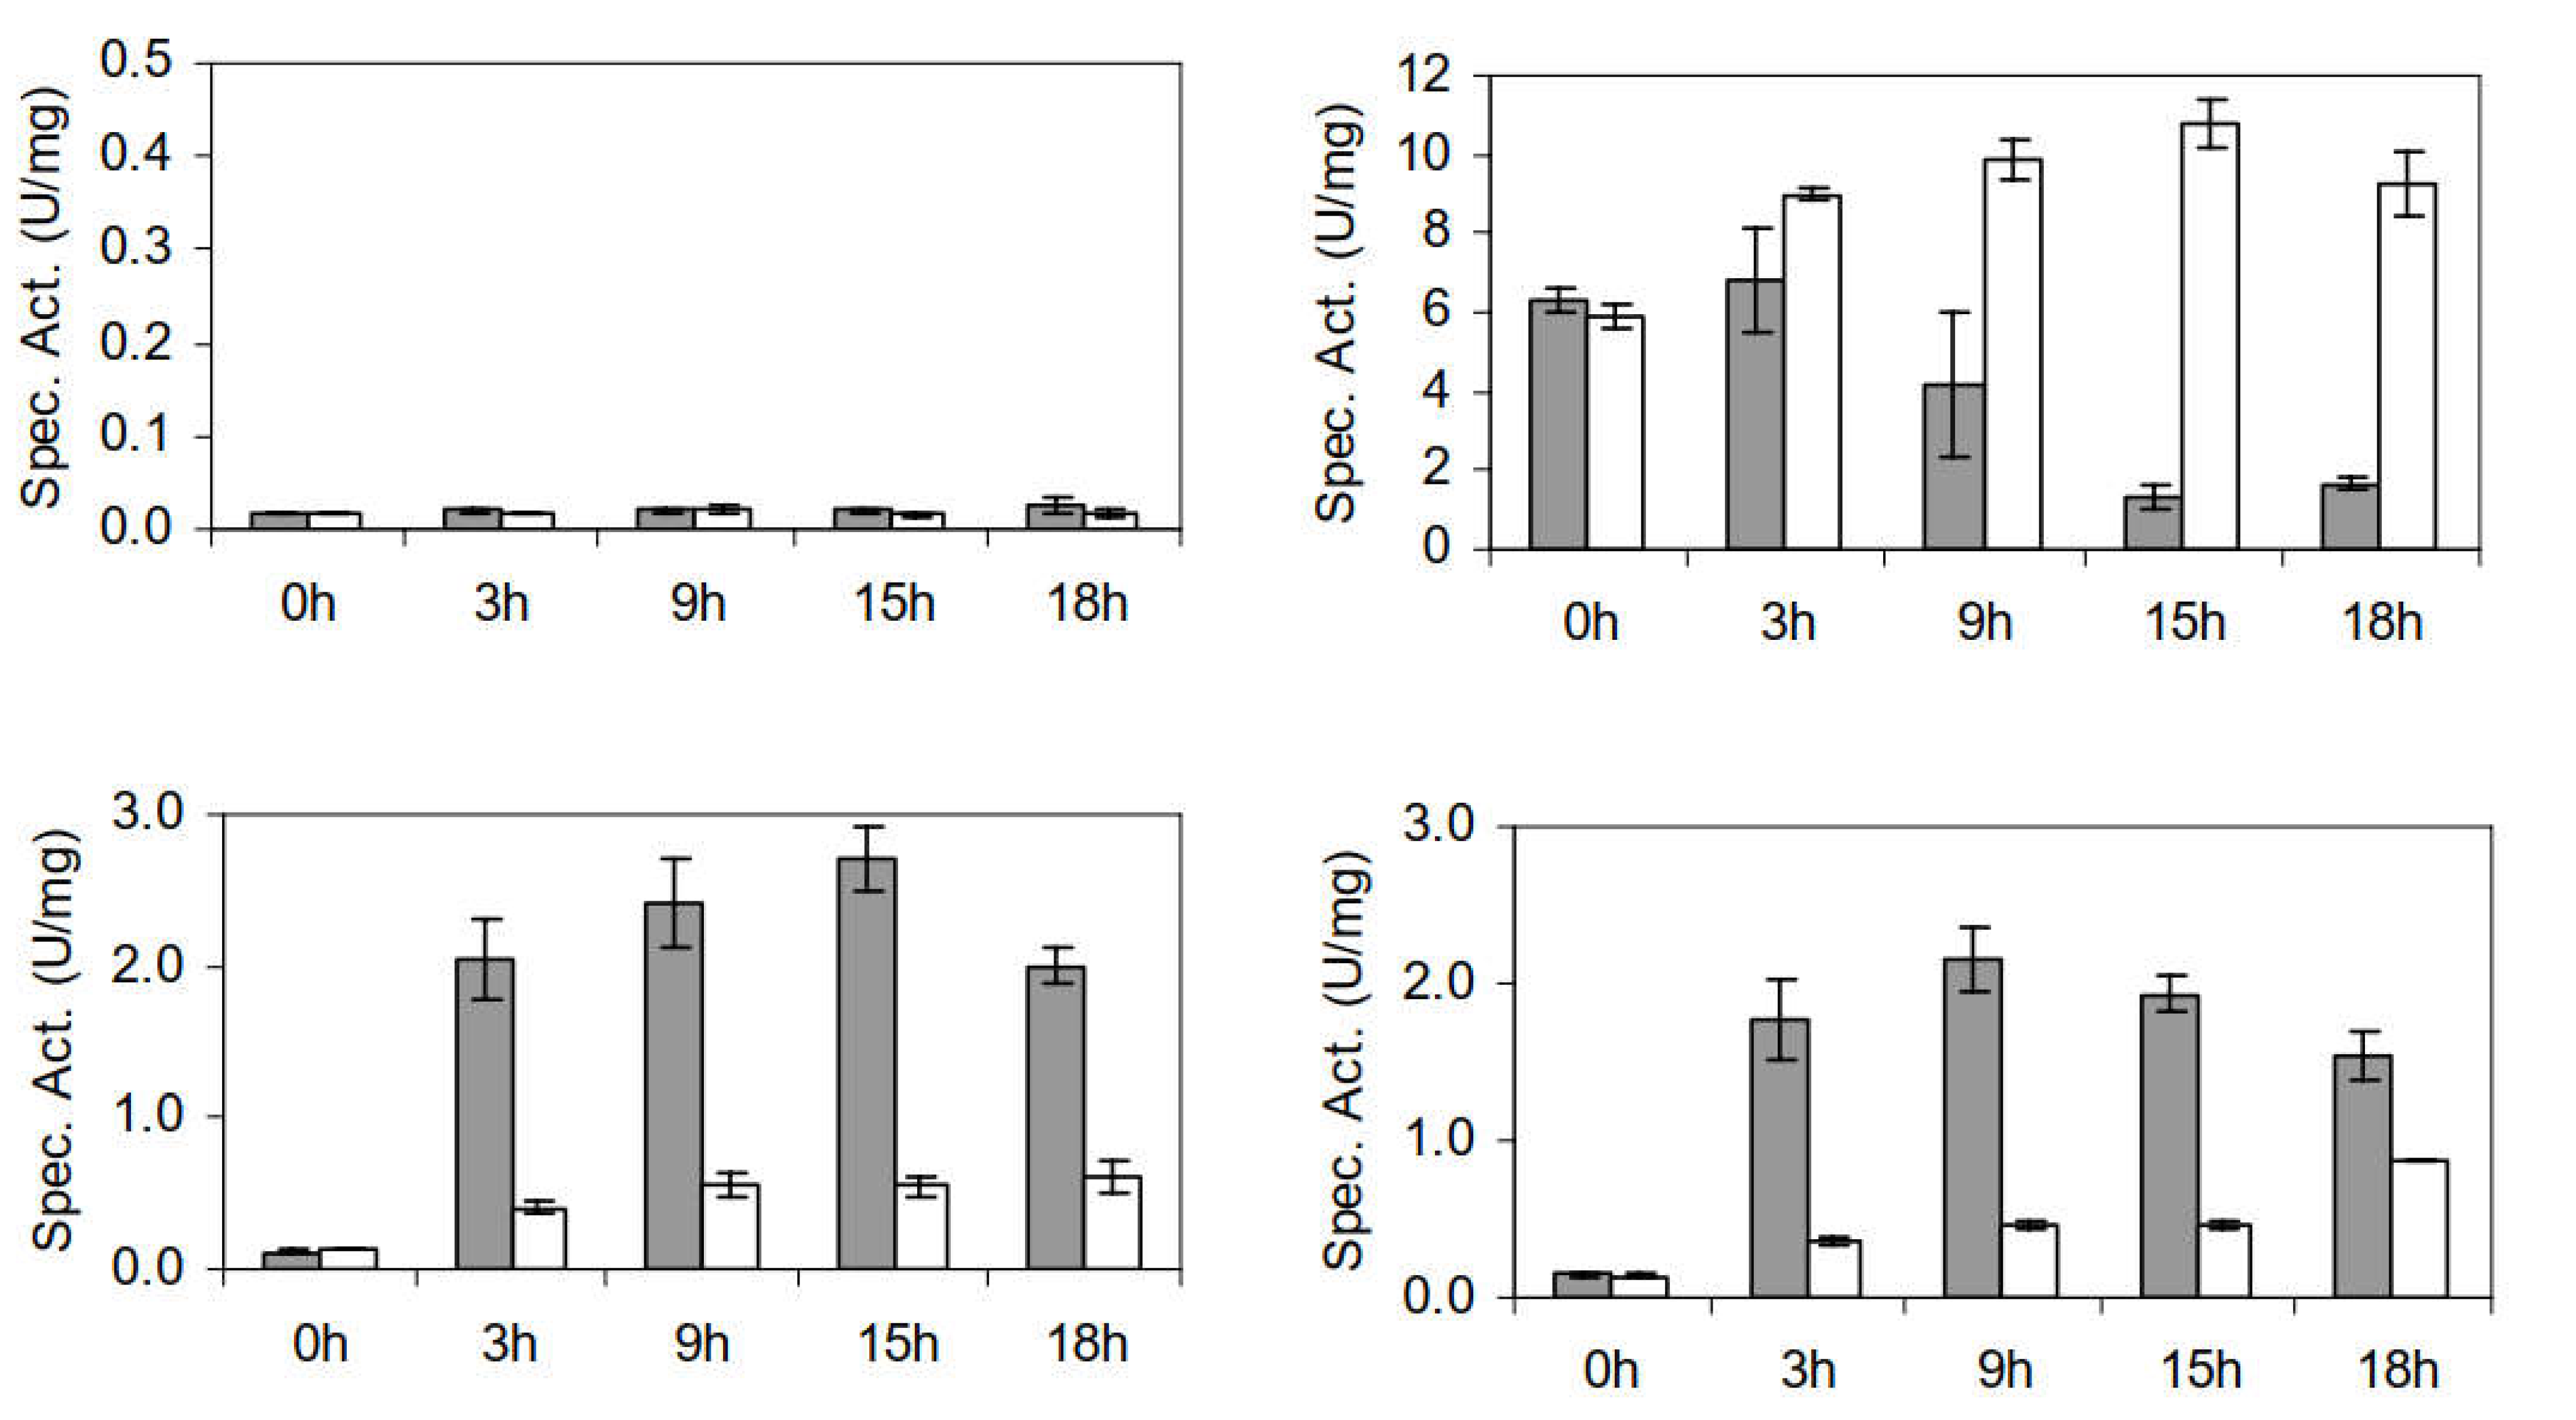
3.2.3. Furaldehyde Reduction Activity

The higher furaldehyde conversion rate in the SSF experiment by the yeast cells that were produced in the hydrolysate medium (Figure 1B) suggested that HMF and furfural reducing activities were induced during the fed-batch cultivation in the spruce hydrolysate. Thus, in vitro furaldehyde reduction activity in crude cell extracts of spruce hydrolysate- and sugar medium-grown yeast cells was compared using NADH and NADPH as cofactors. Whereas the NADH-dependent HMF reductase activity was negligible, the NADPH-dependent activity was high and significantly induced by the cultivation of spruce hydrolysate (Figure 5). An increase in in vitro NADPH-dependent HMF reductase activity for the yeast cultivated in the sugar medium was also observed, however at a much lower level (Figure 5). Furfural reduction activity was coupled with both NADH and NADPH (Figure 5). Initially, NADH-dependent furfural reduction was relatively high for both spruce hydrolysate- and sugar medium-grown yeast cells. However, the activity levels varied significantly after 3 h of cultivation. Whereas the activity decreased in cells cultivated in spruce hydrolysate, it increased for cells cultivated in sugar medium and remained high until the end of cultivation. The NADPH-dependent furfural reduction activity developed in a similar way as the HMF activity, i.e., it was induced for cells cultivated both in spruce hydrolysate and sugar medium. However, induction levels were significantly higher in spruce hydrolysate cultivation (Figure 5).

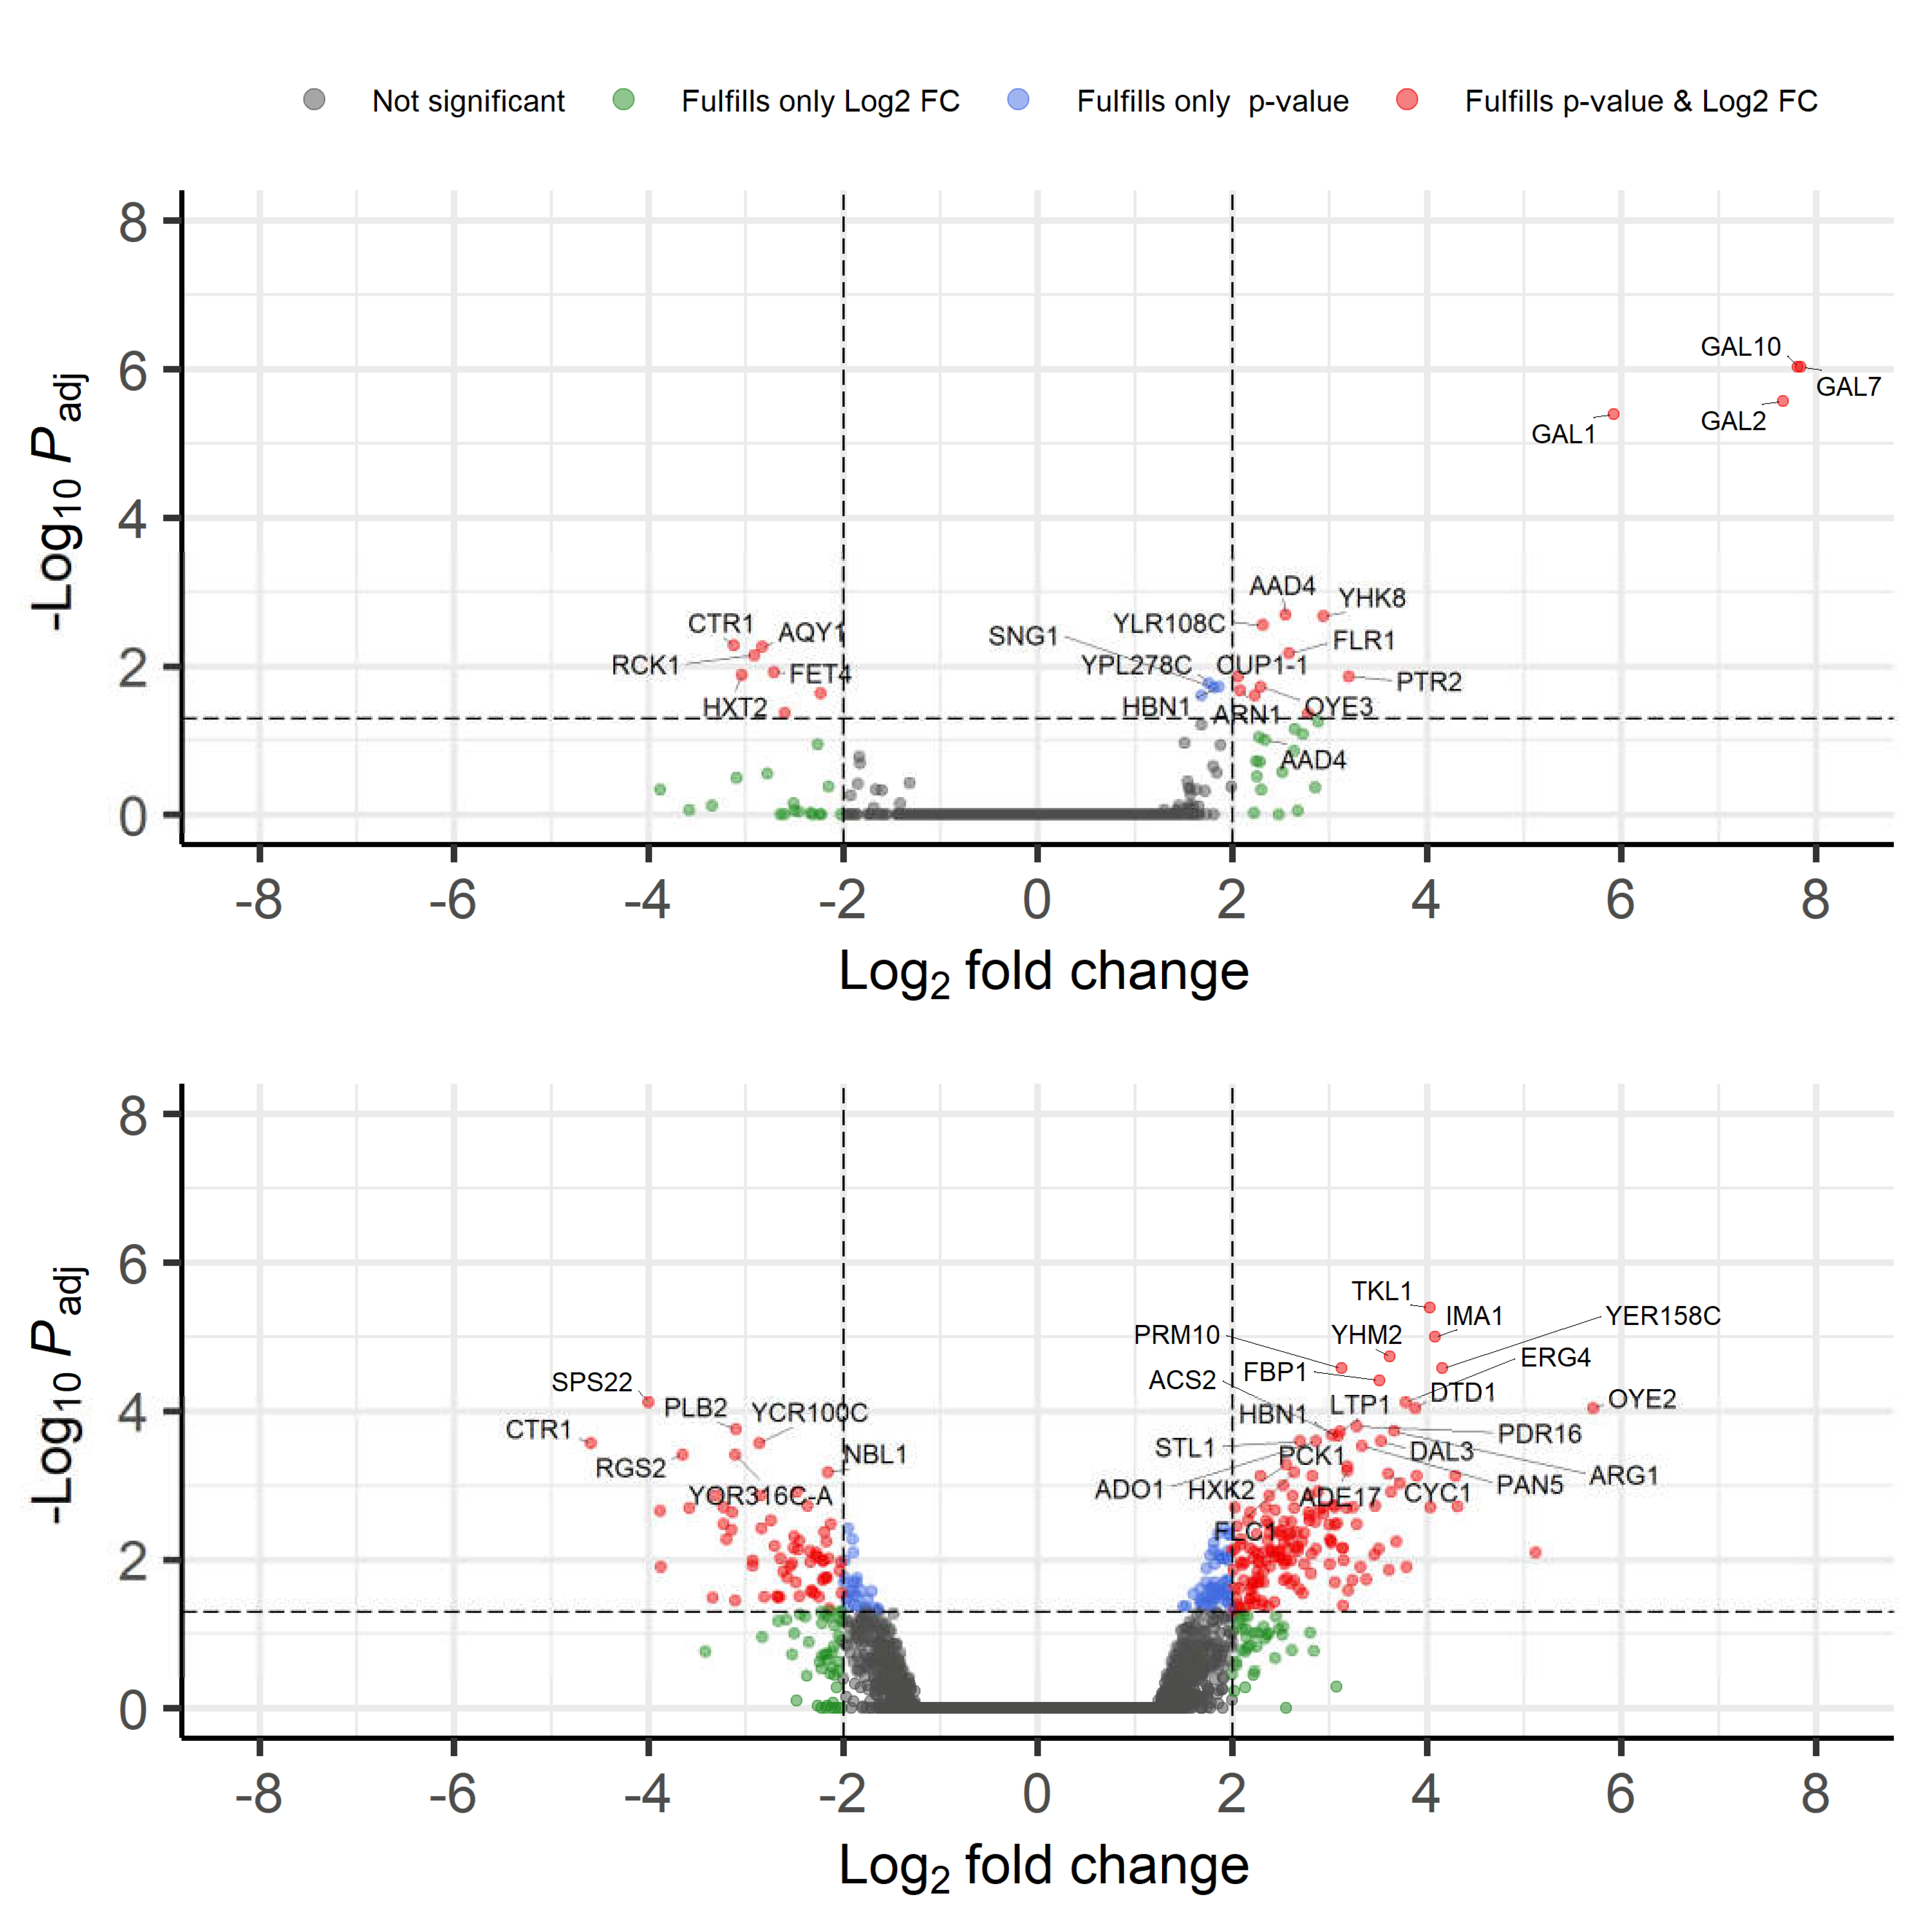
3.2.4. Transcriptome Analysis

To further understand the yeast’s adaptation mechanisms to lignocellulosic hydrolysate, transcriptome analysis was used to compare cells that had undergone short-term adaptation for SSF (fed-batch cultivation in spruce hydrolysate) with cells that had not been adapted (fed-batch cultivation in sugar medium). The differences in gene expression levels were evaluated at 9 h (growing cells; SH 9 h vs. SM 9 h) as well as at the end of fed-batch cultivation (17 h, non-growing cells; SH 17 h vs. SM 17 h). The 9 h timepoint was chosen based on the fact that the furaldehyde reduction activity, which served as an indicator of the cellular response to the inhibitors in the lignocellulosic hydrolysate, was at its highest at this point in the spruce hydrolysate-grown cells (Figure 5). The 17 h timepoint was chosen since it represented the cells from the end of the fed-batch cultivation, which were subsequently used to inoculate the SSF experiments.
The microarray chip used in this study allowed the examination of 5814 gene transcripts from S. cerevisiae. Principal component analysis (PCA) was used to assess the reproducibility of the biological replicates and indeed showed that the replicates clustered together in their respective pairs, and to some extent also by time point and medium condition (Figure S1 in Supplementary Information 1). After data normalization and statistical evaluation (testing for a cut-off of log2 fold change ≥ |2| and a Benjamini–Hochberg adjusted p-value < 0.05), genes with significant up- or downregulation during cultivation in spruce hydrolysate as compared to sugar medium were identified at the two different time points. At 9 h of cultivation (SH 9 h vs. SM 9 h), 25 differentially expressed (DE) genes were identified; out of these 25 DE genes, 18 genes showed an increased expression level, and 7 genes showed a decreased expression level in the hydrolysate compared to the sugar medium (Figure 6A). At the end of the cultivation (SH 17 h vs. SM 17 h), a total of 307 DE genes were identified, with 218 and 89 genes showing increased and decreased expression levels, respectively (Figure 6B). The names of DE gene are listed in Table S1 in Supplementary Information 1, and the full processed data from the microarray analysis is found in Supplementary Information 2.
A Gene Ontology (GO) enrichment analysis was performed on the DE genes and was able to identify significant GO categories for the SH 9 h vs. SM 9 h comparison (Table 3), including galactose catabolic processes, inorganic ion transmembrane transport, and nitrogen compound metabolic process; the latter was the only GO term that had a fold decrease and not an increase. In contrast, no significantly enriched GO categories were identified among the DE genes from the 17 h comparison (SH 17 h vs. SM 17 h). The upregulation of several genes from the galactose pathway at 9 h (Figure 6A) confirmed the validity of the experimental setup, as no galactose was present in the sugar medium as compared to the hydrolysate medium.
In order to highlight the most important genes related to tolerance towards lignocellulosic hydrolysate from this experimental setup, we further focused the analysis on the genes that were differentially expressed in the presence of spruce hydrolysate as compared to the sugar medium in the results from both the 9 h (SH 9 h vs. SM 9 h) and 17 h (SH 17 h vs. SM 17 h) comparisons (Figure S2 in Supplementary Information 1). Overall, only four genes (YHK8, OYE3, HBN1, and YPR159C-A) were significantly upregulated and two genes (CTR1 and RCK1) were significantly downregulated in both comparisons (Table 4). The fact that these genes were differentially expressed at the two different time points taken from very different stages of the cultivation indicates that these genes might play a key role in inhibitor tolerance in S. cerevisiae. This is also reinforced by the fact that they have also been implied in previous studies on lignocellulose hydrolysates (Table 4).
We also specifically looked for known or putative oxidoreductase encoding genes among the DE genes from the comparisons at each timepoint (SH 9 h vs. SM 9 h, and SH 17 h vs. SM 17 h), based on the results from the enzymatic assays and the fact these proteins are known to be important for detoxification of xenobiotic compounds [3]. In addition to OYE3 which was upregulated in spruce hydrolysate at both time points, AAD4 (aryl-alcohol dehydrogenase) was the only upregulated gene in the 9 h comparison. A higher number of reductase genes were upregulated in the 17 h comparison, including ADH6 (NADPH-dependent medium-chain alcohol dehydrogenase), OYE2 (NADPH oxidoreductase), YML131w (putative medium-chain dehydrogenase/reductases), TYR1 (prephenate dehydrogenase), YPL088w (putative aryl alcohol dehydrogenase), NDE1 (NAD(P)H:quinone oxidoreductase), ALD6 (aldehyde dehydrogenase), MIS1 (methylenetetrahydrofolate dehydrogenase), PAN5 (2-dehydropantoate 2-reductase), TRR1 (thioredoxin reductase), FET3 (ferro-O2-oxidoreductase), as well as three genes encoding dehydrogenase enzymes of the ergosterol biosynthesis pathway: ERG4, ERG26, and ERG27 (Table S1 in Supplementary Information 1).

4. Discussion

In the current work, the effects of pre-cultivating yeast in lignocellulosic hydrolysate prior to SSF cultivation were comprehensively studied. An overall process design was demonstrated that allowed a rapid adaptation of the industrial yeast strain S. cerevisiae TMB3500, which in turn led to improved performance in the SSF. In addition, metabolite analysis, enzymatic analysis, and genome-wide transcriptome analysis gave information on the molecular processes occurring during the adaptation phase.
Our results first indicated that yeast responded to lignocellulosic hydrolysate inhibitors by inducing rapid expression of furaldehyde-detoxifying activities. Lignocellulosic hydrolysate inhibitors, especially those with reactive aldehyde groups such as HMF, furfural, vanillin, and veratraldehyde, are known to be particularly toxic to yeast cells [49,50]. To counteract the negative effects of furaldehydes, the yeast cells increased their NADPH-dependent furaldehyde-reducing activities during fed-batch cultivation in spruce hydrolysate (Figure 5). This response was correlated to the expression of genes encoding enzymes that are known (e.g., ADH6, [25,51,52], YML131w [53]) or suspected (e.g., AAD4 and OYE2, [54]) to reduce furaldehydes to less toxic compounds. We also demonstrated the consumption/production of phenolic compounds during the fermentation of a lignocellulosic hydrolysate, and this was found to be associated with the upregulation of genes encoding oxidoreductases that may be involved in the conversion of phenolic compounds. This is notably the case with the old yellow enzymes (encoded by OYE2 and OYE3) that are widely conserved NADPH-dependent oxidoreductases involved in the reduction of 1,4-benzoquinone to hydroquinone [55]. The fact that compounds similar in structure to these quinones, such as catechol and 4-hydroxybenzaldehyde, were converted during cultivation (Figure 4) suggests that these enzymes may contribute to the detoxification of lignocellulosic hydrolysates.
Our transcriptome analysis also pointed towards increased tolerance through the induction of transporters, and more generally through improved transport across the plasma membrane. For instance, there was an increase at the 9 h time point comparison (SH 9 h vs. SM 9 h) in the expression of YHK8 (multidrug permease; Table 4), FLR1 (plasma membrane transporter of the major facilitator superfamily), CUP1-1 (copper- and cadmium-binding protein with antioxidant and superoxide dismutase activity; involved in detoxification of metal ions and removal of superoxide radicals), PTR2 (integral membrane peptide transporter), SNG1 (involved in 6-azauracil transport and regulating phospholipid translocation and cell wall organization), ARN1 (member of the ARN family of transporters that specifically recognize siderophore-iron chelates) and ATR1 (multidrug efflux pump of the major facilitator superfamily). Among them, YHK8 and FLR1 have already been identified as interesting engineering targets for increasing inhibitor tolerance in the so-far only other transcriptome study on short-term adaptation [20]. The overexpression of the transporter genes ATR1 and FLR1 was also, for instance, shown to improve yeast tolerance towards coniferyl aldehyde and HMF [56]. Later on in the cultivation, at the 17 h comparison (SH 17 h vs. SM 17 h), when acetate levels were the highest, there was also a significant expression level increase in PDR12 (Table S1 in Supplemental Materials 1). Pdr12p that catalyzes the ATP-dependent efflux of moderately lipophilic short-chain acid anions through the plasma membrane is known to be important for yeast tolerance to organic acids [57]. We also observed downregulation of transporter genes, notably the copper ion transporter gene CTR1 at both time points; this corroborates earlier results where CTR1 overexpression decreased fitness in inhibitor cocktails (Table 4) [44] and it could imply that Ctr1p is involved in the import of inhibitory compounds inside the cell and needs to be inactivated to increase tolerance.
To further investigate global regulatory events, we looked for associations between the up-/downregulated genes and S. cerevisiae transcription factors (TFs) at each time point, using the YEASTRACT+ database [40] (Table 5; Supplementary Information 3). The hypothesis was that TFs are not necessarily regulated at the transcriptional level, whereas their gene targets are. Indeed, using this screening, a clear association with TFs involved in stress response, notably with Msn2p, Msn4p, and Yap1, was found, although none of the corresponding TF genes were found to be significantly upregulated in our experiment. MSN2 overexpression has been shown to increase the tolerance to oxidative stress and to furfural by reducing the accumulation of reactive oxygen species, but it also led to decreased tolerance to ethanol and lower ethanol titers [58]. Contradictory results on inhibitor tolerance were also recently obtained when overexpressing MSN2 or MSN4 in different strain backgrounds [59]. As for Yap1p, its regulation mostly occurs via signal transduction though redox-sensitive cysteine residues that rapidly sense and activate regulatory proteins [60]. Still, YAP1 overexpression has been shown to increase tolerance to coniferyl aldehyde, HMF and spruce hydrolysate [56]. However, a recent screening of the impact of YAP1 also indicated that YAP1 overexpression did not increase the growth rate nor decreased lag and is even sometimes negatively affecting growth in the presence of lignocellulosic hydrolysates or furaldehydes [59].
In addition to these three known stress-associated TFs, Gcr4p, a TF that regulates amino acid biosynthesis, was highly ranked in the TF-gene association at both time points. Gcr4p is also known to be regulated at the translational level [61,62], and genes that are up- or downregulated under stress/starvation conditions [63] or in the presence of furaldehydes [64] have been associated to this TF. The last two identified TFs related to our DE genes (Table 5) were Ste12p which is involved in the MAPK signaling cascade, and Sok2p, that regulates pseudohyphal differentiation. Again, both these TFs are regulated at the posttranslational level: the nuclear phosphorylation of Ste12p enables the induction of pheromone response genes [65] whereas the protein kinase A-induced phosphorylation of Sok2p enables its repressive role in meiosis [66]. The reason behind the activation of these TFs during growth on spruce hydrolysate remains unclear, but the presence of inhibitors is likely to trigger a redirection of the cell resources from growth/division to the activation of stress response mechanisms.

5. Conclusions

Our results demonstrate that S. cerevisiae is able to develop a rapid adaptive response to lignocellulosic hydrolysate, which can significantly improve its fermentation performance in harsh conditions. By integrating in vitro and in vivo measurements of conversion of furaldehyde and phenolic compounds with transcriptome analysis, we show that the rapid adaptation to hydrolysate involves induction of detoxifying activities as well as the increased expression of genes encoding oxido-reductases and transporters. We also hypothesize that these effects occur via the rapid activation of a few key transcription factors (Msn2/4p, Yap1p, Gcn4p, in particular) at the post-transcriptional level.

Supplementary Materials

The following supporting information can be downloaded at: https://www.mdpi.com/article/10.3390/fermentation9010072/s1, Supplementary Information 1: Supplemental figures and tables; Supplementary Information 2: the processed microarray data, including statistical test results for all probes; Supplementary Information 3: Transcription factor analysis.

Author Contributions

Conceptualization, G.L. and M.F.G.-G.; methodology, J.R.M.A., M.W., D.H., D.P.B., U.S., G.L. and M.F.G.-G.; validation, J.R.M.A., M.W., D.H. and D.P.B.; formal analysis, J.R.M.A., M.W., D.H., D.P.B. and M.F.G.-G.; investigation, J.R.M.A., M.W. and D.H.; data curation, J.R.M.A. and D.P.B.; writing—original draft preparation, J.R.M.A. and M.F.G.-G.; writing—review and editing, all authors.; supervision, G.L., U.S. and M.F.G.-G.; project administration, M.F.G.-G.; funding acquisition, B.H.-H., G.L., M.F.G.-G. and U.S. All authors have read and agreed to the published version of the manuscript.

Funding

This work was supported by the European Union (NILE, EU contract 019882) and the Swedish Energy Agency (grant P20143). The APC was covered by the journal.

Institutional Review Board Statement

Not applicable.

Informed Consent Statement

Not applicable.

Data Availability Statement

The microarray data discussed in this publication have been deposited in NCBI’s Gene Expression Omnibus [34] and are accessible through GEO Series accession number GSE218764. The R code used to process and analyze the data is available on the following GitHub page: https://github.com/MicrobialEngineeringGroupTMB/.

Acknowledgments

We acknowledge help with microarray lab-work and analysis from the Microarray Resource Centre at Lund University.

Conflicts of Interest

The authors declare no conflict of interest. The funders had no role in the design of the study; in the collection, analyses, or interpretation of data; in the writing of the manuscript; or in the decision to publish the results.

References

  1. Galbe, M.; Zacchi, G. Pretreatment of lignocellulosic materials for efficient bioethanol production. Adv. Biochem. Eng. Biotechnol. 2007, 108, 41–65. [Google Scholar] [CrossRef] [PubMed]
  2. Hahn-Hägerdal, B.; Karhumaa, K.; Jeppsson, M.; Gorwa-Grauslund, M.F. Metabolic engineering for pentose utilization in Saccharomyces cerevisiae. Adv. Biochem. Eng./Biotechnol. 2007, 108, 147–177. [Google Scholar] [CrossRef]
  3. Almeida, J.R.M.; Modig, T.; Petersson, A.; Hahn-Hägerdal, B.; Lidén, G.; Gorwa-Grauslund, M.F. Increased tolerance and conversion of inhibitors in lignocellulosic hydrolysates by Saccharomyces cerevisiae. J. Chem. Technol. Biotechnol. 2007, 82, 340–349. [Google Scholar] [CrossRef]
  4. Klinke, H.B.; Thomsen, A.B.; Ahring, B.K. Inhibition of ethanol-producing yeast and bacteria by degradation products produced during pre-treatment of biomass. Appl. Microbiol. Biotechnol. 2004, 66, 10–26. [Google Scholar] [CrossRef] [PubMed]
  5. Buschke, N.; Schäfer, R.; Becker, J.; Wittmann, C. Metabolic engineering of industrial platform microorganisms for biorefinery applications—Optimization of substrate spectrum and process robustness by rational and evolutive strategies. Bioresour. Technol. 2013, 135, 544–554. [Google Scholar] [CrossRef]
  6. Hong, K.-K.; Nielsen, J. Metabolic engineering of Saccharomyces cerevisiae: A key cell factory platform for future biorefineries. Cell. Mol. Life Sci. 2012, 69, 2671–2690. [Google Scholar] [CrossRef]
  7. Brandberg, T.; Franzén, C.J.; Gustafsson, L. The fermentation performance of nine strains of Saccharomyces cerevisiae in batch and fed-batch cultures in dilute-acid wood hydrolysate. J. Biosci. Bioeng. 2004, 98, 122–125. [Google Scholar] [CrossRef]
  8. Heer, D.; Sauer, U. Identification of furfural as a key toxin in lignocellulosic hydrolysates and evolution of a tolerant yeast strain. Microb. Biotechnol. 2008, 1, 497–506. [Google Scholar] [CrossRef]
  9. Almeida, J.R.M.; Bertilsson, M.; Gorwa-Grauslund, M.F.; Gorsich, S.; Lidén, G. Metabolic effects of furaldehydes and impacts on biotechnological processes. Appl. Microbiol. Biotechnol. 2009, 82, 625–638. [Google Scholar] [CrossRef]
  10. Gorsich, S.W.; Dien, B.S.; Nichols, N.N.; Slininger, P.J.; Liu, Z.L.; Skory, C.D. Tolerance to furfural-induced stress is associated with pentose phosphate pathway genes ZWF1, GND1, RPE1, and TKL1 in Saccharomyces cerevisiae. Appl. Microbiol. Biotechnol. 2006, 71, 339–349. [Google Scholar] [CrossRef]
  11. Larsson, S.; Palmqvist, E.; Hahn-Hägerdal, B.; Tengborg, C.; Stenberg, K.; Zacchi, G.; Nilvebrant, N.-O. The generation of fermentation inhibitors during dilute acid hydrolysis of softwood. Enzym. Microb. Technol. 1999, 24, 151–159. [Google Scholar] [CrossRef]
  12. Guaragnella, N.; Bettiga, M. Acetic acid stress in budding yeast: From molecular mechanisms to applications. Yeast 2021, 38, 391–400. [Google Scholar] [CrossRef]
  13. Larsson, S.; Quintana-Sáinz, A.; Reimann, A.; Nilvebrant, N.-O.; Jönsson, L. Influence of lignocellulose-derived aromatic compounds on oxygen-limited growth and ethanolic fermentation by Saccharomyces cerevisiae. Appl. Biochem. Biotechnol. 2000, 84–86, 617–632. [Google Scholar] [CrossRef]
  14. Adeboye, P.T.; Bettiga, M.; Olsson, L. The chemical nature of phenolic compounds determines their toxicity and induces distinct physiological responses in Saccharomyces cerevisiae in lignocellulose hydrolysates. AMB Express 2014, 4, 46. [Google Scholar] [CrossRef] [Green Version]
  15. Liu, Z.L.; Slininger, P.J.; Gorsich, S.W. Enhanced biotransformation of furfural and hydroxymethylfurfural by newly developed ethanologenic yeast strains. Appl. Biochem. Biotechnol. 2005, 121–124, 451–460. [Google Scholar] [CrossRef]
  16. Martin, C.; Marcet, M.; Almazan, O.; Jönsson, L.J. Adaptation of a recombinant xylose-utilizing Saccharomyces cerevisiae strain to a sugarcane bagasse hydrolysate with high content of fermentation inhibitors. Bioresour. Technol. 2007, 98, 1767–1773. [Google Scholar] [CrossRef]
  17. Li, B.; Liu, N.; Zhao, X. Response mechanisms of Saccharomyces cerevisiae to the stress factors present in lignocellulose hydrolysate and strategies for constructing robust strains. Biotechnol. Biofuels. Bioprod. 2022, 15, 28. [Google Scholar] [CrossRef]
  18. Cámara, E.; Olsson, L.; Zrimec, J.; Zelezniak, A.; Geijer, C.; Nygård, Y. Data mining of Saccharomyces cerevisiae mutants engineered for increased tolerance towards inhibitors in lignocellulosic hydrolysates. Biotechnol. Adv. 2022, 57, 107947. [Google Scholar] [CrossRef]
  19. Alkasrawi, M.; Rudolf, A.; Lidén, G.; Zacchi, G. Influence of strain and cultivation procedure on the performance of simultaneous saccharification and fermentation of steam pretreated spruce. Enzym. Microb. Technol. 2006, 38, 279–286. [Google Scholar] [CrossRef]
  20. Van Dijk, M.; Rugbjerg, P.; Nygård, Y.; Olsson, L. RNA sequencing reveals metabolic and regulatory changes leading to more robust fermentation performance during short-term adaptation of Saccharomyces cerevisiae to lignocellulosic inhibitors. Biotechnol. Biofuels. 2021, 14, 201. [Google Scholar] [CrossRef]
  21. Almeida, J.R.M.; Karhumaa, K.; Bengtsson, O.; Gorwa-Grauslund, M.-F. Screening of Saccharomyces cerevisiae strains with respect to anaerobic growth in non-detoxified lignocellulose hydrolysate. Bioresour. Technol. 2009, 100, 3674–3677. [Google Scholar] [CrossRef] [PubMed]
  22. Modig, T.; Almeida, J.R.M.; Gorwa-Grauslund, M.F.; Lidén, G. Variability of the response of Saccharomyces cerevisiae strains to lignocellulose hydrolysate. Biotechnol. Bioeng. 2008, 100, 423–429. [Google Scholar] [CrossRef] [PubMed]
  23. Sluiter, A.; Hames, B.; Ruiz, R.; Scarlata, C.; Sluiter, J.; Tempelton, D.; Crocker, D. Determination of structural carbohydrates and lignin in biomass. Lab. Anal. Proced. Natl. Renew. Energy Lab. Gold. CO USA 2008, 1617, 1–16. [Google Scholar]
  24. Ruiz, R.; Ehrman, T. HPLC analysis of liquid fractions of process samples for monomeric sugars and cellobiose. In Laboratory Analytical Procedure (LAP 013); National Renewable Energy Laboratory: Golden, CO, USA, 1996. [Google Scholar]
  25. Petersson, A.; Almeida, J.R.M.; Modig, T.; Karhumaa, K.; Hahn-Hägerdal, B.; Gorwa-Grauslund, M.F.; Lidén, G. A 5-hydroxymethyl furfural reducing enzyme encoded by the Saccharomyces cerevisiae ADH6 gene conveys HMF tolerance. Yeast 2006, 23, 455–464. [Google Scholar] [CrossRef] [PubMed] [Green Version]
  26. R Core Team. R: A Language and Environment for Statistical Computing, R Foundation for Statistical Computing: Vienna, Austria. 2022. Available online: https://www.R-project.org/ (accessed on 10 November 2022).
  27. Gautier, L.; Cope, L.; Bolstad, B.M.; Irizarry, R.A. affy—Analysis of Affymetrix GeneChip data at the probe level. Bioinformatics 2004, 20, 307–315. [Google Scholar] [CrossRef] [Green Version]
  28. Ritchie, M.E.; Phipson, B.; Wu, D.; Hu, Y.; Law, C.W.; Shi, W.; Smyth, G.K. limma powers differential expression analyses for RNA-sequencing and microarray studies. Nucleic Acids Res. 2015, 43, e47. [Google Scholar] [CrossRef]
  29. Irizarry, R.; Hobbs, B.; Collin, F.; Beazer-Barclay, Y.; Antonellis, K.; Scherf, U.; Speed, T. Exploration, normalization, and summaries of high density oligonucleotide array probe level data. Biostatistics 2003, 4, 249–264. [Google Scholar] [CrossRef] [Green Version]
  30. McCarthy, D.J.; Smyth, G.K. Testing significance relative to a fold-change threshold is a TREAT. Bioinformatics 2009, 25, 765–771. [Google Scholar] [CrossRef] [Green Version]
  31. Carlson, M. Yeast2.db: Affymetrix Yeast Genome 2.0 Array Annotation Data (Chip Yeast2), R package version 3.2.3: 2016. Available online: https://bioconductor.org/packages/release/data/annotation/html/yeast2.db.html (accessed on 10 November 2022).
  32. Cherry, J.M.; Hong, E.L.; Amundsen, C.; Balakrishnan, R.; Binkley, G.; Chan, E.T.; Christie, K.R.; Costanzo, M.C.; Dwight, S.S.; Engel, S.R.; et al. Saccharomyces Genome Database: The genomics resource of budding yeast. Nucleic Acids Res. 2011, 40, D700–D705. [Google Scholar] [CrossRef] [Green Version]
  33. Durinck, S.; Moreau, Y.; Kasprzyk, A.; Davis, S.; De Moor, B.; Brazma, A.; Huber, W. BioMart and Bioconductor: A powerful link between biological databases and microarray data analysis. Bioinformatics 2005, 21, 3439–3440. [Google Scholar] [CrossRef] [Green Version]
  34. Edgar, R.; Domrachev, M.; Lash, A.E. Gene Expression Omnibus: NCBI gene expression and hybridization array data repository. Nucleic Acids Res. 2002, 30, 207–210. [Google Scholar] [CrossRef]
  35. Blighe, K.; Rana, S.; Lewis, M. EnhancedVolcano: Publication-Ready Volcano Plots with Enhanced Colouring and Labeling, R package version 1.16.0: 2022. Available online: https://github.com/kevinblighe/EnhancedVolcano (accessed on 10 November 2022).
  36. Mi, H.; Muruganujan, A.; Huang, X.; Ebert, D.; Mills, C.; Guo, X.; Thomas, P.D. Protocol Update for large-scale genome and gene function analysis with the PANTHER classification system (v.14.0). Nat. Protoc. 2019, 14, 703–721. [Google Scholar] [CrossRef]
  37. Thomas, P.D.; Ebert, D.; Muruganujan, A.; Mushayahama, T.; Albou, L.-P.; Mi, H. PANTHER: Making genome-scale phylogenetics accessible to all. Protein Sci. 2022, 31, 8–22. [Google Scholar] [CrossRef]
  38. Ashburner, M.; Ball, C.A.; Blake, J.A.; Botstein, D.; Butler, H.; Cherry, J.M.; Davis, A.P.; Dolinski, K.; Dwight, S.S.; Eppig, J.T.; et al. Gene Ontology: Tool for the unification of biology. Nat. Genet. 2000, 25, 25–29. [Google Scholar] [CrossRef] [Green Version]
  39. The Gene Ontology Consortium. The Gene Ontology resource: Enriching a GOld mine. Nucleic Acids Res. 2020, 49, D325–D334. [Google Scholar] [CrossRef]
  40. Teixeira, M.C.; Viana, R.; Palma, M.; Oliveira, J.; Galocha, M.; Mota, M.N.; Couceiro, D.; Pereira, M.G.; Antunes, M.; Costa, I.V.; et al. YEASTRACT+: A portal for the exploitation of global transcription regulation and metabolic model data in yeast biotechnology and pathogenesis. Nucleic Acids Res 2022, 51, D785–D791. [Google Scholar] [CrossRef]
  41. Träff, K.L.; Jönsson, L.J.; Hahn-Hägerdal, B. Putative xylose and arabinose reductases in Saccharomyces cerevisiae. Yeast 2002, 19, 1233–1241. [Google Scholar] [CrossRef]
  42. Nelissen, B.; De Wachter, R.; Goffeau, A. Classification of all putative permeases and other membrane plurispanners of the major facilitator superfamily encoded by the complete genome of Saccharomyces cerevisiae. FEMS Microbiol. Rev. 1997, 21, 113–134. [Google Scholar] [CrossRef]
  43. Sousa, M.; Duarte, A.M.; Fernandes, T.R.; Chaves, S.R.; Pacheco, A.; Leao, C.; Corte-Real, M.; Sousa, M.J. Genome-wide identification of genes involved in the positive and negative regulation of acetic acid-induced programmed cell death in Saccharomyces cerevisiae. BMC Genom. 2013, 14, 838. [Google Scholar] [CrossRef] [Green Version]
  44. Sardi, M.; Rovinskiy, N.; Zhang, Y.; Gasch, A.P. Leveraging genetic-background effects in Saccharomyces cerevisiae to improve lignocellulosic hydrolysate tolerance. Appl Env. Microbiol 2016, 82, 5838–5849. [Google Scholar] [CrossRef] [Green Version]
  45. De Oliveira, I.M.; Zanotto-Filho, A.; Moreira, J.C.; Bonatto, D.; Henriques, J.A. The role of two putative nitroreductases, Frm2p and Hbn1p, in the oxidative stress response in Saccharomyces cerevisiae. Yeast 2010, 27, 89–102. [Google Scholar] [CrossRef] [PubMed]
  46. Hacisalihoglu, B.; Holyavkin, C.; Topaloglu, A.; Kisakesen, H.I.; Cakar, Z.P. Genomic and transcriptomic analysis of a coniferyl aldehyde-resistant Saccharomyces cerevisiae strain obtained by evolutionary engineering. FEMS Yeast Res. 2019, 19, foz021. [Google Scholar] [CrossRef] [PubMed]
  47. Ask, M.; Bettiga, M.; Mapelli, V.; Olsson, L. The influence of HMF and furfural on redox-balance and energy-state of xylose-utilizing Saccharomyces cerevisiae. Biotechnol. Biofuels. 2013, 6, 22. [Google Scholar] [CrossRef] [PubMed] [Green Version]
  48. Fernández-Niño, M.; Pulido, S.; Stefanoska, D.; Pérez, C.; González-Ramos, D.; van Maris, A.J.A.; Marchal, K.; Nevoigt, E.; Swinnen, S. Identification of novel genes involved in acetic acid tolerance of Saccharomyces cerevisiae using pooled-segregant RNA sequencing. FEMS Yeast Res. 2018, 18, foy100. [Google Scholar] [CrossRef] [PubMed]
  49. Klinke, H.B.; Olsson, L.; Thomsen, A.B.; Ahring, B.K. Potential inhibitors from wet oxidation of wheat straw and their effect on ethanol production of Saccharomyces cerevisiae: Wet oxidation and fermentation by yeast. Biotechnol Bioeng 2003, 81, 738–747. [Google Scholar] [CrossRef]
  50. Larsson, S. Ethanol from Lignocellulose—Fermentation Inhibitors, Detoxification and Genetic Engineering of Saccharomyces cerevisiae for Enhanced Resistance. Ph.D. Thesis, Lund University, Lund, Sweden, 2000. [Google Scholar]
  51. Larroy, C.; Fernández, M.R.; González, E.; Parés, X.; Biosca, J.A. Characterization of the Saccharomyces cerevisiae YMR318C (ADH6) gene product as a broad specificity NADPH-dependent alcohol dehydrogenase: Relevance in aldehyde reduction. Biochem. J. 2002, 361, 163–172. [Google Scholar] [CrossRef]
  52. Liu, Z.L.; Moon, J.; Andersh, B.J.; Slininger, P.J.; Weber, S. Multiple gene-mediated NAD(P)H-dependent aldehyde reduction is a mechanism of in situ detoxification of furfural and 5-hydroxymethylfurfural by Saccharomyces cerevisiae. Appl. Microbiol. Biotechnol. 2008, 81, 743–753. [Google Scholar] [CrossRef]
  53. Li, X.; Yang, R.H.; Ma, M.G.; Wang, X.; Tang, J.; Zhao, X.X.; Zhang, X.P. A novel aldehyde reductase encoded by YML131W from Saccharomyces cerevisiae confers tolerance to furfural derived from lignocellulosic biomass conversion. Bioenerg. Res. 2015, 8, 119–129. [Google Scholar] [CrossRef]
  54. Ask, M.; Bettiga, M.; Duraiswamy, V.R.; Olsson, L. Pulsed addition of HMF and furfural to batch-grown xylose-utilizing Saccharomyces cerevisiae results in different physiological responses in glucose and xylose consumption phase. Biotechnol. Biofuels. 2013, 6, 181. [Google Scholar] [CrossRef] [Green Version]
  55. Massey, V.; Schopfer, L.M. Reactivity of old yellow enzyme with alpha-NADPH and other pyridine nucleotide derivatives. J. Biol. Chem. 1986, 261, 1215–1222. [Google Scholar] [CrossRef]
  56. Alriksson, B.; Horváth, I.S.; Jönsson, L.J. Overexpression of Saccharomyces cerevisiae transcription factor and multidrug resistance genes conveys enhanced resistance to lignocellulose-derived fermentation inhibitors. Process Biochem. 2010, 45, 264–271. [Google Scholar] [CrossRef]
  57. Piper, P.; Mahe, Y.; Thompson, S.; Pandjaitan, R.; Holyoak, C.; Egner, R.; Muhlbauer, M.; Coote, P.; Kuchler, K. The pdr12 ABC transporter is required for the development of weak organic acid resistance in yeast. EMBO J. 1998, 17, 4257–4265. [Google Scholar] [CrossRef] [Green Version]
  58. Sasano, Y.; Watanabe, D.; Ukibe, K.; Inai, T.; Ohtsu, I.; Shimoi, H.; Takagi, H. Overexpression of the yeast transcription activator Msn2 confers furfural resistance and increases the initial fermentation rate in ethanol production. J. Biosci. Bioeng. 2012, 113, 451–455. [Google Scholar] [CrossRef]
  59. Mertens, J.A.; Skory, C.D.; Nichols, N.N.; Hector, R.E. Impact of stress-response related transcription factor overexpression on lignocellulosic inhibitor tolerance of Saccharomyces cerevisiae environmental isolates. Biotechnol. Prog. 2021, 37, e3094. [Google Scholar] [CrossRef]
  60. Herrero, E.; Ros, J.; Belli, G.; Cabiscol, E. Redox control and oxidative stress in yeast cells. Biochim. Biophys. Acta 2008, 1780, 1217–1235. [Google Scholar] [CrossRef]
  61. Hinnebusch, A.G. Gene-Specific Translational Control of the Yeast Gcn4 Gene by Phosphorylation of Eukaryotic Initiation Factor-Ii. Mol. Microbiol. 1993, 10, 215–223. [Google Scholar] [CrossRef]
  62. Hinnebusch, A.G. Translational regulation of GCN4 and the general amino acid control of yeast. Annu. Rev. Microbiol. 2005, 59, 407–450. [Google Scholar] [CrossRef]
  63. Natarajan, K.; Meyer, M.R.; Jackson, B.M.; Slade, D.; Roberts, C.; Hinnebusch, A.G.; Marton, M.J. Transcriptional profiling shows that Gcn4p is a master regulator of gene expression during amino acid starvation in yeast. Mol. Cell Biol. 2001, 21, 4347–4368. [Google Scholar] [CrossRef] [Green Version]
  64. Ma, M.; Liu, Z.L. Comparative transcriptome profiling analyses during the lag phase uncover YAP1, PDR1, PDR3, RPN4, and HSF1 as key regulatory genes in genomic adaptation to the lignocellulose derived inhibitor HMF for Saccharomyces cerevisiae. BMC Genom. 2010, 11, 660. [Google Scholar] [CrossRef] [Green Version]
  65. Dohlman, H.G.; Thorner, J.W. Regulation of G protein-initiated signal transduction in yeast: Paradigms and principles. Annu. Rev. Biochem. 2001, 70, 703–754. [Google Scholar] [CrossRef]
  66. Shenhar, G.; Kassir, Y. A positive regulator of mitosis, Sok2, functions as a negative regulator of meiosis in Saccharomyces cerevisiae. Mol. Cell Biol. 2001, 21, 1603–1612. [Google Scholar] [CrossRef] [PubMed]
Figure 1. Metabolite concentration profiles from the SSF experiments. (A): ethanol (▲) and glucose (♦); (B): HMF (●) and furfural (■). Filled symbols and solid lines represent experiments with yeast cultivated on spruce hydrolysate. Empty symbols and dashed lines represent experiments with yeast cultivated on sugar medium. Duplicate experiments showed similar results and the figure shows one of the representative profiles for each cultivation.
Fermentation 09 00072 g001
Figure 2. Profile of fed-batch cultivation with S. cerevisiae TMB3500 in spruce hydrolysate (top) and in sugar mixture (bottom). First y-axis: biomass (♦), xylose (■), xylitol (□), ethanol (▲); second y-axis: acetate (◊) and HMF (●). Duplicate experiments showed similar results and the figure shows one of the representative profiles for each cultivation.
Fermentation 09 00072 g002
Figure 3. Phenolic compounds found in fed-batch cultivation with spruce hydrolysate. Numbers represent the percentage ratio at the end of fed-batch cultivation between the amount of compound measured and the amount of compound added to the medium. Values above 100 indicate that the compound was produced during the cultivation while values below 100 indicate compound conversion. The amount of each phenolic compound added during the fed-batch cultivation was calculated based on the initial concentration of the compound in the spruce hydrolysate.
Fermentation 09 00072 g003
Figure 4. Conversion of vanillin to vanillic/vanillyl alcohol in the fed-batch cultivation of S. cerevisiae TMB3500 in spruce hydrolysate. Filled symbols: measured values; empty symbols: the expected amount considering the amount of hydrolysate added. Compounds: vanillin (■), vanillin alcohol (▲).
Fermentation 09 00072 g004
Figure 5. HMF (left column) and furfural (right column) reduction activity measurements in crude cell extracts from yeast cells cultivated in fed-batch mode using either spruce hydrolysate (SH; grey bars) or sugar medium (SM; white bars). Activity was measured using either NADH (top row) or NADPH (bottom row) as cofactor.
Fermentation 09 00072 g005
Figure 6. Volcano plots showing the results of the microarray data processed using the “global” settings of Limma’s decideTests. The Padj of the y-axis represents Benjamini–Hochberg adjusted p-values. (Top): Comparison of gene expression between spruce hydrolysate 9 h and sugar medium 9 h (SH 9 h vs. SM 9 h). Due to display limitations, only the 20 significant differentially expressed (DE) genes with lowest adjusted p-values from this comparison are labeled. Note that there are two probes on the Affymetrix Yeast Genome 2.0 array annotated as AAD4 and that only one of them (1771716_s_at) was found to be significantly DE by the test. Four genes with an average log2 fold change just below the >|2| threshold were found to be statistically significant according to decideTests when the replicates were taken into consideration. (Bottom): Comparison of gene expression between spruce hydrolysate 17 h and sugar medium 17 h (SH 17 h vs. SM 17 h). The 30 significant differentially expressed (DE) genes with lowest adjusted p-values from this comparison are labeled. For this figure, all S. pombe and control probes were omitted, and thus only contain the 5814 S. cerevisiae probes from the Yeast Genome 2.0 array. The full results for all probes can be found in Supplemental Information 2.
Fermentation 09 00072 g006
Table 1. Composition of the pre-treated spruce materials. The water-insoluble solids (WIS) content of the material was 15.0%. Note that the phenolic compounds could not be quantitatively analyzed by the HPLC method used for analyses of the hydrolysate.
SSF ExperimentsFed-Batch Cultivation
Solids (% of WIS)Liquid (g/L)Liquid (g/L)
Glucan54.6Glucose19.835.3
Mannan-Mannose33.920.4
Galactan-Galactose5.94.5
Xylan-Xylose12.48.1
Lignin39.3HMF1.93.7
Furfural 1.23.0
Acetic acid4.35.1
Table 2. Ethanol production and concentrations of metabolites obtained in the SSF experiments after 120 h with yeast cultivated in spruce hydrolysate (SH) and sugar medium (SM). The measurements are the average and standard deviation of two biological replicates.
Yeast Cultivated inEthanol
(g/L)
Ethanol Yield
(% of Theoretical)
Initial Ethanol Prod. 1 (g/L.h)Acetate
(g/L)
Xylitol
(g/L)
Glycerol (g/L)
SH40.9 ± 0.184.8 ± 0.31.98 ± 0.673.8 ± 0.82.4 ± 2.13.6 ± 0.4
SM39.3 ± 0.381.6 ± 0.60.60 ± 0.063.5 ± 0.01.3 ± 2.92.2 ± 0.4
1 Average ethanol productivity during the first 10 h.
Table 3. Result of the Gene Ontology (GO) enrichment analysis for the 25 identified DE genes from the 9 h comparison (SH 9 h vs. SM 9 h). The table is sorted by fold enrichment. No significantly enriched GO terms were found when performing the same analysis on the 17 h DE genes (SH 17 h vs. SM 17 h). See Material and Methods for details on the analysis.
GO Term (Biological Process)Fold Enrichment of GO Term in the 9 h Dataset Compared to the Full S. cerevisiae DatasetFDR (False Discovery Rate)Genes in 9 h Set with the GO Term
Galactose catabolic process via UDP-galactose (GO:0033499)>1004.42 × 10−3GAL1; GAL7; GAL10
Galactose catabolic process (GO:0019388)98.647.76 × 10−3GAL1; GAL7; GAL10
Galactose metabolic process (GO:0006012)80.949.10 × 10−4GAL1; GAL2; GAL7; GAL10
Hexose catabolic process (GO:0019320)65.761.51 × 10−2GAL1; GAL7; GAL10
Monosaccharide catabolic process (GO:0046365)43.842.77 × 10−2GAL1; GAL7; GAL10
Hexose metabolic process (GO:0019318)20.232.55 × 10−2GAL1; GAL2; GAL7; GAL10
Monosaccharide metabolic process (GO:0005996)16.974.06 × 10−2GAL1; GAL2; GAL7; GAL10
Inorganic ion transmembrane transport (GO:0098660)10.643.71 × 10−3ARN1; ATR1; CTR1; GAL2; HXT2; SUL1; ZRT1
Ion transmembrane transport (GO:0034220)7.371.72 × 10−2ARN1; ATR1; AQY1; CTR1; GAL2; HXT2; PTR1; SUL1; ZRT1
Transmembrane transport (GO:0055085)6.401.32 × 10−3ARN1; ATR1; AQY1; CTR1; FLR1; GAL2; HXT2; PTR2; SUL1; YHK8; ZRT1;
Ion transport (GO:0006811)6.171.59 × 10−2ARN1; ATR1; CTR1; GAL2; HXT2; SUL1; YHK8; ZRT1;
Nitrogen compound metabolic process (GO:0006807)0.098.55 × 10−3RCK1
Table 4. Significantly up- or downregulated genes in spruce hydrolysate cell cultivation at both sampling times, and previous knowledge of their role in inhibitor or stress tolerance. GO classifications were obtained from SGD (https://www.yeastgenome.org/; [32]), unless noted otherwise.
GeneFold Change
(log2FC)
GO Category/FunctionPrevious Knowledge on Inhibitor/stress Tolerance
YHK8
(YHR048W)
2.94 (9 h)
2.21 (17 h)
Member of the multidrug permease homolog family [42]
Believed to be involved in xenobiotic detoxification by transmembrane export; putative plasma membrane localization
Deletion reported to increase tolerance to acetate [43]
Deletion reported to increase sensitivity to wheat straw hydrolysate [20]
Overexpression shown to reduce the lag phase in wheat straw hydrolysate [20]
OYE32.29 (9 h)
2.39 (17 h)
NADPH dehydrogenase with a role in apoptosisDeletion reported to increase tolerance to acetate [43]
Overexpression reported to decrease fitness in hydrolysate toxin cocktails [44]
HBN11.87 (9 h)
3.03 (17 h)
Putative oxidoreductase acting on NAD(P)H and nitrogenous group as acceptor
Hbn1p nitroreductases also influences the response to oxidative stress in S. cerevisiae yeast by modulating the GSH contents and antioxidant enzymatic activities [45]
Upregulated genes in a coniferyl aldehyde-resistant strain [46] as well as in the presence of HMF and furfural [47]
Upregulated during short-term adaptation on wheat straw hydrolysate [20]
An HBN1 locus with a synonymous sequence variant was found to be significantly differentially expressed between a yeast strain with superior acetate tolerance and a strain with inferior tolerance [48]
YPR159C-A2.78 (9 h)
3.69 (17 h)
UnknownDeletion increases tolerance to acetate [43]
Overexpression decreases fitness in hydrolysate toxin cocktails [44]
CTR1−3.13 (9 h)
−4.59 (17 h)
Copper ion transmembrane transporter that has role in copper ion importOverexpression decreases fitness in hydrolysate toxin cocktails [44]
RCK1−2.91 (9 h)
−3.23 (17 h)
Kinase involved in regulation of meiotic nuclear divisionDeletion increases tolerance to acetate [43]
Table 5. Transcription factors associated to the up-/downregulated genes. The search was performed using YEASTRACT+ [40] and it was restricted to TFs acting as activator or inhibitor and with DNA binding and expression evidence to the candidate genes. Only TFs displaying association with more than 25% of total gene pool (bold numbers) in at least one of the conditions are displayed. The complete search results are available in Supplementary Information 3.
Transcription FactorNumber of Up-/Downregulated Genes with Documented Regulation by the Given TF
9 h17 h
Msn2p, stress-responsive transcriptional activator 11/21 186/297
Ste12p, TF factor that is activated by a MAPK signaling cascade 10/21 71/297
Yap1p, TF required for oxidative stress tolerance 8/21 39/297
Sok2p, Nuclear protein that negatively regulates pseudohyphal differentiation 7/21 48/297
Msn4p, stress-responsive transcriptional activator 7/21 31/297
Gcn4p, bZIP transcriptional activator of amino acid biosynthetic genes 6/21 82/297
1 At 9 h, the GAL genes were not considered in the pool of genes, due to their correlation to the lack of galactose in the spruce hydrolysate experiment; hence only 21 genes were considered out of 25.
Disclaimer/Publisher’s Note: The statements, opinions and data contained in all publications are solely those of the individual author(s) and contributor(s) and not of MDPI and/or the editor(s). MDPI and/or the editor(s) disclaim responsibility for any injury to people or property resulting from any ideas, methods, instructions or products referred to in the content.

