Abstract
The growth pattern of probiotics can be modified by changing their nutritional factors and their physiological stage. Meanwhile, high intensity ultrasound (HIUS) can be employed to increase probiotics’ biomass. The one-factor-at-a-time (OFAT) approach was employed to investigate the influence of the growth medium (MRS broth, whole milk, and skim milk), culture age (1 day and 7 days old) and ultrasound parameters (time and amplitude) on the kinetic parameters of L. acidophilus. The oldest culture (7 days) had a greater lag phase and time to reach the end of the sigmoidal curve (Tmax) (p < 0.05) as well as a lower rate (maximum growth potential μmax) compared to the youngest culture (1 day). Regarding the growth medium, skim milk presented the greatest L. acidophilus counts (p < 0.05). Meanwhile, sonication times (60 and 90 s) change µmax and Tmax. When 30% amplitude was applied, a greater μmax and a smaller Tmax were observed (p < 0.05). It can be concluded that the growth medium, culture age, and ultrasound parameters (time and amplitude) influence the kinetic parameters of L. acidophilus. Results from this study could be used in the design and optimization of processes to improve the growth of the probiotic L. acidophilus at industrial scale.
1. Introduction
In the production of dairy foods with probiotics, viability of the probiotics is the most important factor to confer health benefits to the host. However, it has been recognized that non-viable microorganisms, their cellular components, and/or their metabolites can also have an impact on the health of those who consume them. These products have been defined with various terms such as: non-viable probiotics, heat-inactivated probiotics, cell lysates, paraprobiotics, ghostbiotics, and postbiotics [1]. The International Scientific Association of Probiotics and Prebiotics (ISAPP), to standardize the definition, proposed the term postbiotic, which establishes that a postbiotic is a “preparation of inanimate microorganisms and/or their components that confer health benefits to the host” [1]. In the production of foods with added probiotics, the number of viable cells must be 109 CFU from its production through its shelf life per serving of food product [1,2]. In obtaining postbiotics, a greater number of viable cells translates into a greater number of obtained postbiotics [1]. Likewise, the processes and formulations that are used on an industrial scale must consider certain criteria such as profitability, product yield, fermentation time. and the ease of subsequent purification processes [3].
In recent decades, non-thermal tools have been used to favor the survival and increase the biomass production of probiotics. Among these tools is high intensity ultrasound (HIUS), whose purpose is to modify the biological, physical, and chemical properties of foods through the effect of acoustic cavitation [4]. The effects that ultrasound has on the substrate or on the microorganism depend on the intensity (frequency and/or power) and the sonication time [5].
HIUS has also been used to modify the permeability of the microbial membrane to accelerate their growth; the latter phenomenon is called ultrasonoporation. It has been proven that, at low levels of sonoporation, microbial growth is increased due to the improvement of the permeability of the cell membrane, resulting in an improvement in the transfer of substrate through the membrane, while at the same time, the removal of by-products of cellular metabolism is favored [6].
In general, ultrasound works in a frequency spectrum ranging from 16 kHz to 1 GHz [7]. In the food industry, the most common types of ultrasounds are high and low intensity. HIUS uses intensities greater than 3 W/cm2, and low intensity ultrasound (LIU) uses intensities below 3 W/cm2. However, they can also be classified into high and low frequency (20–100 kHz) as: medium power and medium frequency (100 kHz–1 MHz) and low power and high frequency (1–100 MHz) [8]. In addition, ultrasound can be applied directly or indirectly, although it should be considered that the direct mode is approximately 100 times more powerful than the indirect one, since the energy flows from the transducer to the sample [8]. Due to the above, it is relevant to consider the conditions in which the studies that use ultrasound are carried out.
Meanwhile, fermentations of lactic acid bacteria (LAB) are commonly done on de Man, Rogosa, and Sharpe (MRS) medium. However, MRS has limitations because it is defined as a laboratory-grade growth medium that, for industrial production of postbiotics, for example, would be prohibitively expensive as well as potentially involving unauthorized ingredients such as food additives [9]. Instead, the use of milk as a culture medium lowers the costs, would be safer for consumption, and would be suitable for the growth of probiotics and the production of postbiotics that could be employed in the formulation of functional foods. Meanwhile, even when milk is a nutritional medium for the growth of probiotics, some nutrients are present in low concentrations or in a form not immediately available for the growth of probiotics, as in the case of proteins [10]. Fortunately, HIUS can hydrolyze some of the components present in milk, such as proteins, and make them more accessible, which translates into increased cell growth and production of probiotic metabolites [11]. Due to the above, HIUS represents a promising tool to improve microbial fermentative productivity. Therefore, the objectives of the present study were to investigate the effect of culture medium, culture age, and ultrasound parameters (time, amplitude) on the kinetic growth parameters of L. acidophilus (LA-5). LA-5 shows positive effects when it is consumed as a dietary supplement or as part of fermented dairy products, like cheese, yogurt, etc. [12,13]. The bioeffects of LA-5 include intestinal microbiota regulation, anti-inflammatory and antioxidant effects on intestinal epithelial cells, positive regulation of the immune system, and anti-diabetic activity [14,15].
2. Materials and Methods
2.1. Bacterial Strain and Inoculum Preparation
A freeze-dried probiotic strain of Lactobacillus acidophilus (LA-5) was purchased from CHr. Hansen company (Hørsholm, Denmark). The strain (1% weight/volume) was inoculated in 250 mL of de Man, Rogosa, Sharpe media (MRS, Difco, Franklin Lakes, NJ, USA) and incubated at 37 °C for 24 h under microaerophilic conditions. After this, the stock culture was cooled in an ice bath and kept at 5 °C.
2.2. Enumeration of Probiotic Bacteria
To obtain the growth curve, 10 mL of the previously prepared inoculum were added to 250 mL of MRS agar and incubated at 37 °C for 24 h under microaerophilic conditions. The growth curve was constructed by measuring hourly the optical density at 600 nm of the cell culture with a spectrophotometer (UV-1800. Shimadzu, Kyoto, Japan). Then, using the McFarland nephelometer, the calibration curve was constructed for the count of LA-5 [y = (2 × 10⁹) (x), R² = 0.9964]. The count was expressed as Log10 colony forming units per milliliter (Log10 CFU/mL). Experiments were conducted in triplicate.
2.3. L. acidophilus Kinetic Growth Parameters
After L. acidophilus counts were calculated as mentioned in Section 2.2, results were analyzed with the online DMFit software (Norwich, UK), and the following parameters were obtained: rate (maximum growth potential μmax), lag (constant setting or adaptation process of the bacteria), yo (initial point of the sigmoidal curve), Tmax (end point of the sigmoidal curve), and R2 (coefficient of adjustment to the equation).
2.4. Factors Influencing the Growth of Lactobacillus acidophilus
The one-factor-at-a-time (OFAT) approach was employed to investigate the factors that influence the growth of the probiotic strain. The OFAT approach changes one factor at a time, while the other factors remain constant. The appropriate input value of each factor is determined and kept consistent in the succeeding experiment. The selection of the factors was based on previous findings that have been reported to influence L. acidophilus growth and cell viability [10,16,17].
2.5. Selection of the Culture Age
The growth curve and the kinetic parameters of two different inoculum ages, namely young culture (1 day old) and old culture (7 days old) were evaluated in triplicate. To initiate the fermentation, a 250 mL Erlenmeyer flask containing 100 mL of MRS broth was inoculated with 1% (v/v) of the corresponding inoculum (young and old culture) and incubated at 37 °C for 24 h. Optical density (600 nm) was taken in a spectrophotometer (UV-1800. Shimadzu, Japan) each hour. L. acidophilus counts were calculated as in Section 2.2, and the kinetic growth parameters as in Section 2.3.
2.6. Selection of Culture Media
Three types of culture media (MRS broth (Hi-media, Mumbai, Maharashtra, India), UHT whole milk (LALA®), and UHT skim milk (LALA®)) were tested for L. acidophilus growth. For this, 100 mL of each medium was inoculated with 1% (v/v) of the inoculum (young culture, based on the results of the previous experiments) and incubated at 37 °C for 24 h. L. acidophilus growth was quantified at the beginning and at the end of the fermentation period by the plate count methodology in MRS agar. Media were inoculated by spreading 100 μL of diluted samples onto the agar. Then, plates were incubated at 37 °C for 48 h under microaerophilic conditions. Numbers of colony-forming units (CFU) were counted on the plates, with numbers ranging between 10–200 CFU. Meanwhile, pH was measured in 20 g aliquots at the beginning and at the end of the fermentation period with a previously calibrated digital potentiometer (Orion Versa Star, Thermo Scientific, MA, USA). Experiments were conducted in triplicate as were the measurements.
2.7. Effect of Sonication Time on the Kinetic Growth Parameters of L. acidophilus
Experiments were conducted in triplicate in 500 mL Erlenmeyer flasks with a volume of 250 mL of skim milk (based on the results of the previous experiments) with 1% (v/v) of the inoculum (young culture, based on the results of the previous experiments). After adding the inoculum, HIUS was applied with a sonotrode-type ultrasonicator (Hielscher UP400St, Teltow, Germany) (Figure 1) as follows: T0 (control), no ultrasound applied; T1, 60 s; T2, 90 s. All treatments were applied at 20 kHz of frequency, 100% amplitude, and 750 watts of power. Samples were sonicated at a temperature of ~25 °C. L. acidophilus growth was quantified at the beginning and at the end of the fermentation period by the plate count methodology in MRS agar. Media were inoculated by spreading 100 μL of diluted samples onto the agar. Plates were incubated at 37 °C for 48 h under microaerophilic conditions. Numbers of CFU were counted on the plates, with numbers ranging between 10–200 CFU. Finally, L. acidophilus kinetic growth parameters were calculated as in Section 2.3.
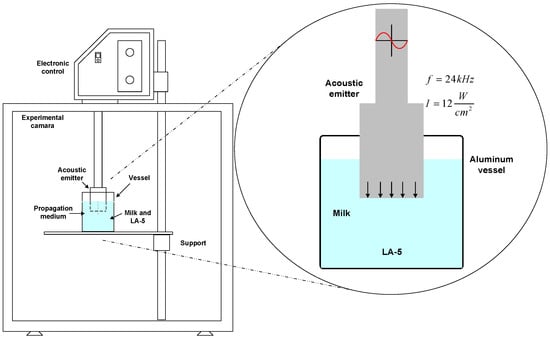
Figure 1.
Configuration of the ultrasound application.
2.8. Effect of Ultrasound Amplitude on the Kinetic Growth Parameters of Lactobacillus acidophilus
Experiments were carried out in triplicate as in Section 2.7. Ultrasound treatments were as follows: T0 (control), no ultrasound applied; T1, 20% amplitude; T2, 30% amplitude; and T3, 40% amplitude. All ultrasound treatments were applied for 3 min at 20 kHz and 750 watts.
2.9. Statistical Analysis
The data were analyzed using the GLM procedures with an ANOVA and LSMEANS, comparing means by TUKEY. The treatments and the three repetitions were used as classificatory variables, and the kinetic parameters (Rate (μmax), Lag, yo, Tmax) were used as response variables. The significance level used for all statistical analyses was 5%. The analyzes were performed using the statistical package SAS version 9.1.3.
3. Results and Discussion
3.1. Selection of the Culture Age
The effect of age on the kinetic parameters of L. acidophilus is shown in Table 1 and in the growth curve in Figure 2. All kinetic parameters were different among the two cultures (p < 0.05). The initial point of the sigmoidal curve (yo) was greater (p < 0.05) for the old culture, 8.95 ± 0.005, compared to 8.71 ± 0.044 of the young culture. The lag phase was seven times greater (p < 0.05) in the old culture than in the young one, 7.198 ± 0.355 vs. 1.001 ± 0.091, respectively. The rate (µmax) was more than twice as small (p < 0.05) for the old culture, 0.047 ± 0.001, vs. 0.108 ± 0.006, respectively. The time to reach the end of the sigmoidal curve (Tmax) was greater (p < 0.05) for the old culture (16.87 ± 0.120) compared to the young one (9.42 ± 0.042). Finally, regarding the regression adjustment coefficient (R2), the trilinear model adjusted well since the regression coefficients were greater than 0.95.

Table 1.
Effect of inoculum age on the kinetic parameters of Lactobacillus acidophilus (media ± standard deviation).
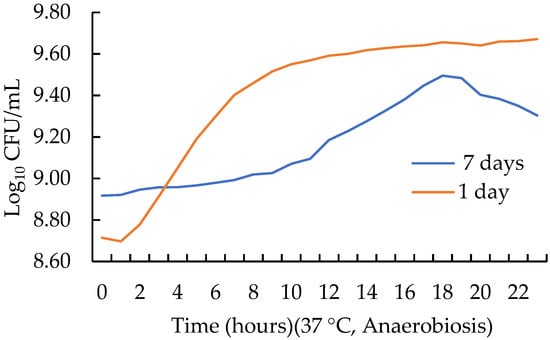
Figure 2.
Effect of inoculum age on the growth curve of Lactobacillus acidophilus.
The old culture (7 days) had a higher probiotic count (yo) but a larger lag phase and rate compared to the young culture (1 day); it also showed a larger Tmax. The growth curve for L. paracasei showed similar values for yo and the lag phase [10]. Although pH determination was not performed, it is known that cultures with a higher lag phase require longer fermentation times to reach the required pH; this means more processing costs, since fermentation is the most time- and resource-consuming stage during the manufacture of many fermented and probiotic added foods [18]. Because of this, it is advised to use a young or fresh inoculum instead that one that is several days old.
3.2. Selection of Culture Media
At the beginning of fermentation, the MRS medium had the greatest pH of 6.70 ± 0.0 (p < 0.05) compared to 6.30 ± 0.0 for whole milk and to 6.26 ± 0.0 for skim milk. At the end, MRS had the lowest pH of 4.12 ± 0.07 (p < 0.05) compared to 3.93 ± 0.05 of whole milk and 3.91 ± 0.01 of skim milk. Regarding microbial counts, at the end of fermentation, MRS and whole milk were not different in the final viability of L. acidophilus (p > 0.05), 7.30 ± 0.04 and 7.30 ± 0.02 Log10 CFU/mL, respectively. Skim milk presented the greatest (p < 0.05) L. acidophilus counts (8.31 ± 0.02 Log10 CFU/mL) (Table 2).

Table 2.
Cell viability of Lactobacillus acidophilus in different culture media (media ± standard deviation).
The formulation of the growth medium is an important factor that should be considered in every fermentation process to produce microbiological products, as in the case of industrial scale applications. In this sense, industrial scale application must fulfil different criteria, such as cost-effectiveness, metabolite yield, and fermentation time [19]. Usually, MRS medium is the selected growth medium for LAB [9], and it may be suitable for laboratory growth of these microorganisms. However, at industrial scale, this may be prohibitively expensive, so an alternative cost-effective growth medium is necessary. In addition, MRS may contain unauthorized ingredients for fermented foods [9] or generate off flavors during fermentation [20]. In this study, skim milk had higher counts (p < 0.05) of L. acidophilus compared to MRS and whole milk. L. acidophilus possesses complex nutritional requirements, such as amino acids, vitamins, metal ions, and other compounds found in milk [21]. Meanwhile, L. acidophilus shows a proteolytic activity due to the proteases and peptidases attached to the cell wall or released by them, as well as a weak lipolytic activity due to the lack of intracellular lipases [22]. Tavakoli et al. [23] studied the effect of fat content on the survival of L. acidophilus, finding that there was no impact of different levels of fat on the growth of the probiotic microorganism. Therefore, the survival of the probiotic organisms might depend more on their ability to hydrolyze proteins. Consequently, the greater growth of L. acidophilus that was observed in skim milk could be since there is a greater proportion of proteins that are not bound to the fat globule membrane, mainly serum proteins, and these are more available as a substrate, thereby favoring the growth of the probiotic.
3.3. Effect of Sonication Time on the Kinetic Growth Parameters of L. acidophilus
The growth parameters of this phase are shown in Table 3 and the growth curve in Figure 3. In rate (µmax), variations were found between treatments (p < 0.05), with a smaller value (p < 0.05) for 60 s (0.093 ± 0.013) and 90 s (0.083 ± 0.003) of sonication compared to the control (no sonication applied) (0.108 ± 0.006). Regarding yo, which corresponds to the initial point of the sigmoidal curve, no significant differences were observed among treatments (p > 0.05). Meanwhile, at the end of the sigmoidal curve, variations were found among all treatments (p < 0.05), being smaller (p < 0.05) for the control (no sonication applied) (9.420 ± 0.042) compared to 60 s (10.169 ± 0.163) and 90 s (10.449 ± 0.067). The lag phase is the setting constant or adaptation process of microorganisms and is determined by the concentration of the inoculum and the incubation conditions during kinetics [24]. For this parameter, there were no significant differences between treatments (p > 0.05). Finally, the regression adjustment coefficient (R2) adjusted very well, with values greater than 0.98.

Table 3.
Effect of sonication time on the kinetic growth parameters of Lactobacillus acidophilus (media ± standard deviation).
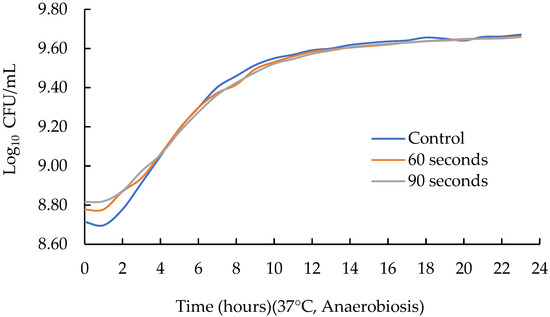
Figure 3.
Effect of sonication time on the growth curve of Lactobacillus acidophilus.
In summary, changes in the maximum growth potential (µmax) and time of the end of the sigmoidal curve (Tmax) were observed when ultrasound was applied (20 kHz of frequency, 100% amplitude and 750 watts of power) for 60 and 90 s. When no ultrasound was applied (control), a greater µmax and a lower Tmax were observed; that is, the application of HIUS for 60 and 90 s did not favor the growth parameters of L. acidophilus.
The fermentation time when producing yogurt from milk of Holstein and Jersey cows was reduced to 30 min in the presence of L. delbrueckii by employing ultrasound at 20 kHz for 8 min post inoculation [18]. Huang et al. (2019) investigated the effect of ultrasound at 28 kHz on the growth of L. paracasei in skim milk in different phases of fermentation. They found that the biomass of the early logarithmic phase with ultrasonication for 1 h increased with respect to the control. Then, at the fifth hour of inoculation, the biomass decreased; meanwhile, in the lag phase, the effects of ultrasound on the proliferation of this strain were observed [10]. When ultrasound was applied in the stationary phase, approximately 9 h after inoculation, no difference was observed with respect to the control. If ultrasound is applied with frequencies between 20–50 kHz, it favors the availability of nutrients in the fermentation process; however, depending on the time at which ultrasound is applied, certain effects are presented. If the application is carried out in milk before inoculation, water retention and viscosity increase, while the application of ultrasound after inoculation reduced the fermentation time to 30 min [6]. Potoroko et al. (2018) reconstituted skim milk powder and subsequently inoculated it with 3% freeze-dried kefir and applied ultrasound (22 kHz) before the start of fermentation to generate ideal conditions for the growth of the microorganisms; these results showed that reconstitution of milk powder, using ultrasound, favored the production of bioactive compounds [17].
Tabatabaie and Mortazavi (2008) [25] studied the effect of time (5, 10, 15, 20, 25, and 30 min) of ultrasonic treatments (20 kHz, 80% amplitude) on Lactobacillus spp., finding that the application of ultrasound at any time decreased the viability of Lactobacillus spp. In this study, lower biomass production was found when ultrasound was applied for 60 and 90 s (Figure 4). Likewise, Wang and Sakakibara (1997) [26] studied the application of ultrasound (200 kHz) in four strains of Lactobacillus, reporting a decrease or maintenance in the viability of the strains. Therefore, the application of ultrasound for longer times results in decreased cell viability [27,28].
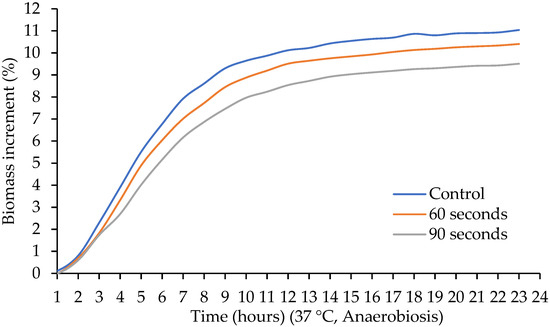
Figure 4.
Effect of sonication time on the biomass increment of Lactobacillus acidophilus.
Apparently, the effect of ultrasound on the growth of microorganisms depends on processing parameters such as acoustic intensity, frequency, application time, the point of application (before or after inoculation), and the composition of the medium [18]. Additionally, the effect is associated with the biological characteristics of the microorganism such as its growth phase and the size and characteristics of its membrane [29]. To date, the influence of factors such as milk composition, culture age, and process parameters on the viability of the probiotic LA-5 had not been reported.
3.4. Effect of Amplitude Variation on the Kinetic Growth Parameters of L. acidophilus
Since there were no differences in the lag values when ultrasound was applied for 60 and 90 s, a previous experiment was conducted increasing time to 3 min and 5 min at an amplitude of 30 and 60%, based on what was reported in other studies [16,30]. The use of 3 min and 30% of amplitude presented the largest counts of LA-5. In this part of the experiment, ultrasound was applied for 3 min, varying the amplitude to 20, 30, and 40%. Kinetic growth parameters are shown in Table 4 and in the growth curve in Figure 5. Regarding the parameter yo, which corresponds to the initial point of the sigmoidal curve, no significant differences were observed among treatments (p > 0.05); this was expected, since the same inoculum was used for all treatments. For Tmax, variations were found among treatments (p < 0.05), being greater for 40% amplitude for 3 min of ultrasound application (2.985 ± 0.031) and smaller for 30% amplitude for 3 min of ultrasound application (1.998 ± 0.000). For the lag phase, significant differences were also observed between treatments (p < 0.05), being greater at 30% amplitude for 3 min of ultrasound application (0.923 ± 0.000) and smaller at 40% amplitude for 3 min of ultrasound application (0.748 ± 0.000). In rate (µmax), variations were found between treatments (p < 0.05), being smaller at 40% amplitude for 3 min of ultrasound application (0.475 ± 0.007) and greater at 30% amplitude for 3 min of ultrasound application (1.065 ± 0.000). Finally, the regression adjustment coefficient (R2) presented values between 0.91 and 0.96. No differences were found in pH at the beginning and at the end of fermentation (p > 0.05) (Figure 6). Likewise, and in accordance with the kinetic parameters, the highest biomass production was observed when ultrasound was applied at 30% amplitude for 3 min (Figure 7).

Table 4.
Effect of ultrasound amplitude on the kinetic growth parameters of Lactobacillus acidophilus (media ± standard deviation).
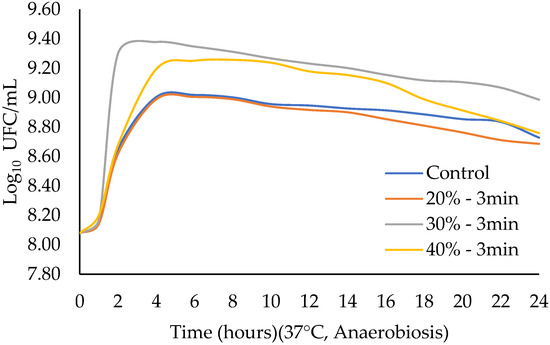
Figure 5.
Effect of ultrasound amplitude on the growth curve of Lactobacillus acidophilus.
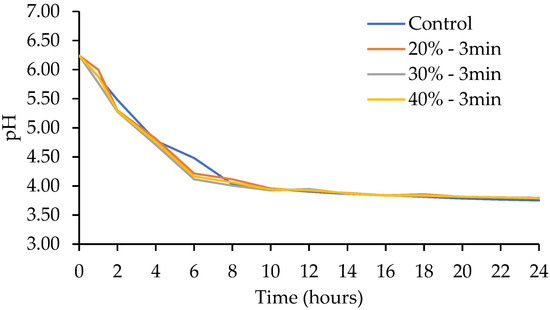
Figure 6.
Effect of ultrasound amplitude on the pH kinetic of Lactobacillus acidophilus.
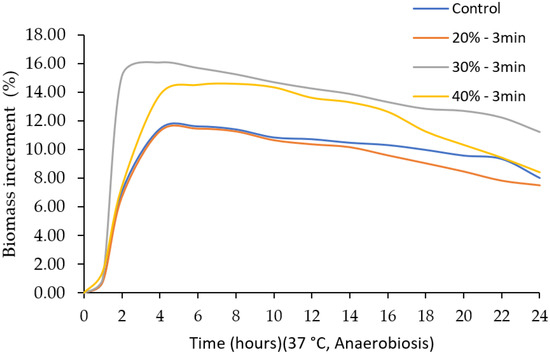
Figure 7.
Effect of ultrasound amplitude on the biomass increment of Lactobacillus acidophilus.
Similar results were found by Dahroud et al. (2016), who studied the effect of time (15, 30, and 45 sec) and amplitude (20, 40, and 60%) during the fermentation process of Lactobacillus casei subsp. casei, reporting that the highest biomass production occurred when using 60% amplitude for 15 s of ultrasonic treatment and that the duration of the logarithmic phase and the growth rate were increased by applying ultrasound [16]. Likewise, other authors have reported the reduction or elimination of the lag phase of the growth curve of LAB in milk without changing or influencing the total fermentation time [31,32].
Ewe et al. (2012) observed that changes associated with the cell membrane were more prominent when the amplitude and application time of the ultrasonic treatment increased [33]. Likewise, the results observed may be due to low levels of sonoporation, which improve the permeability of the cell membrane, resulting in an improvement in the transfer of substrates through the membrane and making the removal of byproducts of cell metabolism more efficient, which eventually favors microbial growth [6].
4. Conclusions
The optimal application conditions for ultrasonic treatments as well as the parameters must be carefully determined before applying sonication in the fermentation processes of dairy products. It can be concluded that the growth medium, culture age, and ultrasound parameters (time and amplitude) influence the kinetic parameters of L. acidophilus. Hence, during the growth of this probiotic, it is recommended to use a young culture (1 day old). Additionally, to improve the biomass, high intensity ultrasound (sonotrode-type) can be applied for 3 min at 30% amplitude and 750 watts. To reduce medium growth cost, skim milk can be used. In the dairy industry, as in many others, economic aspects as well as process optimization are constantly considered to improve their performance. Due to the above, the results of this study could be considered to improve the design processes that produce dairy foods with added L. acidophilus.
Author Contributions
Conceptualization, A.C.-M. and R.A.R.-V.; data curation, E.S.-E.; formal analysis, N.A.B.-J. and E.S.-E.; funding acquisition, A.C.-M.; investigation, N.A.B.-J.; methodology, A.C.-M. and R.A.R.-V.; project administration, A.C.-M.; supervision, A.C.-M. and R.A.R.-V., R.S.-V. and A.L.R.-M.; writing—original draft, N.A.B.-J.; writing—review and editing, A.C.-M., A.L.R.-M., J.M.T.-G., E.S.-E. and R.A.R.-V. All authors have read and agreed to the published version of the manuscript.
Funding
This research received no external funding.
Data Availability Statement
The data presented in this study are available on request from the corresponding author.
Acknowledgments
The authors acknowledge that the Universidad Autónoma de Chihuahua supported this investigation. The Science and Technology National Council of Mexico (CONACYT) provided a graduate study scholarship for Norma Angélica Bolivar-Jacobo.
Conflicts of Interest
The authors declare no conflict of interest.
References
- Salminen, S.; Collado, M.C.; Endo, A.; Hill, C.; Lebeer, S.; Quigley, E.M.M.; Sanders, M.E.; Shamir, R.; Swann, J.R.; Szajewska, H.; et al. The International Scientific Association of Probiotics and Prebiotics (ISAPP) Consensus Statement on the Definition and Scope of Postbiotics. Nat. Rev. Gastroenterol. Hepatol. 2021, 18, 649–667. [Google Scholar] [CrossRef] [PubMed]
- Settanni, L.; Moschetti, G. Non-Starter Lactic Acid Bacteria Used to Improve Cheese Quality and Provide Health Benefits. Food Microbiol. 2010, 27, 691–697. [Google Scholar] [CrossRef] [PubMed]
- Jawan, R.; Abbasiliasi, S.; Tan, J.S.; Mustafa, S.; Halim, M.; Ariff, A.B. Influence of Culture Conditions and Medium Compositions on the Production of Bacteriocin-like Inhibitory Substances by Lactococcus Lactis GH1. Microorganisms 2020, 8, 1454. [Google Scholar] [CrossRef] [PubMed]
- Humphrey, V.F. Ultrasound and Matter—Physical Interactions. Prog. Biophys. Mol. Biol. 2007, 93, 195–211. [Google Scholar] [CrossRef]
- Guimarães, J.T.; Balthazar, C.F.; Scudino, H.; Pimentel, T.C.; Esmerino, E.A.; Ashokkumar, M.; Freitas, M.Q.; Cruz, A.G. High-Intensity Ultrasound: A Novel Technology for the Development of Probiotic and Prebiotic Dairy Products. Ultrason. Sonochem. 2019, 57, 12–21. [Google Scholar] [CrossRef] [PubMed]
- Ojha, K.S.; Kerry, J.P.; Alvarez, C.; Walsh, D.; Tiwari, B.K. Effect of High Intensity Ultrasound on the Fermentation Profile of Lactobacillus Sakei in a Meat Model System. Ultrason. Sonochem. 2016, 31, 539–545. [Google Scholar] [CrossRef]
- Duck, F.; Leighton, T. Frequency Bands for Ultrasound, Suitable for the Consideration of Its Health Effects. J. Acoust. Soc. Am. 2018, 144, 2490–2500. [Google Scholar] [CrossRef]
- Chávez-Martínez, A.; Reyes-Villagrana, R.A.; Rentería-Monterrubio, A.L.; Sánchez-Vega, R.; Tirado-Gallegos, J.M.; Bolivar-Jacobo, N.A. Low and High-Intensity Ultrasound in Dairy Products: Applications and Effects on Physicochemical and Microbiological Quality. Foods 2020, 9, 1688. [Google Scholar] [CrossRef]
- Arakawa, K.; Kawai, Y.; Fujitani, K.; Nishimura, J.; Kitazawa, H.; Komine, K.I.; Kai, K.; Saito, T. Bacteriocin Production of Probiotic Lactobacillus Gasseri LA39 Isolated from Human Feces in Milk-Based Media. Anim. Sci. J. 2008, 79, 634–640. [Google Scholar] [CrossRef]
- Huang, G.; Chen, S.; Tang, Y.; Dai, C.; Sun, L.; Ma, H.; He, R. Stimulation of Low Intensity Ultrasound on Fermentation of Skim Milk Medium for Yield of Yoghurt Peptides by Lactobacillus Paracasei. Ultrason. Sonochem. 2019, 51, 315–324. [Google Scholar] [CrossRef]
- Abadía-García, L.; Castaño-Tostado, E.; Cardador-Martínez, A.; Martín-Del-campo, S.T.; Amaya-Llano, S.L. Production of ACE Inhibitory Peptides from Whey Proteins Modified by High Intensity Ultrasound Using Bromelain. Foods 2021, 10, 2099. [Google Scholar] [CrossRef] [PubMed]
- Ojha, K.S.; Mason, T.J.; O’Donnell, C.P.; Kerry, J.P.; Tiwari, B.K. Ultrasound Technology for Food Fermentation Applications. Ultrason. Sonochem. 2017, 34, 410–417. [Google Scholar] [CrossRef] [PubMed]
- de Almada, C.N.; Almada, C.N.; Martinez, R.C.R.; Sant’Ana, A.S. Paraprobiotics: Evidences on Their Ability to Modify Biological Responses, Inactivation Methods and Perspectives on Their Application in Foods. Trends Food Sci. Technol. 2016, 58, 96–114. [Google Scholar] [CrossRef]
- Żółkiewicz, J.; Marzec, A.; Ruszczyński, M.; Feleszko, W. Postbiotics—A Step beyond Pre-and Probiotics. Nutrients 2020, 12, 2189. [Google Scholar] [CrossRef] [PubMed]
- Rad, A.H.; Maleki, L.A.; Kafil, H.S.; Zavoshti, H.F.; Abbasi, A. Postbiotics as Promising Tools for Cancer Adjuvant Therapy. Adv. Pharm. Bull. 2021, 11, 1–5. [Google Scholar] [CrossRef]
- Dahroud, B.D.; Mokarram, R.R.; Khiabani, M.S.; Hamishehkar, H.; Bialvaei, A.Z.; Yousefi, M.; Kafil, H.S. Low Intensity Ultrasound Increases the Fermentation Efficiency of Lactobacillus Casei Subsp.Casei ATTC 39392. Int. J. Biol. Macromol. 2016, 86, 462–467. [Google Scholar] [CrossRef] [PubMed]
- Potoroko, I.; Kalinina, I.; Botvinnikova, V.; Krasulya, O.; Fatkullin, R.; Bagale, U.; Sonawane, S.H. Ultrasound Effects Based on Simulation of Milk Processing Properties. Ultrason. Sonochem. 2018, 48, 463–472. [Google Scholar] [CrossRef]
- Abesinghe, A.M.N.L.; Islam, N.; Vidanarachchi, J.K.; Prakash, S.; Silva, K.F.S.T.; Karim, M.A. Effects of Ultrasound on the Fermentation Profile of Fermented Milk Products Incorporated with Lactic Acid Bacteria. Int. Dairy J. 2019, 90, 1–14. [Google Scholar] [CrossRef]
- Abbasiliasi, S.; Tan, J.S.; Ibrahim, T.A.T.; Bashokouh, F.; Ramakrishnan, N.R.; Mustafa, S.; Ariff, A.B. Fermentation Factors Influencing the Production of Bacteriocins by Lactic Acid Bacteria: A Review. RSC Adv. 2017, 7, 29395–29420. [Google Scholar] [CrossRef]
- Shortt, C.; O’Brien, J. Handbook of Functional Dairy Products, 1st ed.; CRC Press: Boca Raton, FL, USA, 2003. [Google Scholar]
- Meng, L.; Li, S.; Liu, G.; Fan, X.; Qiao, Y.; Zhang, A.; Lin, Y.; Zhao, X.; Huang, K.; Feng, Z. The Nutrient Requirements of Lactobacillus Acidophilus LA-5 and Their Application to Fermented Milk. J. Dairy Sci. 2021, 104, 138–150. [Google Scholar] [CrossRef]
- Sánchez, Ó.J.; Barragán, P.J.; Serna, L. Review of Lactobacillus in the Food Industry and Their Culture Media. Rev. Colomb. Biotecnol. 2019, 21, 63–76. [Google Scholar] [CrossRef]
- Tavakoli, M.; Najafi, M.B.H.; Mohebbi, M. Effect of the Milk Fat Content and Starter Culture Selection on Proteolysis and Antioxidant Activity of Probiotic Yogurt. Heliyon 2019, 5, 1204. [Google Scholar] [CrossRef] [PubMed]
- Baranyi, J.; Roberts, T.A. Review Paper A Dynamic Approach to Predicting Bacterial Growth in Food. Int. J. Food Microbiol. 1994, 23, 277–294. [Google Scholar] [CrossRef] [PubMed]
- Tabatabaie, F.; Mortazavi, A. Studying the Effects of Ultrasound Shock on Cell Wall Permeability and Survival of Some LAB in Milk. World Appl. Sci. J. 2008, 3, 119–121. [Google Scholar]
- Wang, D.; Sakakibara, M. Lactose Hydrolysis and β-Galactosidase Activity in Sonicated Fermentation with Lactobacillus Strains. Ultrason. Sonochem. 1997, 4, 255–261. [Google Scholar] [CrossRef]
- Racioppo, A.; Corbo, M.R.; Piccoli, C.; Sinigaglia, M.; Speranza, B.; Bevilacqua, A. Ultrasound Attenuation of Lactobacilli and Bifidobacteria: Effect on Some Technological and Probiotic Properties. Int. J. Food Microbiol. 2017, 243, 78–83. [Google Scholar] [CrossRef]
- Kassem, A.; Meade, J.; McGill, K.; Walsh, C.; Gibbons, J.; Lyng, J.; Whyte, P. An Investigation of High Intensity Ultrasonication and Chemical Immersion Treatments on Campylobacter Jejuni and Spoilage Bacteria in Chicken. Innov. Food Sci. Emerg. Technol. 2018, 45, 298–305. [Google Scholar] [CrossRef]
- Gao, S.; Hemar, Y.; Lewis, G.D.; Ashokkumar, M. Inactivation of Enterobacter Aerogenes in Reconstituted Skim Milk by High- and Low-Frequency Ultrasound. Ultrason. Sonochem. 2014, 21, 2099–2106. [Google Scholar] [CrossRef]
- Shokri, S.; Shekarforoush, S.S.; Hosseinzadeh, S. Efficacy of Low Intensity Ultrasound on Fermentative Activity Intensification and Growth Kinetic of Leuconostoc Mesenteroides. Chem. Eng. Process.-Process. Intensif. 2020, 153, 107955. [Google Scholar] [CrossRef]
- Sfakianakis, P.; Topakas, E.; Tzia, C. Comparative Study on High-Intensity Ultrasound and Pressure Milk Homogenization: Effect on the Kinetics of Yogurt Fermentation Process. Food Bioproc. Technol. 2014, 8, 548–557. [Google Scholar] [CrossRef]
- Nöbel, S.; Ross, N.L.; Protte, K.; Körzendörfer, A.; Hitzmann, B.; Hinrichs, J. Microgel Particle Formation in Yogurt as Influenced by Sonication during Fermentation. J Food Eng. 2016, 180, 29–38. [Google Scholar] [CrossRef]
- Ewe, J.A.; Abdullah, W.N.W.; Bhat, R.; Karim, A.A.; Liong, M.T. Enhanced Growth of Lactobacilli and Bioconversion of Isoflavones in Biotin-Supplemented Soymilk upon Ultrasound-Treatment. Ultrason. Sonochem. 2012, 19, 160–173. [Google Scholar] [CrossRef] [PubMed]
Disclaimer/Publisher’s Note: The statements, opinions and data contained in all publications are solely those of the individual author(s) and contributor(s) and not of MDPI and/or the editor(s). MDPI and/or the editor(s) disclaim responsibility for any injury to people or property resulting from any ideas, methods, instructions or products referred to in the content. |
© 2023 by the authors. Licensee MDPI, Basel, Switzerland. This article is an open access article distributed under the terms and conditions of the Creative Commons Attribution (CC BY) license (https://creativecommons.org/licenses/by/4.0/).