Abstract
One of the methods of municipal waste disposal and energy production is anaerobic digestion. This study investigates the effect of thermal and chemical pretreatment on the anaerobic digester’s biomethane production. The optimal condition was evaluated using RSM in two modes: maximum and minimum use of H2O2. The optimal state was obtained in the first case under 110.8 °C, 4.63% NaOH, 8% H2O2, and 111.9 °C, 4.47% NaOH, 2% H2O2 in the second case. Experimental results obtained 77%, 76.6% VS (volatile solid) reduction, and 89.1%, 88.7% SCOD (soluble chemical oxygen demand) reduction in the two optimum conditions, respectively. Experiment results were extrapolated to dry industrial digesters using a factor of 0.89% and durations including 30 days and 25 days. Then, the processes of biogas improvement were simulated. After biogas improvement, the economic analysis of the process was conducted with the definition of various scenarios. It was determined that, at current prices, pretreatment is not economically viable and that, with an increase in electricity prices to 0.09 $/kWh and 0.145 $/kWh, the digestion process with a NaOH 4.47% 112 °C pretreatment, chemical scrubbing, and digestion with NaOH 4.47% 112 °C, 2% H2O2 are sequentially economically viable.
1. Introduction
Crude oil is the most common source of energy supply worldwide. Coal and natural gas are other significant energy supply resources [1]. However, resources of oil, gas, and coal are limited and have detrimental environmental effects. Consequently, it is necessary to utilize sustainable, renewable energy sources based on factors, such as economic and climatic conditions. In addition, there is a growing global trend to expand the exploitation of such energy resources.
Increasing consumption of fossil energy results in an increase in CO2 emissions. CO2 is a greenhouse gas (GHG) whose concentration is expected to double within the next five decades [2].
Biomass is an important and promising renewable energy source. It includes forests, agricultural waste, and biodegradable materials. Almost everywhere in the world, the decomposable municipal and industrial waste remains a crucial urban management challenge. Experts have proposed the reducing-reusing-recycling (3R) principle as a promising waste management strategy [3]. However, some waste types cannot be recycled, necessitating alternative waste management and disposal methods.
Anaerobic digestion is an important method for recovering wet waste energy (e.g., leftover food) [4] and has the potential to meet a portion of human energy needs. Siddiki et al. [5] determined that generating 50 TW power and 512 PJ of heat from livestock, poultry, and slaughterhouse waste in Bangladesh was possible.
The efficiency of anaerobic digesters can be improved by applying pretreatment to increase biogas production and organic matter hydrolysis. Therefore, researchers have proposed various pretreatment techniques, including thermal, mechanical, biological, chemical, and combined methods [6,7]. The pretreatment process degrade lignin and makes carbohydrates accessible to enzymes [8]. Research has shown that thermal pretreatment can increase biogas production from OFMSW (organic fraction of municipal solid waste) and fermentable sugars [9,10,11,12,13,14,15,16]. In this research, the direct effect of temperature increase on biogas yield was observed. Nevertheless, an excessively high temperature during thermal pretreatment would negatively affect this [15,17]. Shahriari et al. [10] measured the effects of microwave-based thermal pretreatment on the production efficiency of biogas from municipal waste with and without H2O2. and showed that the effect of H2O2 on the biogas yield from waste is low and at most 4%.
Bala et al. [18] investigated the effects of NaOH concentration on OFMSW anaerobic digestion to determine the optimal caustic concentration. They showed that high concentrations of NaOH decrease the biogas yield from waste, and they obtained the optimal NaOH concentration of 0.46 N. Dasgupta et al. [19] analyzed the effects of NaOH-based caustic pretreatment at different pH values. In addition, they compared the concentrations of caustic pretreatment in biogas production from an economic standpoint to show that OFMSW pretreated with NaOH at pH 10 had maximum biogas yield of 407.1 mL/gVS with 68.9% methane content, which means 35% more yield and 37% more methane content compared to without OFMSW pretreatment.
Ariunbaatar et al. [6] investigated waste pre-treatment for biogas production at temperatures below 110 degrees and above 110 degrees and concluded that thermal pre-treatment at temperatures below 110 degrees (and around it) showed higher efficiency.
Biogas upgrading can produce biomethane, a renewable form of natural gas [20]. There are a number of biogas upgrading processes that generate energy in a generator. Conventional techniques for upgrading include amine scrubbing, water scrubbing, pressure swing absorption (PSA), membrane separation, cryogenic separation, and other adsorption and solvent scrubbing [21,22,23,24,25,26,27,28]. Biomethane can be used directly as a power source or as a clean energy source by producing hydrogen during the reforming process [29].
A further examination of previous works revealed that cryogenic separation has a higher level of technical sophistication than other commercial biogas upgrading methods. However, chemical scrubbing is a common, moderately priced method. Cryogenic separation’s operational and maintenance costs are higher than those of other techniques [21,22,30,31,32]. Rafiee et al. examined the costs of various biogas upgrading methods. Therefore, anaerobic digestion can be compared economically with refrigeration separation and chemical scrubbing, and its results can be used as a valid method for the economic analysis of the entire process in the study of conventional and costly processes [33].
NaOH pretreatment reduces lignin, cellulose, and hemicellulose removal of crosslinks. NaOH pretreatment leads to an increase of porosity and internal surface area, structural swelling, a decrease in the degree of polymerization and crystallinity, disruption of lignin structure, and a breakdown of links between lignin and other polymers. In H2O2 pretreatment, the reactions include oxidative cleavage of aromatic nuclei, electrophilic substitutions, displacement of side chains, and cleavage of alkyl aryl ether linkages [34]. All three main reactions occur in lignocellulosic materials. Hemicelluloses are broken into monomeric sugars and degraded into organic acid, cellulose is partly degraded, and lignin undergoes both cleavage and oxidation [35].
This study investigated the effect of thermal, alkaline, and H2O2 pretreatment for the first time. After investigating the impact of the mentioned parameters on increasing biomethane production from OFMSW digestion, these variables were optimized. To determine the economic viability of the process, simulations of the optimal condition, the state without pretreatment, and the state without a generator were conducted on an industrial scale to determine the effect of these methods on the cost of increasing biomethane production.
2. Materials and Methods
This study analyzed optimal conditions in previous research and experimental limitations, selecting the temperature range of 80–180 °C for thermal pretreatment (The optimal temperature in previous researches ranged from 110 °C to 170 °C, and the temperature range of 80 to 180 °C was defined accordingly), the caustic concentration range of 2–8% (w/w), and the H2O2 concentration range of 2–10% (w/w) for chemical pretreatment. The retention time for thermal and chemical pretreatment is 1 h.
2.1. Experimental Design
After determining the pretreatment temperature and concentration ranges, the experiments were designed and optimized in Design Expert (v. 12) as per previous research.
The model was fitted with the least squares method by employing the response surface method (RSM) via a Box–Behnken design (BBD).
As previously stated, the present study utilized temperatures between 80 and 180 °C, caustic pretreatment concentrations of 2–8%, and H2O2 concentrations of 2–10%. BBD was selected because it is more efficient and effective than the alternatives.
Comparing BBD to other RSM designs (such as the three-level full factorial design and the central composite) reveals that BBB is more effective than the other RSM designs. Additionally, BBD is devoid of points where all factors are simultaneously maximized or minimized. Consequently, these designs aid in avoiding extreme experiment conditions and unsatisfactory results [36,37].
A BBD is a three-level incomplete factorial-based second-order design that is rotatable (or approximately rotatable). A total of experiments should be conducted to develop a BBD, where C0 is the central points count and k is the number of factors (three in the present experiment) [38,39]. Responses are the interactive effects of temperature, NaOH, and H2O2 concentration on the production of CH4.
2.2. Experimental Digester
This study utilized Hansen’s method to determine the biogas yield [40]. Additionally, dark glass bottles were used as batch reactors. Before tightening the aluminum bottle cap and plastic lid, various combinations of water (5 mg), microbes, and untreated and treated substrates (based on the dry test material) were added. The microbial mixture and substrate were adjusted to have the same VS. Each bottle underwent 2 min of anaerobic digestion by gaseous N injection. The specimens were examined and subjected to three rounds of microbial fermentation to evaluate biomethane production. In addition, the control sample was utilized under identical conditions for each experiment series. The bottles were kept in an incubator at 37 °C for 30 days, and GC syringe samples were taken every five days to measure biogas production.
After injecting 250 μL of gas from each bottle into a GC device to evaluate CH4 production, each bottle’s gas was analyzed. The bottles were brought to atmospheric pressure via a syringe by injecting 250 μL of gas and recording the area under the observed peak of two successive injections. The quantity of gas produced is proportional to the difference between the areas under the two peaks. The standard curve must be utilized to determine the amount of CH4 in the bottle based on the area under the peak. Consequently, certain amounts of CO2 were injected into the GC apparatus.
2.3. Sampling
The present work gathered 200 kg of waste from a waste depot in Amol, Iran. By hand, the waste components were separated. From the total waste collected, 95 kg was wet. Fruit and vegetable waste, food leftovers, and wet paper comprised the wet waste. Wet waste was crushed three times by a shaft-style shredder. The remaining plastic and nylon components were separated by hand-mixing the remaining crushed waste. The authors subjected 50 kg of the waste to an oven at 70 °C for a minimum of 24 h. Once the difference between the weights of two successive sampling rounds fell below 1%, dry waste would be generated. A total of 14.8 kg of dried waste was collected. The waste was then crushed in a mill to produce semi-powder waste. The waste was homogenized with a mixer before being placed in a vacuum-sealed container inside a refrigerator.
2.4. Analytical Methods
The standard laboratory analysis procedure (LAP) was used to determine the samples’ total solids (TS), VS, and moisture content. A Costech CHNSO analyzer was used to measure the concentrations of C, H, N, S, O, and Cl. COD was calculated using the 5220D method from the standard water and wastewater measurement methods manual [41]. This parameter is used to estimate the amount of oxygen required by oxidizers to oxidize OFMSW (e.g., K2Cr2O7 and KMnO4).
2.5. Pretreatment of the Substrate
As mentioned, three substrate pretreatments were conducted in the present study. For thermal pretreatment, the specimen was encased in nylon and autoclaved for 0.5 h in a Khazar Electric autoclave. A temperature rise rate of 10 °C/min and a temperature decline rate of 15 °C/min were applied. The specimen was poured into a container at a certain w/w%, and 10 g of the crushed specimen was added for the NaOH pretreatment. The resultant solution was subjected to a 10-min water bath at 35 °C and underweight continuous agitation. The specimen was then neutralized with water. In H2O2 pretreatment, a 30 w/w% H2O2 solution was added to the specimen at a specific weight ratio. Finally, the specimens were rinsed with distilled water before being dried.
2.6. Economic Analysis of the Process
The potential for producing biogas and biomethane is evaluated based on the results of experiments. Furthermore, biogas purification and process improvement must be simulated while estimating the costs to recover a portion of the power station’s operating costs.
The cryogenic separation of biogas constituents is based on differences in their respective boiling points. This method cools and compresses biogas. As the predominant biogas component, CH4 has a boiling point of −161.6 °C at 1 atm, while CO2 has a boiling point of −78.46 °C [42,43]. In some instances, biogas contains significant amounts of H2S (up to 2% v/v). In the process, it is also possible to separate H2S, which has a boiling point of −60 °C at 1 atm. CH4 can be separated from the other compounds due to its lower boiling point.
It was assumed that the gas consisted of CO2 and CH4 to simplify the calculations, while the other compounds were disregarded. This is an effective assumption for biogas upgrading. Earlier works have performed calculations based on the same premise [44]. Multiple parameters, including the internal range rate, 10-year NPV return, and return on investment, are compared in the economic pretreatment analysis, considering the average inflation rate over the past 15 years and a bank interest rate of 15%.
2.7. Biogas Upgrading Simulation
The present study utilized an experimental technique for producing biogas and CH4 purification, simulating steady-state biogas upgrading and energy production, to estimate the plan’s earnings. CH4 and CO2 were contained in the feed stream (nonpolar compounds). The gas is at a low temperature and high pressure in a stage. Thus, it is impossible to apply the equation of an ideal gas. As organic compounds were present, the Peng–Robinson equation of state was employed [45,46]. The process equipment is simulated statically using mass and energy balance.
The chemical scrubber relies on the dissolution of CO2. The procedure involves two columns known as the absorption column and the disposal column. In the adsorption column, solvent enters from above and biogas enters from below. During the chemical reaction between the solvent and CO2, CO2 is absorbed, and refined methane is produced at the column’s top. Diethanolamine, diglycolamine, and monoethanolamine, among others, are solvents for removing carbon dioxide and hydrogen sulfide. In this study, the chemical adsorption of carbon dioxide from biogas is simulated using a monoethanolamine solvent.
3. Results
3.1. Physicochemical Characterization of OFMSW
The weight percentage of each element, including C, H, N, S, O, and Cl, was determined using elemental analysis. All the samples in this research were first separated and dried and crushed before each test. which is a kind of physical pre-treatment. Therefore, untreated samples are samples without thermal and chemical pretreatment. The physiochemical properties of the untreated specimen are listed in Table 1. The C/N ratio is crucial for anaerobic digestion. The optimal C/N ratio can range between 20 and 30. Typically, the carbon content of municipal waste is high. The TS of the sample was calculated to be 28.5%, while the VS accounted for 91.1% of the TS. Most of the waste was composed of food (more than 70%), primarily rice and bread with high starch content. According to previous studies on Iranian waste, the primary component of landfill waste is food [47].

Table 1.
Sample analysis.
The C/N ratio represents the accumulation of volatile fatty acids and total ammonia nitrogen (TAN) within the digester and indicates the nutrient level of the feedstock [48]. The system accumulates ammonia when the C/N ratio is low. This would inhibit the growth of microorganisms. A carbon concentration exceeding the permissible range would result in a higher N2 consumption rate, reducing the conversion of carbon into biogas and decreasing the production efficiency of biogas.
The effect of pretreatment on changes in vs and SCOD values can be seen in Table 2.
Table 2.
SCOD and VS values after pre-treatment.
As can be seen, with pre-processing, the physical and chemical properties of the samples change, the SCOD values of the samples increase, and the Vs values decrease. As can be seen in the Table 2, in proportion to the increase in the pretreatment temperature, the increase in the concentration of NaOH, and the increase in the concentration of H2O2, an increase in SCOD and a decrease in VS are observed. The reason for this is that complex organic substances under high temperature and pressure undergo both thermal hydrolysis and solubility with NAOH, which leads to the breaking of chemical bonds and the release of two simpler products in hydrolysis. As a result, the organic matter in the substrate is dissolved, which in turn increases the COD content.
3.2. Results and Analysis of Experiments
A total of 17 experiments were designed by the RSM in Design Expert. All the experiments were performed three times with the same initial feed. The average results of the samples that were tested were considered as the final result. The difference in the results of the same samples was between 0.5% and 3.9%. The experimental variables included temperature (A), NaOH concentration (B), and H2O2 concentration (C). The variable and response values obtained from the BBD are displayed in Table 3. As shown in Table 3, each experiment was repeated three times, with the average results recorded. The experiments and results were utilized to simulate the process and analyze the variances, resulting in an optimized process. In addition, biogas production results were subjected to a five-day control period. As previously stated, an unpretreated sample was included in the study. According to Table 3, the unpretreated sample contained 222 L/kg VS of biomethane thirty days after collection. The biomethane yield was greatest at a pretreatment temperature of 130 °C, H2O2 concentration of 5%, and caustic concentration of 6%. The highest biomethane yield is 54.5% greater than the yield of the untreated sample. On the other hand, a pretreatment temperature of 180 °C, an H2O2 mass fraction of 5%, and a caustic mass fraction of 10% resulted in the lowest biomethane yield. The lowest biomethane yield was 28% less than the yield of the unpretreated sample.
Table 3.
BBD matrix and response.
Experiments were conducted to determine the effects of thermal pretreatment temperature, H2O2 concentration, and NaOH concentration on CH4 yield. Analysis of variance (ANOVA) was used to fit the data into a second-order equation in this study. Moreover, this study converted the response equation into a power equation to improve model accuracy. Table 4 reports the ANOVA results.
Table 4.
ANOVA results.
The mathematical regression equation of methane yield and A (pretreatment temperature), B (NaOH concentration), C (H2O2 concentration), and Y (methane yield) factors is obtained as:
The F-value of 20,808.09 suggests a significant model. The probability of such a large F-value arising from noise is 0.01%.
The model terms are significant according to the ANOVA results for the quadratic regression model (p-value < 0.05). Then, the parameters A, B, C, AB, AC, BC, A2, B2, and C2 are all significant. A p-value > 0.100 indicates non-significance. As can be seen, the lack of fit F-value was 5.51, indicating a 6.64% probability for such a high lack of fit F-value to occur under noise. The residual variation can be measured relative to the mean using the coefficient of variation (CV). Typically, a larger CV indicates a lower experiment’s reliability [49]. The coefficient of variation (CV) obtained in this study was 0.40. This demonstrates that the experiment is more reliable. The predicted residual sum of squares (PRESS) can be used to evaluate the goodness of fit. Lower PRESS indicates greater optimal fitness [50]. This study determined a PRESS value of . The calculated coefficient of determination (R2) is 0.9995, which corresponds well with the adjusted R2 value of 0.9999. Figure 1 compares the actual results to the model’s predicted results. As shown in the Figure 1, there is good agreement between the experimental data and the model’s predicted values.
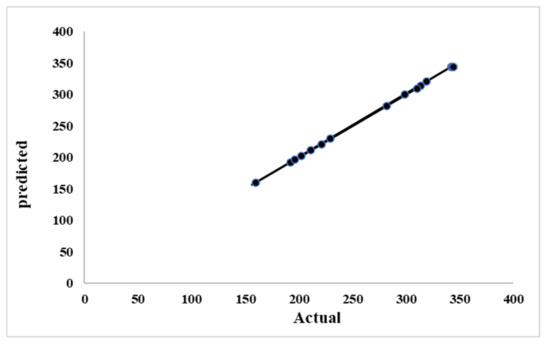
Figure 1.
Predicted versus actual biomethane yield under different H2O2 contents, NaOH contents, and pretreatment temperatures.
3.3. Pretreatment Effects on Biomethane Production
Based on Equation (1), two- and three-dimensional RSM graphs are provided to compare the interaction effect of the variables on the biomethane yield. Biomethane yield is plotted against NaOH concentration and pretreatment temperature in Figure 2a. As observed, the CH4 yield exhibited parabolic relationships with both the NaOH concentration and the temperature. As the NaOH concentration or pretreatment temperature increased, it rose to a certain value and then began to fall. This also applies to Figure 2c,e. It can be stated that the biomethane yield is minimized at an H2O2 content of 5%, NaOH content of 10%, and pretreatment temperature of 180 °C, i.e., 28% lower CH4 yield than the unpretreated sample. Moreover, an increase in H2O2 content increases biomethane production.
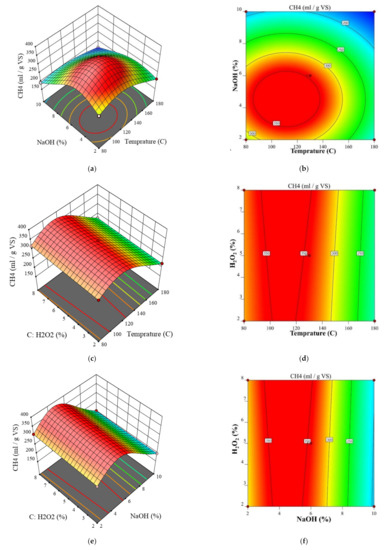
Figure 2.
Interaction of pretreatment temperature, NaOH concentration and H2O2 concentration on the biomethane production (a,c,e) 3D diagram, (b,d,f) contour diagram.
The biomethane yield is plotted against the H2O2 content and temperature in Figure 2c. As seen, as the temperature or H2O2 content rises, the biomethane yield peaks and begins to decline. In biomethane production, the temperature has a greater effect than the H2O2 content. Shariari et al. [10] reported the same trend for variations in H2O2 content and biogas yield. However, the present study found that an increase in H2O2 content between 0.5% and 5.0% did not affect biomethane yield when supplementing with 20–30% water. The biomethane yield is plotted against the H2O2 and NaOH content at a given temperature in Figure 2e.
Similarly, the biomethane increased and then began to decrease as these contents increased. However, the peak yield is greater in Figure 2e because NaOH exerts a greater influence than temperature. According to Figure 2d,f, the H2O2 content had a smaller impact on the biomethane yield in this study than the NaOH content and the temperature. In Figure 2, red areas indicate higher biomethane yields, while blue areas indicate lower yields.
The simultaneous effects of NaOH content, H2O2 concentration, and pretreatment temperature are depicted in the central point of Figure 3. According to the figure, the biomethane yield increased and then began to decrease as the NaOH concentration and temperature rose. In contrast, the biomethane yield consistently rose with increased H2O2 content.
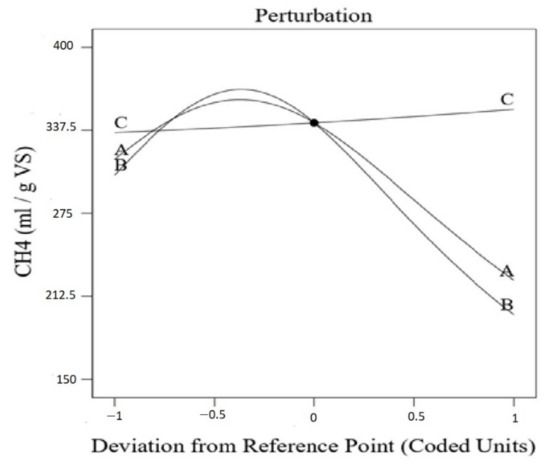
Figure 3.
Effects of pretreatment temperature; (A) NaOH concentration (B) and H2O2 concentration (C) on the biogas production at the central point.
Figure 4 depicts the cumulative diagram of biomethane production in various samples. As demonstrated in the figure, sample sp.130-6-5 will achieve maximum biomethane production more quickly. This sample demonstrated the quickest time to reach maximum biomethane production. In this sample, 71% of the total methane produced was obtained by the sixth day. The figure also demonstrates that biomethane production decreases at high temperatures and NaOH concentrations. High temperatures and high concentrations of NaOH reduce both the production of biomethane and the rate of biomethane production in the first ten days. Changes in the production of biomethane in samples sp.130-6-5, sp-80-6-8, sp-130-2-8, sp-80-6-2, and sp.130.2.2 over the past five days were less than 1%, making them suitable for industrial use. In these samples, predicting digestion with a residence time of fewer than 30 days is reasonable. The sample without pretreatment produces less biogas in the first few days. The reason for the lower speed in the beginning could be the time-consuming hydrolysis reaction of more complex compounds.
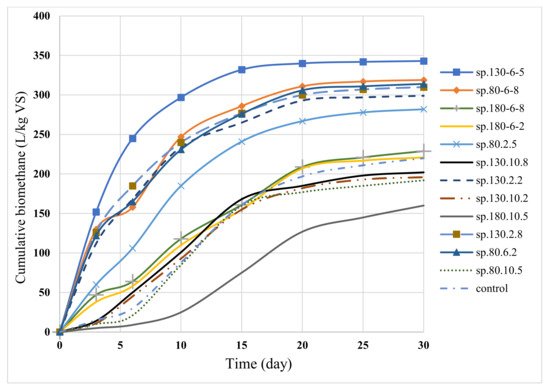
Figure 4.
Cumulative biomethane generated during anaerobic digestion of OFMSW.
The first scenario maximized the biomethane yield by optimizing the parameters. According to Figure 2 and Figure 3, the concentration of H2O2 should be maximized to maximize biomethane production, while the NaOH content and temperature must be maintained within specific ranges. Table 5 displays the estimated model and laboratory results for the optimal conditions. RSM revealed that the optimal conditions for the highest biomethane yield were approximately 399 L/kg VS. The objective of the second scenario optimization was to maximize biomethane yield while minimizing H2O2 content. It was observed that H2O2 had a lesser impact on biomethane yield than NaOH content and temperature. H2O2 is not affordable and cannot be completely recovered.
Table 5.
Estimated model and laboratory results for the optimal conditions.
In addition, the impact of H2O2 on biomethane yield is less than 2%. Consequently, the second scenario optimized digestion while minimizing H2O2 content. The highest estimated yield was 382 L/kg VS. Three repetitions of the experiments were performed under optimum conditions. In the optimal condition, the amount of biomethane produced was 392 L/kg VS and 384 L/kg VS in the first and second scenarios, respectively. Therefore, the model’s accuracy for the two scenarios is 0.5% and 1.7%, respectively. The temperature ramp and a maximum temperature difference of 2 °C across the autoclave in pretreatment could account for the discrepancies between the predicted and experimental results. Moreover, based on the direct ratio of H2O2, an experiment was conducted without H2O2 at the same temperature and concentration of NaOH as in scenario 2. In this case, the amount of biomethane was obtained as 370 L/kg.
3.4. Pretreatment Effects on SCOD and VS Reduction
To evaluate the technical and economic aspects of anaerobic digestion, optimal conditions with and without pretreatment were examined. In order to evaluate the performance of these conditions, the reduction of SCOD and VS (Table 6) was investigated more accurately. The VS and SCOD for unpretreated and optimized specimens are shown in Table 6. Experiments indicate that decreases in VS and SCOD positively affect biomethane yield. VS reduction was 70.3% and 67.9%, and SCOD reduction was 79.1% and 77.7% under optimal conditions and maximum H2O2 concentrations, respectively.
Table 6.
Optimum biomethane production conditions in the scenarios.
3.5. Biogas Upgrading Simulation
3.5.1. Simulation of the Cryogenic Separation Process
For the first optimized scenario and unpretreated digestion, a biogas flow rate of 14,800 m3 per day was applied to pretreated feed with a CH4 and CO2 composition of 62% and 38%, respectively. The other compounds were disregarded for simplification. The simulation was conducted at 37 °C and 1.05 bar, with a biogas density of 1.197 kg/m3 for pretreated feed.
Figure 5 depicts the simulation. The pressure was increased using three compressors. After each increase in pressure, the air cooler and heat exchanger reduce the temperature of the gas. Before entering the distillation column, the steam was at 45 bar and −71 °C. The risk of frozen CO2 at the column inlet would increase as temperatures rise. For both pretreated and unpretreated feedstock conditions, the cryogenic distillation column had a total of ten column stages, with the fifth receiving the feed. The products at the top of the column are methane-enriched biogas and CO2, respectively.
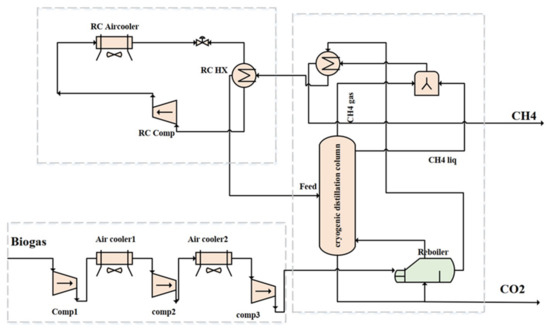
Figure 5.
Process flow diagram of cryogenic biogas upgrading.
The process equipment is detailed in Table 7. Pressure drops of 1% were assumed to occur in the heat exchanger. The input and parameters for the column are outlined in Table 7. According to this table, the output gas flowing from the top is rich in CH4 and can be utilized to generate power. The gas stream in the bottom consists of nearly pure CO2.
Table 7.
Pressure, temperature, and input and output of the distillation column in pretreated feed-cryogenic separation.
As presented in Figure 5, the biogas enters the distillation column through three intercooler-equipped pressure rise stages (gas coolers). Thus, the hot gas can provide energy to the reboilers, which cools down the gas. In the first case, simulations were performed for unpretreated conditions. The biogas leaves the reboiler at −29.94 °C and approaches a heat exchanger at a minimum of 10 °C. Before entering the distillation column, biogas cools to −71 °C in the refrigeration cycle after leaving the heat exchanger at −37.42 °C. To simulate the refrigeration cycle, R170, R170-R290, and R170-R600 were used as refrigerants. Table 8 provides the equipment’s power consumption.
Table 8.
Equipment conditions in biogas upgrading process- cryogenic separation.
Table 8 also includes the biogas upgrading energy requirements for pretreated and unpretreated digestion (R170 refrigerant). Energy is required for pretreatment and digestion. For instance, pretreatment equipment, stirrers, and agitators consume energy. The energy required for the biogas upgrading process and any other equipment in the anaerobic digestion process must be supplied by a biogas generator, with the surplus power being sold to the national grid. In the process design, a reciprocating combined heat and power (CHP) generator with 40% thermal and 40% power efficiency is used to generate power from the upgraded gas. Additionally, CH4 has a heat value of 50 kJ/kg.
Similar calculations were performed for the unpretreated condition.
3.5.2. Simulation of the Chemical Scrubbing Process
Figure 6 depicts a schematic of the cryogenic separation procedure. The loading amount of lean MEA is between 0.25 and 0.3 mol CO2/mol monoethanolamide [51]. The simulation was conducted in steady state condition using Aspen Hysys v12.1 software, which is a software for simulating the chemical processes. In the simulation, the solvent flow rate was determined to be 300 kmol/h based on the loading and the permissible CO2 content. The working pressure of the stripping column (solvent recovery) was in the range of 150–300 kpa, and the monoethanolamide solvent left the reboiler at a temperature of 117–120 °C, which was subsequently cooled after heat exchange with rich MEA. The process simulated the streams’ conditions, and the equipment’s energy consumption is shown in Table 9 and Table 10. The remainder of the process’s duties is fulfilled by the cold water flow.
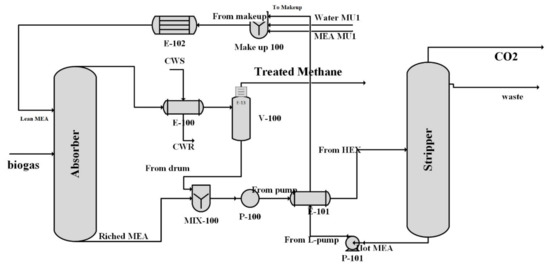
Figure 6.
Process flow diagram of chemical scrubbing biogas upgrading.
Table 9.
Pressure and temperature for the main stream pretreated feed-chemical scrubbing.
Table 10.
Equipment energy consumption biogas upgrading process- chemical scrubbing.
Similar calculations were performed for the unpretreated condition, optimal pretreatment with minimal H2O2 use, pretreatment with NaOH, and thermal treatment without H2O2.
The Aspen HYSYS software and APEA economic tool are used to calculate the initial (investment) cost, including equipment, installation, and commissioning for the biogas purification section. This software can calculate the investment cost, energy cost, and others for each of the studied processes. In addition, domestic suppliers enquired about the cost of digester and piping components. The software-calculated equipment cost was verified by contacting domestic suppliers and investigating the possibility of using government subsidies. A regional coefficient of 0.8 was applied to the available equipment in Iran.
3.6. Economic Analysis of Anaerobic Digestion
3.6.1. Increasing the Scale of Laboratory Data
Comparing the results of BMP tests with those of the poisonous pilot and industrial pilot revealed that it is possible to generalize the results of BMP with 89–90% accuracy in industrial dry digester reactors and 95% accuracy in industrial wet digester reactors [52].
3.6.2. Process Design
For a more comprehensive comparison of processes, this section compares an anaerobic digester without pretreatment to an anaerobic digester with optimal pretreatment using maximum/minimum H2O2 and an anaerobic digester without H2O2 under the same temperature and alkalinity conditions as the case with minimum/maximum H2O2.
Table 11 depicts each scenario by number and with supplementary details.
Table 11.
Conditions of different scenarios.
3.6.3. The Capacity, Framework, and Dimensions of the Designed Digesting Plant
Considering the hypotheses proposed in the preceding sections, the plant was designed to accept 100 tons of waste per day with the properties shown in Table 1, which is greater than 27 tons of dry waste per day.
After processing lines and waste sorting, urban waste digesters are installed. Therefore, it is assumed that the digesting plant will be placed after a waste processing line in the project. In addition, the cost of global grid connection and receiving and transporting gas is factored into the provision of heat and the calculation of added value. Costs for waste collection and treatment, among others, are defined outside the project’s scope.
3.6.4. Hypotheses of Economic Calculations
Given the internal environment of the case study market (the Iranian market), the following hypotheses are assumed to determine the economic parameters of the process and its economic viability.
- The price of guaranteed power purchase: 0.049 $/kWh
- The price of industrial grade NaOH: 0.5 $/kg
- The price of H2O2: 0.8 $/kg
- The selling price of dry matter-based fertilizer per kilogram: 33.34 $/ton
- Gate fee: 6.67 $/ton
- Two 6000-L hydrothermal reactors. Two horizontal openings with simultaneous water injection and saturated steam with an inlet hopper. A conveyor to transfer waste from the hopper to the reactor
- Annual inflation rate: 15%
- Interest rate: 15%
- Increase rate of guaranteed power purchase: 15%
- Project lifetime: 20 years
- Depreciation period of the plant: 7 years
- Aspen APEA was utilized for biogas upgrading, thermal pretreatment, and piping in Iran with a regional capacity of 0.8 in order to determine the price of equipment on the Iranian domestic market
- The price of biogas reservoirs and pretreatment was determined through an inquiry at a local producer
- Unpredicted costs equal to 5% of the cost of fixed investment
- The digester is active throughout the year, and the power station is active 345 days of the year
3.6.5. Fixed Investment Costs
A fixed cost is a cost that does not fluctuate with the rate at which goods or services are produced or sold. Fixed costs are expenses incurred by a business regardless of its specific business activity. Fixed investment costs include the following: land purchase, landscaping and land improvement, civil works, structures and buildings, plant machinery and equipment, servicing and accessory equipment, environmental protection, security, fixed assets, and unpredicted pre-production costs. Table 12 details the fixed investment costs for each scenario.
Table 12.
Fixed Investment costs (million USD).
Scenario 5 is the most cost-effective because waste pretreatment and gas purification are eliminated. In contrast, scenario 7 is the most expensive due to its costly biogas purification process and high pretreatment costs.
3.6.6. Operating and Utilizing Costs
The operating costs of a digester are the ongoing expenses incurred daily for its maintenance and use. These expenses are the result of the primary activities. These costs are categorized as follows: the cost of raw and consumable materials, the cost of maintenance, the cost of salary and insurance, the cost of energy, and other costs (including research and development, safety equipment, and others). Notably, the cost of heat and gas consumption is also included in these costs; however, a combined heat and power (CHP) unit is not required due to the process’ thermal energy balance. Moreover, if the 100 m3 gas subsidy for removing each ton of waste in Iran is considered, the cost of receiving gas for heating is practically zero. Table 13 depicts operating and utility expenses for various first-year scenarios. According to the assumptions of economic calculations for the second year, these costs will increase by 15%.
Table 13.
Operating and utilizing costs for different scenarios of an anaerobic digester design (million USD).
The maintenance cost section reflects the costs associated with biogas upgrading, solvent replacement, and gas analysis and control. Costs associated with contract renewal, fertilizer sales, and other activities have been calculated in the section titled “other costs”.
3.6.7. Plant Revenue
Plant revenue generally consists of selling power under a 20-year guaranteed purchase agreement with the government, selling high-quality fertilizer, and collecting gate fees. Given the risks associated with using a digester, 70% of the time, the digester’s output fertilizer is of the highest quality. Table 14 displays the first-year revenues generated by various scenarios Table 14. As stated in the hypotheses section, the revenue generated from the sale of fertilizer and power generation would increase by 15% per year due to inflation. Regarding power, power consumption for equipment utilization, including power consumption in gas purification, gas consumption of the digester (five mixers with 15 kw power), power consumption in pretreatment (30 kw for alkali pretreatment, including a stirrer and spreaders, and 25 kw for pretreatment with H2O2, including a stirrer and spreaders), and power consumption in the administrative building, lighting and power consumption of conveyers has been subtracted. In scenarios 2, 3, 4, and 7, there are numerous pretreatment processes, and in scenarios 6 and 7, the electricity consumption is higher due to the type of biogas upgrading process. Deducting the gross electricity generation from these values yielded the net power output for sale to the grid.
Table 14.
The revenue of different scenarios during the first year.
3.6.8. Comparison of Scenarios
The internal rate of return (IRR), net present value (NPV), and payback period parameters are calculated to compare various scenarios. The more feasible a project is, the higher its IRR or the shorter its payback period. Regarding NPV, this parameter represents the net present value, i.e., the present value of cash flows, using the scenario’s return rate. In capital budgeting and investment planning, NPV is used to evaluate the profitability of an investment or a particular project.
Given the hypotheses mentioned, Table 15 shows each scenario’s IRR, NPV, and payback period.
Table 15.
Economic parameters of each scenario.
Technically, none of the scenarios presented in Table 15 are permissible in Iran, given the current price of electricity. One of the primary causes is the high rate, which negates the NPV in the scenarios. Additionally, the low cost of entrance fees and the sale of fertilizer are effective indicators of nonviability. Since the government can only purchase electricity at a high price by presenting a financial model, the cost of justifying each scenario will be examined by analyzing the sensitivity of economic parameters to the price of purchasing electricity.
4. Discussion
Sensitive Analysis of Economical Parameters to the Price of Electricity
The price of electricity is one of the major sources of revenue for anaerobic digesters, and the price of guaranteed purchasing in Iran has the potential to increase by more than twofold. Below is an examination of the sensitivity of economic scenario parameters to the price of electricity.
As shown in Figure 7, IRR analysis reveals that only scenario 1 is valid when selling electricity at lower prices. However, as a result of the price increase and the fact that the amount of electricity generated in scenarios 2, 3, 4, and 7 will be greater than in scenario 1, the IRR of other scenarios will increase more quickly than in scenario 1. Since scenario 5 has a negative power at current prices, selling fertilizer and receiving gate fees was non-viable and was therefore not drafted. Furthermore, it can be seen that increasing the price of electricity by 0.09 $/kWh in scenario 4 is more justifiable than in scenario 1 because scenario 4 does not incur more expensive pretreatment costs with H2O2 and generates more than 65% more electricity than scenario 1. Similarly, scenario 3 would be more plausible than scenario 1 if the price of electricity rose to 0.145 $/kWh. Due to the positive slope of the IRR diagram, we anticipate higher prices as the sale of electricity continues to increase. Consequently, scenarios 2 and 7 are more viable than scenario 1.
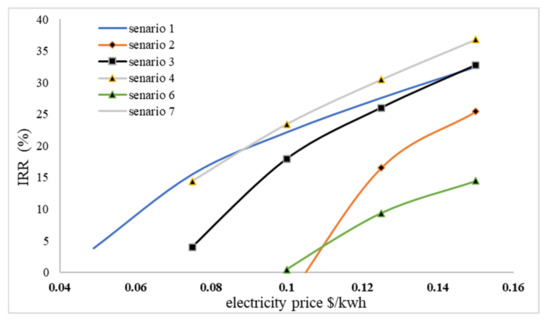
Figure 7.
IRR changes based on the selling price of electricity.
The payback period varies depending on the price of electricity, as shown in Figure 8. Identical outcomes were also observed when analyzing the payback period. The behavior of the scenarios in this diagram is similar to that of the IRR diagram. At the current price of electricity, only scenario 1 is valid, but scenarios 4 and 3 would be more viable with a sequential price increase.
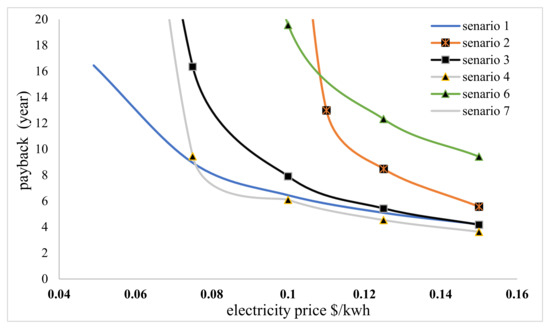
Figure 8.
Payback period changes based on the selling price of electricity.
Figure 9 depicts the relationship between NPV and the price of selling electricity. As shown in the diagram, scenario 7 has the lowest NPV at current prices, while scenario 1 has the highest NPV. In addition, all NPVs are negative. The existence of a 15% interest rate and a 15% inflation rate is the cause of this issue. In a sense, with the current interest rate, none of the scenarios with the current income model are economically viable without government subsidies. Indeed, when interest rates are low, these scenarios can be economical.
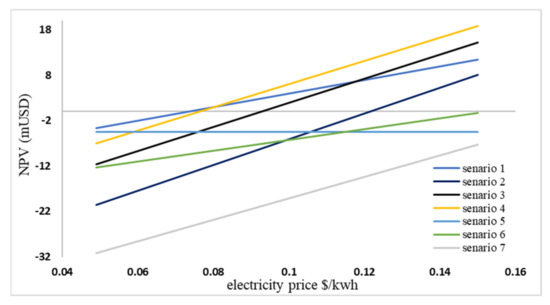
Figure 9.
NPV changes based on the selling price of electricity.
On the one hand, as the selling price of electricity rises, it can be observed that as the scenario’s electricity generation increases, the NPV will increase with a steeper slope. The NPV diagram reveals that scenario 7, with a positive IRR, is not economically viable, even if the price of electricity is tripled. Moreover, with the increase in electricity cost to over 0.09 $/kWh, scenario 4 is valid.
5. Conclusions
This study investigated the effects of thermal and chemical pretreatments (including NaOH- and H2O2-based pretreatments) on the efficiency of producing CH4 from OFMSW using the BBD. Several experiments were conducted to determine the relationship between biomethane yield and various variables. To maximize CH4 yield, the numerically optimal H2O2 mass fraction, NaOH mass fraction, and pretreatment temperature were determined to be 8%, 4.63%, and 110.8 °C, respectively. These numerically optimal conditions deviated from the corresponding experimental quantities by no more than 2%. The optimal biomethane yield was 76.5% greater than the unpretreated yield. In addition, the optimal digestion demonstrated a 77% reduction in SCOD. A simulation of biogas upgrading processes (cryogenic separation and chemical scrubbing) was performed to complete the remaining components of the anaerobic digestion process. Based on the data obtained from the laboratory segment and the simulation of biogas upgrading, an economic analysis of the digester’s various scenarios was conducted. It was observed that with the current prices of selling electricity, pre-processing is not economically justified. To be profitable, the electricity price must be at least 0.09 $/kWh without H2O2 and 0.145 $/kWh with H2O2.
Author Contributions
Conceptualization, E.N., A.N. and H.G.; methodology, E.N., A.N. and H.G.; software, E.N.; validation, E.N. and A.N.; formal analysis, E.N. and H.G.; investigation, E.N., A.N. and H.G.; resources, E.N. and A.N.; data curation, E.N., A.N. and H.G.; writing—original draft preparation, E.N.; writing—review and editing, E.N., A.N. and H.G.; visualization, E.N., A.N. and H.G.; supervision, A.N. and H.G.; project administration, A.N.; funding acquisition. All authors have read and agreed to the published version of the manuscript.
Funding
This research received no external funding.
Institutional Review Board Statement
Not applicable.
Informed Consent Statement
Not applicable.
Data Availability Statement
Data will be available upon request.
Conflicts of Interest
The authors declare no conflict of interest.
References
- By Fuel Type-Exajoules, C. and C.D. Emissions, bp Statistical Review of World Energy June 2020. 2006. Available online: https://www.bp.com/en/global/corporate/energy-economics/statistical-review-of-world-energy.html (accessed on 8 August 2022).
- Mercer, J.H. West Antarctic ice sheet and CO2 greenhouse effect: A threat of disaster. Nature 1978, 271, 321–325. [Google Scholar] [CrossRef]
- Sakai, S.-I.; Yoshida, H.; Hirai, Y.; Asari, M.; Takigami, H.; Takahashi, S.; Tomoda, K.; Peeler, M.V.; Wejchert, J.; Schmid-Unterseh, T.; et al. International comparative study of 3R and waste management policy developments. J. Mater. Cycles Waste Manag. 2011, 13, 86–102. [Google Scholar] [CrossRef]
- Granzotto, F.; Aita, C.; Silveira, D.; Mayer, F.; Pujol, S.; Piñas, J.; Hoffmann, R. Use of anaerobic biodigestor in the treatment of organic waste from a university restaurant. J. Environ. Chem. Eng. 2021, 9, 105795. [Google Scholar] [CrossRef]
- Siddiki, S.Y.A.; Uddin, M.; Mofijur, M.; Fattah, I.; Ong, H.C.; Lam, S.S.; Kumar, P.S.; Ahmed, S. Theoretical calculation of biogas production and greenhouse gas emission reduction potential of livestock, poultry and slaughterhouse waste in Bangladesh. J. Environ. Chem. Eng. 2021, 9, 105204. [Google Scholar] [CrossRef]
- Ariunbaatar, J.; Panico, A.; Esposito, G.; Pirozzi, F.; Lens, P.N. Pretreatment methods to enhance anaerobic digestion of organic solid waste. Appl. Energy 2014, 123, 143–156. [Google Scholar] [CrossRef]
- Kainthola, J.; Kalamdhad, A.; Goud, V.V. A review on enhanced biogas production from anaerobic digestion of lignocellulosic biomass by different enhancement techniques. Process Biochem. 2019, 84, 81–90. [Google Scholar] [CrossRef]
- Issah, A.-A.; Kabera, T.; Kemausuor, F. Biogas optimisation processes and effluent quality: A review. Biomass Bioenergy 2019, 133, 105449. [Google Scholar] [CrossRef]
- Dasgupta, A.; Chandel, M.K. Enhancement of biogas production from organic fraction of municipal solid waste using hydrothermal pretreatment. Bioresour. Technol. Rep. 2019, 7, 100281. [Google Scholar] [CrossRef]
- Shahriari, H.; Warith, M.; Hamoda, M.; Kennedy, K.J. Anaerobic digestion of organic fraction of municipal solid waste combining two pretreatment modalities, high temperature microwave and hydrogen peroxide. Waste Manag. 2012, 32, 41–52. [Google Scholar] [CrossRef]
- Ariunbaatar, J.; Panico, A.; Yeh, D.H.; Pirozzi, F.; Lens, P.N.; Esposito, G. Enhanced mesophilic anaerobic digestion of food waste by thermal pretreatment: Substrate versus digestate heating. Waste Manag. 2015, 46, 176–181. [Google Scholar] [CrossRef]
- Güelfo, L.F.; Gallego, C.J.; Sales, D.; Romero, L.I. The use of thermochemical and biological pretreatments to enhance organic matter hydrolysis and solubilization from organic fraction of municipal solid waste (OFMSW). Chem. Eng. J. 2011, 168, 249–254. [Google Scholar] [CrossRef]
- Mahmoodi, P.; Karimi, K.; Taherzadeh, M.J. Hydrothermal processing as pretreatment for efficient production of ethanol and biogas from municipal solid waste. Bioresour. Technol. 2018, 261, 166–175. [Google Scholar] [CrossRef]
- Li, Y.; Jin, Y. Effects of thermal pretreatment on acidification phase during two-phase batch anaerobic digestion of kitchen waste. Renew. Energy 2015, 77, 550–557. [Google Scholar] [CrossRef]
- Liu, X.; Wang, W.; Gao, X.; Zhou, Y.; Shen, R. Effect of thermal pretreatment on the physical and chemical properties of municipal biomass waste. Waste Manag. 2012, 32, 249–255. [Google Scholar] [CrossRef]
- De Camargos, A.B.; da Fonseca, Y.A.; Silva, N.C.S.; da Silva Barreto, E.; Adarme, O.F.H.; de Oliveira Paranhos, A.G.; AlvesGurgel, L.V.; Baêta, B.E.L. Production of biogas and fermentable sugars from spent brewery grains: Evaluation of one-and two-stage thermal pretreatment in an integrated biorefinery. J. Environ. Chem. Eng. 2021, 9, 105960. [Google Scholar] [CrossRef]
- Rafique, R.; Poulsen, T.G.; Nizami, A.-S.; Asam, Z.-U.; Murphy, J.D.; Kiely, G. Effect of thermal, chemical and thermo-chemical pre-treatments to enhance methane production. Energy 2010, 35, 4556–4561. [Google Scholar] [CrossRef]
- Bala, R.; Gupta, G.K.; Dasgupta, B.V.; Mondal, M.K. Pretreatment optimisation and kinetics of batch anaerobic digestion of liquidised OFMSW treated with NaOH: Models verification with experimental data. J. Environ. Manag. 2019, 237, 313–321. [Google Scholar] [CrossRef]
- Dasgupta, A.; Chandel, M.K. Enhancement of biogas production from organic fraction of municipal solid waste using alkali pretreatment. J. Mater. Cycles Waste Manag. 2020, 22, 757–767. [Google Scholar] [CrossRef]
- Rainone, F.; D’Agostino, O.; Erto, A.; Balsamo, M.; Lancia, A. Biogas upgrading by adsorption onto activated carbon and carbon molecular sieves: Experimental and modelling study in binary CO2/CH4 mixture. J. Environ. Chem. Eng. 2021, 9, 106256. [Google Scholar] [CrossRef]
- Angelidaki, I.; Treu, L.; Tsapekos, P.; Luo, G.; Campanaro, S.; Wenzel, H.; Kougias, P.G. Biogas upgrading and utilization: Current status and perspectives. Biotechnol. Adv. 2018, 36, 452–466. [Google Scholar] [CrossRef]
- Sun, Q.; Li, H.; Yan, J.; Liu, L.; Yu, Z.; Yu, X. Selection of appropriate biogas upgrading technology-a review of biogas cleaning, upgrading and utilisation. Renew. Sustain. Energy Rev. 2015, 51, 521–532. [Google Scholar] [CrossRef]
- Miltner, M.; Makaruk, A.; Harasek, M. Review on available biogas upgrading technologies and innovations towards advanced solutions. J. Clean. Prod. 2017, 161, 1329–1337. [Google Scholar] [CrossRef]
- Adnan, A.I.; Ong, M.Y.; Nomanbhay, S.; Chew, K.W.; Show, P.L. Technologies for Biogas Upgrading to Biomethane: A Review. Bioengineering 2019, 6, 92. [Google Scholar] [CrossRef]
- Choudhury, A.; Lansing, S. Adsorption of hydrogen sulfide in biogas using a novel iron-impregnated biochar scrubbing system. J. Environ. Chem. Eng. 2020, 9, 104837. [Google Scholar] [CrossRef]
- Peppers, J.; Li, Y.; Xue, J.; Chen, X.; Alaimo, C.; Wong, L.; Young, T.; Green, P.G.; Jenkins, B.; Zhang, R.; et al. Performance analysis of membrane separation for upgrading biogas to biomethane at small scale production sites. Biomass Bioenergy 2019, 128, 105314. [Google Scholar] [CrossRef]
- Ountaksinkul, K.; Vas-Umnuay, P.; Kasempremchit, N.; Bumroongsakulsawat, P.; Kim-Lohsoontorn, P.; Jiwanuruk, T.; Assabumrungrat, S. Performance comparison of different membrane reactors for combined methanol synthesis and biogas upgrading. Chem. Eng. Process. Process Intensif. 2019, 136, 191–200. [Google Scholar] [CrossRef]
- Salestan, S.K.; Rahimpour, A.; Abedini, R. Experimental and theoretical studies of biopolymers on the efficient CO2/CH4 separation of thin-film Pebax® 1657 membrane. Chem. Eng. Processing Process Intensif. 2021, 163, 108366. [Google Scholar] [CrossRef]
- Ayodele, T.; Alao, M.; Ogunjuyigbe, A.; Munda, J. Electricity generation prospective of hydrogen derived from biogas using food waste in south-western Nigeria. Biomass Bioenergy 2019, 127, 105291. [Google Scholar] [CrossRef]
- Khan, I.U.; Othman, M.H.D.; Hashim, H.; Matsuura, T.; Ismail, A.F.; Rezaei-DashtArzhandi, M.; Azelee, I.W. Biogas as a renewable energy fuel–A review of biogas upgrading, utilisation and storage. Energy Convers. Manag. 2017, 150, 277–294. [Google Scholar] [CrossRef]
- Ryckebosch, E.; Drouillon, M.; Vervaeren, H. Techniques for transformation of biogas to biomethane. Biomass Bioenergy 2011, 35, 1633–1645. [Google Scholar] [CrossRef]
- Naeiji, E.; Noorpoor, A.; Ghanavati, H. Energy, Exergy, and Economic Analysis of Cryogenic Distillation and Chemical Scrubbing for Biogas Upgrading and Hydrogen Production. Sustainability 2022, 14, 3686. [Google Scholar] [CrossRef]
- Rafiee, A.; Khalilpour, K.R.; Prest, J.; Skryabin, I. Biogas as an energy vector. Biomass Bioenergy 2020, 144, 105935. [Google Scholar] [CrossRef]
- Hon, D.N.; Shiraishi, N. Wood and Cellulosic Chemistry, Revised, and Expanded; CRC Press: Boca Raton, FL, USA, 2000. [Google Scholar] [CrossRef]
- Zheng, Y.; Zhao, J.; Xu, F.; Li, Y. Pretreatment of lignocellulosic biomass for enhanced biogas production. Prog. Energy. Combust. Sci. 2014, 42, 35–53. [Google Scholar] [CrossRef]
- Maruyama, S.A.; Palombini, S.V.; Claus, T.; Carbonera, F.; Montanher, P.F.; De Souza, N.E.; Visentainer, J.V.; Gomes, S.T.M.; Matsushita, M. Application of Box-Behnken Design to the Study of Fatty Acids and Antioxidant Activity from Enriched White Bread. J. Braz. Chem. Soc. 2013, 24, 1520–1529. [Google Scholar] [CrossRef]
- Khajvand, T.; Chaichi, M.J.; Nazari, O.; Golchoubian, H. Application of Box–Behnken design in the optimization of catalytic behavior of a new mixed chelate of copper (ІІ) complex in chemiluminescence reaction of luminol. J. Lumin. 2011, 131, 838–842. [Google Scholar] [CrossRef]
- Song, Z.; Yang, G.; Han, X.; Feng, Y.; Ren, G. Optimization of the Alkaline Pretreatment of Rice Straw for Enhanced Methane Yield. BioMed Res. Int. 2012, 2013, 1–9. [Google Scholar] [CrossRef]
- Ferreira, S.L.C.; Bruns, R.E.; Ferreira, H.S.; Matos, G.D.; David, J.M.; Brandão, G.C.; da Silva, E.G.P.; Portugal, L.A.; dos Reis, P.S.; Souza, A.S.; et al. Box-Behnken design: An alternative for the optimization of analytical methods. Anal. Chim. Acta 2007, 597, 179–186. [Google Scholar] [CrossRef]
- Hansen, T.L.; Schmidt, J.E.; Angelidaki, I.; Marca, E.; Jansen, J.L.C.; Mosbæk, H.; Christensen, T.H. Method for determination of methane potentials of solid organic waste. Waste Manag. 2004, 24, 393–400. [Google Scholar] [CrossRef]
- Rice, E.W. Standard Methods for the Examination of Water and Wastewater; American Public Health Association: Washington, DC, USA, 2012; Volume 10. [Google Scholar]
- Andriani, D.; Wresta, A.; Atmaja, T.D.; Saepudin, A. A Review on Optimization Production and Upgrading Biogas Through CO2 Removal Using Various Techniques. Appl. Biochem. Biotechnol. 2013, 172, 1909–1928. [Google Scholar] [CrossRef]
- Kapoor, R.; Ghosh, P.; Kumar, M.; Vijay, V.K. Evaluation of biogas upgrading technologies and future perspectives: A review. Environ. Sci. Pollut. Res. 2019, 26, 11631–11661. [Google Scholar] [CrossRef]
- Hosseinipour, S.A.; Mehrpooya, M. Comparison of the biogas upgrading methods as a transportation fuel. Renew. Energy 2019, 130, 641–655. [Google Scholar] [CrossRef]
- Yousef, A.M.; El-Maghlany, W.M.; Eldrainy, Y.A.; Attia, A. Upgrading biogas to biomethane and liquid CO2: A novel cryogenic process. Fuel 2019, 251, 611–628. [Google Scholar] [CrossRef]
- Yousefi, H.; Mehrpooya, M.; Naeiji, E. Modeling and optimization of currently in operation natural gas desulfurization process using adsorption separation method. Chem. Eng. Process. Process Intensif. 2017, 120, 220–233. [Google Scholar] [CrossRef]
- Damghani, A.M.; Savarypour, G.; Zand, E.; Deihimfard, R. Municipal solid waste management in Tehran: Current practices, opportunities and challenges. Waste Manag. 2008, 28, 929–934. [Google Scholar] [CrossRef]
- Panigrahi, S.; Dubey, B.K. A critical review on operating parameters and strategies to improve the biogas yield from anaerobic digestion of organic fraction of municipal solid waste. Renew. Energy 2019, 143, 779–797. [Google Scholar] [CrossRef]
- Wang, X.; Yang, G.; Li, F.; Feng, Y.; Ren, G. Response surface optimization of methane potentials in anaerobic co-digestion of multiple substrates: Dairy, chicken manure and wheat straw. Waste Manag. Res. J. Sustain. Circ. Econ. 2012, 31, 60–66. [Google Scholar] [CrossRef]
- Jose, P.; Madhu, G. Optimization of process parameters affecting biogas production from organic fraction of municipal solid waste via anaerobic digestion. Int. J. Bioeng. Life Sci. 2014, 8, 43–48. [Google Scholar]
- Vo, T.T.; Wall, D.M.; Ring, D.; Rajendran, K.; Murphy, J.D. Techno-economic analysis of biogas upgrading via amine scrubber, carbon capture and ex-situ methanation. Appl. Energy 2018, 212, 1191–1202. [Google Scholar] [CrossRef]
- Holliger, C.; De Laclos, H.F.; Hack, G. Methane Production of Full-Scale Anaerobic Digestion Plants Calculated from Substrate’s Biomethane Potentials Compares Well with the One Measured On-Site. Front. Energy Res. 2017, 5, 12. [Google Scholar] [CrossRef]
Publisher’s Note: MDPI stays neutral with regard to jurisdictional claims in published maps and institutional affiliations. |
© 2022 by the authors. Licensee MDPI, Basel, Switzerland. This article is an open access article distributed under the terms and conditions of the Creative Commons Attribution (CC BY) license (https://creativecommons.org/licenses/by/4.0/).