Article

Anaerobic Co-Digestion of Sugarcane Leaves, Cow Dung and Food Waste: Focus on Methane Yield and Synergistic Effects

1
Institute of Biomass Engineering, Key Laboratory of Energy Plants Resource and Utilization, Ministry of Agriculture and Rural Affairs, Guangdong Engineering Technology Research Center of Agricultural and Forestry Biomass, South China Agricultural University, Guangzhou 510642, China
2
Key Laboratory of Environmental and Applied Microbiology, Environmental Microbiology Key Laboratory of Sichuan Province, Chengdu Institute of Biology, Chinese Academy of Sciences, Chengdu 610041, China
*
Author to whom correspondence should be addressed.
These authors contributed equally to this work.
Fermentation 2022, 8(8), 399; https://doi.org/10.3390/fermentation8080399
Submission received: 20 July 2022 / Revised: 13 August 2022 / Accepted: 15 August 2022 / Published: 17 August 2022
(This article belongs to the Special Issue Biomass Waste as a Renewable Source of Biogas Production)

Abstract

:
Anaerobic co-digestion (AcoD) of food waste (FW) and lignocellulose waste is a promising technology for methane production. This work investigated the methane generation from AcoD of FW, sugarcane leaves (SLs), and cow dung (CD) under mesophilic conditions in a batch test. As for AcoD of two feedstocks (SL and FW or CD and FW), introduction of SL and CD (25%, volatile solid (VS) basis) showed slight improvement in methane production from FW. In contrast, positive synergistic effect (synergy index = 1.03–1.14 > 1) was observed in all the AcoD reactors of the three feedstocks (SL, CD, and FW). The optimum mixing ratio of FW:SL:CD (VS basis) was 85:11.25:3.75 with a synergy index of 1.07, achieving a methane yield rate and methane content of 297.16 mL/g VS and 73.26%, respectively. This group cumulative methane production was an improvement of 110.45 and 444.72% higher than mono-digestion of SL and CD. The biodegradability, soluble chemical oxygen demand (SCOD), and VS removal rate were 56.44, 44.55 and 55.38%, respectively. The optimum results indicated that AcoD of FW, SL, and CD have higher potentials for energy recovery and provided forceful scientific evidence for their energy utilization.

1. Introduction

With the continued population increase and rising economic activity, the annual yield of global food waste (FW) is estimated to be 1.3 billion tons [1]. FW has been typically despoiled using compost, landfilling, and incineration, leading to multiple environmental problems, such as air, water, and soil pollution [2,3,4]. Compared with landfilling, incineration, and composting treatments, the anaerobic digestion (AD) technology conversion of FW into bio-methane is an alternative way to address the challenges of FW management and energy security [5,6]. This is because these methods can use FW as a raw material to generate biogas that is primarily comprised of methane, carbon dioxide, and organic fertilizers, simultaneously. This, thus, relieves the pernicious impacts to human health and the environment [7].
Generally, FW contains large amounts of organic components (e.g., lipids, carbohydrates, and soluble proteins) with high moisture contents. Therefore, it has a high biodegradability and methane production potential [8,9], which makes it a common substrate in AD. However, in many reactors that use FW as the mono-digestion material, it has been reported that as the organic loading rates increases, acidification occurs easily, and ammonia concentration increases in the AD reactor. This leads to instability or failure of the AD process [10,11]. To overcome the disadvantages of FW mono-AD, some researchers have suggested the use of two or more substrates in the anaerobic co-digestion (AcoD) to improve the stability of the AD process, methane production, and digestion efficiency [12,13,14]. Furthermore, as compared with various pretreatment methods, AcoD does not require additional energy or chemicals, and this reduces the operating costs of biogas plants [15,16].
Previous studies have shown that the AcoD of FW with lignocellulose-rich materials can significantly improve the stability of the AD process and the output of biomethane. This is primarily because the AcoD nitrogen-rich FW with nitrogen-deficient lignocellulose can adjust the nutritional balance and play a role in diluting toxic substances [17], thereby accelerating the growth and metabolism of microorganisms. Until now, various inexpensive and readily available organic solid wastes have been used as substrates for the AcoD of FW, such as sewage sludge [18], yard waste [19], crop straw [20], and animal manure [21]. Due to the large output of sugarcane leaves (SL) and cow dung (CD), having high lignocellulose content, and high C/N ratio, these are potential raw materials for producing biomethane. However, SL and CD have low nitrogen contents that affect the normal growth and metabolism of anaerobic microorganisms. In addition, the complex structure of lignocellulose limits their rate of hydrolysis. As a result, they have a low gas production rate and low efficiency during mono-digestion [10,22]. Therefore, utilizing SL and CD co-digestion with FW seems to be a good choice. The addition of SL and CD can adjust the C/N balance of the AD system of the FW, thereby maintaining the stability of the process. Additionally, FW is rich in degradable organic matter, which is beneficial for the growth, metabolism, and reproduction of microorganisms during the early period of the AD system [8]. This can solve the problem of the slow growth of microorganisms during the mono-AD of SL and CD.
In fact, most previous studies have shown that the AcoD of three or more raw materials had higher AD process stabilities and higher methane yields than the AcoD of two substrates [23]. In addition, multiple organic solid waste materials used in AcoD in the same reactor can reduce the construction investment of the AD reactor [24]. However, most of the current research is focused on the AcoD of two raw materials. Only a few studies have been performed to investigate the AcoD of three raw materials, and there exist very few studies that have paid attention to the AcoD of FW, SL, and CD. Therefore, in this study, different proportions of FW, SL, and CD were used for AcoD to discover the best mixing ratio for promoting methane yield. The methane yield performance was investigated through profiling of daily methane yield and cumulative methane yield, while process stability was studied by pH, and ammonia nitrogen. The efficiency was discussed by biodegradability, organic matter removal and synergistic effects.

2. Materials and Methods

2.1. Substrates and Inoculum

FW, SL, and CD were used as digestion substrates in this study. The FW was collected from the South China Agricultural University student’s canteen (Guangzhou, China). The SL was obtained from villagers in Shaoguan City, Guangdong, China. Solid fresh CD samples were collected from the WENS groups dairy farm (Zhaoqing City, Guangdong, China), after they had undergone solid–liquid separation. All of the substrates were crushed using a grinder (Yunbang 2500A, Huzhou, Zhejiang, China) to a size of 2–3 mm. The samples were frozen until they were used in the batch test experiments.
The inoculum for the AD process applied in this work was derived from a mesophilic anaerobic reactor located in our laboratory. This process was conducted for 100 days, with a solid retention time of 15 d, using FW and SL as the feedstocks. The inoculum was pre-cultured under anaerobic conditions for two weeks to remove organic matter. The characteristics of the feedstocks and inoculum used in this study are exhibited and discussed in Section 3.1.

2.2. Batch Test Design

AD batch tests were conducted to assess the effect of the FW, SL, and CD co-AD in a series of 500 mL sealed glass bottles with effective working volumes of 450 mL each. The FW, SL, CD, FW + SL, FW + CD, and FW + SL + CD were used as the feedstocks (mono and mixed) with focus on FW based assays. The volatile solid (VS) of the feedstocks added in each bottle was 10.6 g, and the VS ratio of the substrate and inoculum was 1:1. Then the reactor was capped with a silica gel stopper and purged using nitrogen for another 3–5 min to create an oxygen free atmosphere. After purging, the reactor was placed in a 37 ± 1 °C thermostat water bath at a stirring rate of 150 rpm/min. The batch tests lasted for 21 days until a negligible amount of methane yield was observed. All the batch tests were performed in triplicate. Table 1 displays the detailed information for the different mixing ratios and inoculum.

2.3. Physicochemical Analyses

The total solids (TS) and VS were detected based on the procedures described in the Standard Methods manual [25]. The pH meter (FiveEasy Plus, Mettler Toledo, Switzerland) was used to measure the pH of the collected digestate. The ammonia nitrogen (NH4+-N) and Soluble Chemical Oxygen Demand (SCOD) was determined using commercial reagent kits (Hach Company, Loveland, Colorado, US) and a Hach DR 3900 spectrophotometer. The proteins were determined using the Folin-phenol reagent method (Lowry method) [26], and the carbohydrate was measured using the phenol-sulfuric acid method [27].
A gas collecting bag was utilized to collect the biogas. The biogas volume was measured every day using a 100-mL plastic syringe, and its composition was analyzed using a gas chromatograph (GC2010 Plus, Shimadzu, Tokyo, Japan) equipped with thermal conductivity detectors (TCD) for CH4, CO2, H2, and N2 quantification. Argon gas was applied as the carrier gas at 25 mL/min, and the working temperatures of the injector, detector, and capillary packed column were 100, 170 and 60 °C, respectively. The carbon (C), hydrogen (H), oxygen (O), nitrogen (N), and sulfur (S) contents were measured on a dry weight basis and were determined using an elemental analyzer (Vario EL, GmbH, Hanau, Germany). Three parallel experiments were conducted for all analysis.

2.4. Calculations

The daily methane yield (DMY) was calculated using Equation (1).
DMY = Daily biogas volume × Methane content
The specific methane yield (SMY) was determined according to Equation (2) [28]:
S M Y = VMY g   VS
where:
SMY = The specific methane yield in (mL/g VS);
VMY = The total volume of the bio methane yield in (mL); and
g VS = The mass of VS added to each reactor.
The theoretical methane yield (TMY) was determined using Equation (2) [28] and is shown as the following:
TMY = 930 C + 2790   H 350   O 600   N 175   S C + H + O + N + S
where C, H, O, N, and S are the percentages carbon, hydrogen, oxygen, nitrogen, and sulfur in the feedstocks on a dry basis.
ABD % = SMY TMY × 100 %
The feedstock anaerobic biodegradability (%ABD) was calculated using Equation (4).
The synergy index (SI) was calculated to evaluate the synergistic effect of the AcoD for each feedstock’s mixture according to Equations (5) and (6):
WMY = FW CMY × A + SL CMY × B + CD CMY × C
SI = SMY WMY
where:
WMY = the weighted methane yield in (mL/g VS);
A is the ratio of FW (VS basis); B is the ratio of and SL (VS basis); and C was the ratio of CD (VS basis).
If SI > 1, then the AcoD has a positive synergistic effect. If SI < 1, then the AcoD has a negative synergistic effect. If the synergy = 1, then there is no synergistic effect [29].
The VS removal was calculated using Equation (7):
V S r e m o v a l = VS i n i t i a l V S f i n i s h VS i n i t i a l × 100 %
where VSinitial is the VS concentration at initial time (mg/L) and VSfinish is the end VS concentration (mg/L).
The SCOD removal was calculated using Equation (8).
S C O D r e m o v a l = SCOD i n S C O D o u t SCOD i n × 100 %
where SCODin is the SCOD concentration at initial time (mg/L) and VSout is the end SCOD concentration (mg/L).

2.5. Kinetic Model-Based Analysis

This study utilized the modified Gompertz model Equation (7) to fit the batch test data of the CMY at the different mixture ratios [30]:
M ( t ) = Y 0   exp { exp [ e × R m Y 0 ( k t ) + 1 ] }
where M(t) is the SMY at a given time t (mL/g VS); Y0 is the maximum methane potential (mL/g VS); Rm is the maximum methane yield rate (mL/g × VS/d); k is the lag time (d); t is the AD duration (d); and e ≈ 2.7183.

2.6. Statistical Analysis

For each group, a t-test was conducted to identify the statistical significance of the synergy index using one-way ANOVA (SPSS IBM statistics 22.0), and the value of p < 0.05 was considered as the criterion for statistical significance.

3. Results and Discussion

3.1. Characterization of the Feedstocks and Inoculum

The raw material characteristics are extremely important factors that affect the start-up of AD, process stability, and methane production [31]. Table 2 illustrates the physical and chemical properties of the FW, SL, CD, and the inoculum.
The VS of the three substrates, FW, SL, and CD, were 94.30, 86.34 and 93.56%, respectively. The three substrates had a high VS content and were suitable for methane production. Hence, they were all regarded as potential raw materials for AD.
The elemental analysis showed that the C/N ratios of the FW, SL, and CD were 17.89, 36.51 and 26.10, respectively. According to the literature, the C/N ratios of reactors with higher methane productions range from 20–30 [32]. However, only the C/N ratio of the CD was within the recommended optimum range. The C/N ratio of the FW and SL were out of this range. The methane production and ABD results, which are discussed in Section 3.3, showed that a suboptimal C/N ratio did not affect the biodegradation of the FW and SL. This was primarily likely due to the inoculum supplying adequate nutrients for microbial growth. In addition, in this study, the carbohydrate content of the FW was low, which may have been one of the reasons why the FW did not acidify during the early stage of mono-digestion alone (discussed in Section 3.3). The CD had the lowest soluble carbohydrates and lipids, which may have been the reason for the lower methane production in the experimental group that had more CD additions.
The inoculum characteristics also played an important role in the start-up and stable operation of the AD process. In this study, the pH of the inoculum was 7.87 ± 0.01, which neutralized the initial acid production of the AD system of the FW and played a significant role in avoiding the acidification of the system [33].

3.2. Methanogenesis

In an AD system, the most desired and valuable energy recovery product is methane. Therefore, the methane yield rate and methane yield are two of the most important indicators that were used to evaluate the efficiency of the AD in this study. The following section shows the results of the daily methane yield and cumulative methane yield.

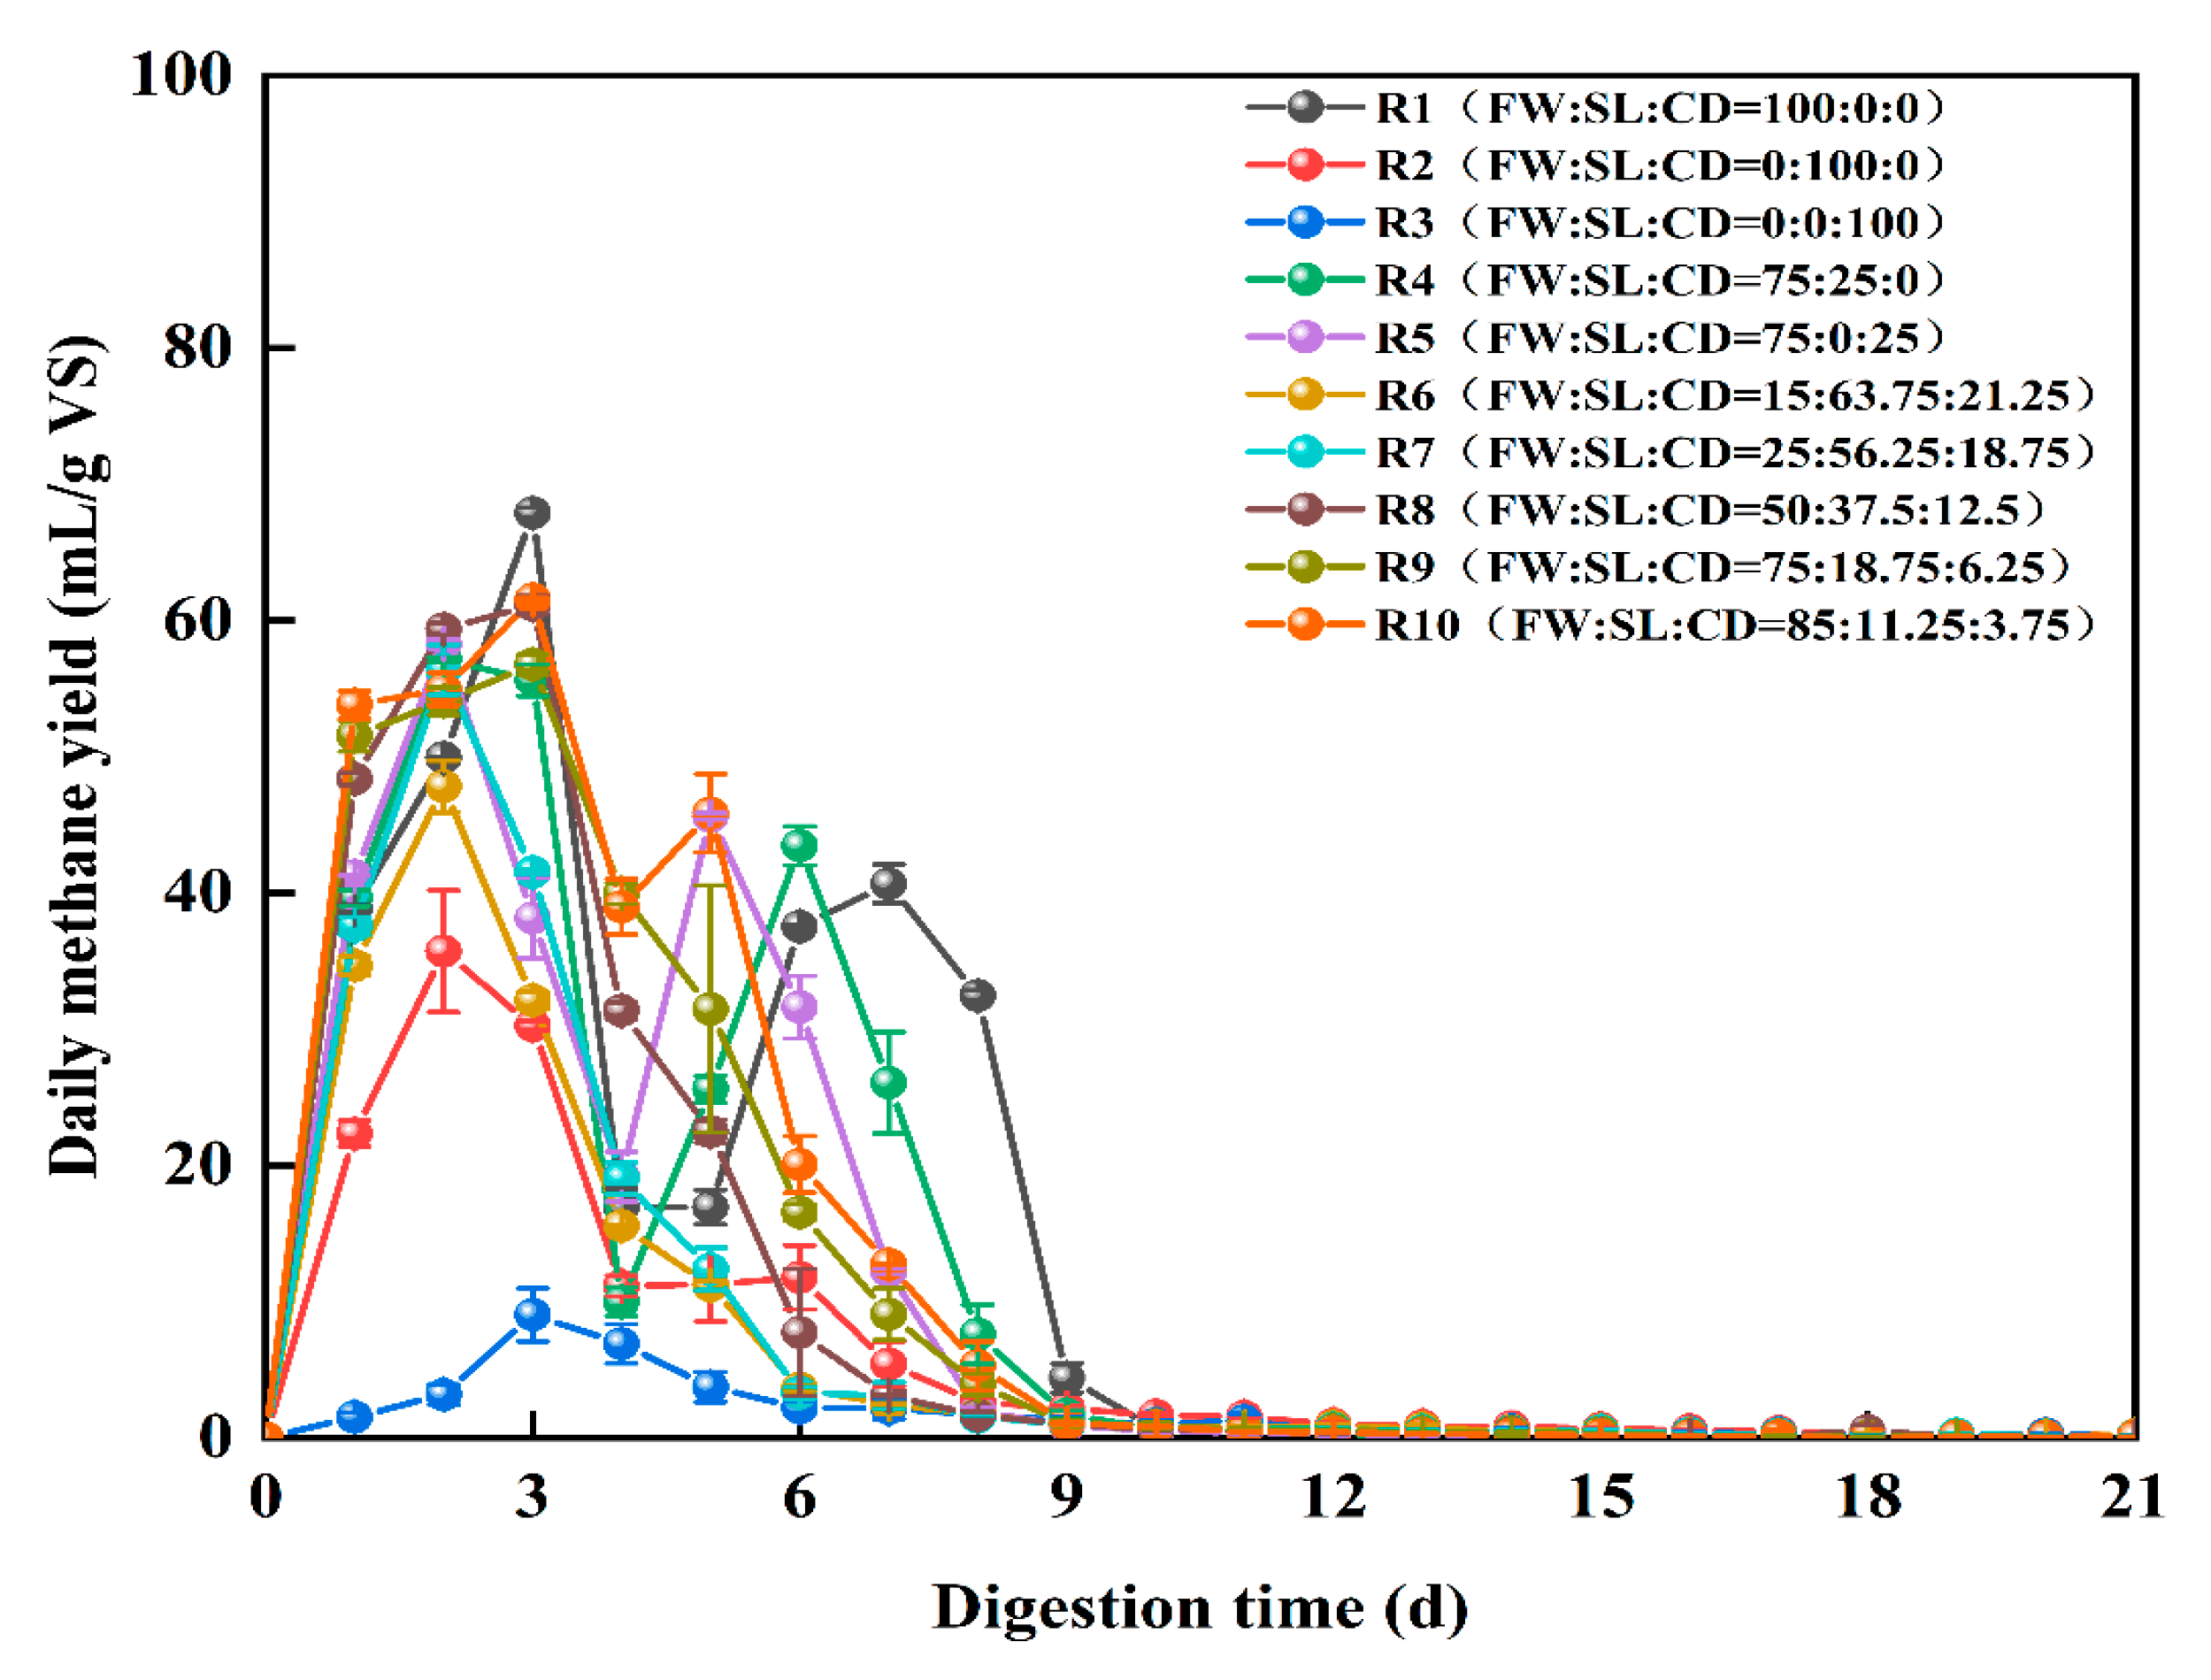
3.2.1. Methane Yield Rate

The DMY rate can reflect the crest value situation of methane generation, and different methane production peaks can reflect the differences in the AD kinetics [34]. The variation tendencies of the daily methane using the different feedstock mixing ratios are shown in Figure 1. During the AD period, the experimental results indicated that the main trends observed were quite similar for all groups. The AD process started rapidly, and the DMY increased swiftly until achieving the peak value and then decreased gradually. Moreover, there appeared to be a difference in both the culmination times and the peak values of the DMY in the different feedstock mixing ratios.
In this study, the highest methane generation crests that appeared in the four experimental series on the second day were R2 (35.70 mL/g VS), R4 (57.13 mL/g VS), R5 (58.25 mL/g VS), R6 (47.81 mL/g VS), and R7 (56.38 mL/g VS). On the third day, they were R1 (67.88 mL/g VS), R3 (9.02 mL/g VS), R8 (61.13 mL/g VS), R9 (56.76 mL/g VS), and R10 (61.54 mL/g VS). The second DMY peaks appeared on the 7th, 6th, and 5th days, and they were R1 (40.66 mL/g VS), R4 (43.46 mL/g VS), and R10 (45.85 mL/g VS) groups. A related study reported that the reason for the two or three methane yield crests may be due to the diverse degradation rates of lipid, protein, and carbohydrate components in the FW [35]. In addition, a second methane peak appeared in FW AcoD system due to the acceleration of the AcoD dissolution efficiency for organic matter and this induced or boosted the heterogeneous degradation process [17].

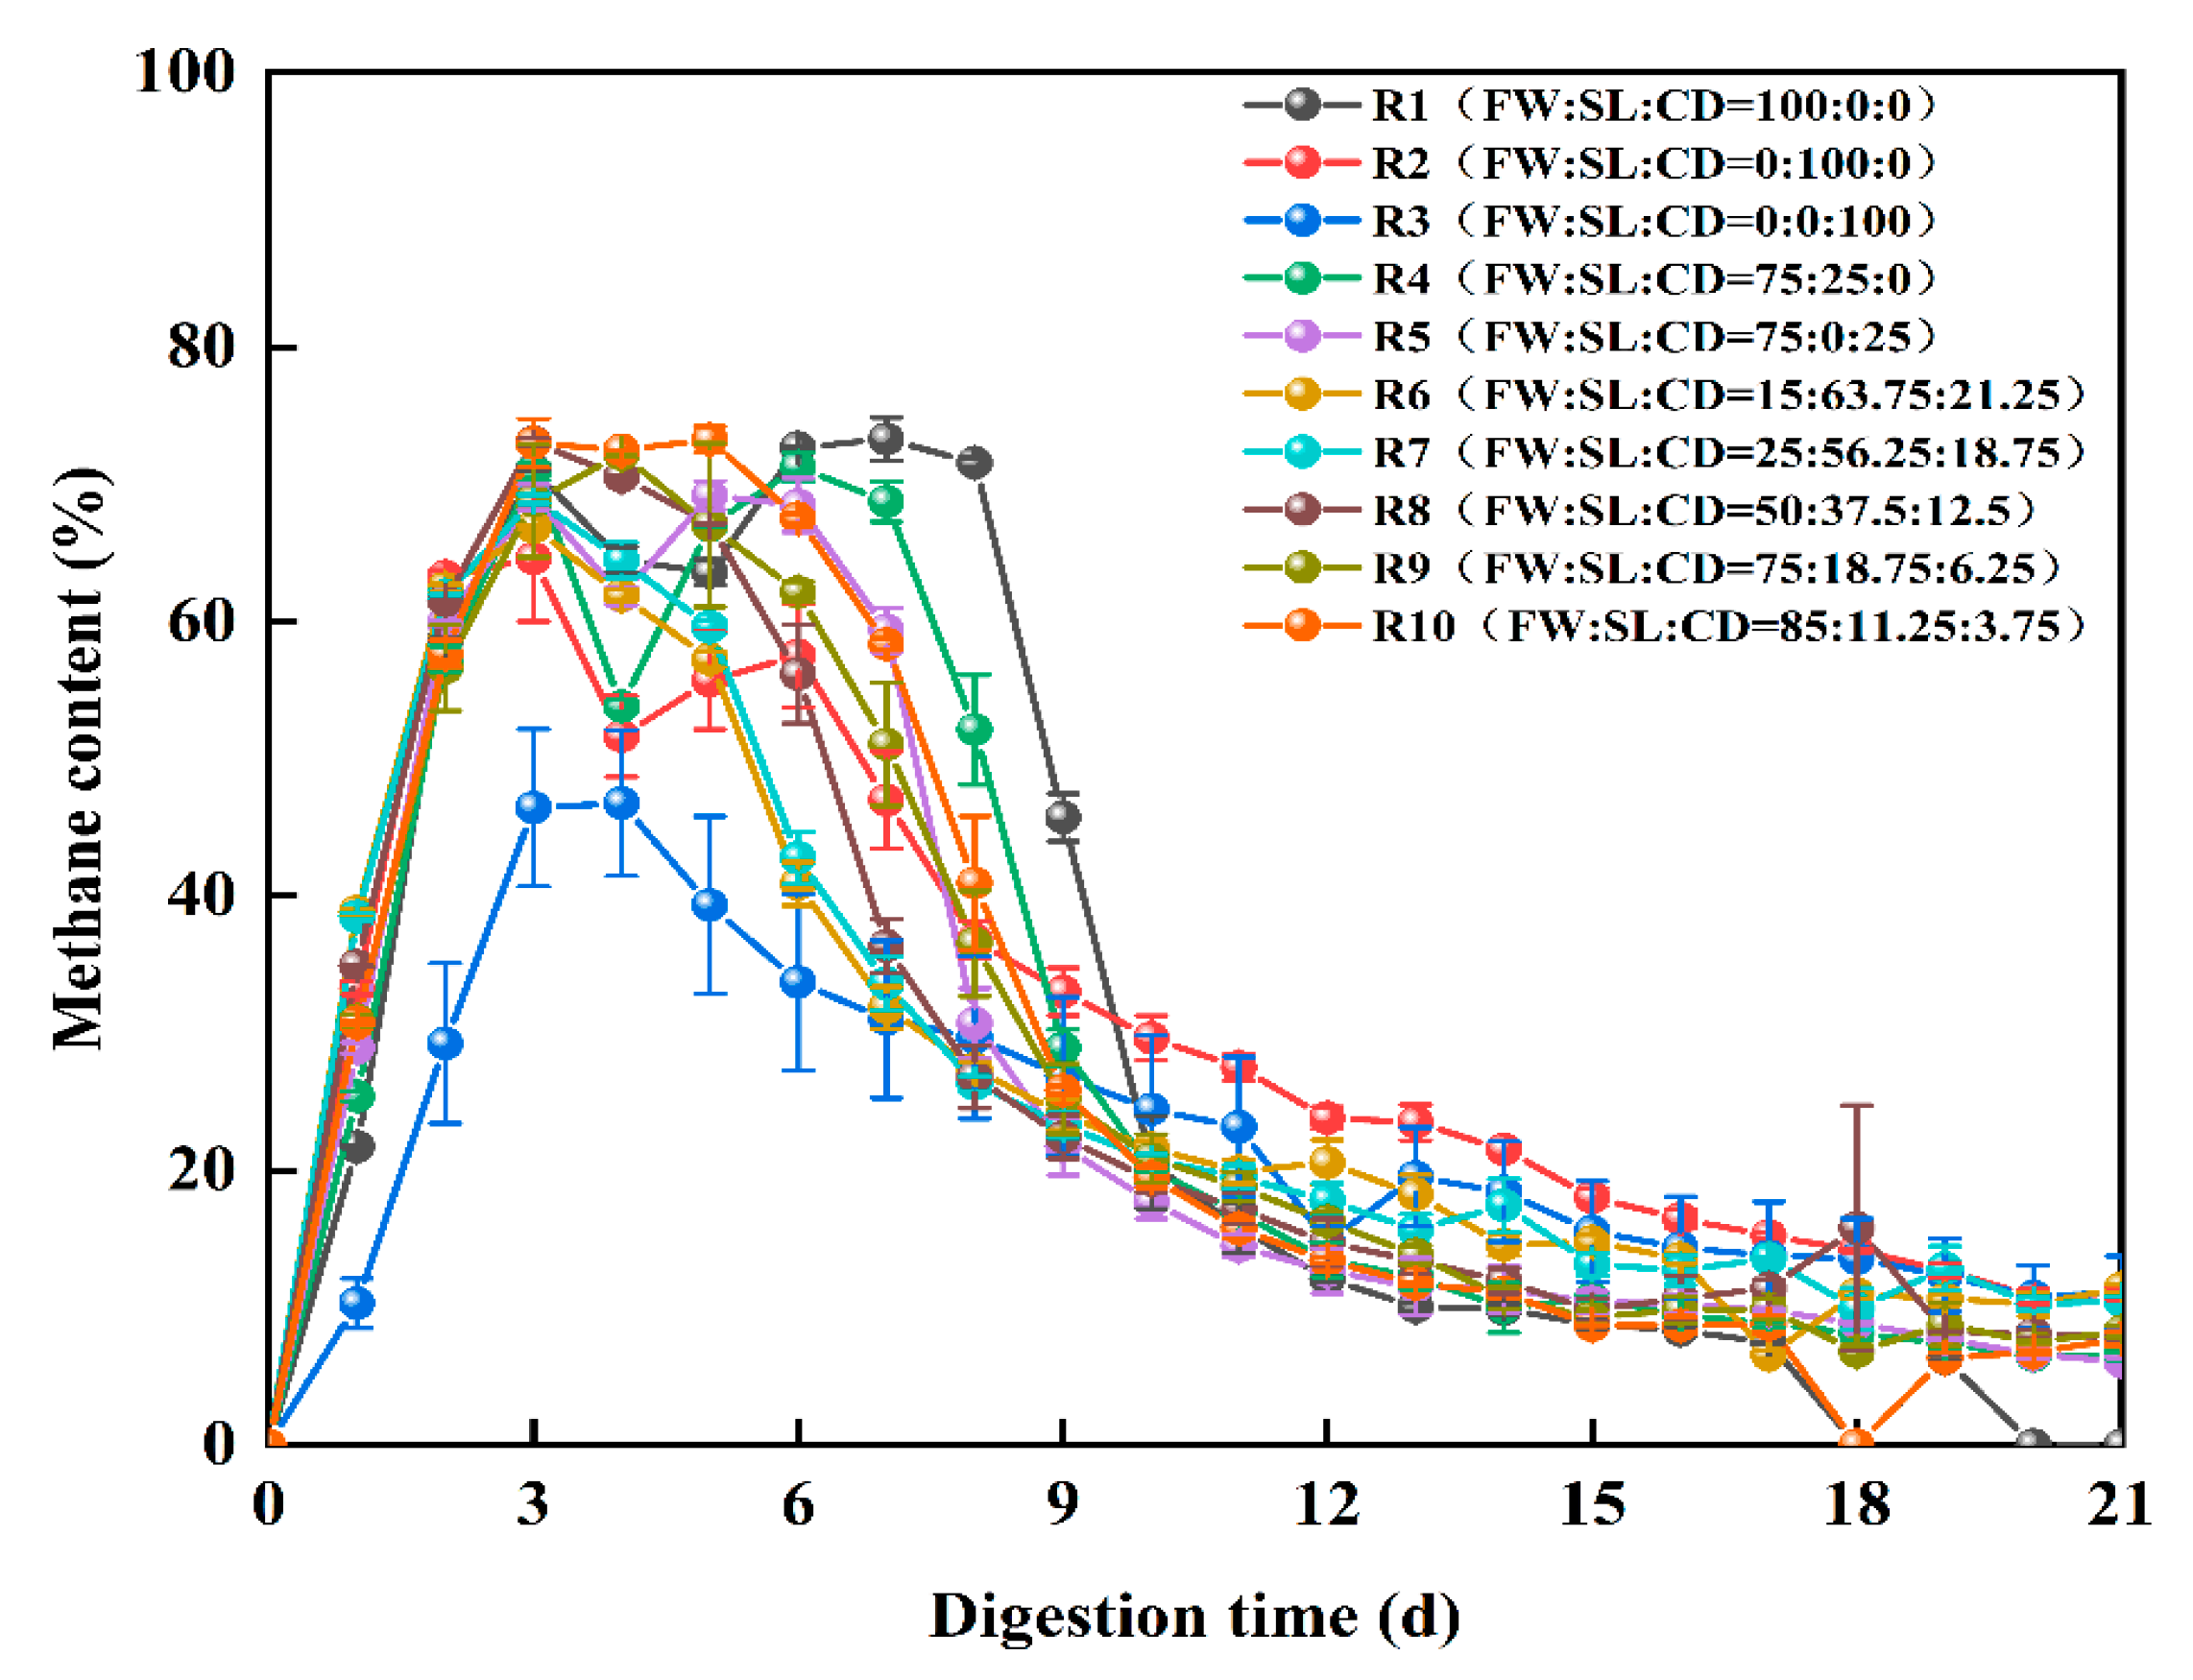
3.2.2. Methane Content

The methane content was tested every day, as shown in Figure 2. During the first three days, the ten groups demonstrated a similar trend in methane content, where it increased rapidly to a stable level and then gradually decreased as the substrate degraded. The methane content of the AD biogas was 55–70%, as described in two studies [36,37]. The higher the methane content in the biogas (approximately 70% or more), the better the quality would be [38].
In this study, the methane content peak of each co-digestion reactor reached greater than 60%, among which the highest was R1 (73.29%, on the 7th day), followed by R10 (73.26%, on the 5th day). It was obvious that the peak time of methane production in AcoD groups was obviously shorter than that in R1. This was possibly due to the co-AD stimulating the growth of methanogen microorganisms.
Recently, some articles have reported a higher methane content in biogas with the optimization of the AcoD using various types of organic solid wastes. For example, Mu’s et al. [39] studied the methane yield of the AcoD of yard waste (YW), FW, and sewage sludge (SS), and they found that the optimum mixing ratio was 3:9:4 based on the VS with a methane content 64.4 ± 1.7%. Tasnim et al. [40] tried to stimulate methane generation using dairy manure, FW, and water hyacinth, and this resulted in a 65% methane content. Thus, it is significant to optimize the AcoD process based on the type of organic waste as well as the characteristics. When biogas is generated by blending with FW, SL, and CD, a ratio of at least the 50% FW, and a maximum of 85%, is recommended. The biogas that was yielded by blending FW and SL with CD illustrated the possibility of biogas production using these materials during AcoD. This is demonstrated by the higher methane content compared to other feedstocks.

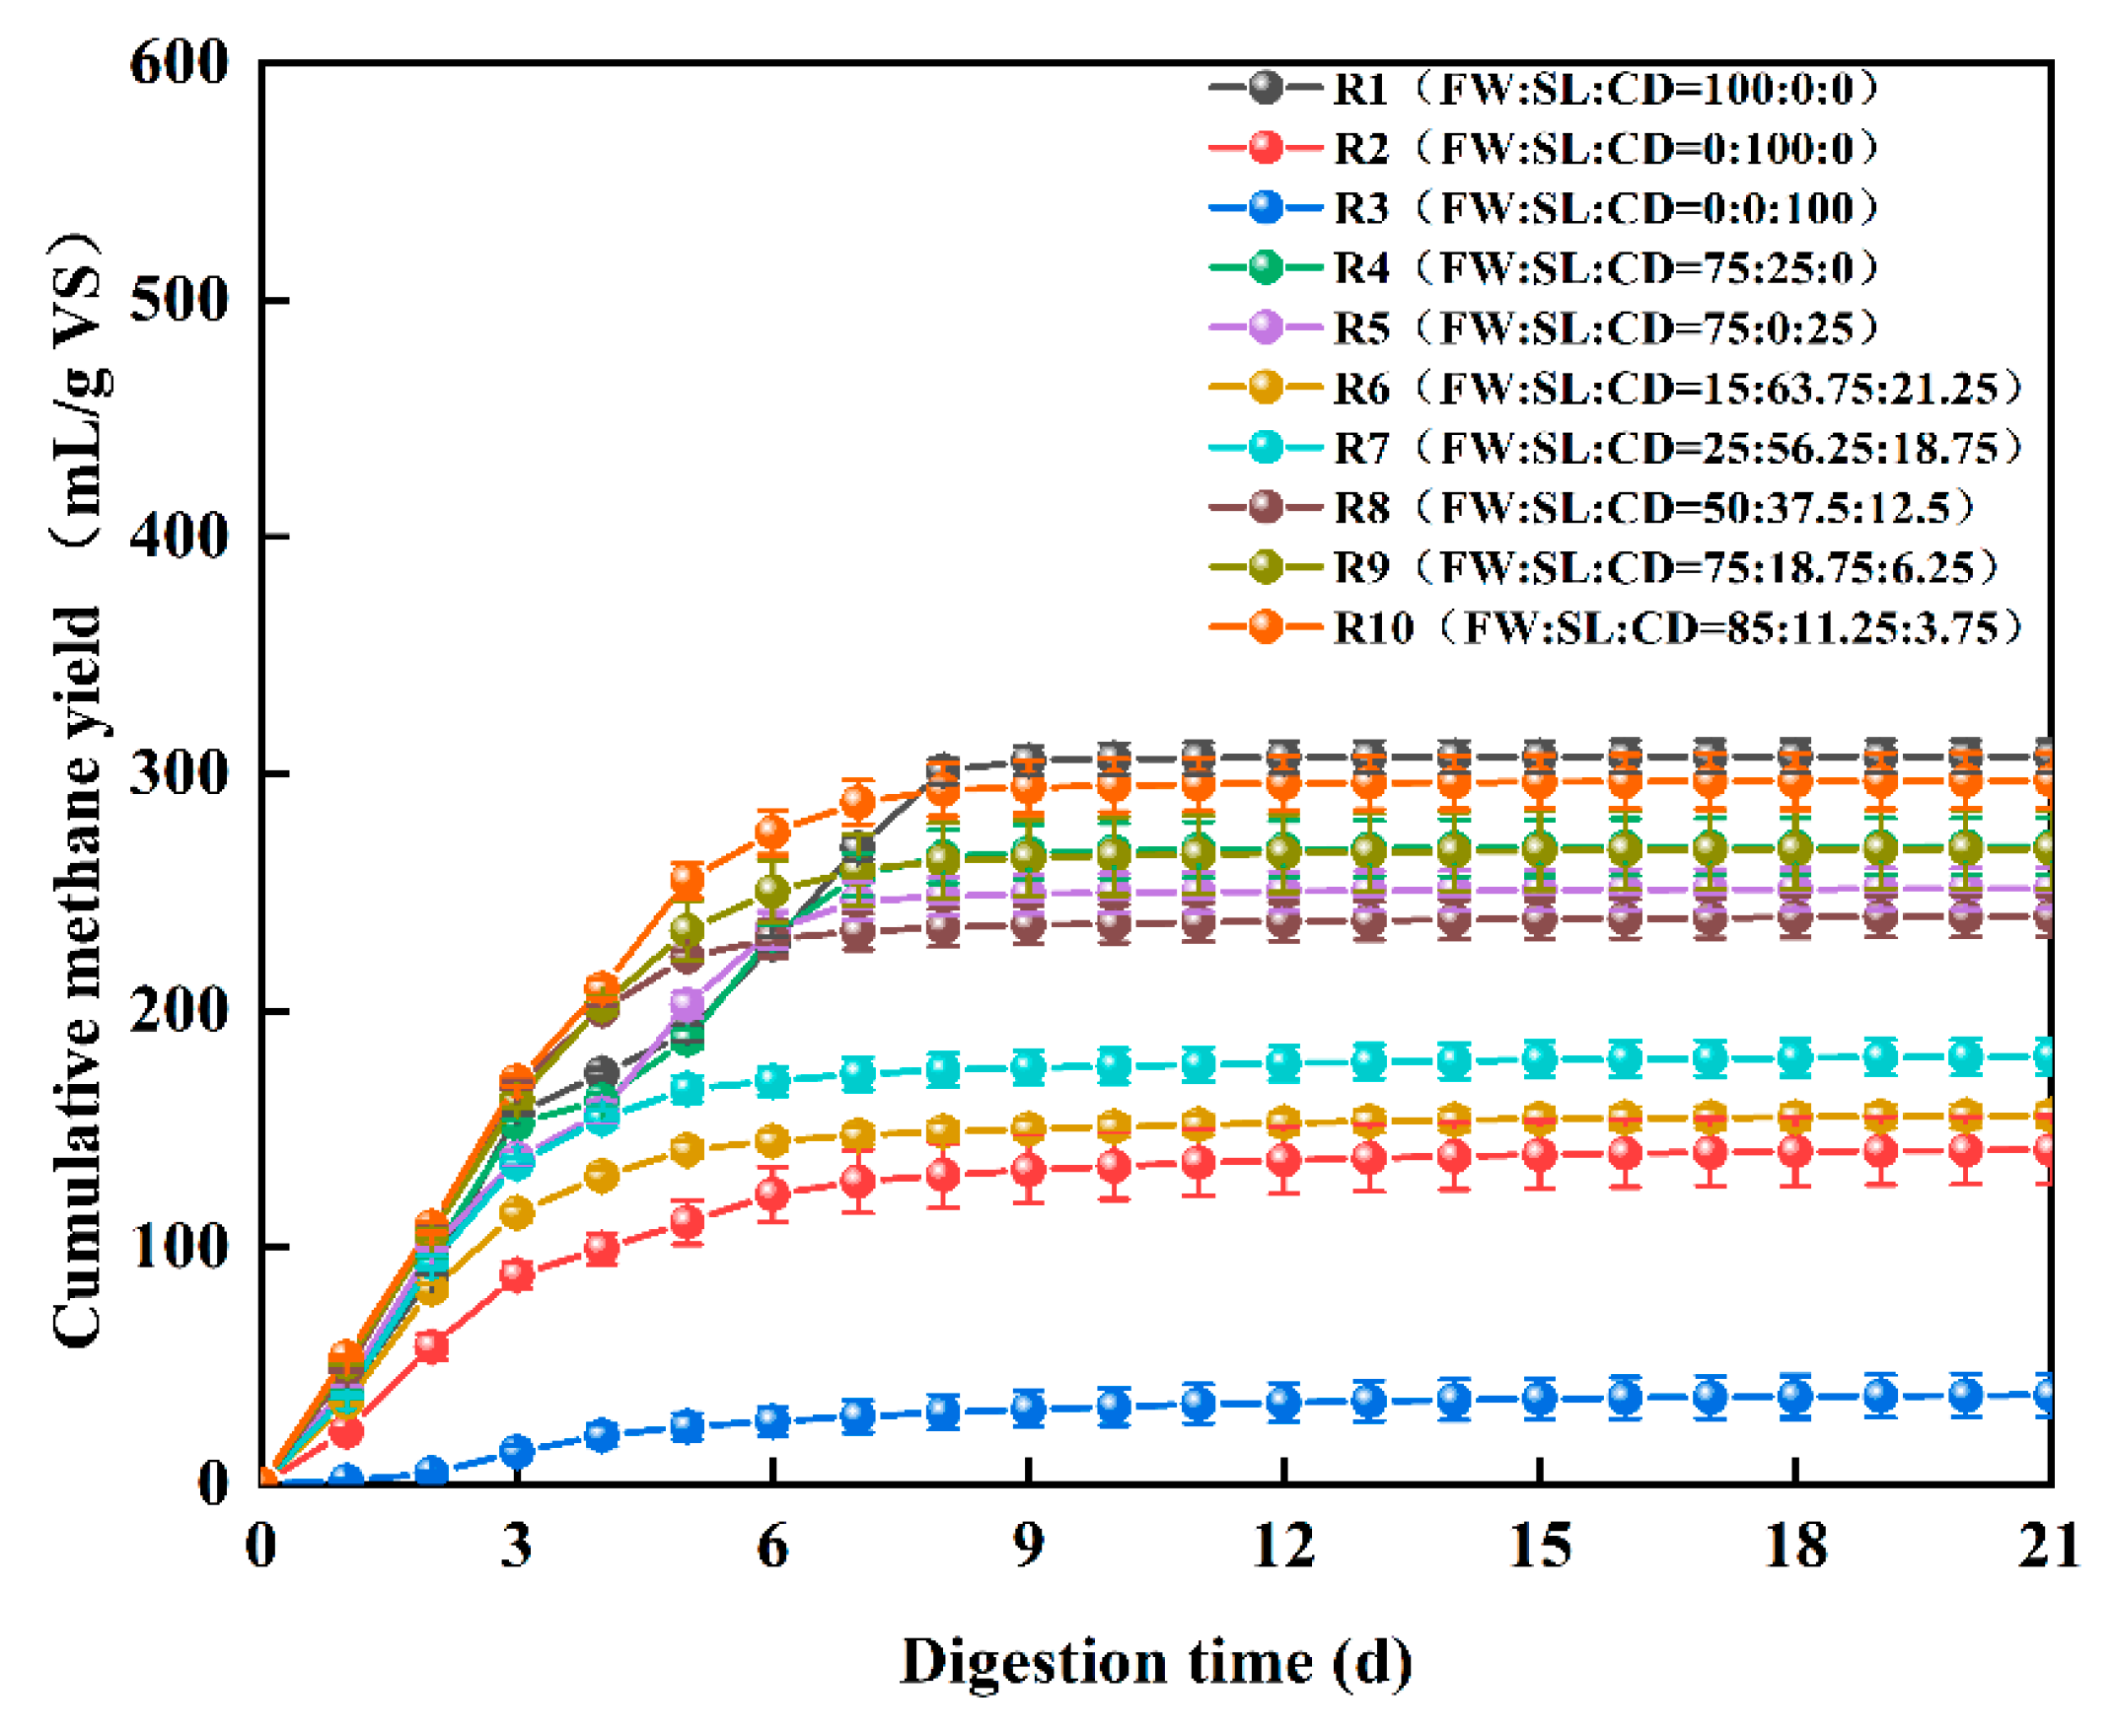
3.2.3. Cumulative Methane Yield

The CMYs obtained by AD reactors with different FW, SL, and CD mixing ratios are displayed in Figure 3. After 21 days of AcoD, with the degradation and utilization of the substrate, the CMY of the FW digested alone, two feedstocks and three substrate groups reached a stable stage and no obvious addition was later detected.
During the first five days, the CMYs in R5 (202.46 mL/g VS), R8 (222.67 mL/g VS), R9 (233.79 mL/g VS), and R10 (255.12 mL/g VS) were higher than that of the mono-digestion of FW (190.51 mL/g VS). Even in the first six days, the CMY rate of R9 (250.35 mL/g VS) and R10 (275.20 mL/g VS) remained higher than that of R1 (228.04 mL/g VS). The technical digestion time to reach the maximum CMY (T80) was usually applied to describe the methane yield efficiency in AD. T80 for the AcoD group were on days 3rd-5th, which were 2-4 days earlier than that in the mono-AD groups. At the end of the experiment, the order of CMY in each group were R1 (307.36 mL/g VS), R10 (297.16 mL/g VS), R4 (269.44 mL/g VS), R9 (268.27 mL/g VS), R5 (251.53 mL/g VS), R8 (239.89 mL/g VS), R7 (180.63 mL/g VS), R6 (155.65 mL/g VS), R2 (141.20 mL/g VS), R3 (37.74 mL/g VS).
The highest CMY was the mono-AD of FW, which was 307.36 mL/g VS. This was possibly because this group contained greater amounts of higher lipid contents, soluble proteins, and soluble carbohydrates. However, the lowest was the R3 (37.74 mL/g VS), and this was probably because CD contains low soluble carbohydrates and lipids. In the co-digestion series, regarding the AcoD that utilized two substrates, the CMY of the FW with SL and the FW with CD were 269.44 mL/g VS and 251.53 mL/g VS, respectively. In comparison, for the AcoD of three feedstocks, the CMY of the five groups were 155.65, 180.63, 239.89, 268.27, and 297.16 mL/g VS. Hence, the higher the blending ratio of the FW, the higher the CMY.
It was interesting to note that when adding the same proportion of FW, the CMY displayed a significant difference, like the findings in the literature [2,29]. First, the CMY of SL AcoD with FW was greater than the CD AcoD with FW. This could be because CD had lower amounts of soluble carbohydrates and lipids. Previous research found that lipids play an important role in CMY, and this was attributed to the products of lipid hydrolysis being fatty acids that are readily available for anaerobic microorganisms. Second, the AcoD of the three feedstocks (R9) was greater than the AcoD of two substrates (R5). This result was most likely due to the addition of SL and CD further regulating the nutrient balance of the AD system and stimulating the growth of microorganisms, thus promoting the production of methane [39,41]. In summary, the supplementation of FW to the AcoD process can significantly boost the methanogenic potential of an AD system. However, it is worthy to note that this type of promotion was primarily attributable to the higher methane yield potential of the FW than the SL and CD.

3.3. Stability of Process and Degradability of Substrates

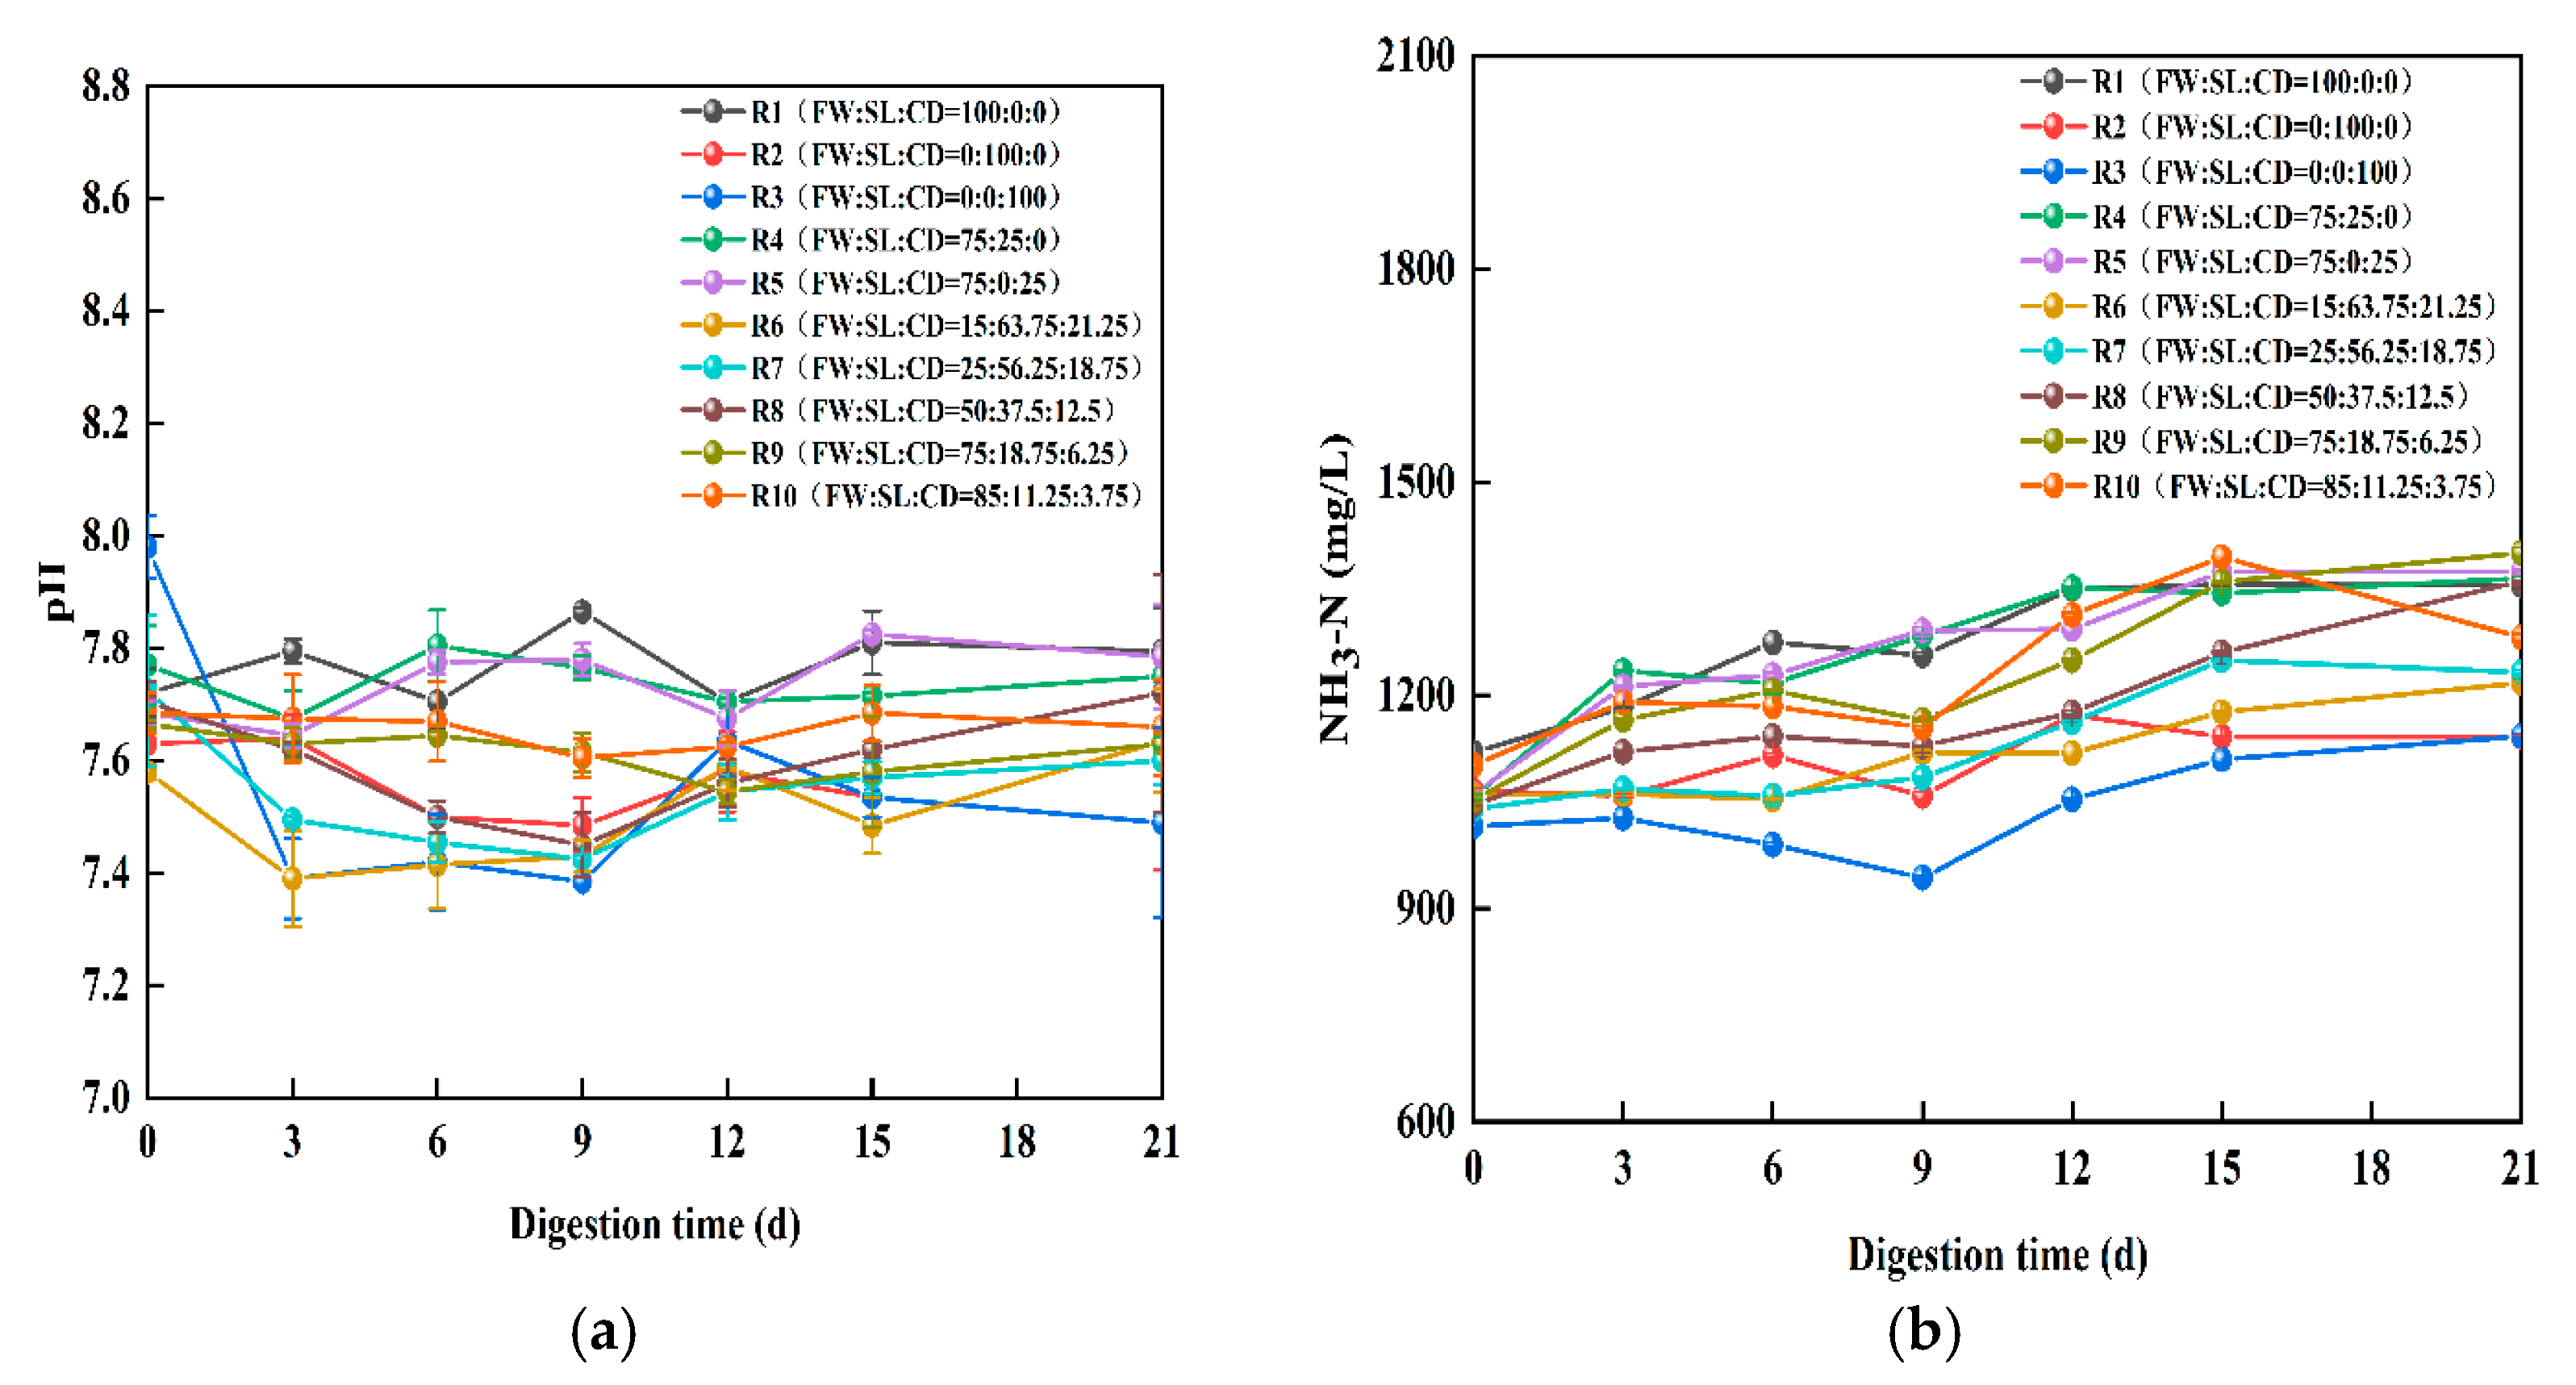
3.3.1. Variation of pH and Ammonia Nitrogen of the AD Process

PH is considered an important indicator to evaluate the AD process [42,43]. The sampling times were 0, 3, 6, 9, 15, and 21 days. Figure 4 shows the changes in the pH and ammonia nitrogen with respect to different mixing ratios. Overall, as shown in Figure 4, the initial pH values of the ten groups were all near 7.71 ± 0.10. During the whole AD process, the pH of each experiment group was between 7.39 and 7.81. In this study, the pH values of each group were maintained in the neutral range of 6.5–7.8, and there was no system instability [44].
An appropriate ammonia concentration can alleviate the acidification of the system, while excessive ammonia will inhibit methane’s activity and system stability. Figure 4b displays the diversification of the ammonia nitrogen concentration in each test group. In general, the ammonia nitrogen content displayed a gradual upward trend. It has been reported that high ammonia concentration (ranges from 1700 mg/L–14000 mg/L) might inhibit methane production and even lead to failure of the AD process, which depends on the type of substrates and inoculum [45]. In this work, the concentrations of ammonia nitrogen for all batch tests were lower than 1500 mg/L. Thus, the ammonia nitrogen levels were too low to inhibit methane yield in this study.

3.3.2. Anaerobic Degradability and Removal of Organic Matter

The TMY and biodegradability of the different feedstocks were calculated using Table 2 and Equations (1), (2), and (3). The TMY of R4 (520.61 mL/g VS), R5 (520.58 mL/g VS), R9 (520.60 mL/g VS) and, R10 (520.50 mL/g VS) were similar, and the experimental results were quite different, and this was discussed in Section 3.1. The highest biodegradability of R10 (57.60%) was followed by R1 (55.85%), R9 (51.94%), R4 (50.30%), R8 (46.85%), R5 (45.71%), R7 (36.34%), R6 (32.66%), R2 (32.14%) and R3 (11.69%). This result implied that the higher the FW proportion, the higher the biodegradability. However, the biodegradability result reflected that the SL and CD had lower biodegradability, which could be because they contained higher lignocellulose contents. The anaerobic digestion biodegradability (ABD) was consistent with the CMY, namely, the higher methane yield was, the higher the biodegradability was. Similar results were obtained in a previous study [35].
The removal of VS and SCOD were important indicators of the amount of degraded organic matter during the AD process [46]. As a rule, like biodegradability, a higher VS and SCOD reduction efficiency means a more complete biodegradation of co-feedstocks. Furthermore, higher VS and SCOD removal cause a higher methane production and lower organic content of the digestates [47]. As can be seen from the results listed in Table 3, the removal rate of VS and COD was roughly the same as the trend of biodegradability.
The highest VS and SCOD removal of 44.35 and 55.38%, respectively, were gained from R10. In general, the higher the proportion of FW, the higher the removal rate of VS and SCOD. These results can be attributed to the higher biodegradable component of the raw materials and the co-digestion that promoted the degradation of the substrate [48]. It is worth noting that the VS and SCOD removal rates of the experimental group digested using cow manure alone were the lowest (28.89 and 13.71%). This result may have been attributed to the fact that the CD after solid–liquid separation contained a lower amount of soluble organic matter and a higher amount of difficult-to-degrade lignocellulose.

3.4. Analysis of the Kinetics

In this study, the modified Gompertz model was applied to match the methanogenic results. Kinetic parameters have often been used to assess and forecast the AD degradation characteristics of all types of organic feedstocks. By imitating the methane yield in Figure 3, the key indicators reflecting the AD process, such as lag time, the maximum methane production rate (Table 4) and the methane yield potential, can be calculated [49]. It is worthy to note that the laboratory results matched well (R2 = 0.9855–0.9990) with the Modified Gompertz model, as shown in Table 4. In addition, the predicted maximum CMY potentials all showed an enhancement with the added proportion of FW in the substrates. It was in line with the variation of the calculated maximum methane yield potentials identified using the laboratory values.
The maximum methane yield rate (Rm) was 67.98 mL/g-VS/day (R5), which increased by 1.38-, 2.38- and 12.09-fold compared with the FW, SL and CD mono-AD, respectively. λ represented the lag-phase time for the AD system, and presented the lowest value (0.13 days) at SL mono-digestion, which indicated the fastest starting of the AD process compared to other groups. Therefore, through kinetic analysis, it can be concluded that the AcoD of FW, SL and CD improved maximum methane yield potential while the addition of FW proportion exceeded 25%.

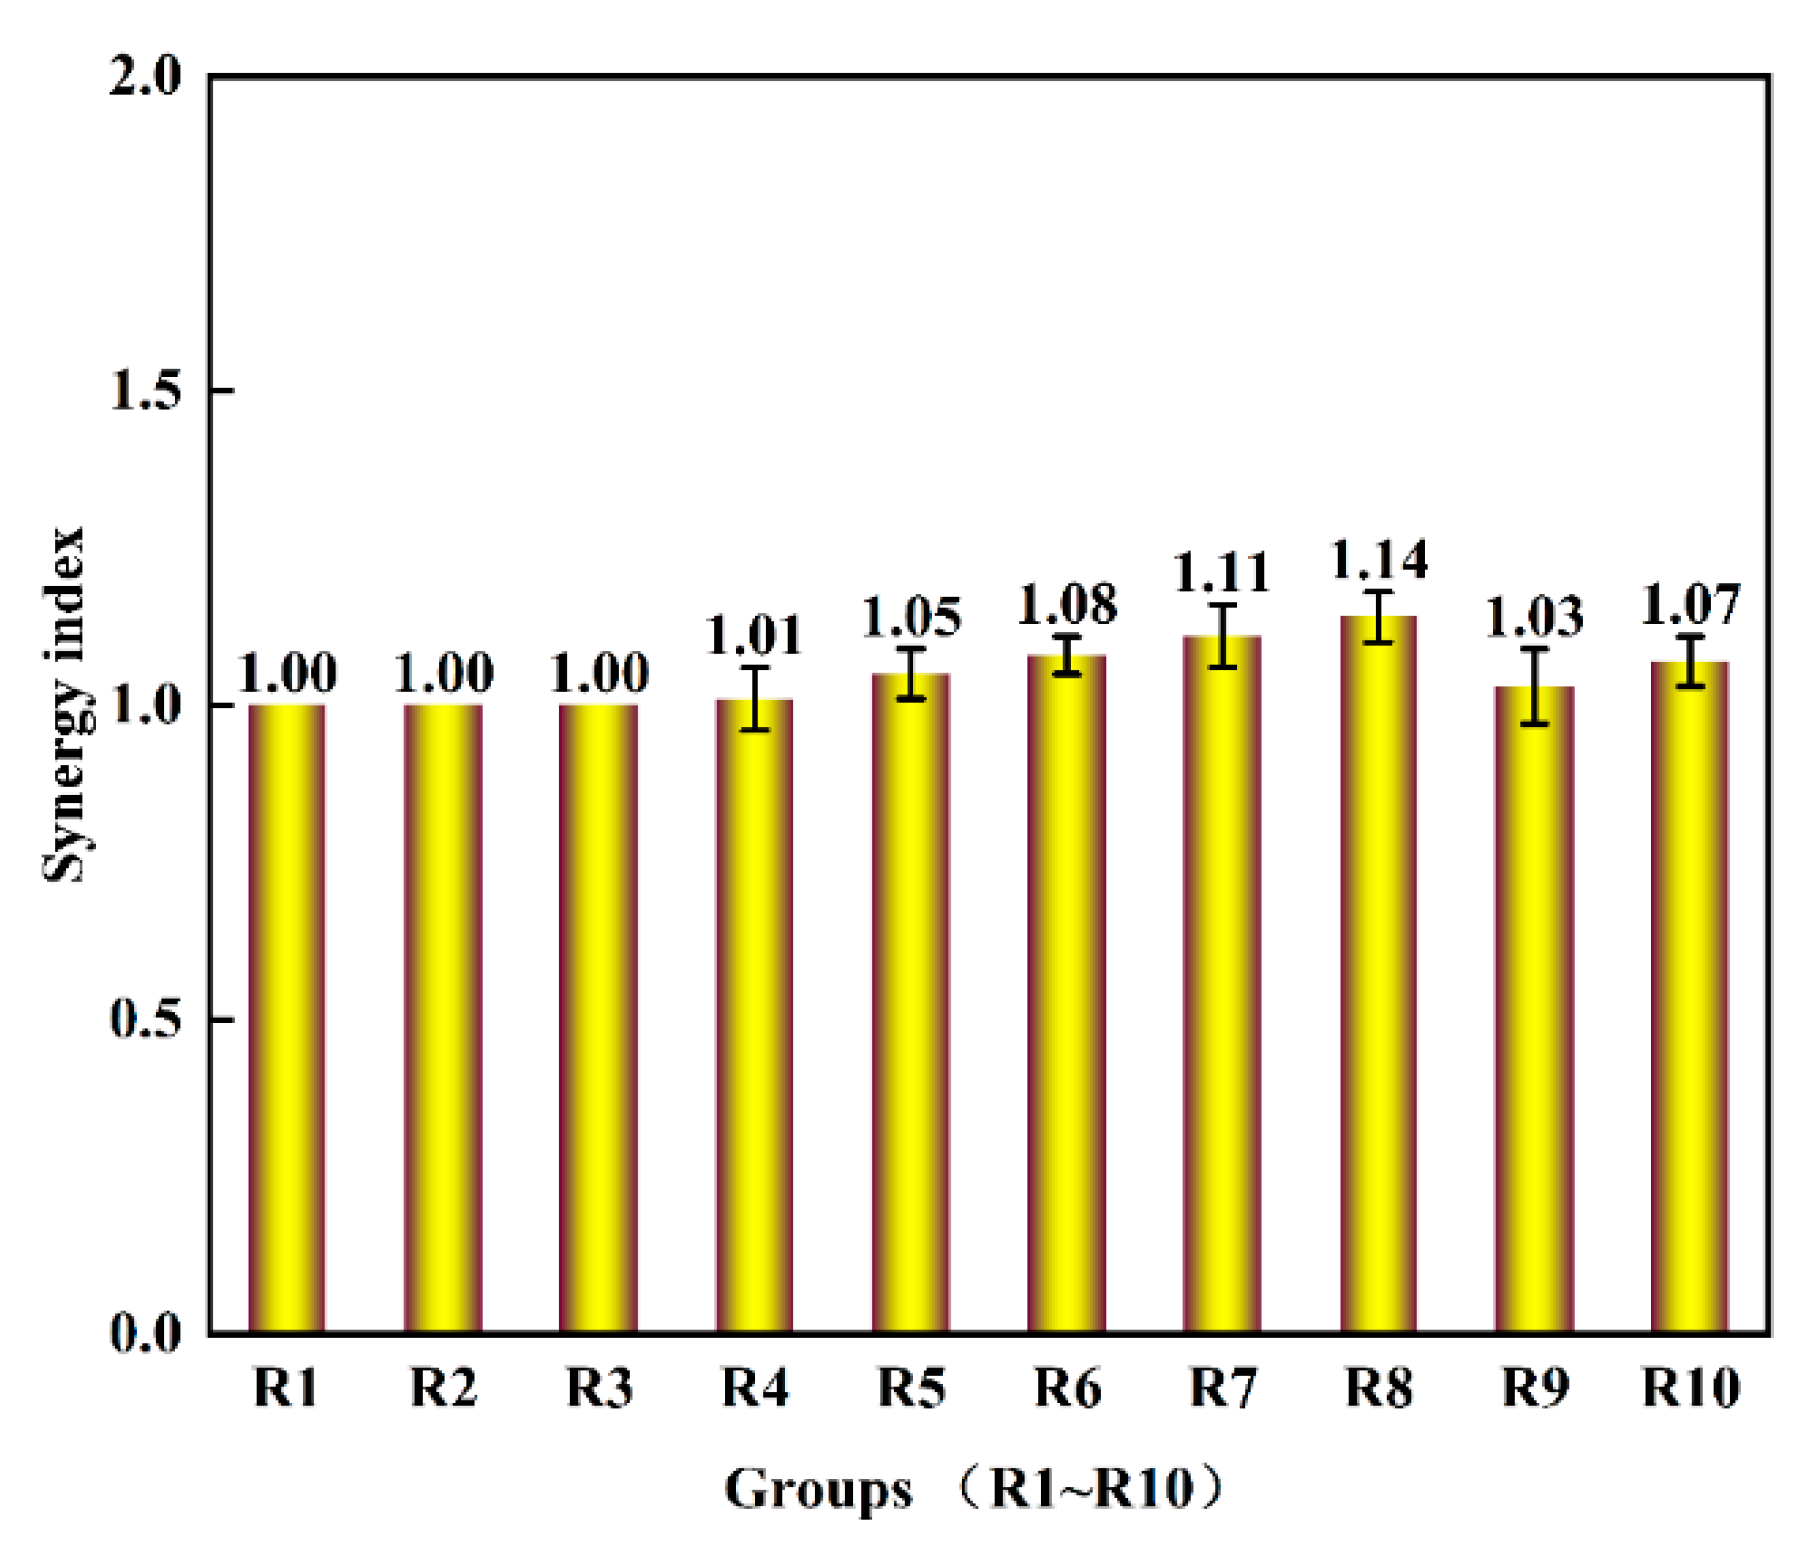
3.5. Synergy Impact of Anaerobic Co-Digestion

The synergistic effect of methane production was calculated using Equations (5) and (6). The SI values of the mono-digestion of FW, SL, and CD were assumed to be one.
As shown in Figure 5, the synergy index of co-digestion of the two raw materials was between 1.01 and 1.05 (p > 0.05), indicating that there were neither synergistic effects nor antagonistic effects. In contrast, the SI values of the three substrates of the AcoD of FW, SL, and CD were between 1.03 and 1.14 (from R6 to R10), the highest SI values were in R8 (1.14) (p < 0.05), indicating that there were significant positive synergistic effects in group R8. However, R6 (1.08), R7 (1.11), R9 (1.03) and R10 (1.07) (p > 0.05), implied that there were neither synergistic effects nor antagonistic effects. However, previous studies have reported that the co-digestion of cattle and pig slurries with grass silage in vitro had antagonistic effects [50]. Zhao [51] performed AcoD of oat straw and CD and found that there were both synergistic and inhibitory effects. The three substrates applied in this study had coordinated effects. Thus, the synergistic effects may be related to the types of feedstocks and the mixing ratio of two or more substrates.
These results further indicated that the addition of SL and CD in an appropriate proportion increased the methane yield during the digestion of FW. This effect can be attributed to the regulation of the nutrient balance, enhancement of the buffering capacity, and dilution of the toxic elements in the AD process [2], thus facilitating the methane production. In addition, the addition of FW promoted the hydrolysis activity, enhanced the degradation of difficult-to-use organic matter, and facilitated the organic component conversion to methane. This consequence showed that the AcoD of FW and SL with CD can be an effective method to generate renewable energy by using plentiful organic solid wastes.

3.6. Significance of This Work

Until now, co-digestion has been the conventional, easy to operate and low-cost technology for methane yield from organic wastes. A low degradation rate was due to properties of raw materials that had higher lignocellulose and inorganic composition contents. However, this study demonstrated that the nutrient balance of the AD system was regulated by three types of raw materials that improved the anaerobic biodegradability of FW, SL, and CD. This research suggested that, compared with the AD of SL and CD mono-digestion, the addition of FW can enhance the CMY potential and produce better biodegradation of lignocellulosic components in the AD reactor. Future work to improve the methane production should consider pretreatment of the feedstocks, the addition of biochar, and the optimization of operating conditions in the continuous stirred-tank reactor.

4. Conclusions

In this study, the AcoD of FW, SL, and CD was shown to be a promising method for the sustainable management of organic solid wastes, compared to mono-digestion and two-raw-material co-digestion. Based on the observed CMY data from the batch tests, the addition of FW improves the CMY potential, and the CMY increases with the proportion of FW (from 155.65 to 297.16 mL/g VS). In addition, the addition of FW had better biodegradation and SCOD removal compared with SL and CD mono-AD. The modified Gompertz models could simulate the AcoD process of FW, SL and CD well. In general, this finding suggests that AcoD of FW, SL and CD can provide a feasible basis for the management of municipal, crop and breeding industry organic wastes, and contribute to clean energy production.

Author Contributions

Conceptualization, S.X., G.B. and Q.Y.; Methodology, S.X., G.B. and D.L.; Software, G.B. and H.Y.; Investigation, S.X. and X.L.; Data curation, S.X. and X.L.; Writing—original draft preparation, S.X., G.B. and Q.Y.; Writing—review and editing, G.B., Q.Y. and J.X.; funding acquisition, G.B., Q.Y., J.X. and Y.C. All authors have read and agreed to the published version of the manuscript.

Funding

This research was funded by Key-Area Research and Development Program of Guangdong Province (2019B110209003), the National Natural Science Foundation of China (51876206), and the National Key Research and Development Program of China (2021YFC2101605, 2019YFB1503805, and 2019YFB1503802).

Institutional Review Board Statement

Not applicable.

Informed Consent Statement

Not applicable.

Data Availability Statement

Not applicable.

Conflicts of Interest

The authors declare no conflict of interest.

References

  1. Shewa, W.A.; Hussain, A.; Chandra, R.; Lee, J.; Saha, S.; Lee, H.S. Valorization of food waste and economical treatment: Effect of inoculation methods. J. Clean. Prod. 2020, 261, 121170. [Google Scholar] [CrossRef]
  2. Hou, T.; Zhao, J.; Lei, Z.; Shimizu, K.; Zhang, Z. Synergistic effects of rice straw and rice bran on enhanced methane production and process stability of anaerobic digestion of food waste. Bioresour. Technol. 2020, 314, 123775. [Google Scholar] [CrossRef] [PubMed]
  3. Ma, Y.; Liu, Y. Turning food waste to energy and resources towards a great environmental and economic sustainability: An innovative integrated biological approach. Biotechnol. Adv. 2019, 37, 107414. [Google Scholar] [CrossRef] [PubMed]
  4. Nghiem, L.D.; Koch, K.; Bolzonella, D.; Drewes, J.E. Full scale co-digestion of wastewater sludge and food waste: Bottlenecks and possibilities. Renew. Sustain. Energy Rev. 2017, 72, 354–362. [Google Scholar] [CrossRef]
  5. Hagos, K.; Zong, J.P.; Li, D.X.; Liu, C.; Lu, X.H. Anaerobic co-digestion process for biogas production: Progress, challenges and perspectives. Renew. Sustai. Energy Rev. 2017, 76, 1485–1496. [Google Scholar] [CrossRef]
  6. Moretti, M.; Van Dael, M.; Malina, R.; Van Passel, S. Environmental assessment of waste feedstock mono-dimensional and bio-refinery systems: Combining manure co-digestion and municipal waste anaerobic digestion. J. Clean. Prod. 2018, 171, 954–961. [Google Scholar] [CrossRef]
  7. Yuan, T.G.; Shi, X.Y.; Sun, R.; Ko, J.H.; Xu, Q.Y. Simultaneous addition of biochar and zero-valent iron to improve food waste anaerobic digestion. J. Clean. Prod. 2021, 278, 123627. [Google Scholar] [CrossRef]
  8. Ren, Y.; Yu, M.; Wu, C.; Wang, Q.; Gao, M.; Huang, Q.; Liu, Y. A comprehensive review on food waste anaerobic digestion: Research updates and tendencies. Bioresour. Technol. 2018, 247, 1069–1076. [Google Scholar] [CrossRef]
  9. Wen, Z.; Wang, Y.; De Clercq, D. What is the true value of food waste? A case study of technology integration in urban food waste treatment in Suzhou City, China. J. Clean. Prod. 2016, 118, 88–96. [Google Scholar] [CrossRef]
  10. Ye, M.; Liu, J.Y.; Ma, C.N.; Li, Y.Y.; Zou, L.P.; Qian, G.R.; Xu, Z.P. Improving the stability and efficiency of anaerobic digestion of food waste using additives: A critical review. J. Clean. Prod. 2018, 192, 316–326. [Google Scholar] [CrossRef]
  11. Zhang, W.; Chen, B.; Li, A.; Zhang, L.; Li, R.; Yang, T.; Xing, W. Mechanism of process imbalance of long-term anaerobic digestion of food waste and role of trace elements in maintaining anaerobic process stability. Bioresour. Technol. 2019, 275, 172–182. [Google Scholar] [CrossRef] [PubMed]
  12. Baldi, F.; Pecorini, I.; Lannelli, R. Comparison of single-stage and two-stage anaerobic co-digestion of food waste and activated sludge for hydrogen and methane production. Renew. Energy 2019, 143, 1755–1765. [Google Scholar] [CrossRef]
  13. Kainthola, J.; Kalamdhad, A.S.; Goud, V.V. Optimization of methane production during anaerobic co-digestion of rice straw and hydrilla verticillata using response surface methodology. Fuel 2019, 235, 92–99. [Google Scholar] [CrossRef]
  14. Kim, J.; Kim, H.; Baek, G.; Lee, C. Anaerobic co-digestion of spent coffee grounds with different waste feedstocks for biogas production. Waste Manag. 2017, 60, 322–328. [Google Scholar] [CrossRef]
  15. Montoro, S.B.; Lucas, J.; Santos, D.F.L.; Costa, M.S.S.M. Anaerobic co-digestion of sweet potato and dairy cattle manure: A technical and economic evaluation for energy and biofertilizer production. J. Clean. Prod. 2019, 226, 1082–1091. [Google Scholar] [CrossRef]
  16. Wu, Y.Q.; Song, K. Anaerobic co-digestion of waste activated sludge and fish waste: Methane production performance and mechanism analysis. J. Clean. Prod. 2021, 279. [Google Scholar] [CrossRef]
  17. Gao, M.; Yang, M.; Ma, X.; Xie, D.; Wu, C.; Wang, Q. Effect of co-digestion of tylosin fermentation dreg and food waste on anaerobic digestion performance. Bioresour. Technol. 2021, 325, 124693. [Google Scholar] [CrossRef]
  18. Cheng, J.H.; Zhu, C.; Zhu, J.; Jing, X.; Kong, F.; Zhang, C.Y. Effects of waste rusted iron shavings on enhancing anaerobic digestion of food wastes and municipal sludge. J. Clean. Prod. 2020, 242, 118195. [Google Scholar] [CrossRef]
  19. Helenas Perin, J.K.; Biesdorf Borth, P.L.; Torrecilhas, A.R.; Santana da Cunha, L.; Kuroda, E.K.; Fernandes, F. Optimization of methane production parameters during anaerobic co-digestion of food waste and garden waste. J. Clean. Prod. 2020, 272, 123130. [Google Scholar] [CrossRef]
  20. Zhang, H.Q.; Luo, L.N.; Li, W.Z.; Wang, X.Y.; Sun, Y.; Sun, Y.M.; Gong, W.J. Optimization of mixing ratio of ammoniated rice straw and food waste co-digestion and impact of trace element supplementation on biogas production. J. Mater. Cycles Waste 2018, 20, 745–753. [Google Scholar] [CrossRef]
  21. Awasthi, S.K.; Joshi, R.; Dhar, H.; Verma, S.; Awasthi, M.K.; Varjani, S.; Sarsaiya, S.; Zhang, Z.; Kumar, S. Improving methane yield and quality via co-digestion of cow dung mixed with food waste. Bioresour. Technol. 2018, 251, 259–263. [Google Scholar] [CrossRef]
  22. Grosser, A.; Grobelak, A.; Rorat, A.; Courtois, P.; Vandenbulcke, F.; Lemiere, S.; Guyoneaud, R.; Attard, E.; Celary, P. Effects of silver nanoparticles on performance of anaerobic digestion of sewage sludge and associated microbial communities. Renew. Energy 2021, 171, 1014–1025. [Google Scholar] [CrossRef]
  23. Li, P.C.; Liu, Z.Y.; Zhao, M.X.; Dai, X.H.; Ruan, W.Q. Evaluation of Biogas Performance and Process Stability from Food, Kitchen, and Fruit/Vegetable Waste by Mono-, Co-, and Tridigestion. Energy Fuel 2020, 34, 12734–12742. [Google Scholar] [CrossRef]
  24. Ma, X.X.; Yu, M.; Yang, M.; Gao, M.; Wu, C.F.; Wang, Q.H. Synergistic effect from anaerobic co-digestion of food waste and Sophora flavescens residues at different co-substrate ratios. Environ. Sci. Pollut. R 2019, 26, 37114–37124. [Google Scholar] [CrossRef]
  25. APHA. Standard Methods for the Examination of Water and Wastewater, 21st ed.; American Public Health Association: Washington, DC, USA, 2005. [Google Scholar]
  26. Frølund, B.; Palmgren, R.; Keiding, K.; Nielsen, P.H. Extraction of extracellular polymers from activated sludge using a cation exchange resin. Water Res. 1996, 30, 1749–1758. [Google Scholar] [CrossRef]
  27. DuBois, M.; Gilles, K.A.; Hamilton, J.K.; Rebers, P.A.; Smith, F. Colorimetric Method for Determination of Sugars and Related Substances. Anal. Chem. 2002, 28, 350–356. [Google Scholar] [CrossRef]
  28. Prabhu, A.V.; Raja, S.A.; Avinash, A.; Pugazhendhi, A. Parametric optimization of biogas potential in anaerobic co-digestion of biomass wastes. Fuel 2021, 288. [Google Scholar] [CrossRef]
  29. Kim, J.; Kim, J.; Lee, C. Anaerobic co-digestion of food waste, human feces, and toilet paper: Methane potential and synergistic effect. Fuel 2019, 248, 189–195. [Google Scholar] [CrossRef]
  30. Kafle, G.K.; Kim, S.H.; Sung, K.I. Ensiling of fish industry waste for biogas production: A lab scale evaluation of biochemical methane potential (BMP) and kinetics. Bioresour. Technol. 2013, 127, 326–336. [Google Scholar] [CrossRef] [PubMed]
  31. Gaballah, E.S.; Abomohra, A.F.; Xu, C.; Elsayed, M.; Abdelkader, T.K.; Lin, J.C.; Yuan, Q.X. Enhancement of biogas production from rape straw using different co-pretreatment techniques and anaerobic co-digestion with cattle manure. Bioresour. Technol. 2020, 309, 123311. [Google Scholar] [CrossRef]
  32. Forster-Carneiro, T.; Perez, M.; Romero, L.I. Anaerobic digestion of municipal solid wastes: Dry thermophilic performance. Bioresour. Technol. 2008, 99, 8180–8184. [Google Scholar] [CrossRef] [PubMed]
  33. Carotenuto, C.; Guarino, G.; D’Amelia, L.I.; Morrone, B.; Minale, M. The peculiar role of C/N and initial pH in anaerobic digestion of lactating and non-lactating water buffalo manure. Waste Manag. 2020, 103, 12–21. [Google Scholar] [CrossRef] [PubMed]
  34. Zhen, G.Y.; Lu, X.Q.; Kobayashi, T.; Kumar, G.; Xu, K.Q. Anaerobic co-digestion on improving methane production from mixed microalgae (Scenedesmus sp., Chlorella sp.) and food waste: Kinetic modeling and synergistic impact evaluation. Chem. Eng. J. 2016, 299, 332–341. [Google Scholar] [CrossRef]
  35. Gu, J.; Liu, R.; Cheng, Y.; Stanisavljevic, N.; Li, L.; Djatkov, D.; Peng, X.; Wang, X. Anaerobic co-digestion of food waste and sewage sludge under mesophilic and thermophilic conditions: Focusing on synergistic effects on methane production. Bioresour. Technol. 2020, 301, 122765. [Google Scholar] [CrossRef]
  36. Hashemi, B.; Sarker, S.; Lamb, J.J.; Lien, K.M. Yield improvements in anaerobic digestion of lignocellulosic feedstocks. J. Clean. Prod. 2021, 288, 125447. [Google Scholar] [CrossRef]
  37. Herout, M.; Malaťák, J.; Kučera, L.; Dlabaja, T. Biogas composition depending on the type of plant biomass used. Res. Agric. Eng. 2011, 57, 137–143. [Google Scholar] [CrossRef]
  38. Lyytimaki, J. Renewable energy in the news: Environmental, economic, policy and technology discussion of biogas. Sustain. Prod. Consump. 2018, 15, 65–73. [Google Scholar] [CrossRef]
  39. Mu, L.; Zhang, L.; Zhu, K.; Ma, J.; Ifran, M.; Li, A. Anaerobic co-digestion of sewage sludge, food waste and yard waste: Synergistic enhancement on process stability and biogas production. Sci. Total Environ. 2020, 704, 135429. [Google Scholar] [CrossRef]
  40. Tasnim, F.; Iqbal, S.A.; Chowdhury, A.R. Biogas production from anaerobic co-digestion of cow manure with kitchen waste and Water Hyacinth. Renew. Energy 2017, 109, 434–439. [Google Scholar] [CrossRef]
  41. Dima, A.D.; Parvulescu, O.C.; Mateescu, C.; Dobre, T. Optimization of substrate composition in anaerobic co -digestion of agricultural waste using central composite design. Biomass Bioenerg. 2020, 138, 105602. [Google Scholar] [CrossRef]
  42. Ma, X.; Yu, M.; Song, N.; Xu, B.; Gao, M.; Wu, C.; Wang, Q. Effect of ethanol pre-fermentation on organic load rate and stability of semi-continuous anaerobic digestion of food waste. Bioresour. Technol. 2020, 299, 122587. [Google Scholar] [CrossRef] [PubMed]
  43. Taboada-Santos, A.; Braz, G.H.R.; Fernandez-Gonzalez, N.; Carballa, M.; Lema, J.M. Thermal hydrolysis of sewage sludge partially removes organic micropollutants but does not enhance their anaerobic biotransformation. Sci. Total Environ. 2019, 690, 534–542. [Google Scholar] [CrossRef] [PubMed]
  44. Ward, A.J.; Hobbs, P.J.; Holliman, P.J.; Jones, D.L. Optimisation of the anaerobic digestion of agricultural resources. Bioresour. Technol. 2008, 99, 7928–7940. [Google Scholar] [CrossRef] [PubMed]
  45. Rajagopal, R.; Masse, D.I.; Singh, G. A critical review on inhibition of anaerobic digestion process by excess ammonia. Bioresour. Technol. 2013, 143, 632–641. [Google Scholar] [CrossRef] [PubMed]
  46. Abbas, Y.; Yun, S.N.; Wang, K.J.; Shah, F.A.; Xing, T.; Li, B.J. Static-magnetic-field coupled with fly-ash accelerant: A powerful strategy to significantly enhance the mesophilic anaerobic-co-digestion. Bioresour. Technol. 2021, 327, 124793. [Google Scholar] [CrossRef] [PubMed]
  47. Feng, S.; Hong, X.; Wang, T.; Huang, X.; Tong, Y.; Yang, H. Reutilization of high COD leachate via recirculation strategy for methane production in anaerobic digestion of municipal solid waste: Performance and dynamic of methanogen community. Bioresour. Technol. 2019, 288, 121509. [Google Scholar] [CrossRef]
  48. Wang, Z.; Yun, S.; Xu, H.; Wang, C.; Zhang, Y.; Chen, J.; Jia, B. Mesophilic anaerobic co-digestion of acorn slag waste with dairy manure in a batch digester: Focusing on mixing ratios and bio-based carbon accelerants. Bioresour. Technol. 2019, 286, 121394. [Google Scholar] [CrossRef]
  49. Yu, M.; Wu, C.; Wang, Q.; Sun, X.; Ren, Y.; Li, Y.Y. Ethanol prefermentation of food waste in sequencing batch methane fermentation for improved buffering capacity and microbial community analysis. Bioresour. Technol. 2018, 248, 187–193. [Google Scholar] [CrossRef]
  50. Himanshu, H.; Murphy, J.D.; Grant, J.; O’Kiely, P. Antagonistic effects on biogas and methane output when co-digesting cattle and pig slurries with grass silage in in vitro batch anaerobic digestion. Biomass Bioenerg. 2018, 109, 190–198. [Google Scholar] [CrossRef]
  51. Zhao, Y.; Sun, F.; Yu, J.; Cai, Y.; Luo, X.; Cui, Z.; Hu, Y.; Wang, X. Co-digestion of oat straw and cow manure during anaerobic digestion: Stimulative and inhibitory effects on fermentation. Bioresour. Technol. 2018, 269, 143–152. [Google Scholar] [CrossRef]
Figure 1. Daily methane yield rates of the different feedstock mixing ratios.
Fermentation 08 00399 g001
Figure 2. Methane contents.
Fermentation 08 00399 g002
Figure 3. CMYs of the different feedstock mixing ratios.
Fermentation 08 00399 g003
Figure 4. Variations in stability indicators of AcoD process. (a) (pH); (b) (ammonia nitrogen).
Fermentation 08 00399 g004
Figure 5. Synergetic effects of the different substrate mixing ratios.
Fermentation 08 00399 g005
Table 1. The different mixing ratios and inoculums utilized.
Ratio (FW:SL:CD) aFW (g) bSL (g) bCD (g) bInoculum (g) b
R1 (100:0:0)43.50--408.06
R2 (0:100:0) - 57.36 - 408.06
R3 (0:0:100) - - 55.89 408.06
R4 (75:25:0) 32.62 14.34 - 408.06
R5 (75:0:25) 32.62 - 13.97 408.06
R6 (15:63.75:21.25) 6.52 36.56 11.88 408.06
R7 (25:56.25:18.75) 10.87 32.26 10.48 408.06
R8 (50:37.5:12.5) 21.75 21.51 6.99 408.06
R9 (75:18.75:6.25) 32.62 10.75 3.49 408.06
R10 (85:11.25:3.75)36.976.452.10408.06
a: VS basis; b: wet basis; -: Not determined.
Table 2. Physico-chemical properties of the feedstocks and the inoculum utilized.
ParameterFWSLCDInoculum
pH---7.87 ± 0.01
TS a% 25.84 ± 0.17 21.41 ± 0.22 20.27 ± 0.24 4.41 ± 0.01
VS b% 94.30 ± 0.02 86.34 ± 3.19 93.56 ± 0.67 58.85 ± 2.36
C b%49.27 ± 0.8243.59 ± 0.0544.03 ± 0.02-
H b%6.47 ± 0.206.91 ± 0.016.82 ± 0.01-
O b% 36.04 ± 0.10 41.49 ± 0.08 40.79 ± 0.35 -
N b% 2.75 ± 0.22 1.19 ± 0.10 1.69 ± 0.19 -
S b% 0.24 ± 1.01 0.27 ± 0.05 0.36 ± 0.01 -
C/N ratio 17.89 36.51 26.10 -
Soluble Carbohydrates b% 20.88 ± 0.49 3.69 ± 0.23 0.44 ± 0.03 -
Lipids b% 22.49 ± 0.21 4.58 ± 0.26 2.97 ± 0.10 -
Soluble Proteins b% 16.33 ± 012 5.75 ± 0.05 6.16 ± 0.03 -
pH - - - 7.87 ± 0.01
NH4+-N (mg/L) - - - 1244.33 ± 4.04
SCOD (mg/L)---536 ± 3.46
a: wet basis; b: dry basis; -: Not determined.
Table 3. Anaerobic biodegradability, VS, and SCOD removal in the different reactors.
GroupsTMY (mL/g VS)CMY (mL/g VS)ABD%VS Reduction (%)SCOD Reduction (%)
R1 535.35 307.36 ± 6.78 57.41 ± 1.27 60.96 ± 0.68 63.27 ± 0.72
R2 476.41 141.20 ± 14.36 29.64 ± 3.02 38.27 ± 0.24 37.10 ± 1.39
R3 476.27 37.74 ± 9.11 7.92 ± 1.91 28.89 ± 0.19 13.71 ± 0.15
R4 520.61 269.44 ± 11.96 51.76 ± 2.30 41.01 ± 0.11 42.26 ± 0.09
R5 520.58 251.53 ± 8.64 48.32 ± 1.66 39.79 ± 0.40 40.68 ± 0.51
R6 485.22 155.65 ± 4.81 32.08 ± 0.99 37.06 ± 2.58 43.87 ± 0.35
R7491.12180.63 ± 7.5436.78 ± 1.5436.08 ± 0.7240.90 ± 0.34
R8 505.86 239.89 ± 8.70 47.42 ± 1.72 41.50 ± 0.27 45.37 ± 0.24
R9 520.60 268.27 ± 16.66 51.53 ± 3.20 43.95 ± 0.99 52.65 ± 0.08
R10520.50297.16 ± 11.8856.44 ± 2.2644.35 ± 1.4655.38 ± 0.33
Table 4. Modified Gompertz model parameters obtained by matching the methanogenic data.
ParameterY (mL/g VS) Rm (mL/g-VS/day) λ (day) R2
R1310.99 ± 3.7048.93 ± 3.280.29 ± 0.220.9855
R2 138.18 ± 1.04 28.53 ± 1.52 0.13 ± 0.14 0.9913
R3 36.29 ± 0.45 5.62 ± 0.38 0.78 ± 0.23 0.9872
R4 270.88 ± 2.63 48.92 ± 3.02 0.22 ± 0.18 0.9880
R5 252.64 ± 1.99 50.88 ± 2.77 0.28 ± 0.14 0.9912
R6 152.77 ± 0.92 44.70 ± 1.89 0.23 ± 0.08 0.9955
R7 178.02 ± 0.61 55.24 ± 1.77 0.33 ± 0.06 0.9976
R8 238.43 ± 0.55 67.98 ± 1.38 0.38 ± 0.04 0.9990
R9 267.75 ± 0.76 62.54 ± 1.37 0.32 ± 0.05 0.9987
R10297.67 ± 1.1465.83 ± 1.860.36 ± 0.070.9978
Publisher’s Note: MDPI stays neutral with regard to jurisdictional claims in published maps and institutional affiliations.

