1. Introduction
Anaerobic digestion (AD) is one of the possible processes to convert biomasses and waste biomasses into added-value products such as biogas. AD is a multi-step process in which polysaccharides, proteins, nucleic acids and lipids are primarily fermented to hydrogen, formate, acetate, CO
2 and converted subsequently in methane; the four steps are hydrolysis, acidogenesis, acetogenesis and methanogenesis. The reactions involved in the last two steps of the AD process are thermodynamically linked: the butyrate and propionate degradation reactions are endergonic and are therefore not favorable. To be able to gain energy from the butyrate and propionate degradations, these reactions have to be coupled with thermodynamically favorable methanogenesis; the maximum amount of energy released is equivalent to about one ATP [
1].
Among the four different steps involved in the overall transformation from organic matter to methane, the last step carried out by the strictly anaerobic methanogens is the most sensitive as the methanogens are slow growing and have low resistance against environmental changes and can convert to methane just a few molecules [
2]. Therefore, the most important critical points of the AD process in real-scale digesters are related to the microbial community activity: long start-up time due to the microbial lag phase and the elapsed time to grow back the biomass in case of system failure. Thus, a robust and resilient microbial community rich in functionally diverse taxa is the core of a stable and efficient AD process.
It is known through the literature that different trophic groups of microorganisms cooperate in syntrophy to exploit complex organic matter as a source of carbon and energy. Syntrophy has been defined as an obligate mutualistic metabolism [
3] and syntrophy has been shown to occur in anaerobic digestion processes.
Obligate syntrophic communities consist of microorganisms with metabolisms that are thermodynamically linked and catabolically interdependent [
4]. Syntrophy occurs by the transfer of chemical energy in the form of soluble chemical compounds between two organisms and between anoxic and methanogenic environments. Besides the exchange of diffusible molecules and energy carriers such as hydrogen or formate, microorganisms can transfer electrons in a more direct way, such as via conductive pili [
5].
Different bacteria (named “electroactive”) have evolved strategies to transfer electrons far beyond the cell surface. According to the direction of electron flow, the microorganisms transfer electrons from organic compound (anode) to produce electricity as in Microbial fuel cell (MFC) or use external electron flow to synthesize organic compounds (cathode) as in microbial electrosynthesis (MES). The mode of extracellular electron transfer from the cathode can occur by direct or indirect electron transfer [
6].
Direct interspecies electron transfer (DIET) has been proposed as a syntrophy mechanism; two microbial species exchange electrons via electric currents flowing through conductive solid conduits such as microbial pili, but also conductive material. With this process, different microorganisms in a community are able to share reducing equivalents to drive the methanogenic degradation of organic substrates [
7].
Factors facilitating interspecies electron transfer, such as redox-active compounds and conductive materials, improve the syntrophy between bacteria and methanogenic archaea needed to overcome the thermodynamic limits. Recent studies have suggested that conductive iron oxide minerals can facilitate syntrophic metabolism of the methanogenic degradation of organic matter such as ethanol, propionate and butyrate in natural and engineered microbial ecosystems [
8]. Different conductive carbon materials have been proved able to support and facilitate the DIET process on a lab scale with pure culture microorganisms [
9,
10]. They include graphite particles [
11], granular activated carbon [
12], biochar [
13], and carbon cloth [
14]. Cruz Viggi et al. [
15] tested the addition of microparticulated magnetite (Fe
3O
4) in a real anaerobic digestion process. The authors report having triggered a direct interspecies electron transfer and have proposed a shortcut route of propionate conversion into methane that is faster and less sensitive to external H
2 partial pressure than the “classical” one based on interspecies H
2 transfer. They observed an increased methane formation rate of around 31−33%.
Although recent research focuses on DIET-related microorganisms to accelerate and stabilize the biochemical reactions involved in methane production [
16,
17], there is still the need to relate the effect of the material addition with conductivity values and physical properties as the material characteristics (dimension, surface) may affect the DIET efficiency [
18]. A deeper knowledge on the microbial community dynamics is fundamental to exploiting DIET-associated syntrophy in real-scale application to increase efficiency.
In this paper, we report the finding of 3.5L batch AD process with the addition of conductive materials relating the biogas production with microbial community dynamic.
2. Materials and Methods
2.1. Selection of the Material
Four materials with different conductive properties have been chosen: graphene (Pure G+, Directaplus, Lomazzo, Italy), powdered activated carbon (Norit Nederland B.V., Amersfoort, The Netherlands), biochar (Verora, Edlibach, Switzerland), and zeolite (micro50, Zeocem, Košice, Slovak Republic).
2.2. Microscope Observation
Materials samples were mounted on conductive tape and observed using a scanning electron microscope (SEM, InTouchScope JSM-6010LA, JEOL, Tokyo, Japan) with the filament operating at 10 KeV acceleration voltage and magnification up to 4500×.
2.3. Material Characterization
Particle size for each material was measured on SEM images (n = 8). Surface characteristics were investigated using ImageJ® (NIH, USA) by SurfCharJ plugin, which measures roughness parameters according to ISO4287/2000: Ra (arithmetical mean deviation), Rq (root mean square deviation), Rku (kurtosis), Rsk (skewness), Rv (lowest valley), Rp (highest peak) and Rt (total height). Conductivity values were calculated by measuring the electrical resistance (Ω), then the values were converted into electrical conductivity (σ) by applying the formula (σ) = (A2s3/m3Kg).
2.4. BioMethanePotential Tests
The tests were set in 3.58 L capacity reactors filled with 1170 mL inoculum sampled from digestate from the wastewater treatment plant in Chiasso (Ticino, CH), 20.55 mL of Ethanol 99% (VWR International GmbH, Dietikon, Switzerland) as sole carbon source, and 600 mL of water solution with the conductive material suspended. The digestate sampled for inoculum had a total solid content (TS) of 23.6 g/L with a 60.4% of organic matter measured as VS. The volatile solids ratio between inoculum and feeding was 1:1. The concentrations were chosen as the one giving the best biogas productions in a previous experiment and were as follows: powdered activated carbon 20 g/L, biochar 10 g/L, zeolite 10 g/L and graphene 0.5 g/L. Each sample was mixed for 3–5 min to obtain a homogeneous mixture and was flushed with nitrogen gas for 2 min to assure AD conditions before the batch experiments. All reactors were shaken manually for 1 min each day during AD process. Tests were run in single with a duplicate reactor without conductive material as control. The total duration of the tests was ten days. Pressure and temperature measures were automatically collected every hour with an automatic manometer (Keller Leo2—CH). The pressure values were converted to Liter of biogas in normal conditions (15 °C, 1 bar), applying the ideal gas law PV = nRT.
2.5. Analytical Techniques
The total solids (TS) and volatile solids (VS) content were determined in accordance with APHA Standard Methods (1995).
2.6. Methane Concentration
The methane concentration in the biogas has been measured by IR through the Gas Analyser (Biogas5000 Geotech, Lauper Instruments AG, Murten, Switzerland) and expressed as %.
2.7. Kinetic Analysis of Biogas Production
Biogas production was analyzed using a modified Gompertz equation [
19] which can estimate ultimate biogas volume, maximum biogas production rate, and lag time based on the following equation.
where y(t) is the cumulative biogas production (mLg-1VS) at an anaerobic digestion time t(d),
ym is the biogas production potential (mLg-1VS),
Rm is the maximum biogas production rate (mLg-1VSd-1), and λ is the duration of lag-phase time (d). Kinetic parameters were obtained by nonlinear regression fitting using GraphPad Prism (version 9.00 for Windows, GraphPad Software, La Jolla, CA, USA,
www.graphpad.com accessed on 5 July 2022) and least square regression method, with goodness of fit quantified by R-squared.
2.8. DNA Extraction and Sequencing
At Time 0 and after 72, 120, 288 and 312 h, we collected samples from three reactors: the one used as control, the one with activated carbon and the reactor with graphene. DNA was extracted with DNeasy PowerSoil kit (Qiagen AG, Hombrechtikon, Switzerland) and then was quantified with Qubit 4 (Thermo Fisher Scientific, Reinach BL, Basel, Switzerland). Two different PCR, using Taq PCR Master Mix (Qiagen, AG, Hombrechtikon, CH), were performed for each sample collected. Using universal 16S primer 1492R (5′-ACT TGC CTG TCG CTC TAT CTT CGG TTA CCT TGT TAC GAC TT-3′) and the domain bacteria-specific primer 27F (5′-TTT CTG TTG GTG CTG ATA TTG CAG AGT TTG ATC CTG GCT CAG-3′) the 16S rDNA bacterial subunity was amplified. For the specific amplification of archaeal 16S rDNA, the same 1492R primer and the domain archaea-specific primer 21F (5′- TTT CTG TTG GTG CTG ATA TTG CTC CGG TTG ATC CYG CCG G-3′) were used. Cycling conditions were as follows: first denaturation of 3 min at 95 °C, 35 cycles of denaturation of 30 s at 95 °C, annealing of 1 min at 52 °C (bacteria domain) or 55 °C (archaea domain), elongation of 1 min at 72 °C, and last elongation of 7 min at 72 °C. All the primers were linked to a flag sequence (provided by Oxford Nanopore Technologies, Oxford, UK) to allow the compatibility of the amplificates with the MinION™ kit (SQK-PBK004, Oxford Nanopore, Oxford, UK). The amplicons were purified with CleanNGS kit (Labgene Scientific SA, Châtel-Saint-Denis, Switzerland) and were quantified with Qubit 4 (Thermo Fisher Scientific, Reinach BL, CH); afterwards, bacterial and archaeal amplicons of the same sample were combined and barecoded, as explained in the Nanopore protocol. All barcoded DNA was subjected to a second step of purification and quantification, using the same methods as before, and were combined in equal ratios to generate a pool. According to the manufacturer’s protocol, the pool was quantified and was diluted (if necessary) and the RAP adaptor was added. The pool was prepared for loading using the Flow Cell Priming Kit (EXP-FLP002), was loaded into the R9.4 flow cell (FLO-MIN106; Oxford Nanopore Technologies, Oxford, UK) and was sequenced on the MinION™ Mk1B for 72 h.
2.9. Long-Read Sequencing
16S rRNA long-read sequencing was performed with Oxford Nanopore Technologies (ONT) MinION sequencer, using an R9.4 flow cell and the MinKNOW software (v21.02.1).
Raw fast5 reads were basecalled using the ONT Guppy basecalling software (v5.0.7) and barcoded using the ONT Guppy barcoding software (v5.0.11), which produced fastq files that were subsequently checked for quality with LongQC.
Taxonomy was then assigned using the resulting fastq data via the Dada2 [
20] R package (v1.18) and the SILVA 138.1 database (“sh_general_release_dynamic_s_10.05.2021.fasta”). The “filterAndTrim” function was run with the following arguments: minLen = 1400, maxLen = 1600, multithread = TRUE, verbose = TRUE. Further, the “dada” function was run with the parameters OMEGA_A = 1e-10, DETECT_SINGLETONS = TRUE, before taxonomy was assigned with the “assignTaxonomy” function with the argument tryRC = TRUE.
2.10. Statistical Analysis
Statistical analysis was performed at GraphPad Prism (version 9.00 for Windows, GraphPad Software, La Jolla, CA, USA,
www.graphpad.com accessed on 5 July 2022); adopting a 5% significance level at all tests. Comparisons in particle size, Ra for roughness and conductivity parameters for different materials were performed by Kruskal–Wallis and post hoc Dunn.
3. Results
3.1. Supplemented Material Characteristics
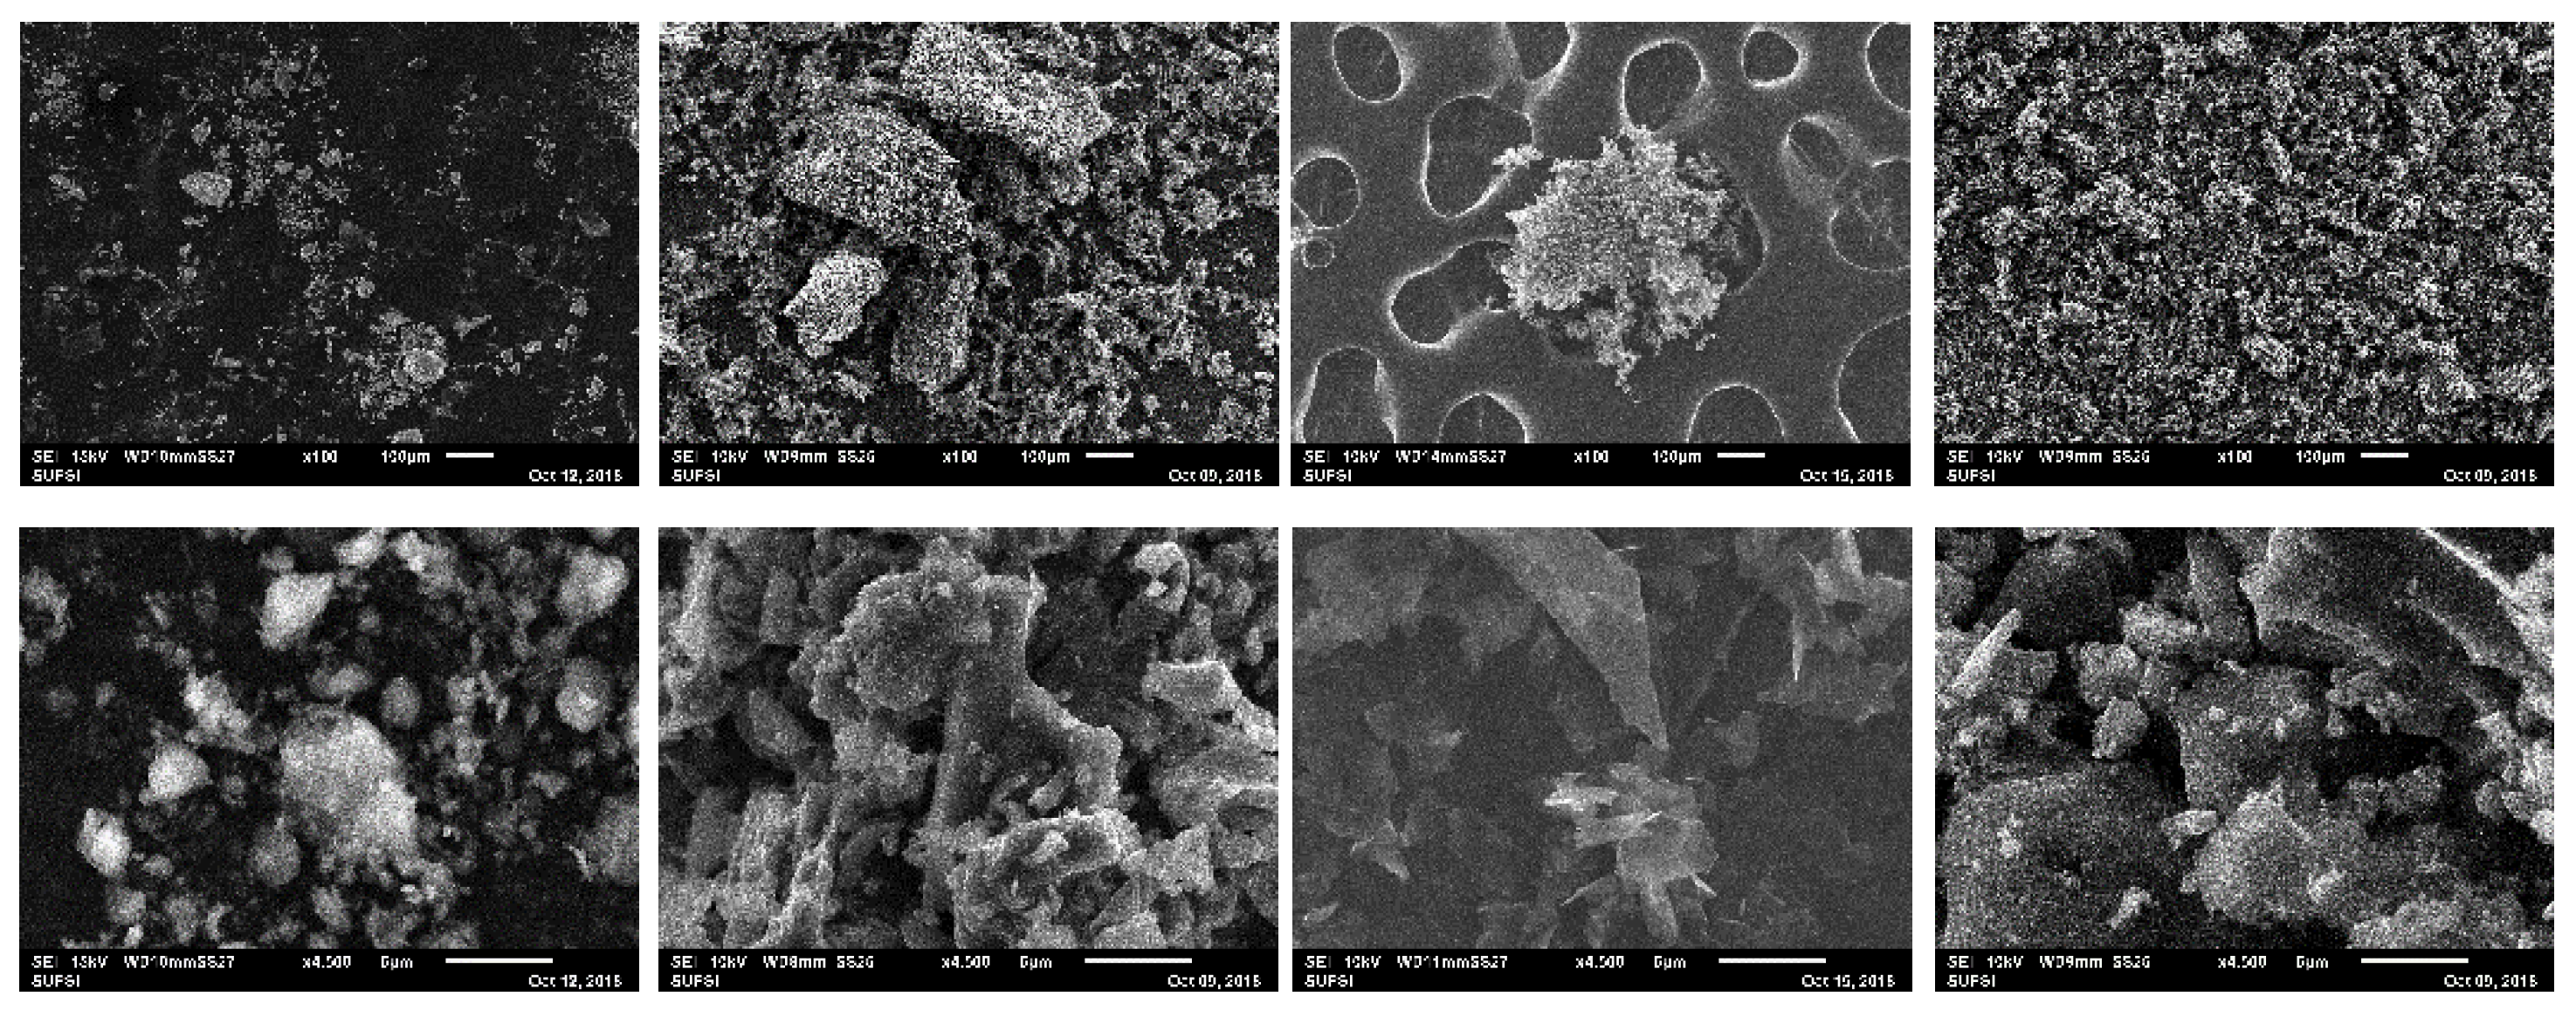
Scanning electron microscopy has been applied to study particle size distribution and morphology. The observations were taken first at 100× to evidence the structure and then at 4500× to study the particle size distribution (see
Figure 1). In fact, observation evidenced a large distribution of particle size, a wide morphology and the existence of a fractal distribution: zooming in new aggregates can be observed. Considering that the DIET mechanism is based on the interaction between a cell and the material, we decided to focus on the 1–10 µm range to study the particle size distribution. For the same reason, we decided to measure the conductivity of the material itself instead of a solution at different concentrations.
Data on material characterization are reported in
Table 1. Biochar has the highest particle dimension and roughness (Ra), and the second lowest conductivity value; zeolite is the non-conductive material with Ra values similar to graphene and PAC; graphene is the material with the smallest particle size, the more homogeneous distribution and the highest conductivity.
An example of the replicates acquired in scanning electron microscopy used for measuring particle size and roughness is reported in
Figure 1. At lower magnification (
Figure 1; upper line from left to right), zeolite reveals particles in the range of a few microns with a high variance, biochar presents 100–200 µm material clusters, graphene shows agglomerate structure and PAC has a uniform distribution; zooming in at 4500× (bottom line;
Figure 1) all the materials have very wide particle morphology with graphene showing sharp structures.
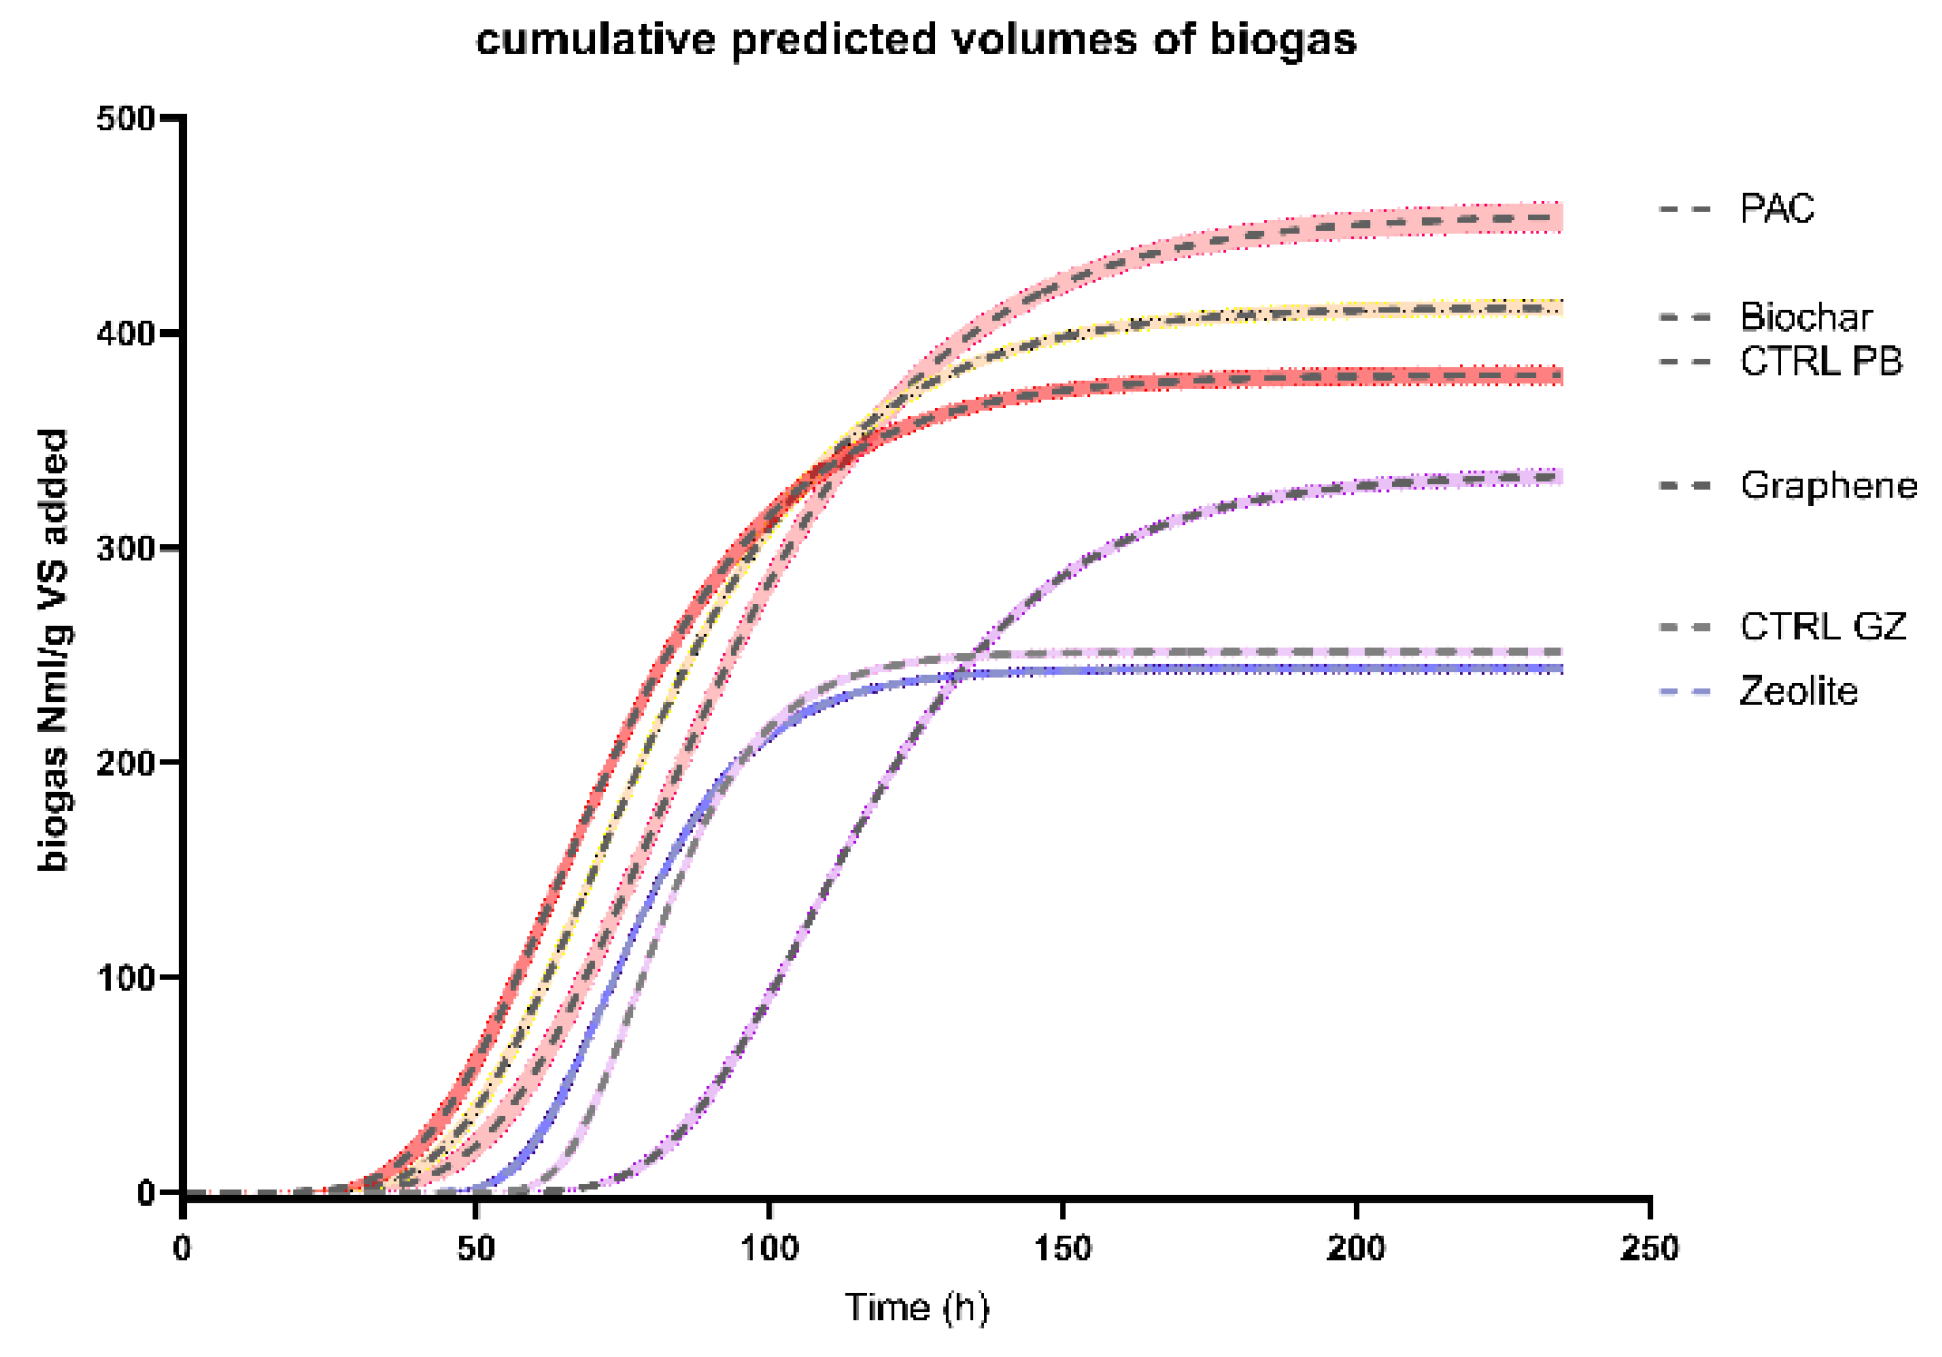
3.2. Effect of Conductive Material Supplement on Biogas Production
Batch reactors, with the addition of a different material, were monitored in continuous mode and the hourly data recorded were used to calculate the cumulative biogas production. For comparison purposes, data were normalized on feeding addition expressed as volatile solids mass. In
Figure 2, the predicted values obtained from the Gompertz nonlinear fitting are compared for each treatment.
To consider the effect of the microbial composition in the inoculum as variable and the endogenous biogas production, PAC and biochar treatment were set with the very same inoculum as CTRL-PB, while graphene and zeolite have the same inoculum as CTRL-GZ. Graphene reached the plateau after 150 h, while zeolite and CTRL-GZ around 70 h. PAC, biochar and their control show a similar trend.
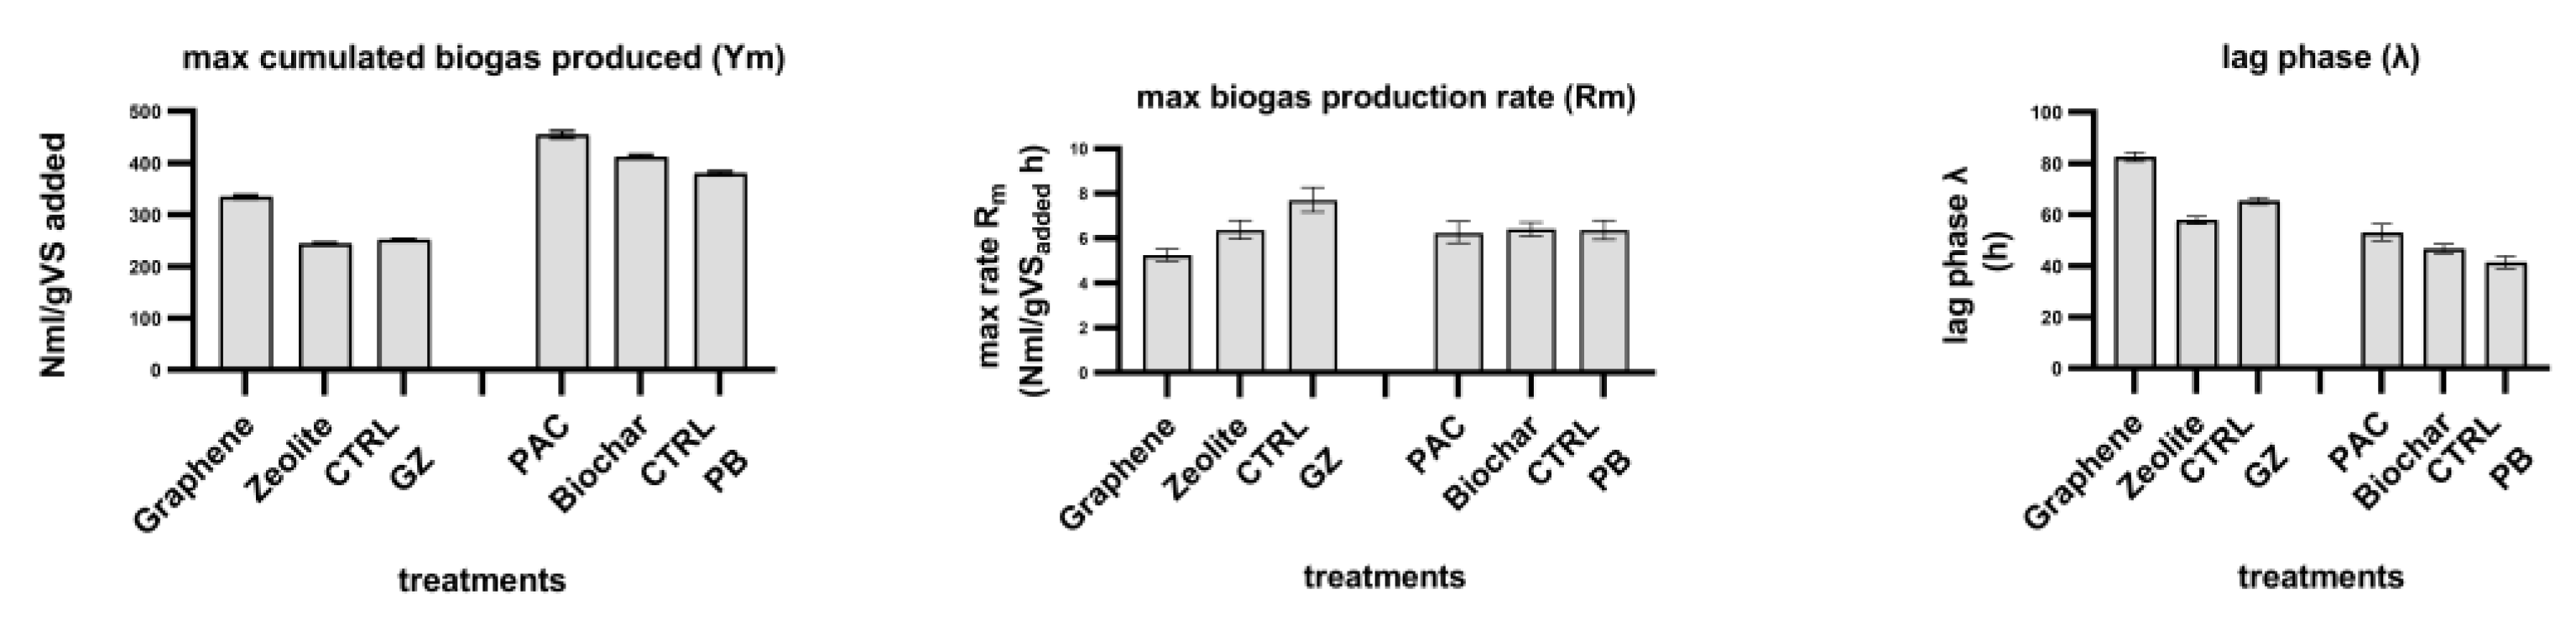
The comparison of the kinetic parameters calculated from the model fitting is reported in
Figure 3.
Graphene shows a higher maximum cumulative biogas production (Ym) than both zeolite and CTRL-GZ, which have similar values. PAC-added reactor has the ability to produce more biogas than both biochar and CTRL-PB. Compared to the respective controls, the addition of graphene produced a biogas surplus of 33%, PAC 20% and biochar 8%. Graphene showed lower values of the maximum rate of biogas production (Rm) than both zeolite and CTRL-GZ; while PAC, biochar and CTRL-PB had the same rate.
Considering the methane concentration once a plateau was reached, the graphene-supplemented reactor had 68.5%, for zeolite, methane was 60.3% and for the CTRL-GZ 61.4%; for biochar the methane content was 67.7%, for PAC 69% and CTRL-PB 70.9%.
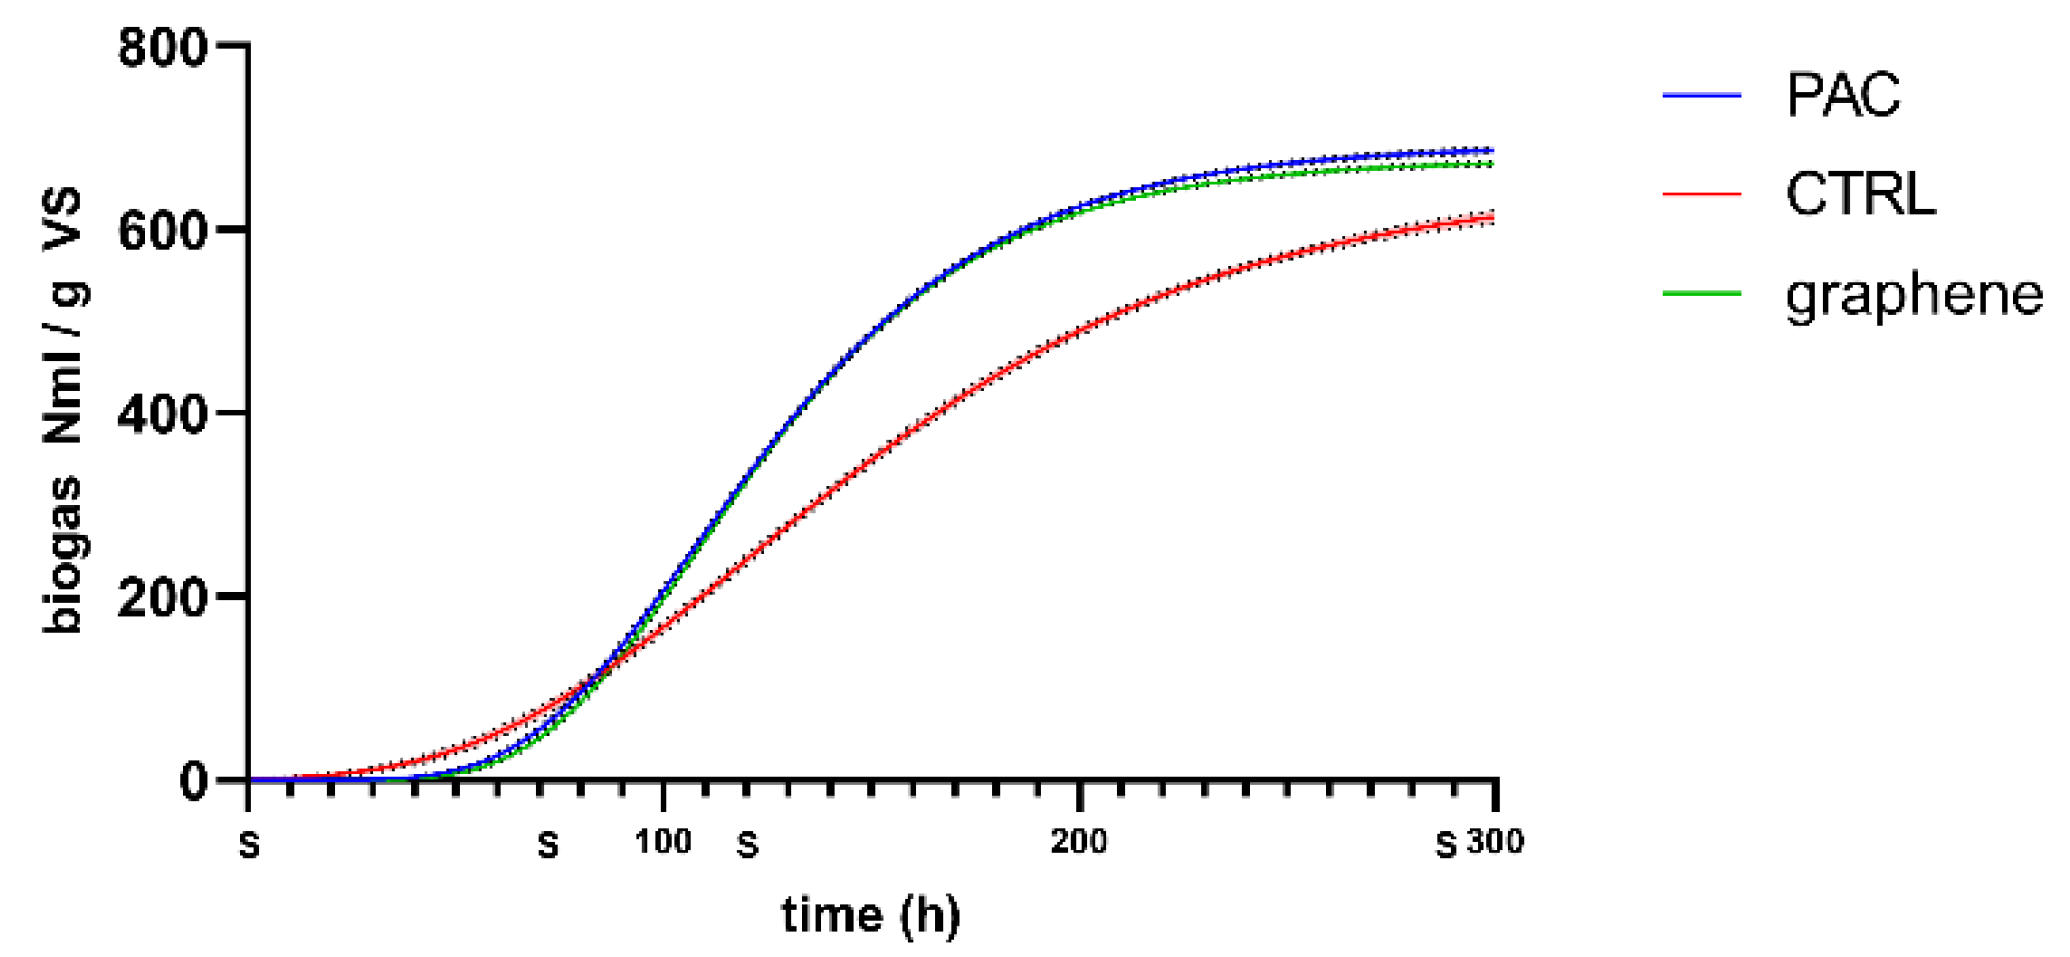
To understand if and how the material characteristics had an influence over the microbial community composition, which is active in the biogas production, the reactors with the two best performing materials (i.e., graphene and PAC) were run a second time. The test settings were the same as the previous experiments and a reactor with no material supplement was set as control. In this second run, samples for microbial community analysis were collected at given times (S in the
Figure 4).
PAC and Graphene added reactors showed a similar trend almost superimposable and different from the CTRL. Considering the kinetic parameters from the nonlinear fitting (Gompertz), the maximum cumulative biogas production (Ym) reaches similar values for the treated and the control PAC 692.2 NmL/gVS, graphene 676.3 NmL/gVS and CTRL 651.6 NmL/gVS. Instead, a difference is observed for the maximum rate (Rm) that is highest for graphene with 6.51 NmL/gVS h, then PAC with 6.3 NmL/gVS h and the slowest resulted to be CTRL with 3.74 NmL/gVS h.
3.3. Microbial Community Structure Dynamic
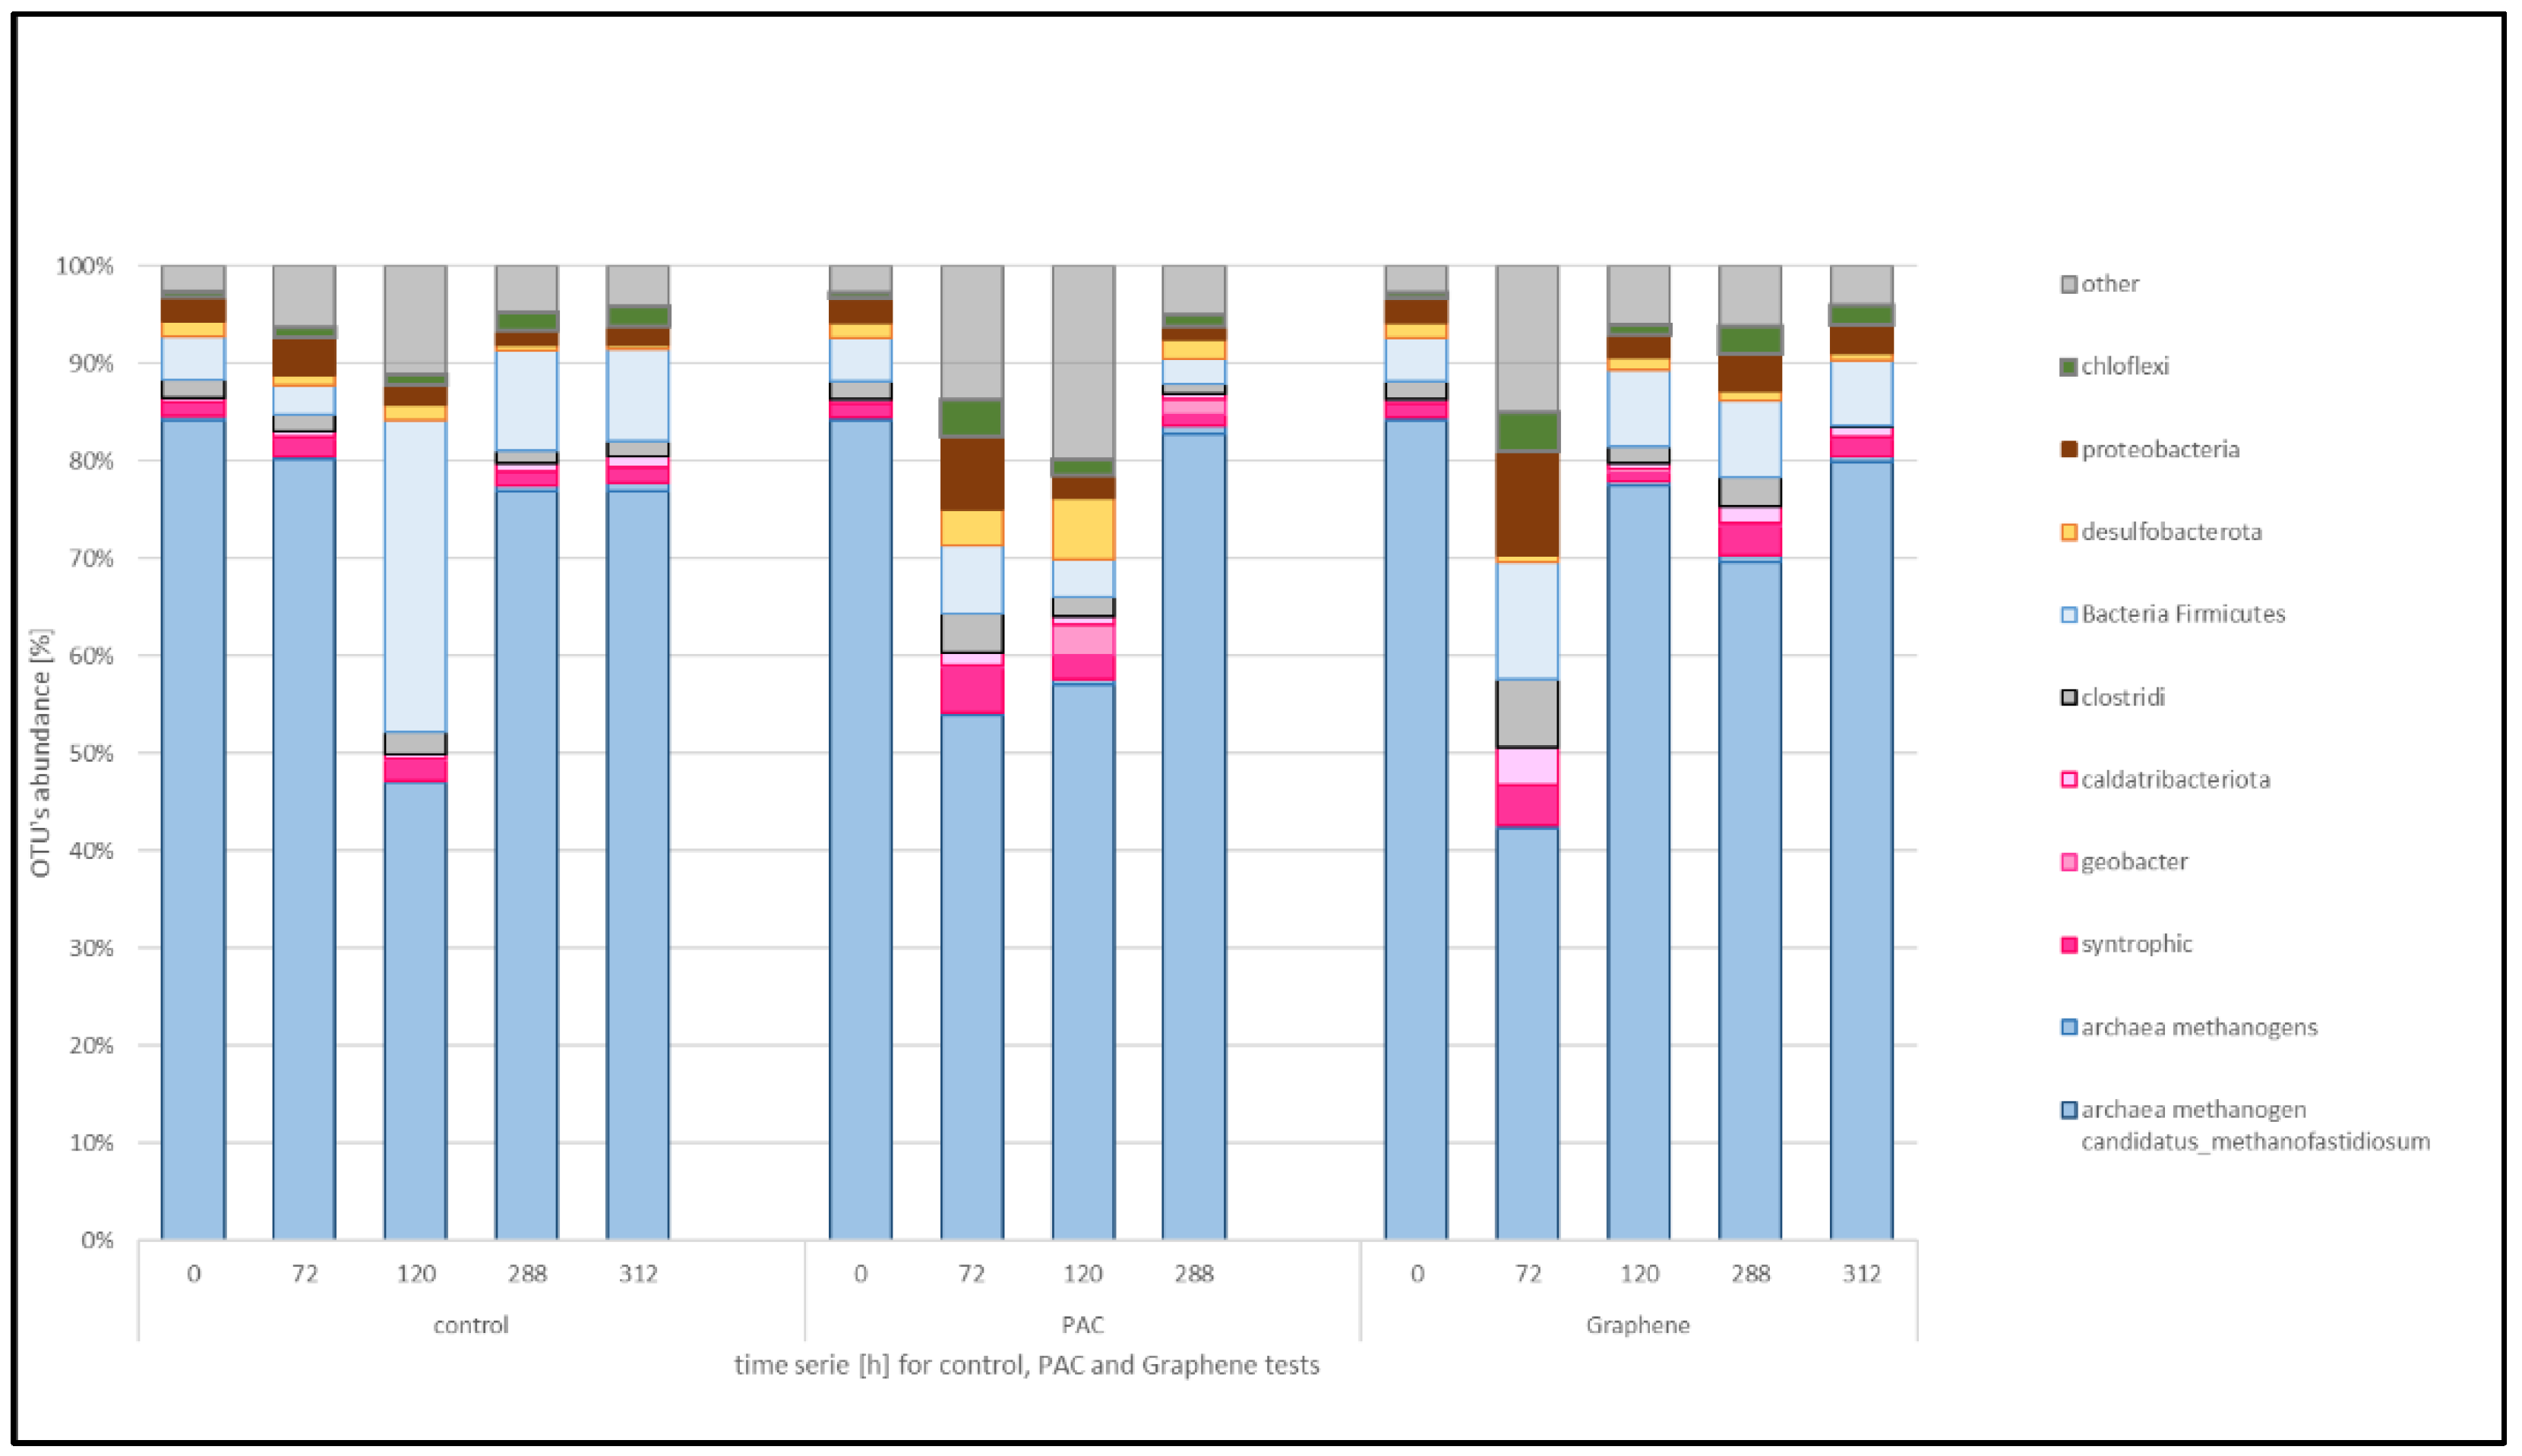
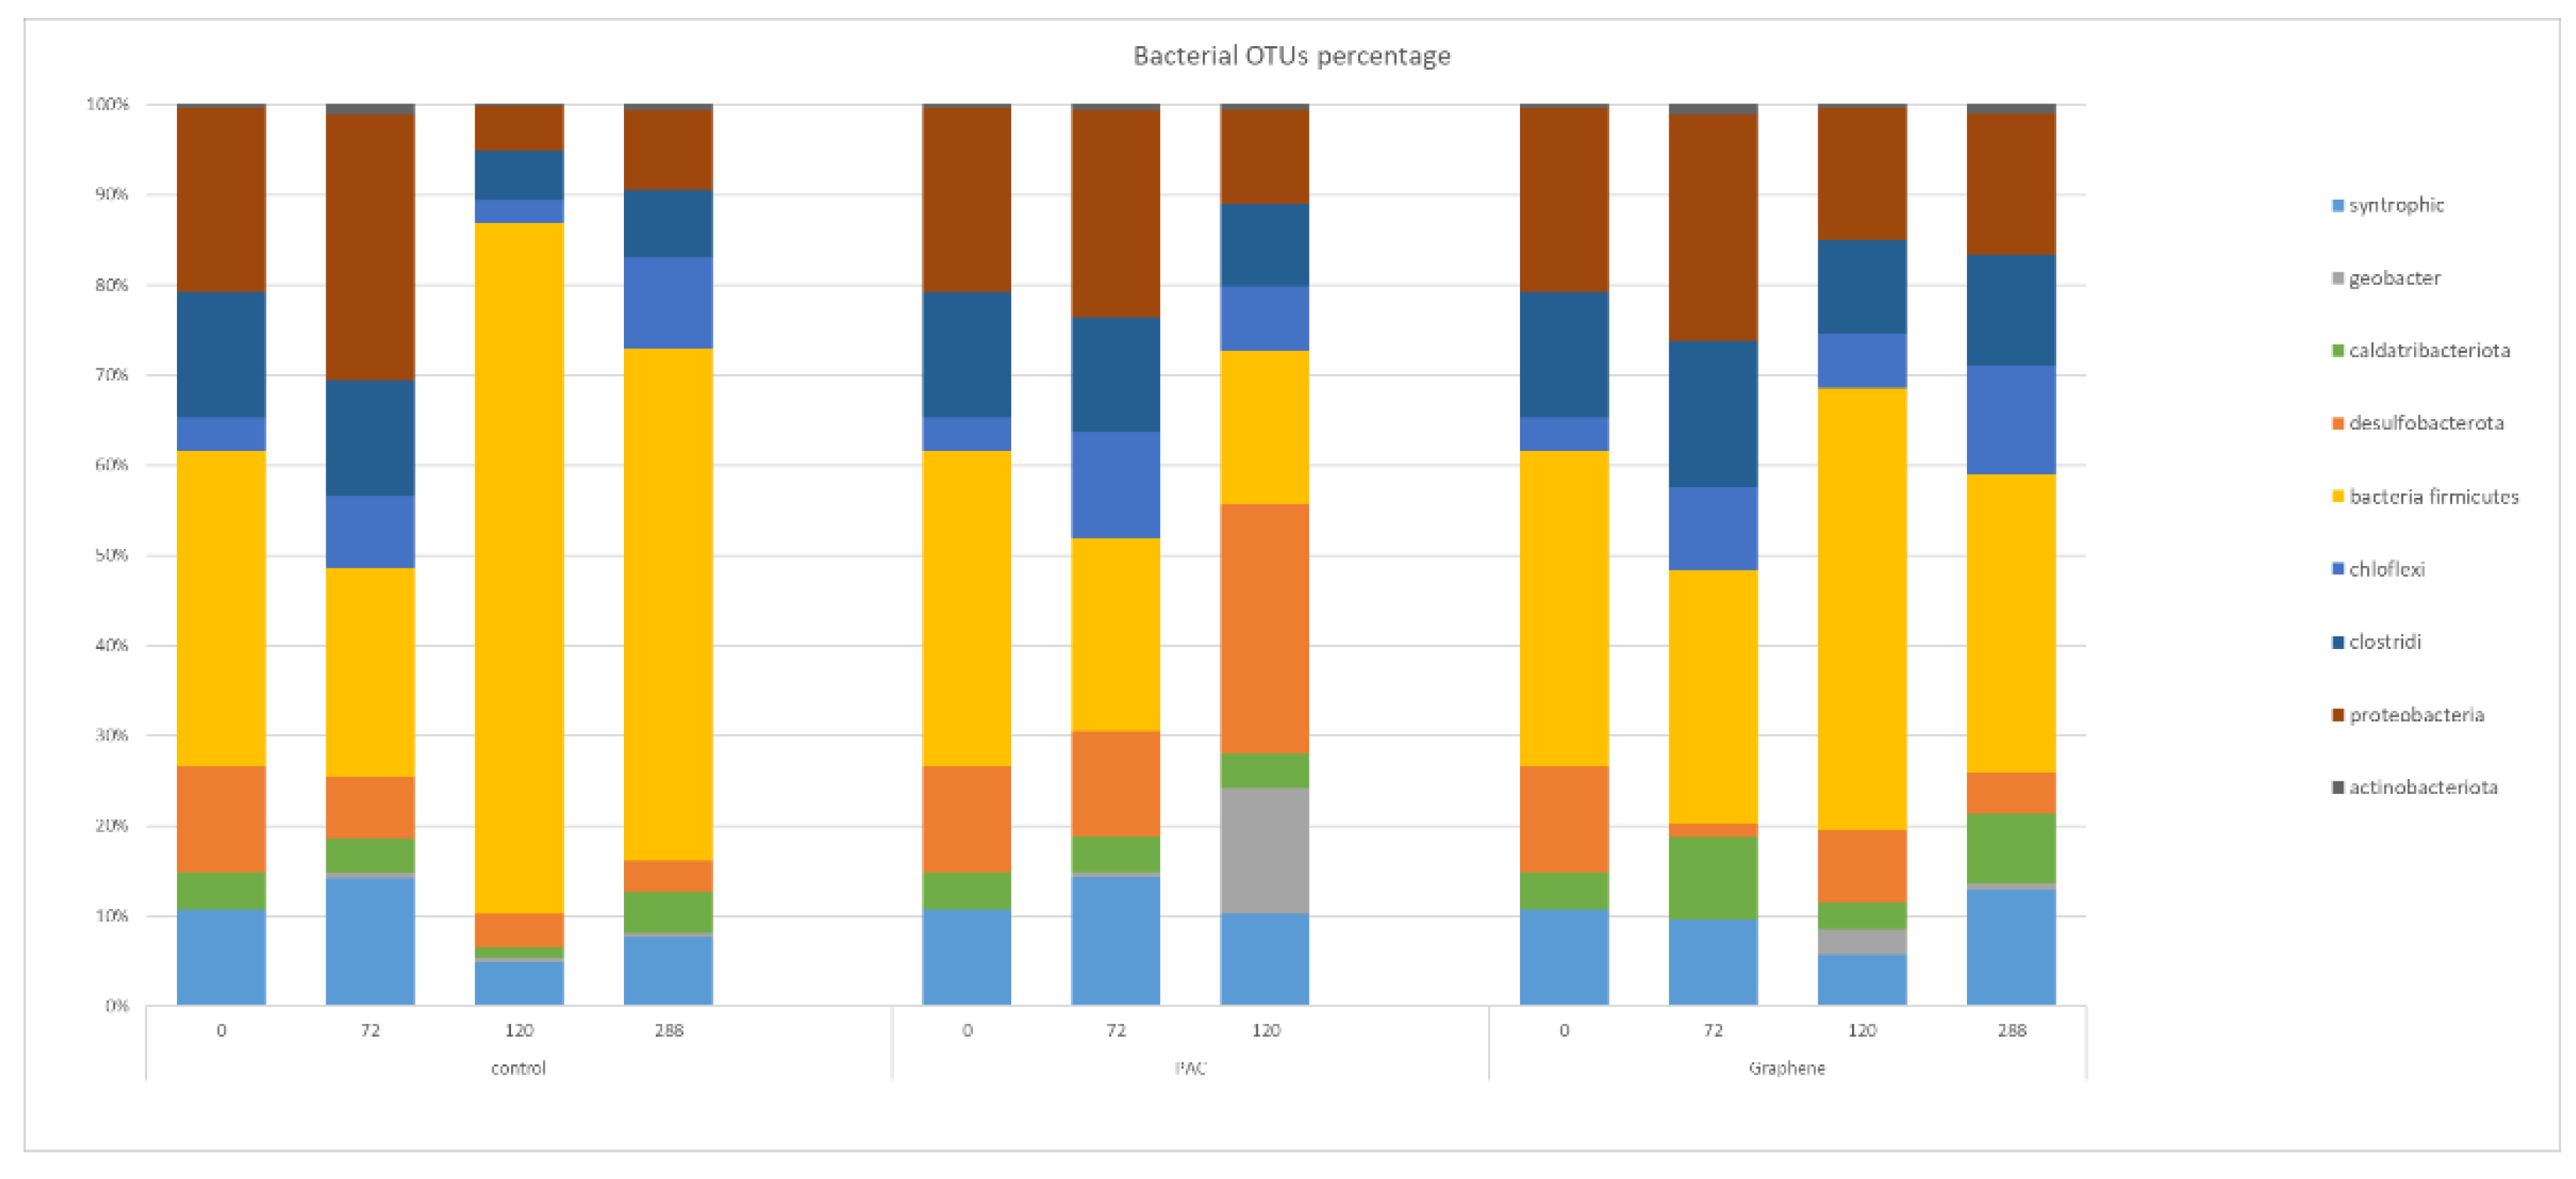
The changes in microbial community composition in each treatment and time were studied through PCR-dependent 16S rDNA sequencing using the MinION platform. The different sequences grouped in OTUs were filtered and plotted considering the taxa known to have functions relevant to the anaerobic digestion, as in the reference literature (see
Figure 5). OTUs with an abundance lower than 0.05% are grouped together as “other”. Therefore, the attention was focused on the functional taxa of methanogens, syntrophics, sulphur cycle-related and then the proteobacteria and strictly anaerobic taxa.
The microbial consortia from the municipal wastewater treatment plant digester and used as inoculum in the experiments (time 0 in control) is characterized by the dominance of archaeal methanogenic organisms and in particular Candidatus methanofastidiosum that is present with a percentage of 84.1. The remaining 15.9% is composed of OTUs belonging to bacterial taxa. Over time, the inoculum composition changed due to the ethanol feeding with the Ca. methanofastidiosum decreasing at 47.3% at 120 h sample that corresponds to higher biogas production but lower methane content. After that, the Ca. methanofastidiosum was dominant again.
Considering the syntrophic group, in the conductive materials supplemented reactors, the decrease in the percentage of methanogens occurs already at the 72 h sample: for the PAC supplemented test Ca. methanofastidiosum goes from 84.1 to 53.8% and then steadily increases to a final 82.7%. The graphene-added reactor showed a decrease at 72 h to 42.1% and then increased back to 69.5%.
In the treatment without material addition (control) Spaherochaeta spp. were 3.6% at the beginning, increased to 7.9% during the maximum activity and then decreased to 2.31%. The Methanosaeta spp. with Methanothrix spp. represent 0.1% of the total Archaea, decreased to 0.02% in the maximum activity time and increased to 0.5 at the plateau phase.
In the PAC supplemented reactor, Spaherochaeta spp. increased from the 3.6% of total bacteria in the beginning to 7.39% at maximum activity and decreased afterwards to 6.06%, while Methanosaeta spp. remained constant at 0.1–0.2%. For graphene treatment, Spaherochaeta spp increased from 3.6% to 8.7% and then decreased back to 0.9%, while the DIET-associated methanogen Methanosaeta spp went from 0.1 to 0.6 and back to 0.2%.
Considering only the bacterial OTUs (see
Figure 6), the original inoculum (time 0) showed the presence of 10.7% of the total bacteria taxa belonging to known syntrophic bacteria and 4.1% to
Caldatribacteriota spp. that are reported being potentially syntrophic in association with methanogenic archaea [
21]. During the process without any supplemented material, the putative syntrophic OTUs increased at 11.8% at time 72 h and then decreased to a final 8.4% out of total bacterial reads. The dominant taxa among bacteria resulted in being
firmicutes (in the range from 23.1 to 56.8%).
4. Discussion and Conclusions
The different materials chosen for the experiments showed high variability in terms of conductivity and particle size. The most conductive were graphene and PAC. Considering biogas production, the observed increment follows the conductivity increase of the added material. The only non-conductive material, zeolite, showed a reduced cumulative biogas production by 3% (compared to CTRL-GZ).
As reported by other authors [
21], substrate type, operational mode and inoculum origin can influence biogas production. In our experiments, we set the same operational mode –batch-, inoculum and substrate and the reactors were different just for the material added: similarly to others [
9,
22,
23,
24], PAC and biochar addition resulted in increasing biogas and methane production.
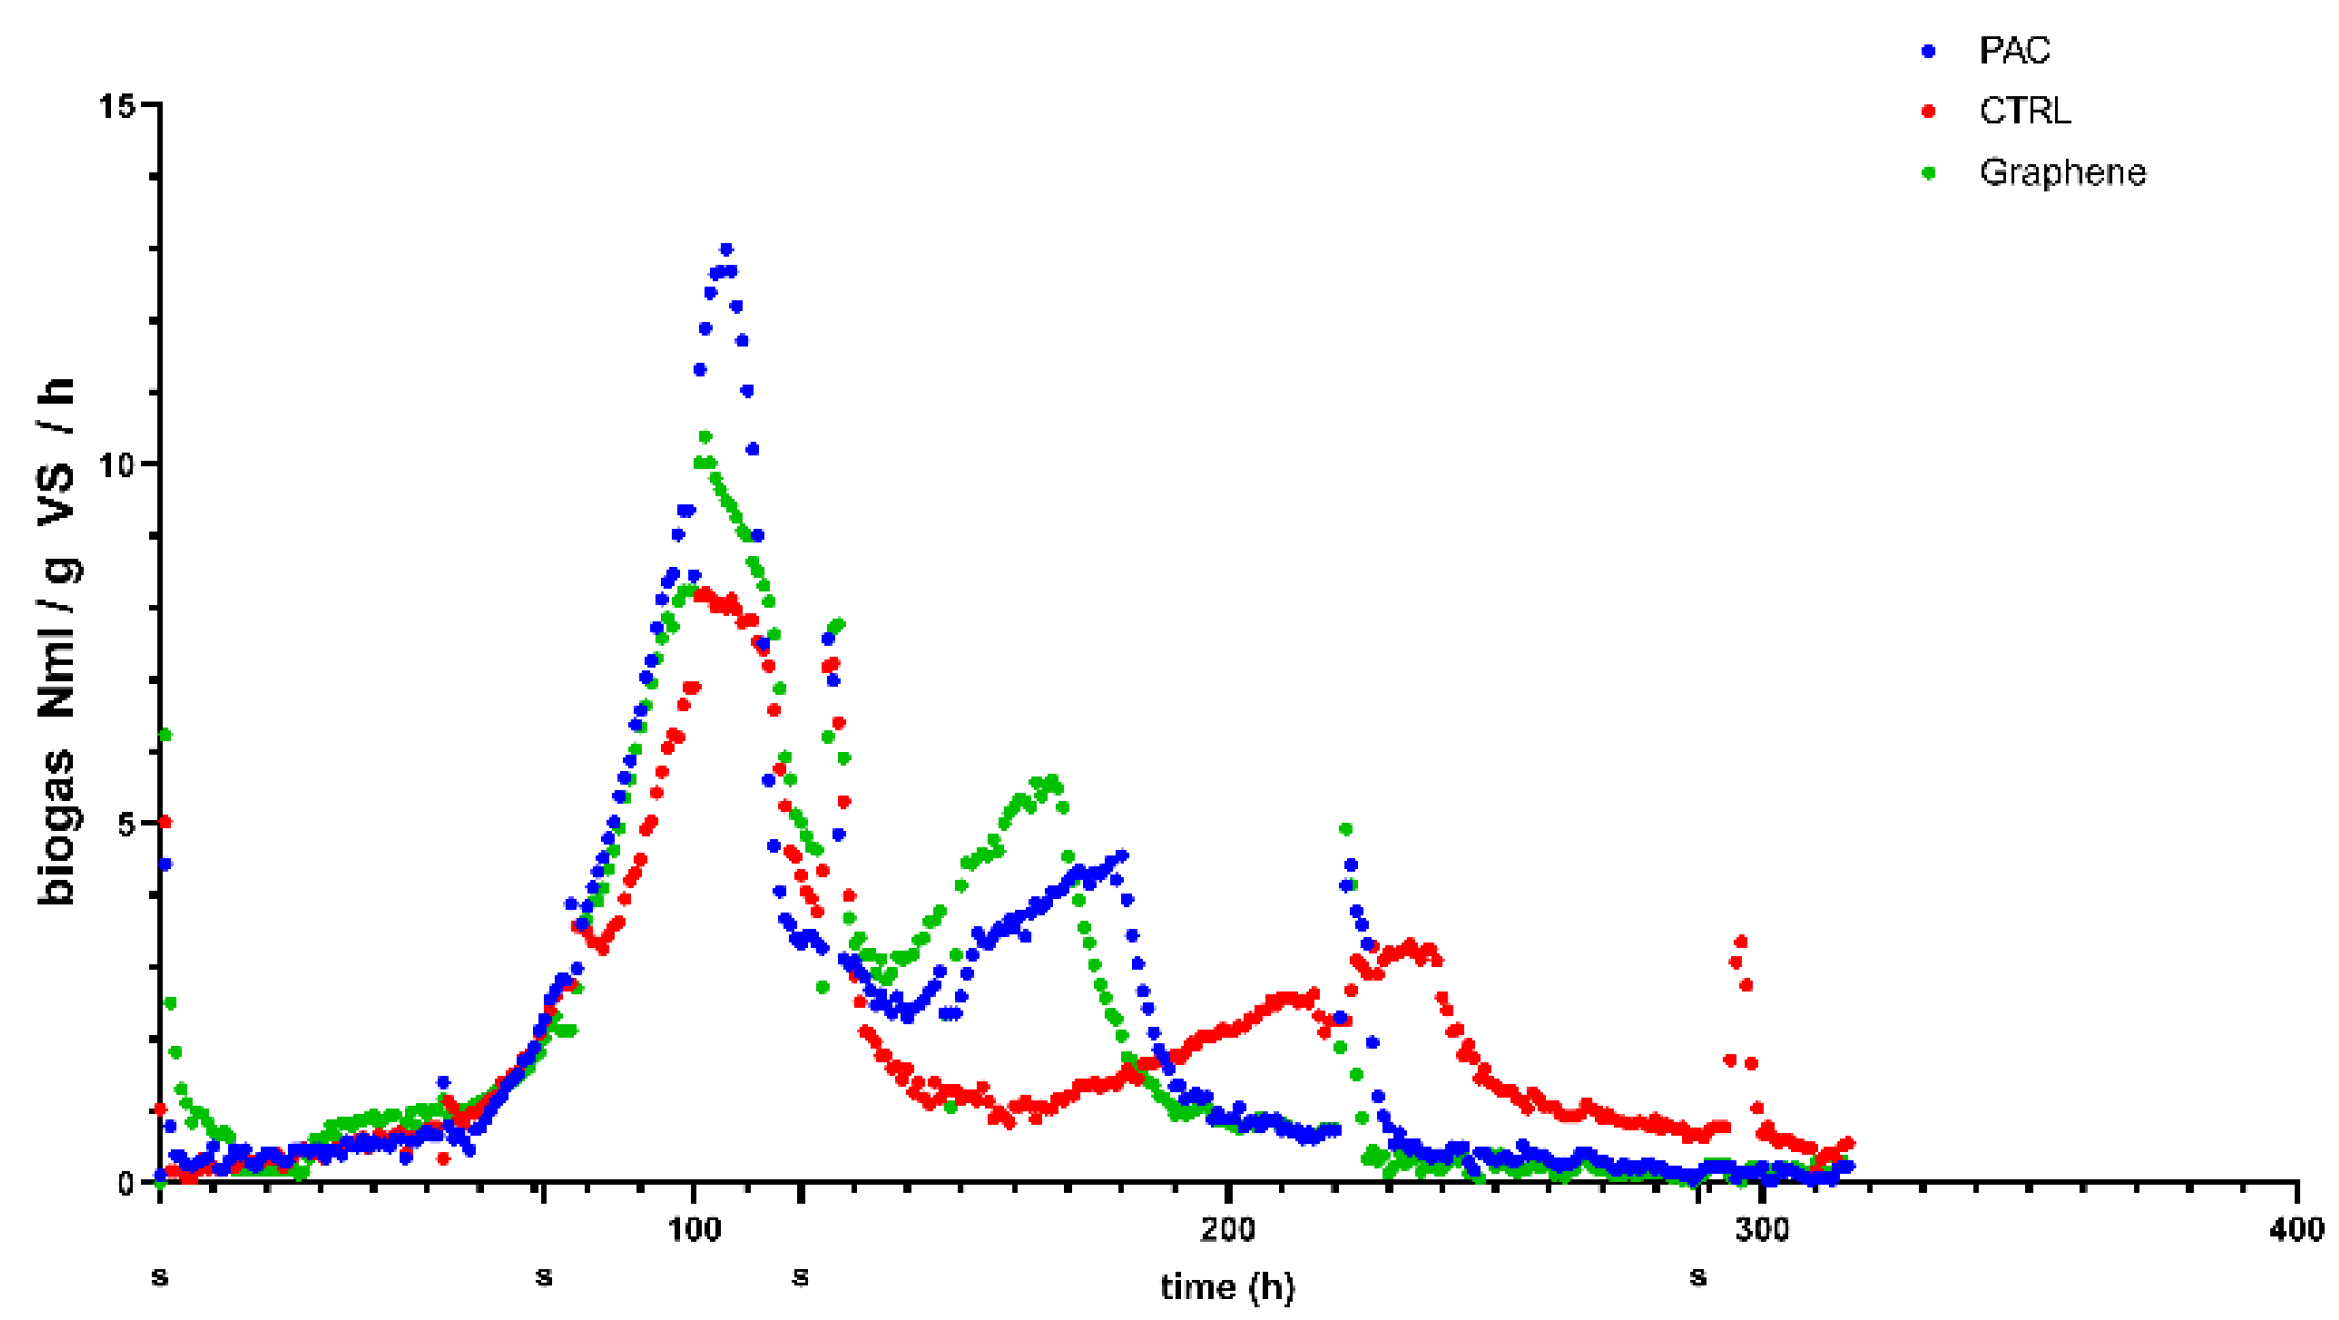
Another kinetic parameter important to dimension real-scale plants is the maximum rate of biogas production (Rm). In one set of experiments, conductive materials had a lower or similar maximum biogas production rate than the control reactor, while in a second set, the rate was higher. The Rm resulted in being variable, independent of conductivity and related to the characteristics of the microbial community present.
The cumulative biogas production and the kinetic analysis of the process based on the modified Gompertz model is the common data analysis for anaerobic digestion experiments [
19,
25]. However, plotting the specific biogas production rate (
Figure 7), it is possible to note the presence of two main peaks corresponding to an increase in the microorganisms’ activity resulting in biogas production. Given that each time a gas sampling was performed, the headspace was emptied. The gas composition percentage represents the cumulative gas quality produced in the period between the two sampling points indicated in
Figure 7.
In the time-frame of the first activity peak (between 70 and 120 h), the graphene-added reactor produced the best quality with a 50% methane content, PAC-added test gave 49.4% and the CTRL was 43.7%. Moreover, considering that in this peak, both PAC and graphene produced more biogas than the CTRL, we can state that the first peak methane production was improved by the conductive material presence.
The biogas production activity peaks a second time: for graphene and PAC it occurs at 160–170 h range, while for the CTRL it occurs at 240 h. The methane content increases for all the treatments reaching 76.6% for graphene, 74.4% for PAC compared to 66.9% for control. As reported recently [
26], feeding with ethanol induced the DIET syntrophy, therefore, the increased biogas production measured for the reactors with conductive materials can be linked to the activity of DIET-involved microorganisms.
The second peak that remains hidden as noise in the steady part of the cumulative curve occurs earlier in the PAC and graphene-added reactors and therefore seems to be related to the conductivity of the material added. Considering that the reactors were run in batch mode, the first peak represents the conversion of readily degradable organic matter present in the ethanol-feeding, while in the second one, the microbial activity is supported by the conversion of the remaining organics that are anyway present in the digestate used as inoculum. The microorganism in the reactors with the conductive materials are able to convert the ethanol and the organics in the digestate more efficiently, resulting in higher maximum biogas and methane production and the anticipated appearance of the second peak.
The microbial community chosen as inoculum resulted dominated by a methanogenic taxon (Ca.
Methanofastidiosum) that after an adaptation phase due to the specific EtOH feeding in which decreases, becomes—after 120 h—dominant again. Those methanogens are characterized by particular metabolic abilities: they perform a methylated thiol reduction for methane production and they have been retrieved in sulphur and eutrophic-rich methanogenic mesophilic digesters [
27]. The decrease in percentage also observed in the treated reactors is not dependent on the material characteristics, but due to the change in the environmental parameters that were set in the experiments compared to the industrial digester source of the inoculum.
Syntrophic microorganisms were already present in the original inoculum, and the conductive material addition favors the increase of other syntrophy-associated taxa. In fact, summing up the putative syntrophic taxa (geobacter, syntrophic and caldatribacteriota), both PAC and graphene supplemented reactors show an increase in abundance.
Other syntrophic-associated taxa (
Sphaerochaeta and Methanothrix spp) were detected in the samples taken from the reactors with conductive materials [
28]. Zhao et al. [
29] reported that the addition of ethanol to improve AD efficiency and stability of anaerobic digestion (AD) especially enriches syntrophy between
Sphaerochaeta and
Methanothrix spp.
In our tests, the material characteristics, as we fed the same compound (ethanol) in all reactors, influenced the synthrophic community composition more than the feed characteristic. In fact, in PAC-added tests,
geobacter goes from under detection limit to 14% at 120 h, instead, for the graphene-added reactor, the syntrophic OTU that is positively selected is
caldatribacteriota a taxon reported being restricted to anaerobic environments. Nobu et al. [
30] reported a lack of respiratory capacity for the “Atribacteria” lineages suggesting syntrophy as a common catabolic strategy for these microorganisms.
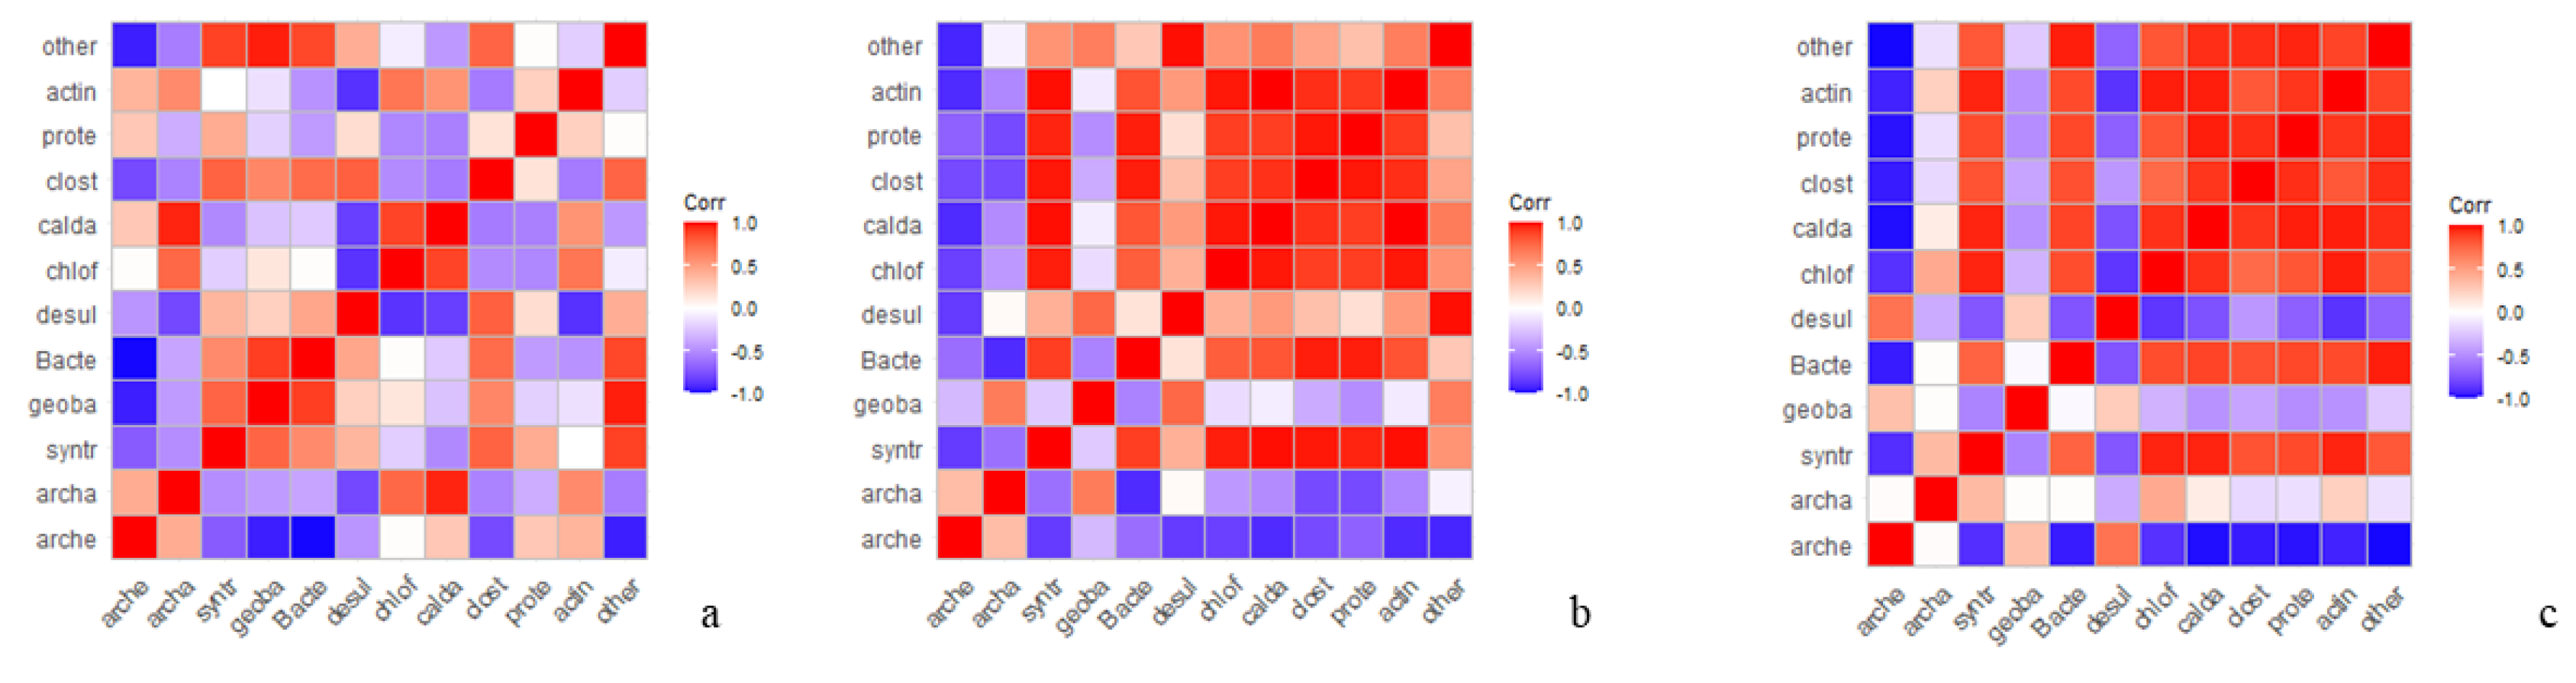
Using the measurements of bacterial composition, correlation matrixes were estimated separately for each treatment (i.e., control, PAC and graphene) using the Pearson correlation coefficient. All correlation matrixes are graphically displayed in
Figure 7.
Unsurprisingly the OTUs correlated differently when the microorganisms are in the presence of the different conductive materials. For both PAC and graphene, a positive correlation is observed for
actinobacteriota,
clostridia,
proteobacteria,
choloroflexi and
caldatribacteriota driven by a selective pressure due to the general process condition, mainly ethanol as carbon feeding. In both the control and PAC,
geobacter spp. and ca.
methanofastidiosum are negatively correlated, while in the graphene experiments (
Figure 8c)
geobacter taxa result to be positively correlated with ca.
methanofastidiosum.
Spahaerochaete spp positively selected by conductive material presence is active in the conductive material based-syntrophy, resulting in increased biogas and methane production as shown in the cumulative biogas production curves.
Ca.
Methanofastidiosum uses the methylotrophic pathway to produce methane [
10] and resulted in the dominant archaea in the inoculum and during the process in all the tests. Considering then that a positive correlation was found for
Geobacter sp. and ca.
Methanofastidiosum just in the graphene-added tests, we can state that graphene addition stimulates a syntrophic methylotrophic metabolism between
Geobacter sp. and ca.
Methanofastidiosum. Moreover, as
Geobacter sp. is active in electron transfer syntrophy [
10,
31] we conclude that in our tests the presence of PAC and graphene promotes a diverse syntrophic microbial community resulting in higher biogas production and, in particular, graphene promotes an interspecies electron transfer between
Geobacter sp. and ca.
Methanofastidiosum.Although the syntrophic microbial community is different in the PAC and graphene added tests, the biogas production hourly rate shows the anticipated second peak related to a faster conversion of less easily degradable organics.
This second peak remains hidden as noise in the steady part of the cumulative curve, that might be related to the conductivity of the material added can be exploited to optimize biogas production. For example, a shortened digestion time could result in a reduced digester size in real-scale application or selecting for the syntrophic degradation of less easily organic matter can increase the biomass valorization in biogas as an energy vector.
As stated by many authors [
27,
32,
33,
34] the DIET mechanism is a promising feature to optimize the widely applied AD process to produce energy; to fully exploit its potential there is need of investigating microbial community dynamics in presence of conductive materials and engineering real scale applications.
The data presented in the present paper contribute to the understanding of the DIET-related microbial community dynamic in the presence of graphene and PAC. Moreover, the restart of activity occurring in advance with PAC and graphene, if confirmed in continuous operation mode, could be exploited to optimize biogas and methane production in real scale applications.


 ,
, 


