
Application of Ultrafiltration and Ion Exchange Separation Technology for Lysozyme Separation and Extraction

Abstract
:1. Introduction
2. Materials and Methods
2.1. Materials and Reagents
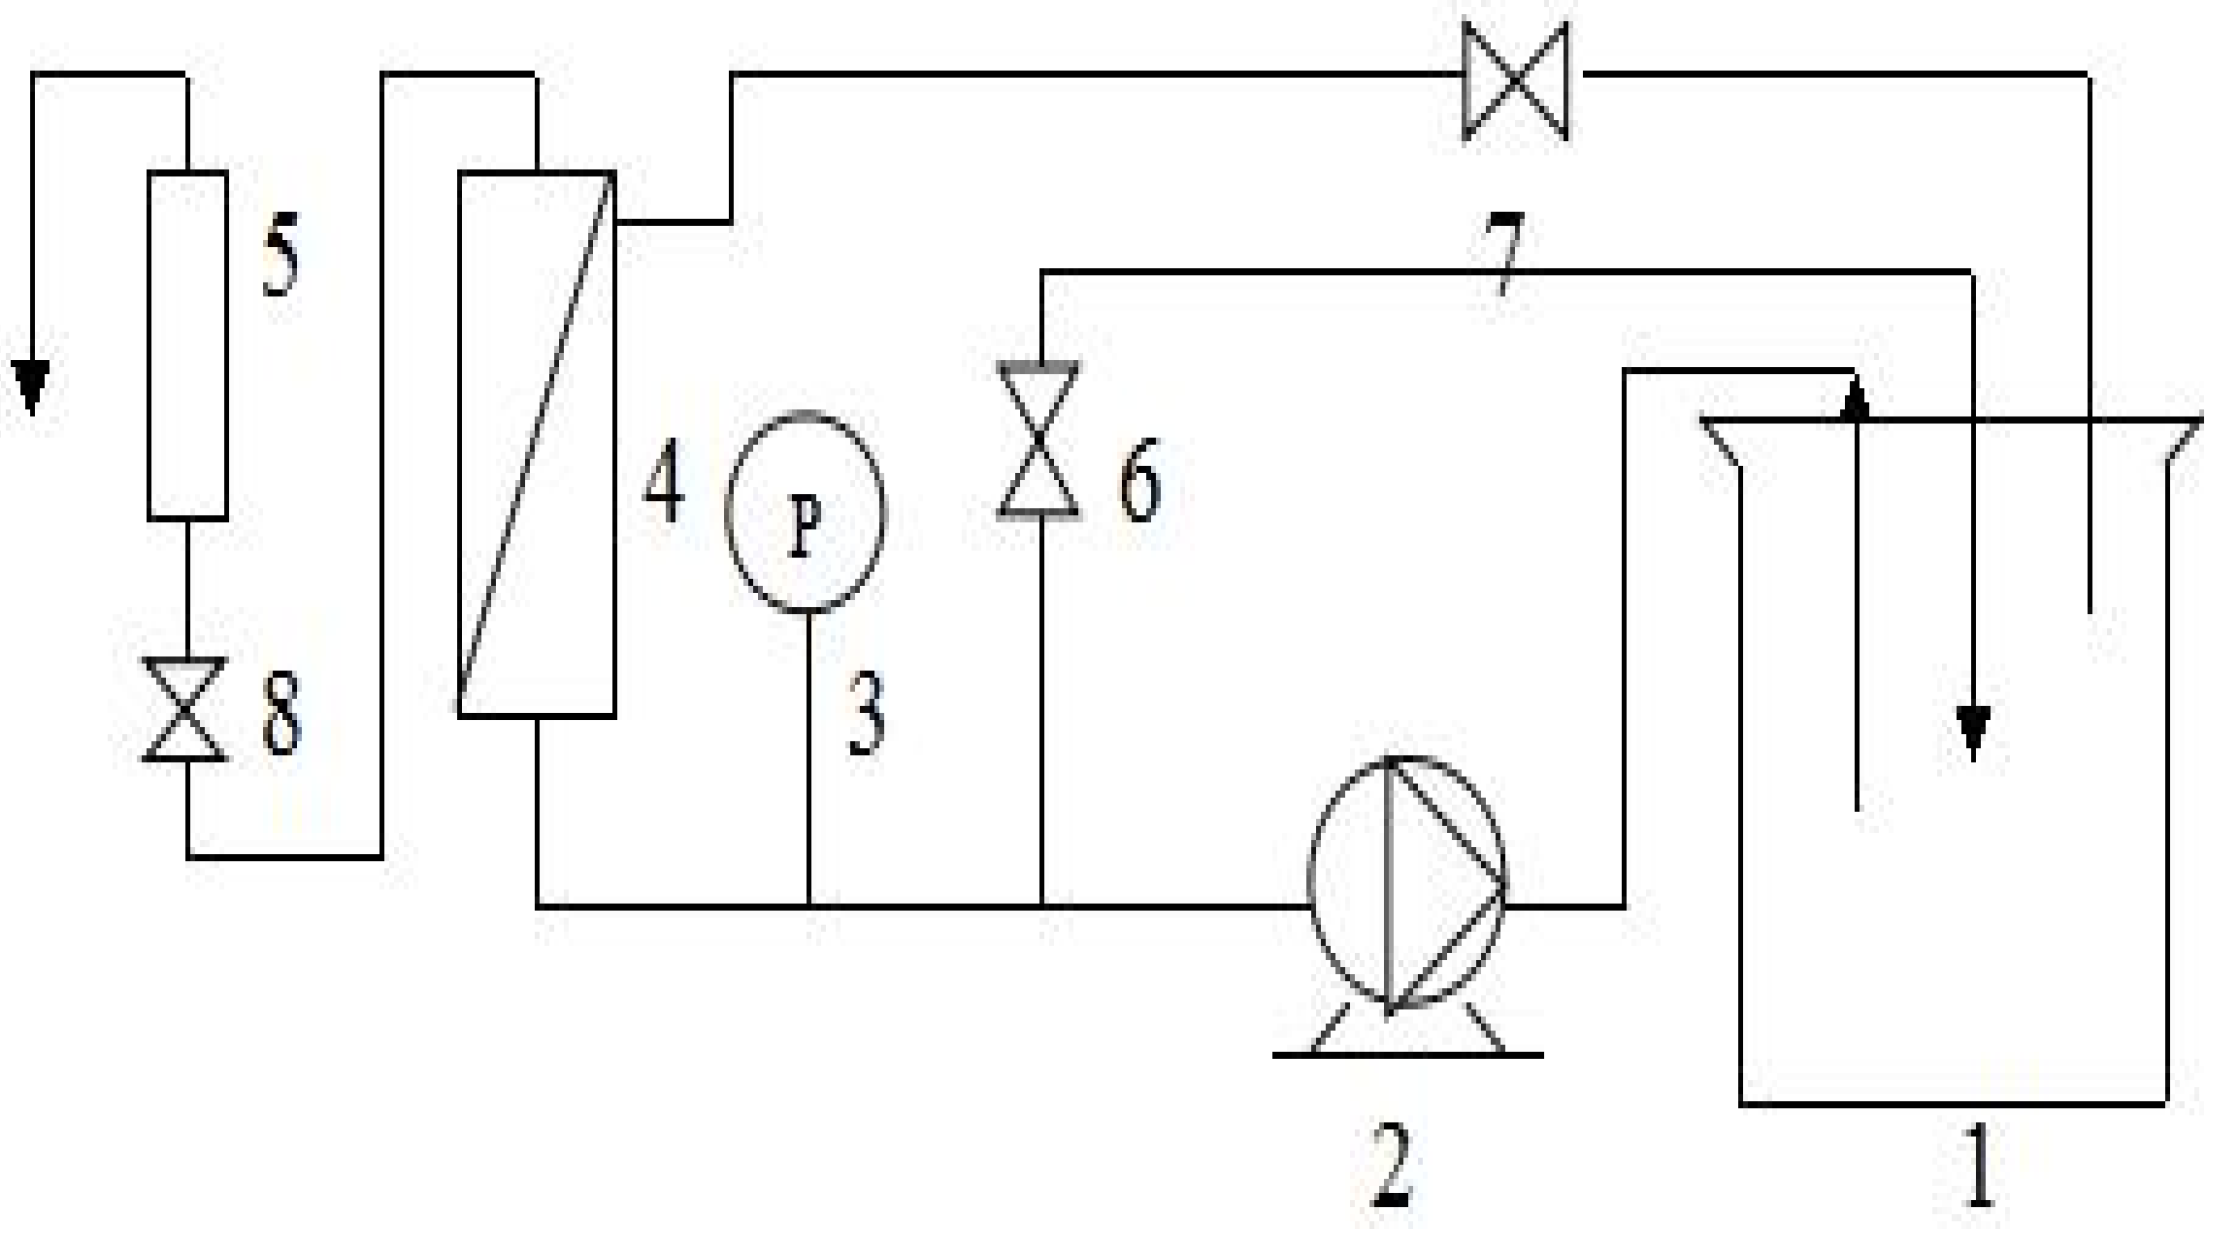
2.2. Instruments and Equipment
2.3. Methods
2.3.1. Preparation of Feed Solution
2.3.2. Preliminary Separation
Effect of Transmembrane Pressure on Membrane Separation Effect
Effect of pH on Membrane Separation
2.3.3. Ion Exchange Chromatography
Single-Factor Experiment
- Ratio of resin dosage to liquid volume
- 2.
- Stirring speed
- 3.
- pH
- 4.
- Temperature
- 5.
- Processing time
- 6.
- NaCl concentration
Orthogonal Experiment
2.3.4. Preparation of Dry Enzyme Powder
Enzymatic Properties
- Effect of temperature on enzyme activity and thermal stability
- 2.
- Effect of pH on enzyme activity and pH stability
- 3.
- Effect of metal ions on enzyme activity
- 4.
- Effect of surfactants on enzyme activity
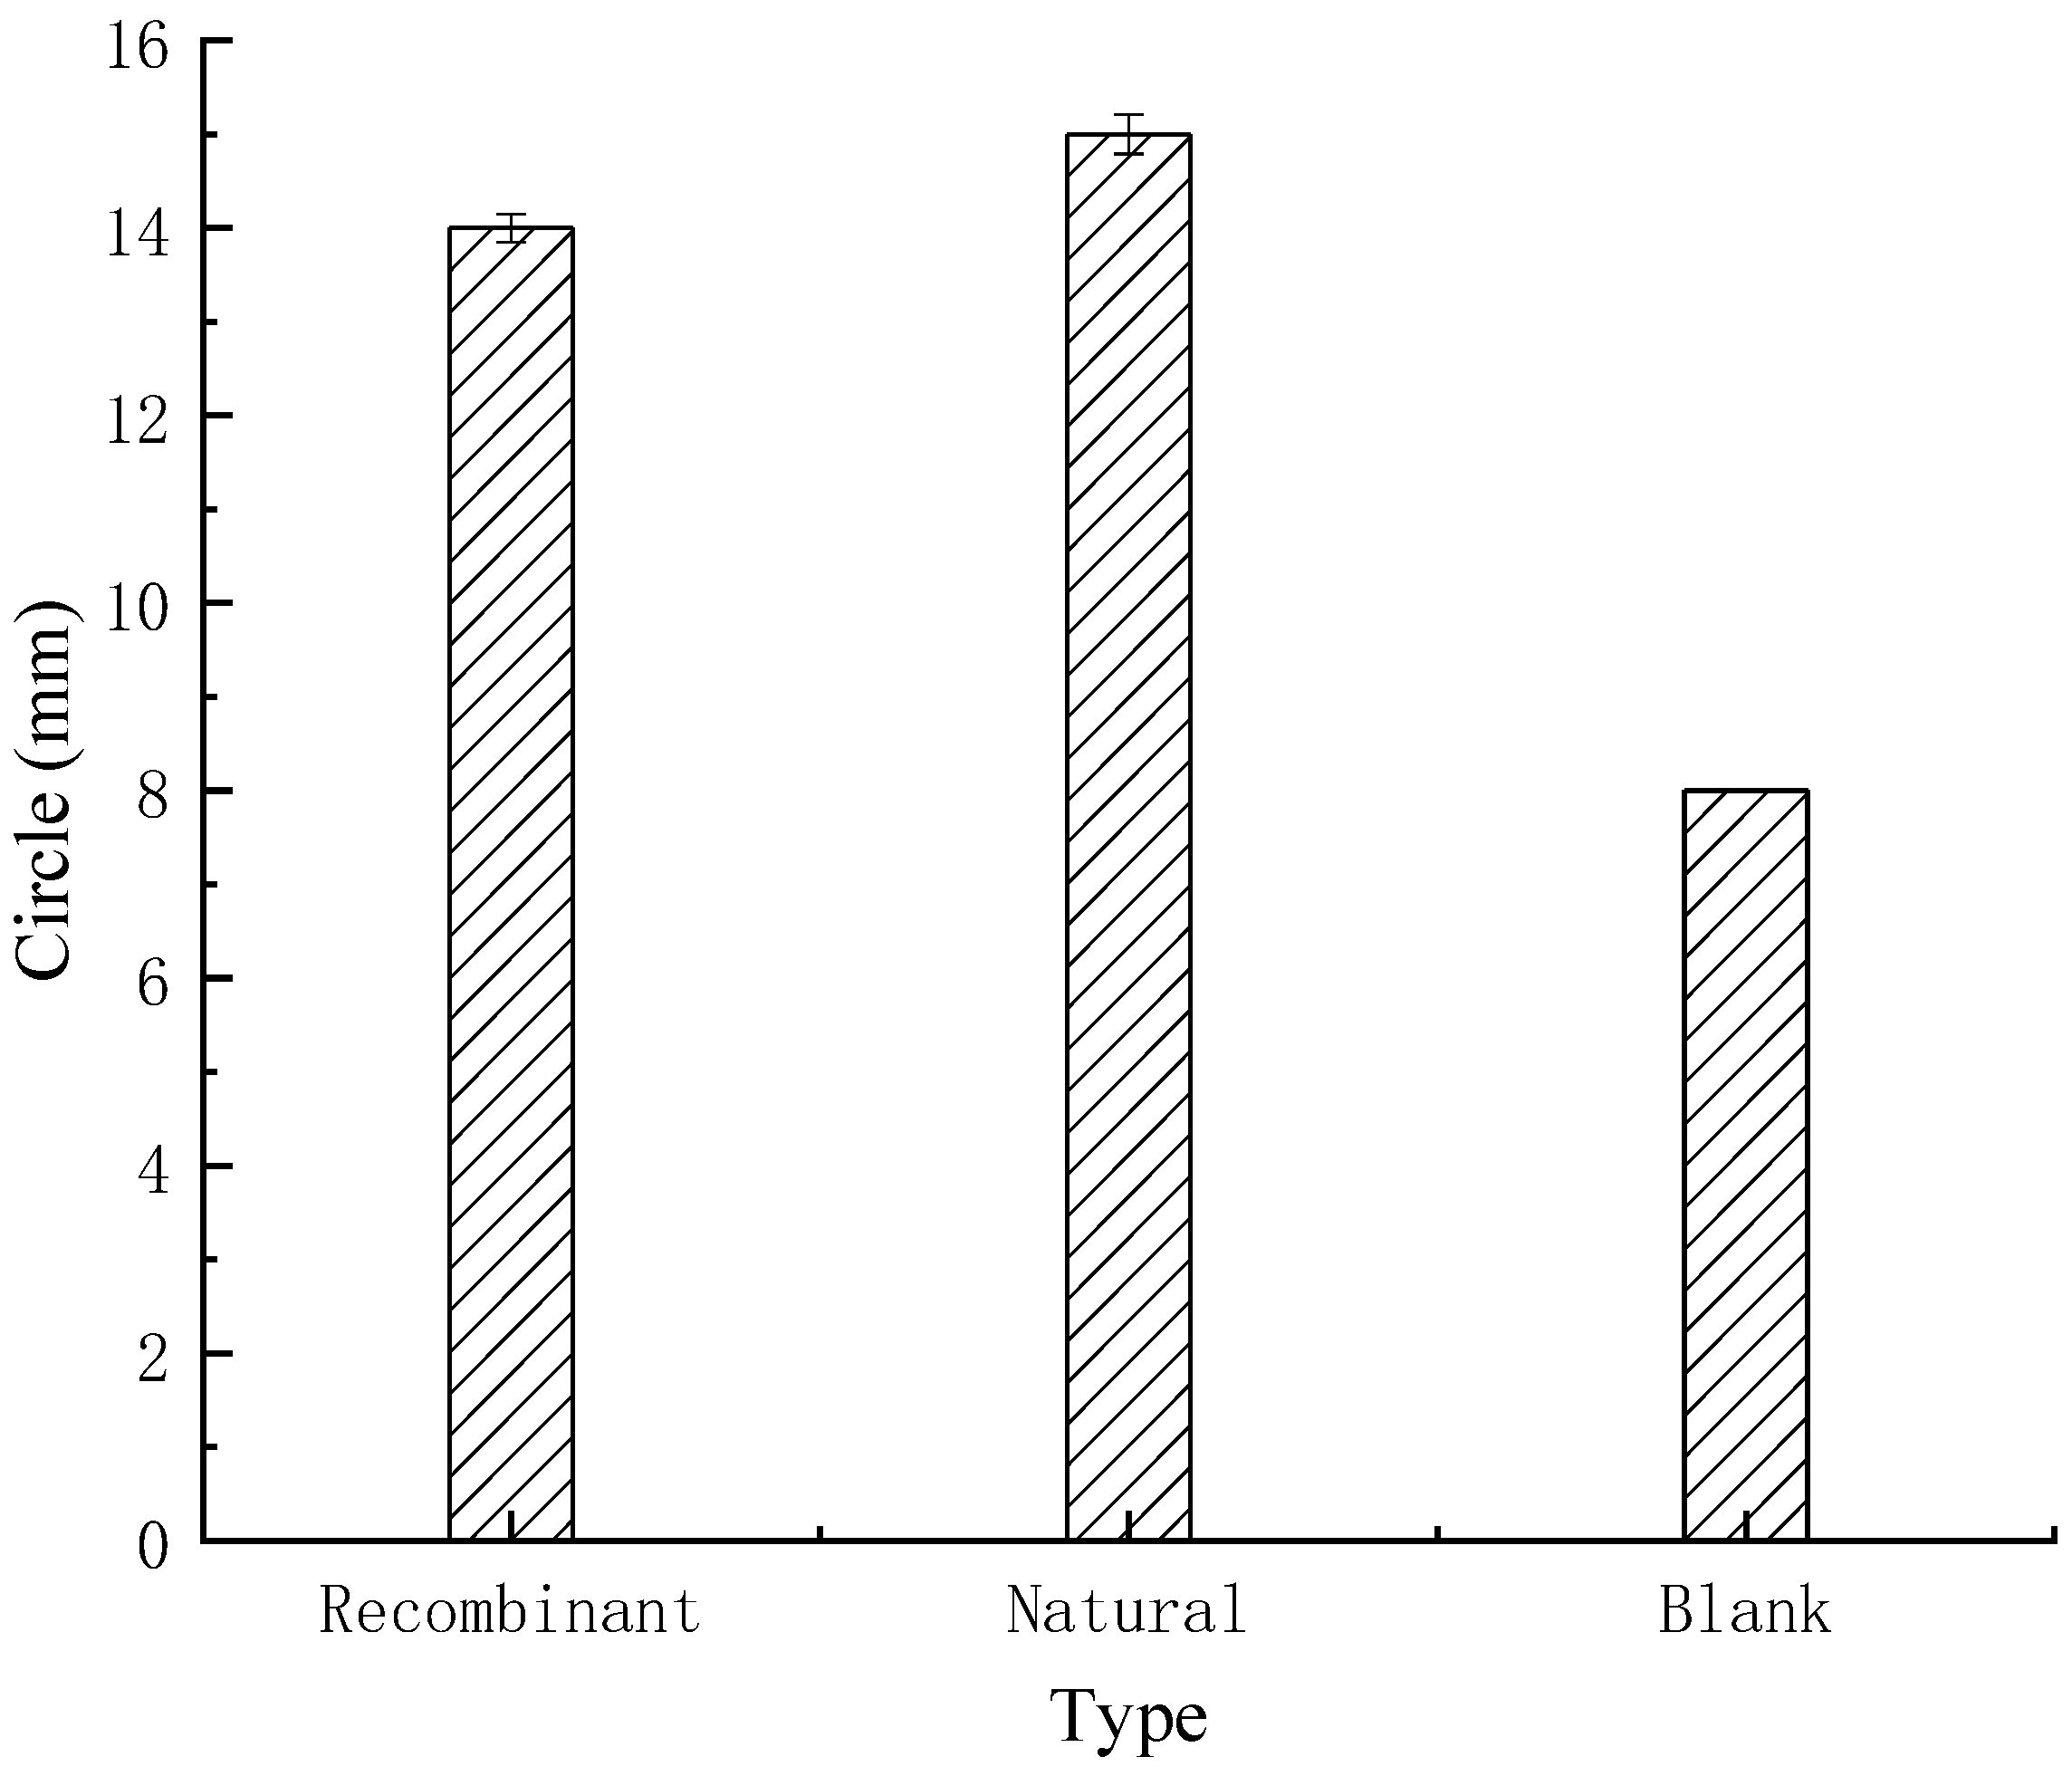
Bacteriostatic Test
2.4. Analysis Method
2.4.1. Calculation of Enzyme Activity
2.4.2. Evaluation Parameters of Membrane Performance
3. Results and Discussion
3.1. Preparation of Feed Solution
3.2. Preliminary Separation
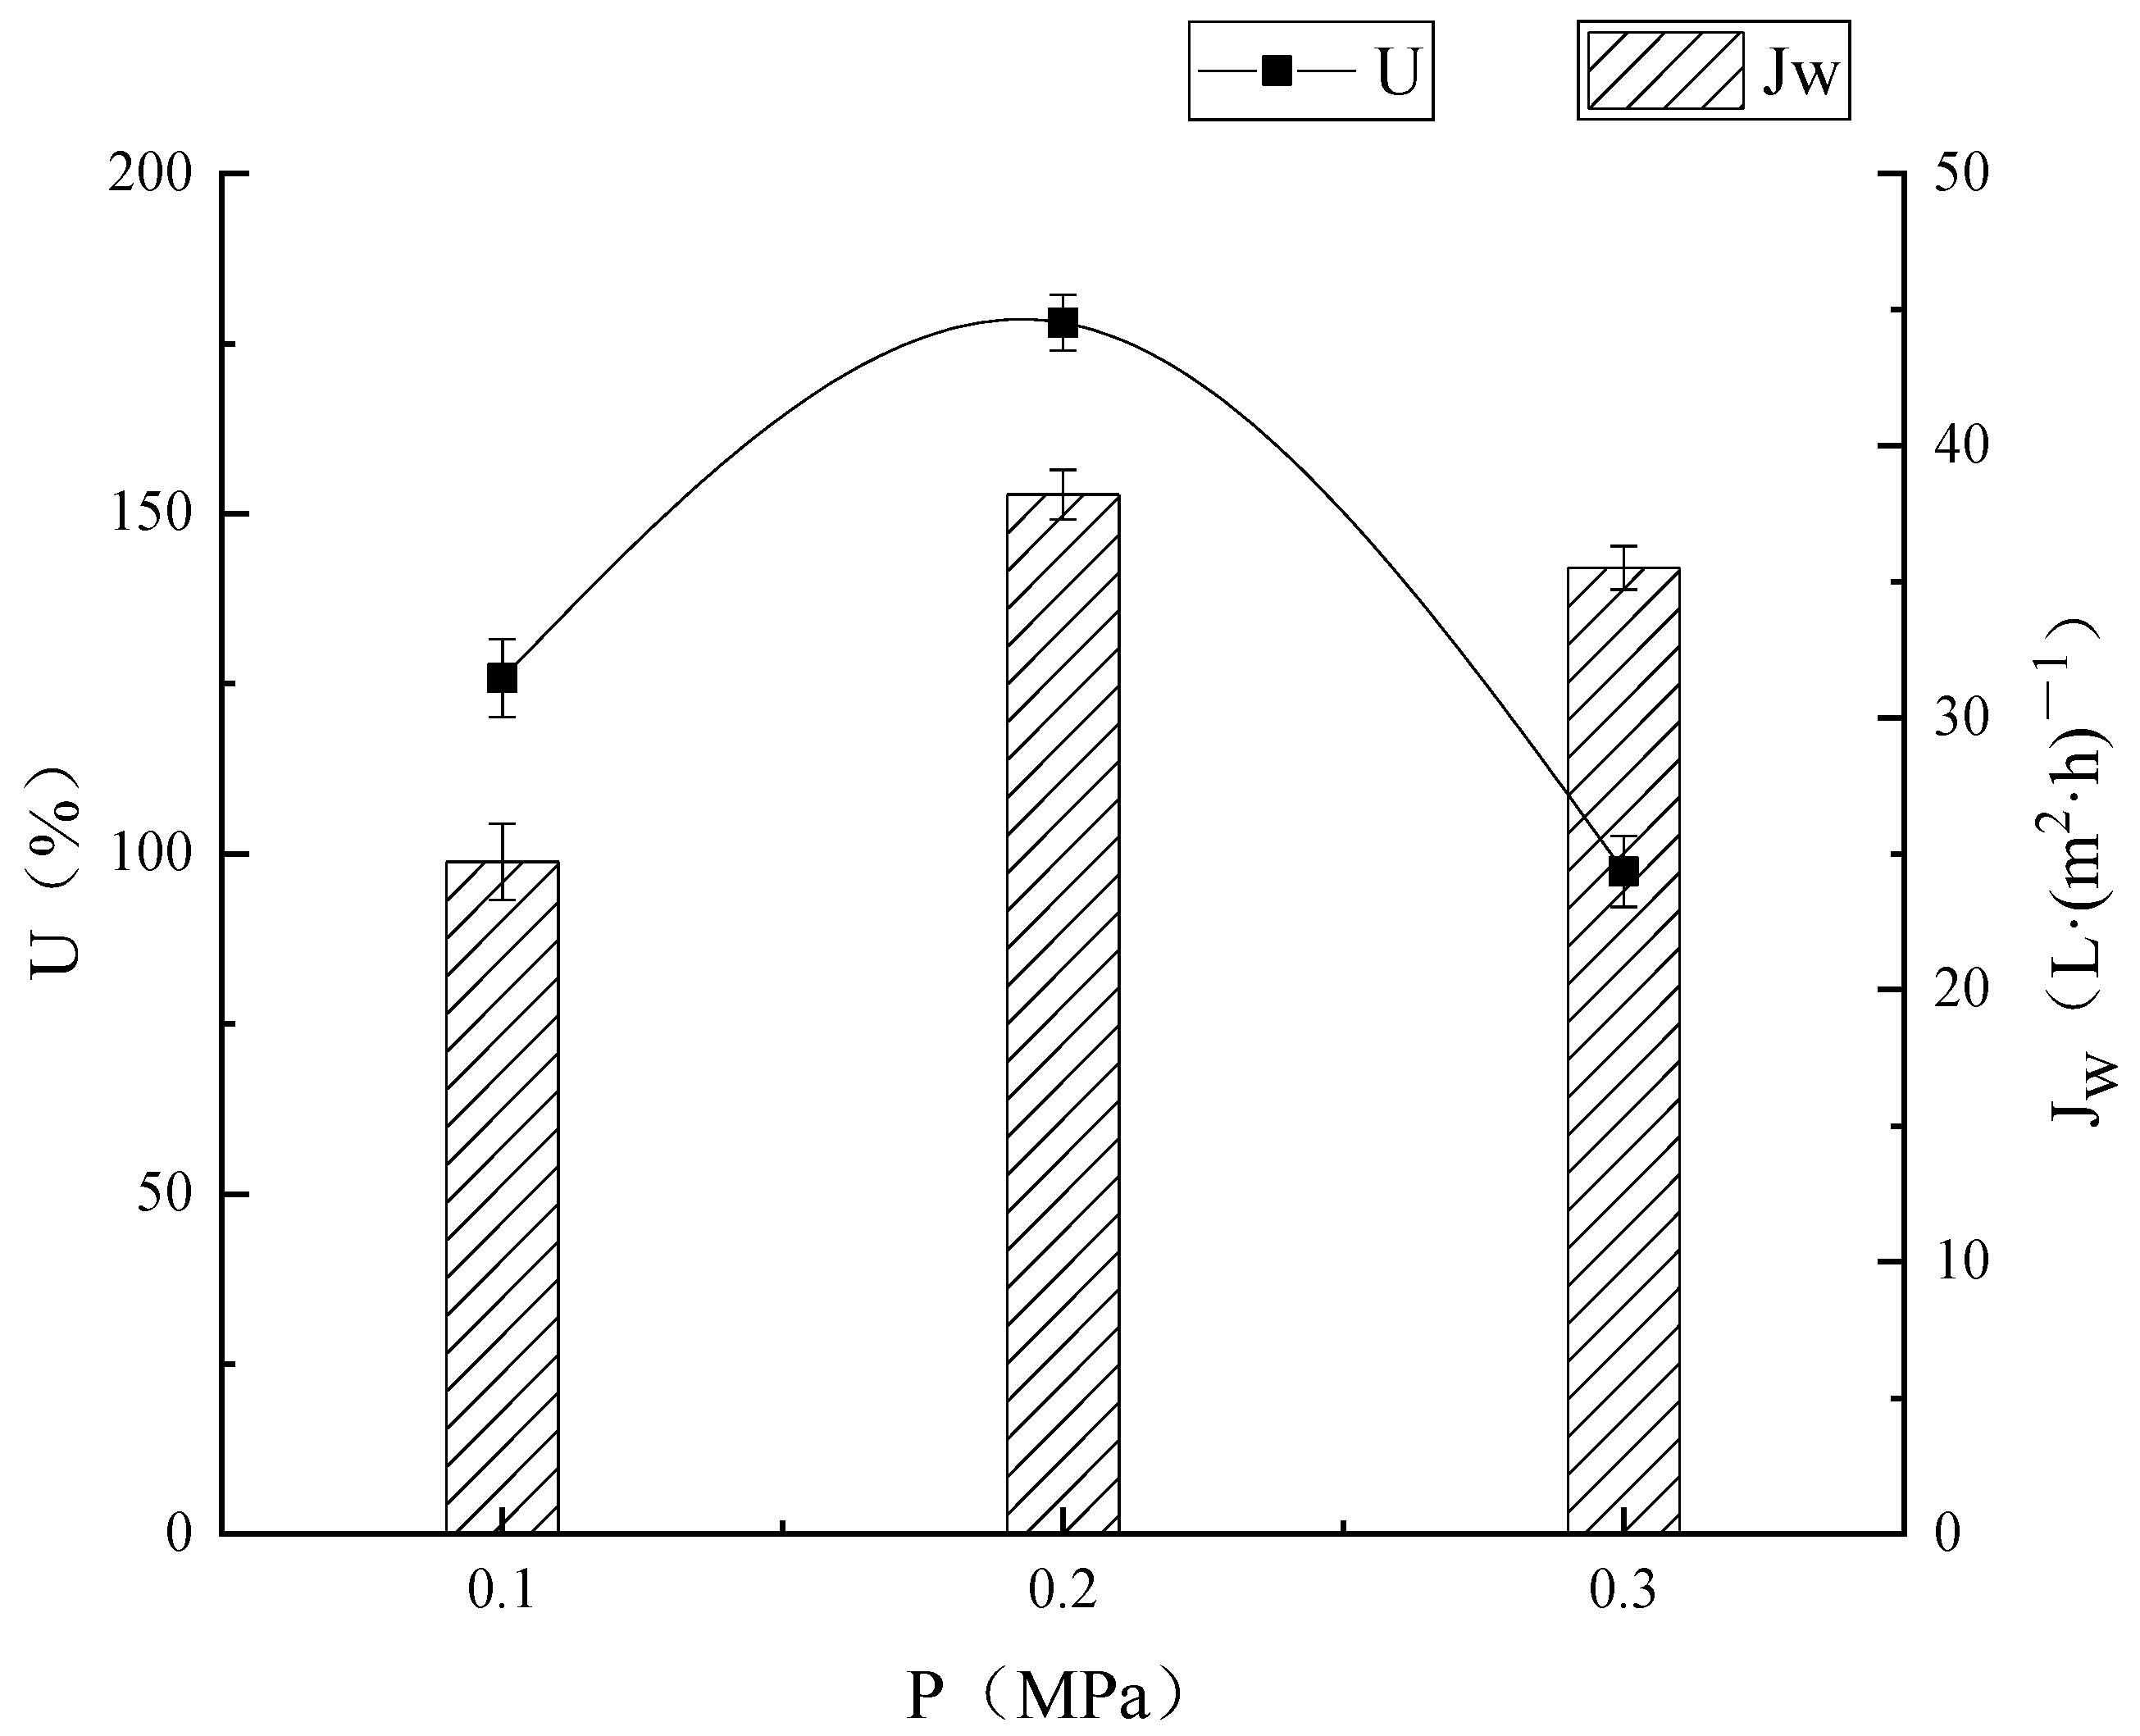
3.2.1. Effect of Transmembrane Pressure on Membrane Separation Effect
Effect of Different Pressures on the Extraction of Microbial Enzymes
Effect of Different Pressures on Membrane Flux
Effect of Different Pressures on Ultrafiltration
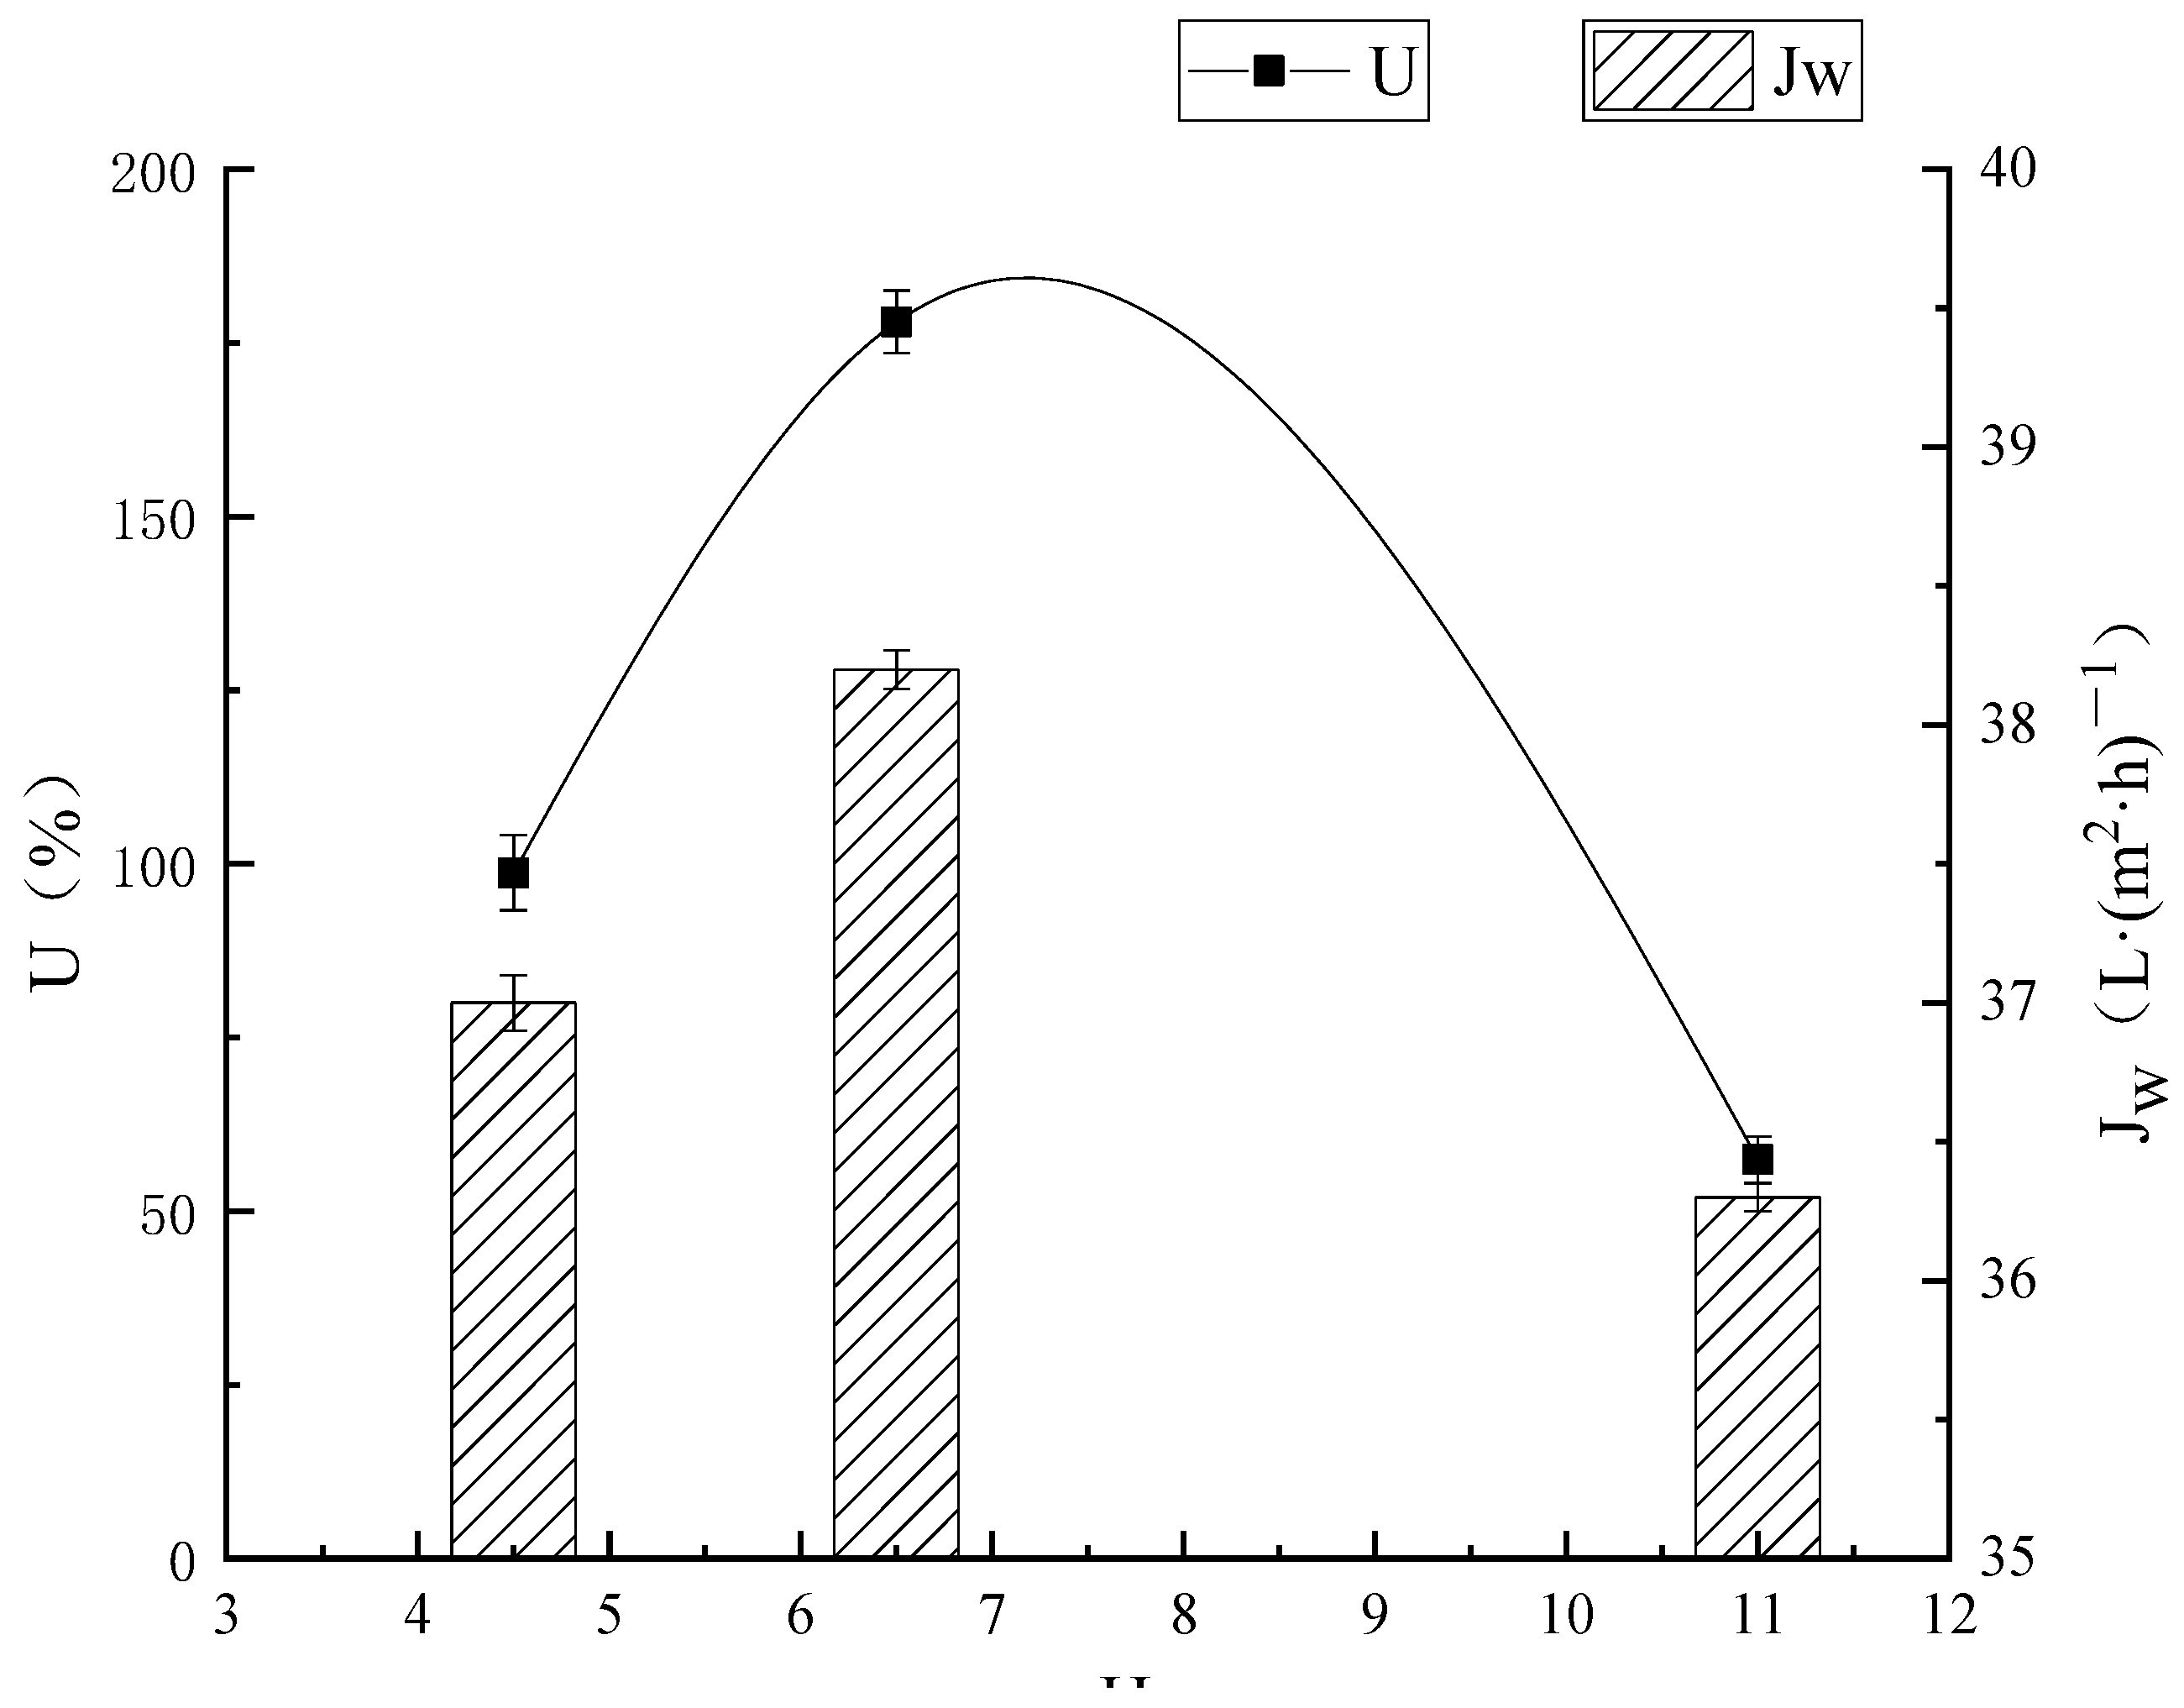
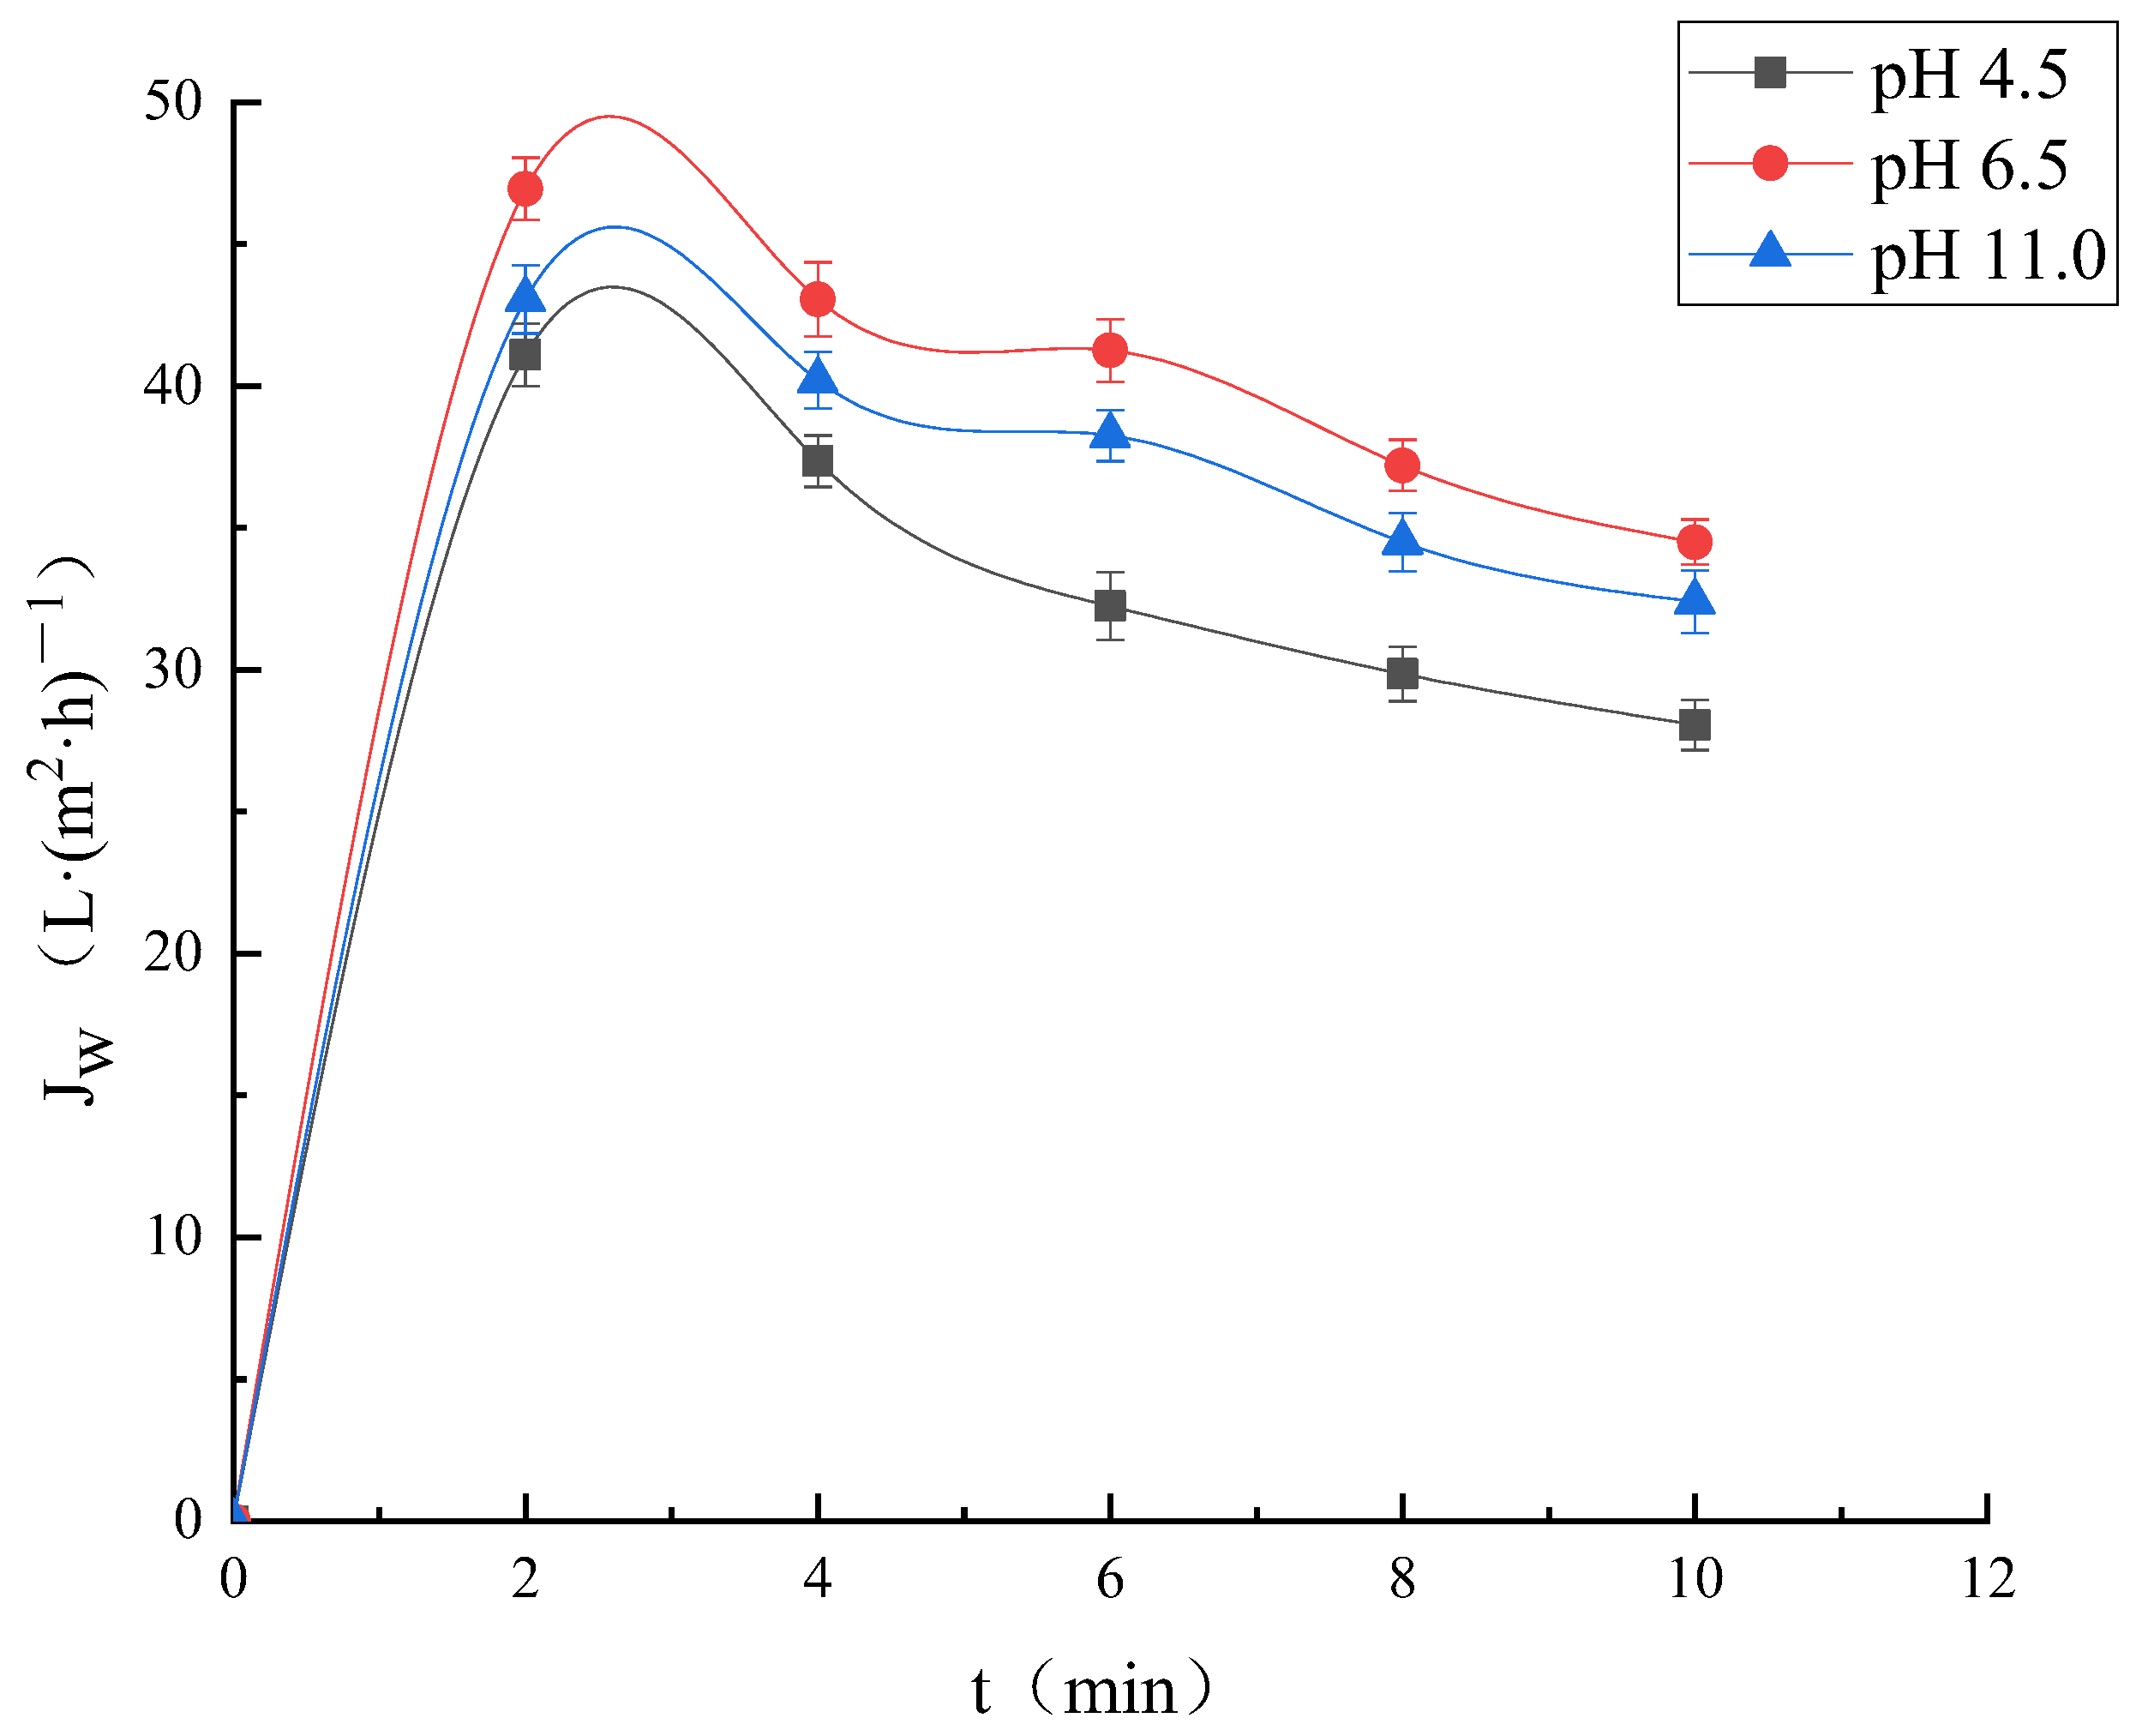
3.2.2. Effect of pH on Membrane Separation Effect
Effect of Different pH Values on the Extraction of Lysozyme
Effect of Different pH on Ultrafiltration Membrane Flux
Effect of Different pH Values on Ultrafiltration
3.3. Ion Exchange Chromatography
3.3.1. Single Factor Experiment
Ratio of Resin Dosage to Liquid Volume
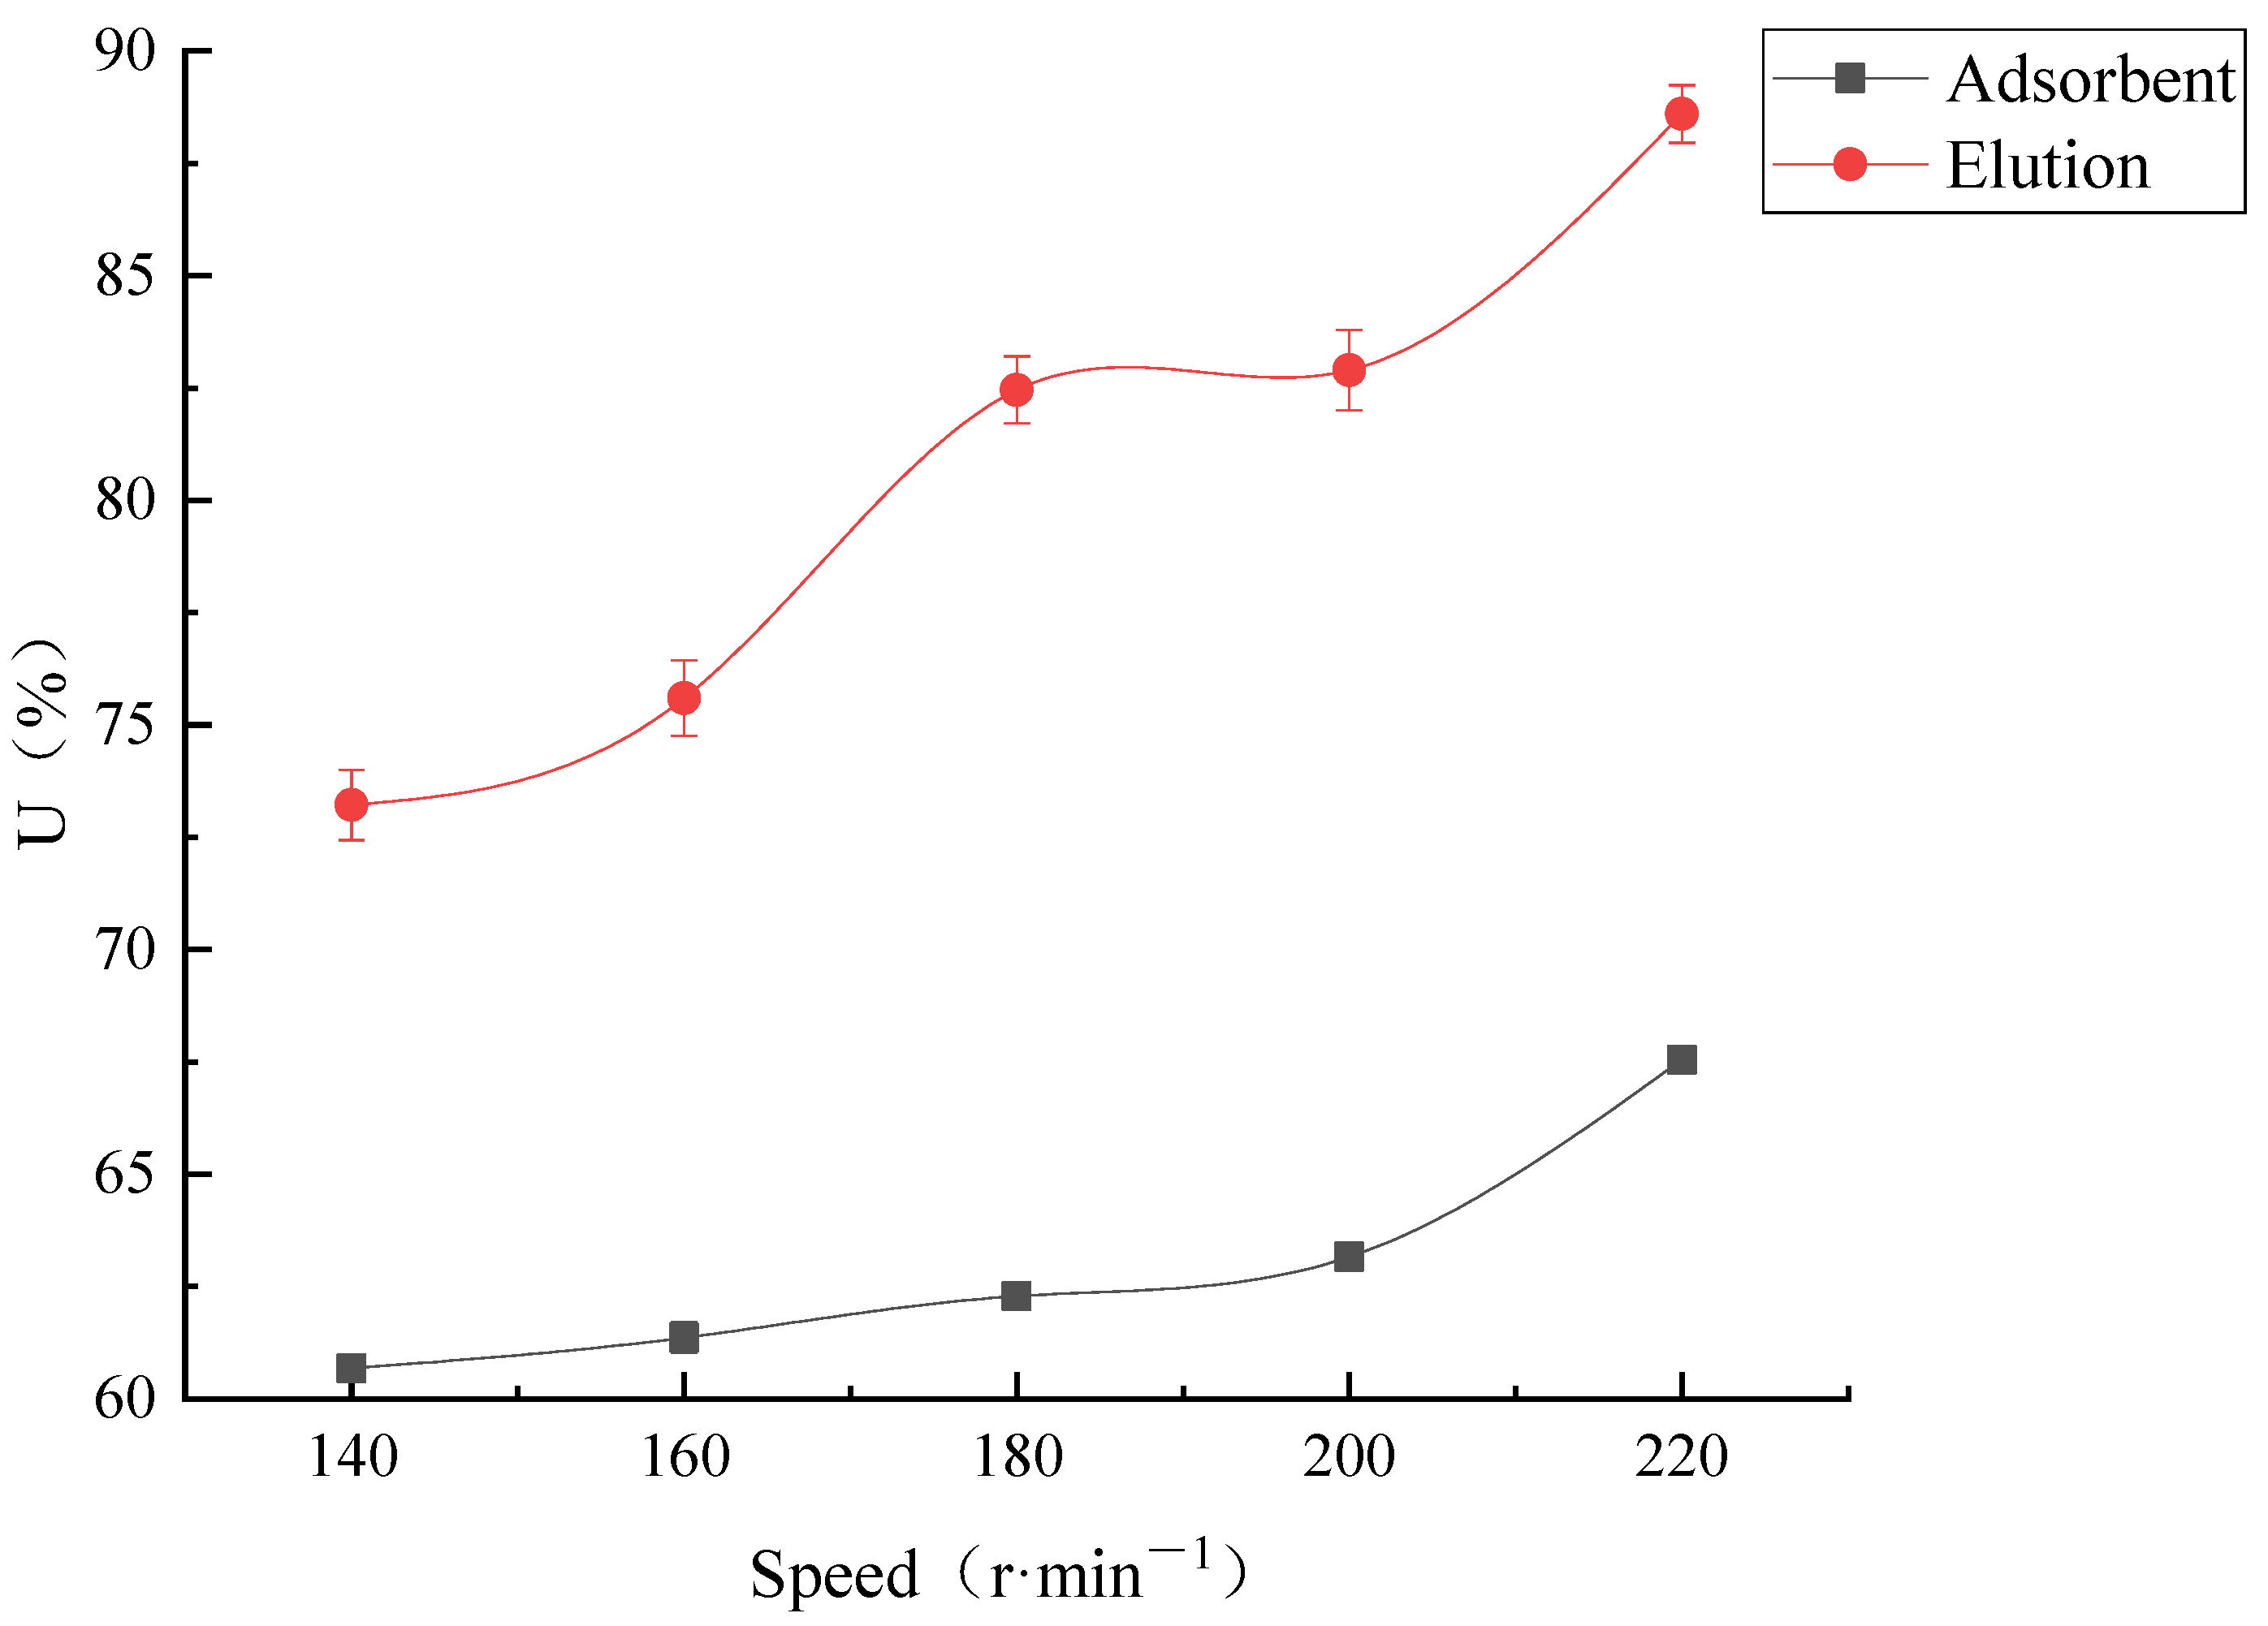
Stirring Speed
pH
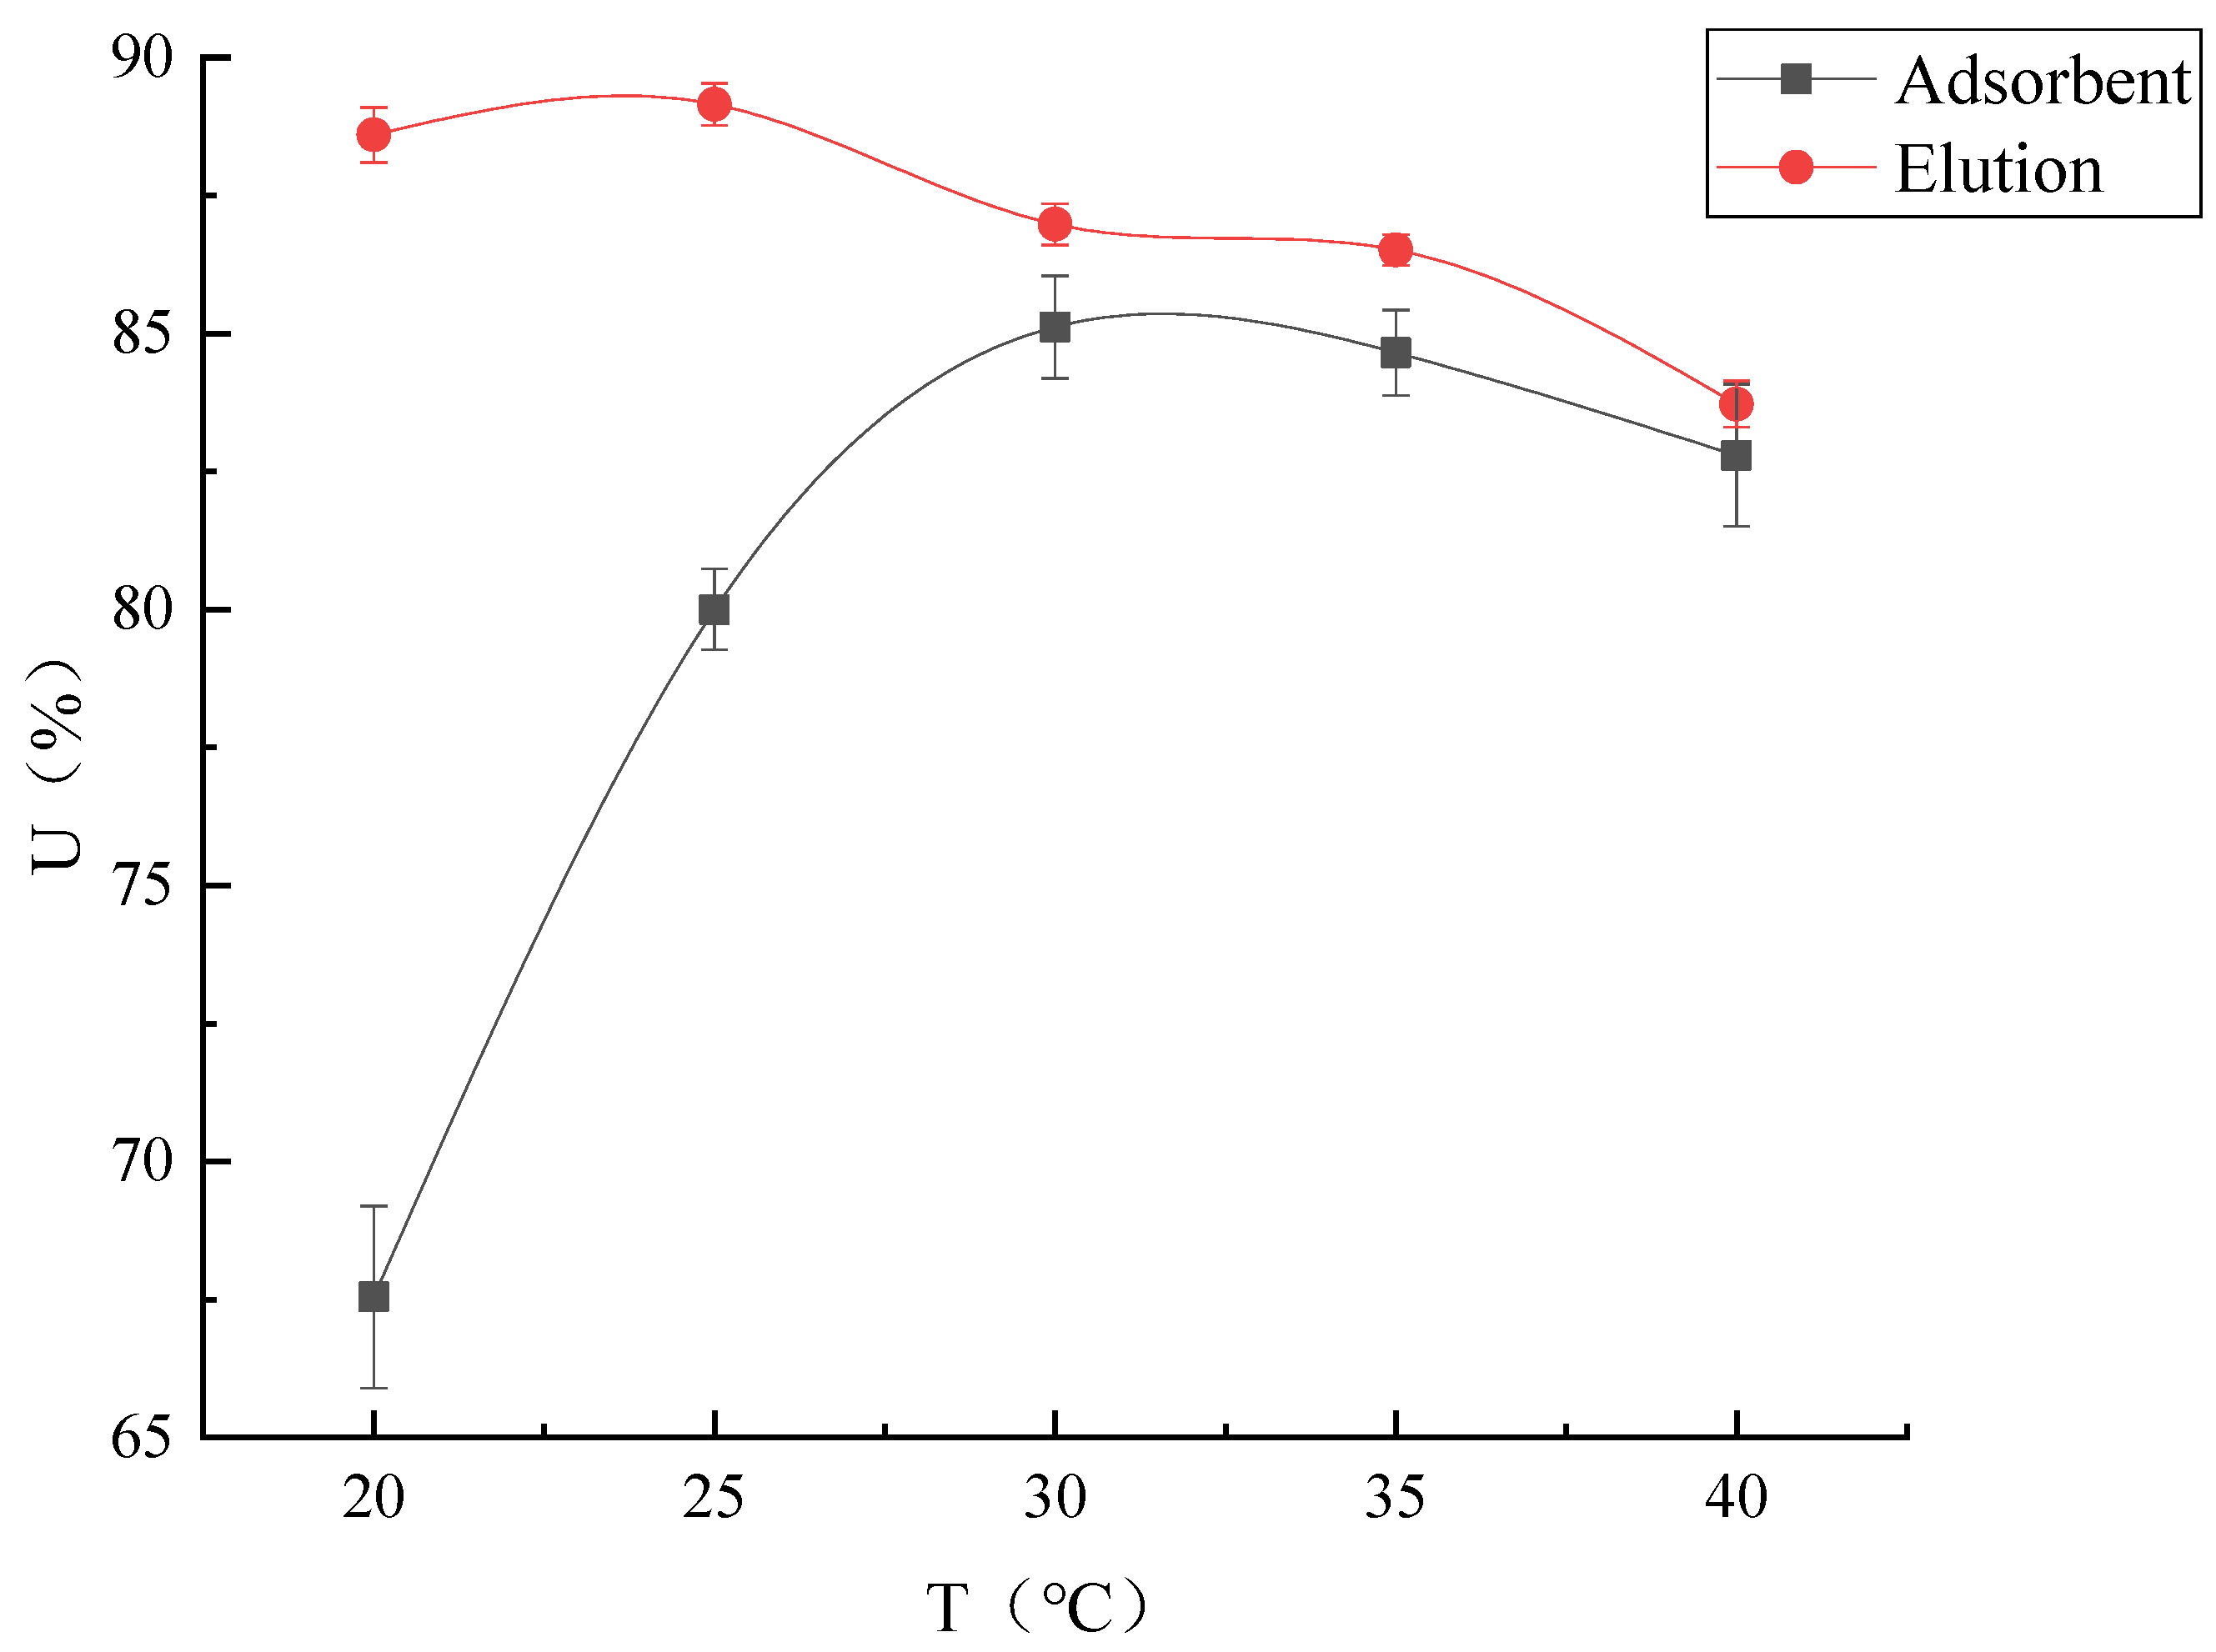
Temperature
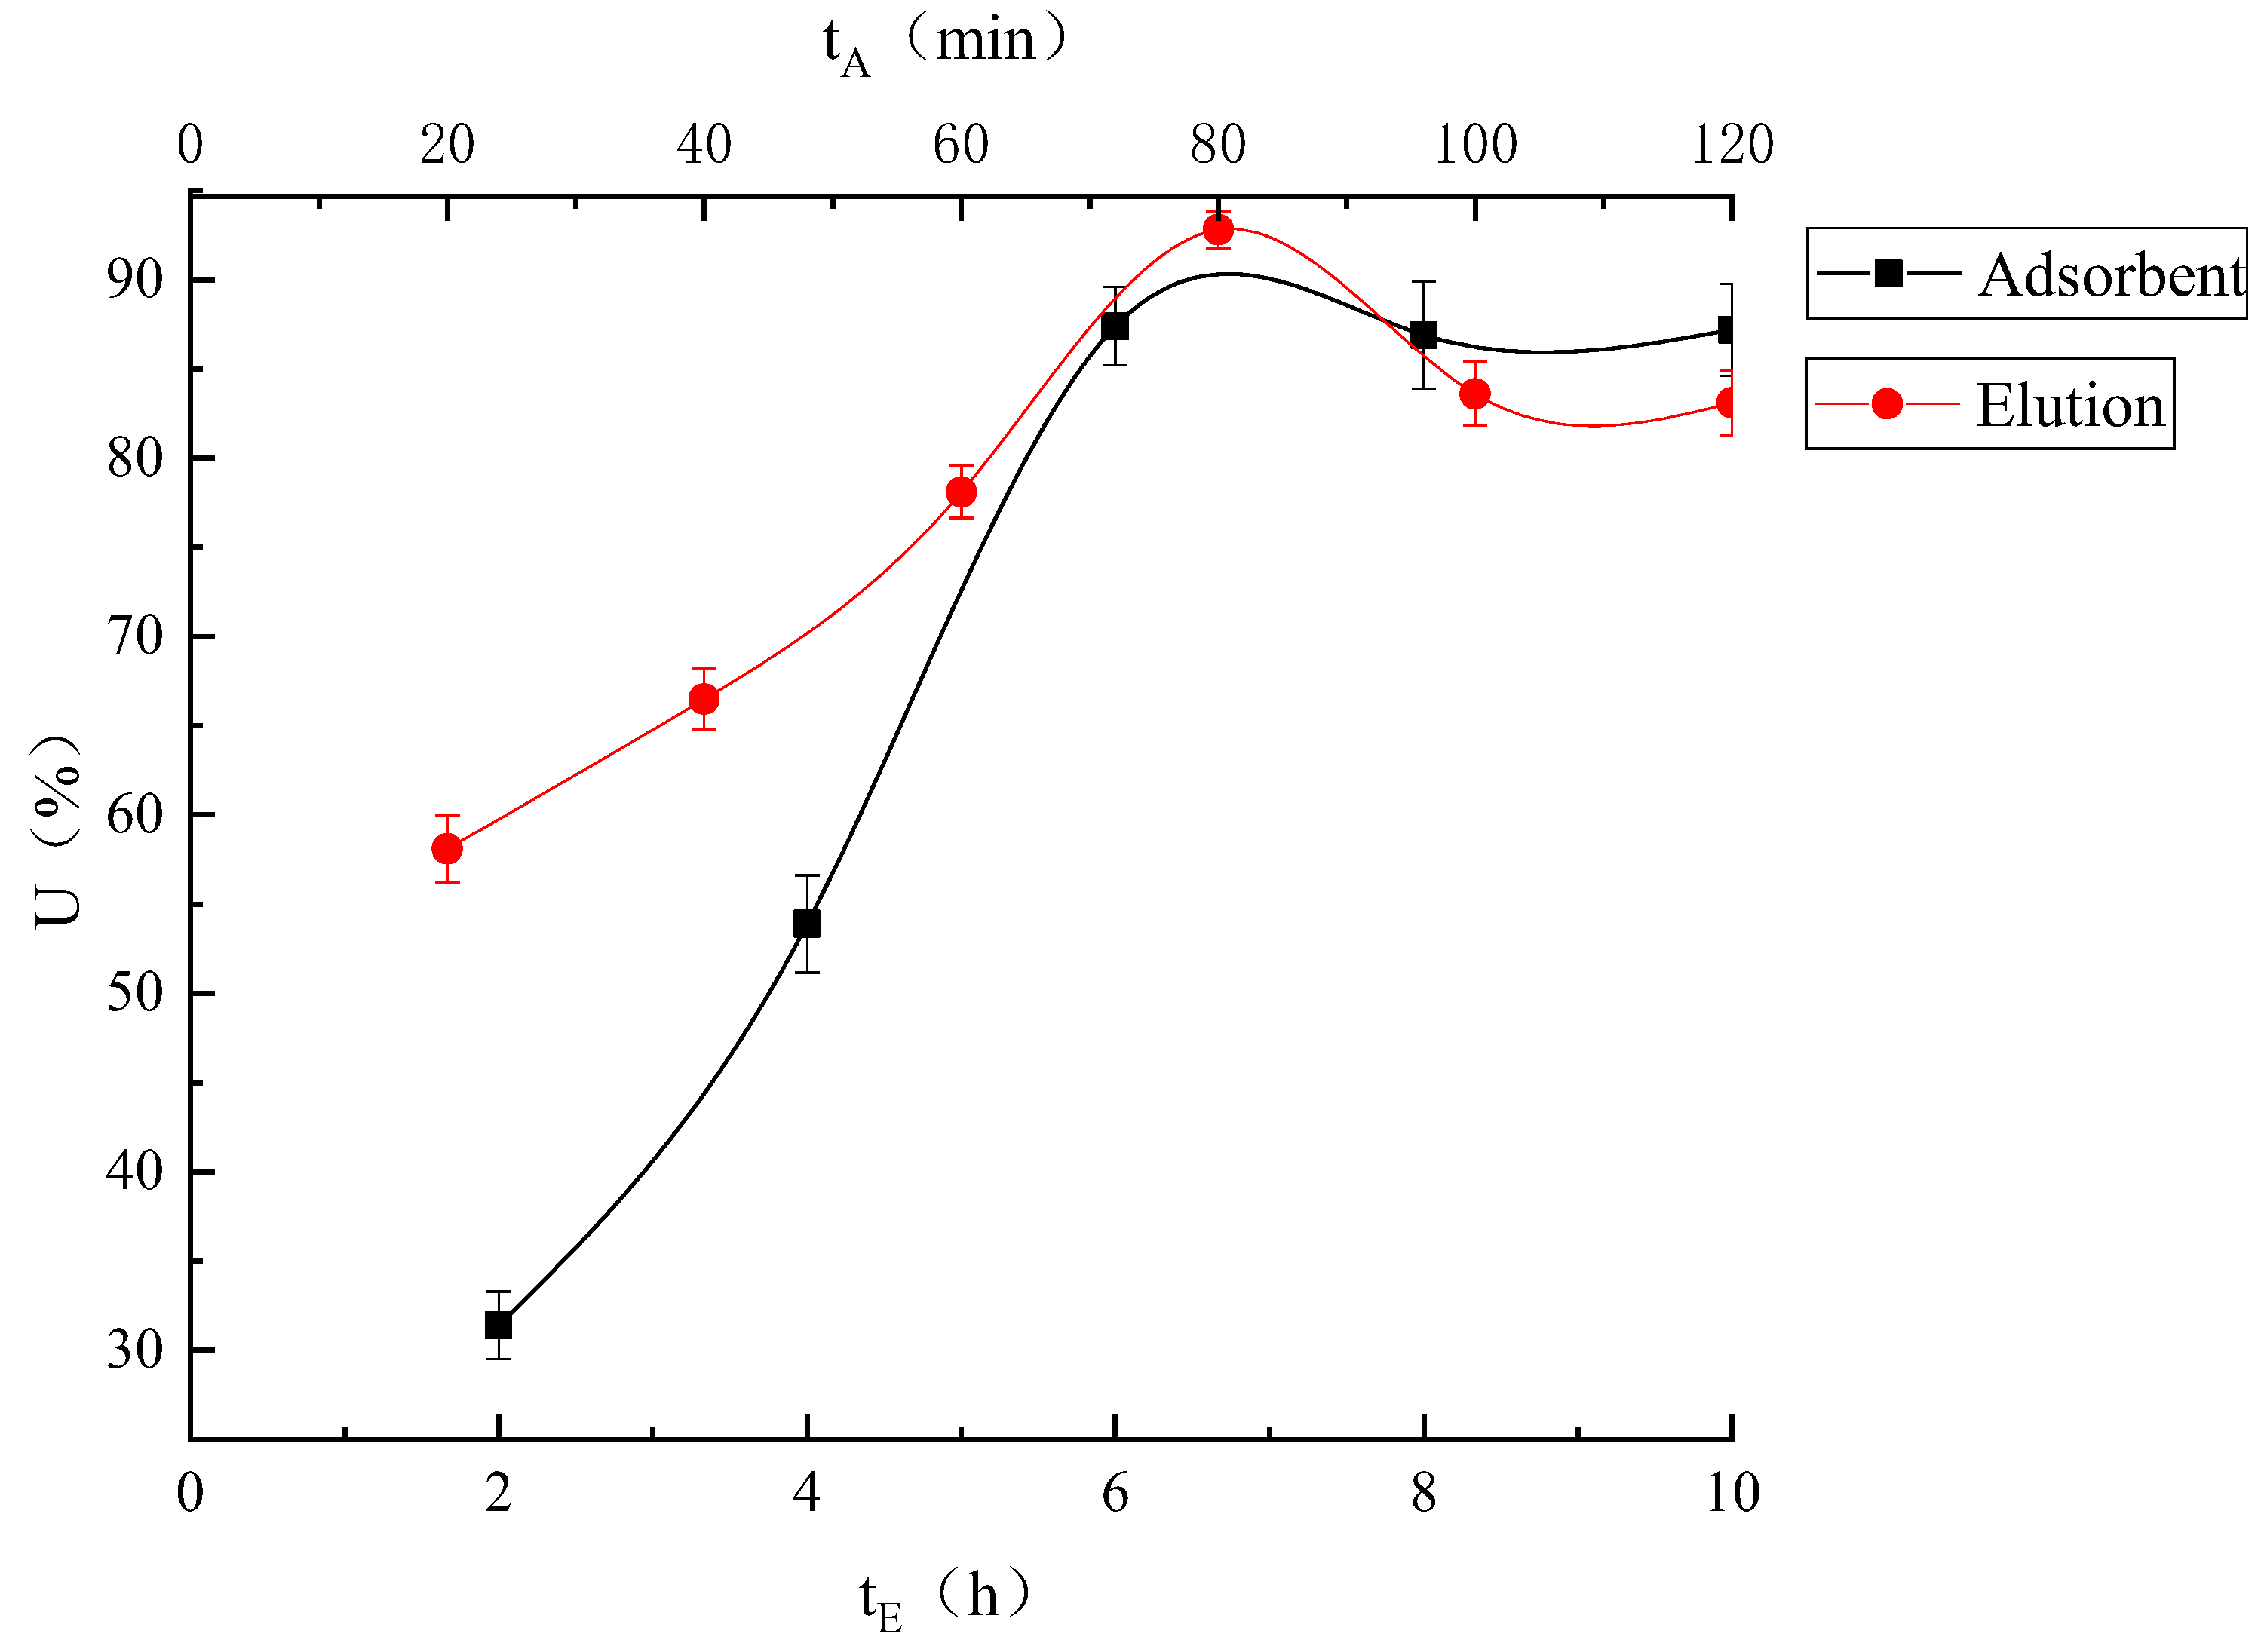
Processing Time
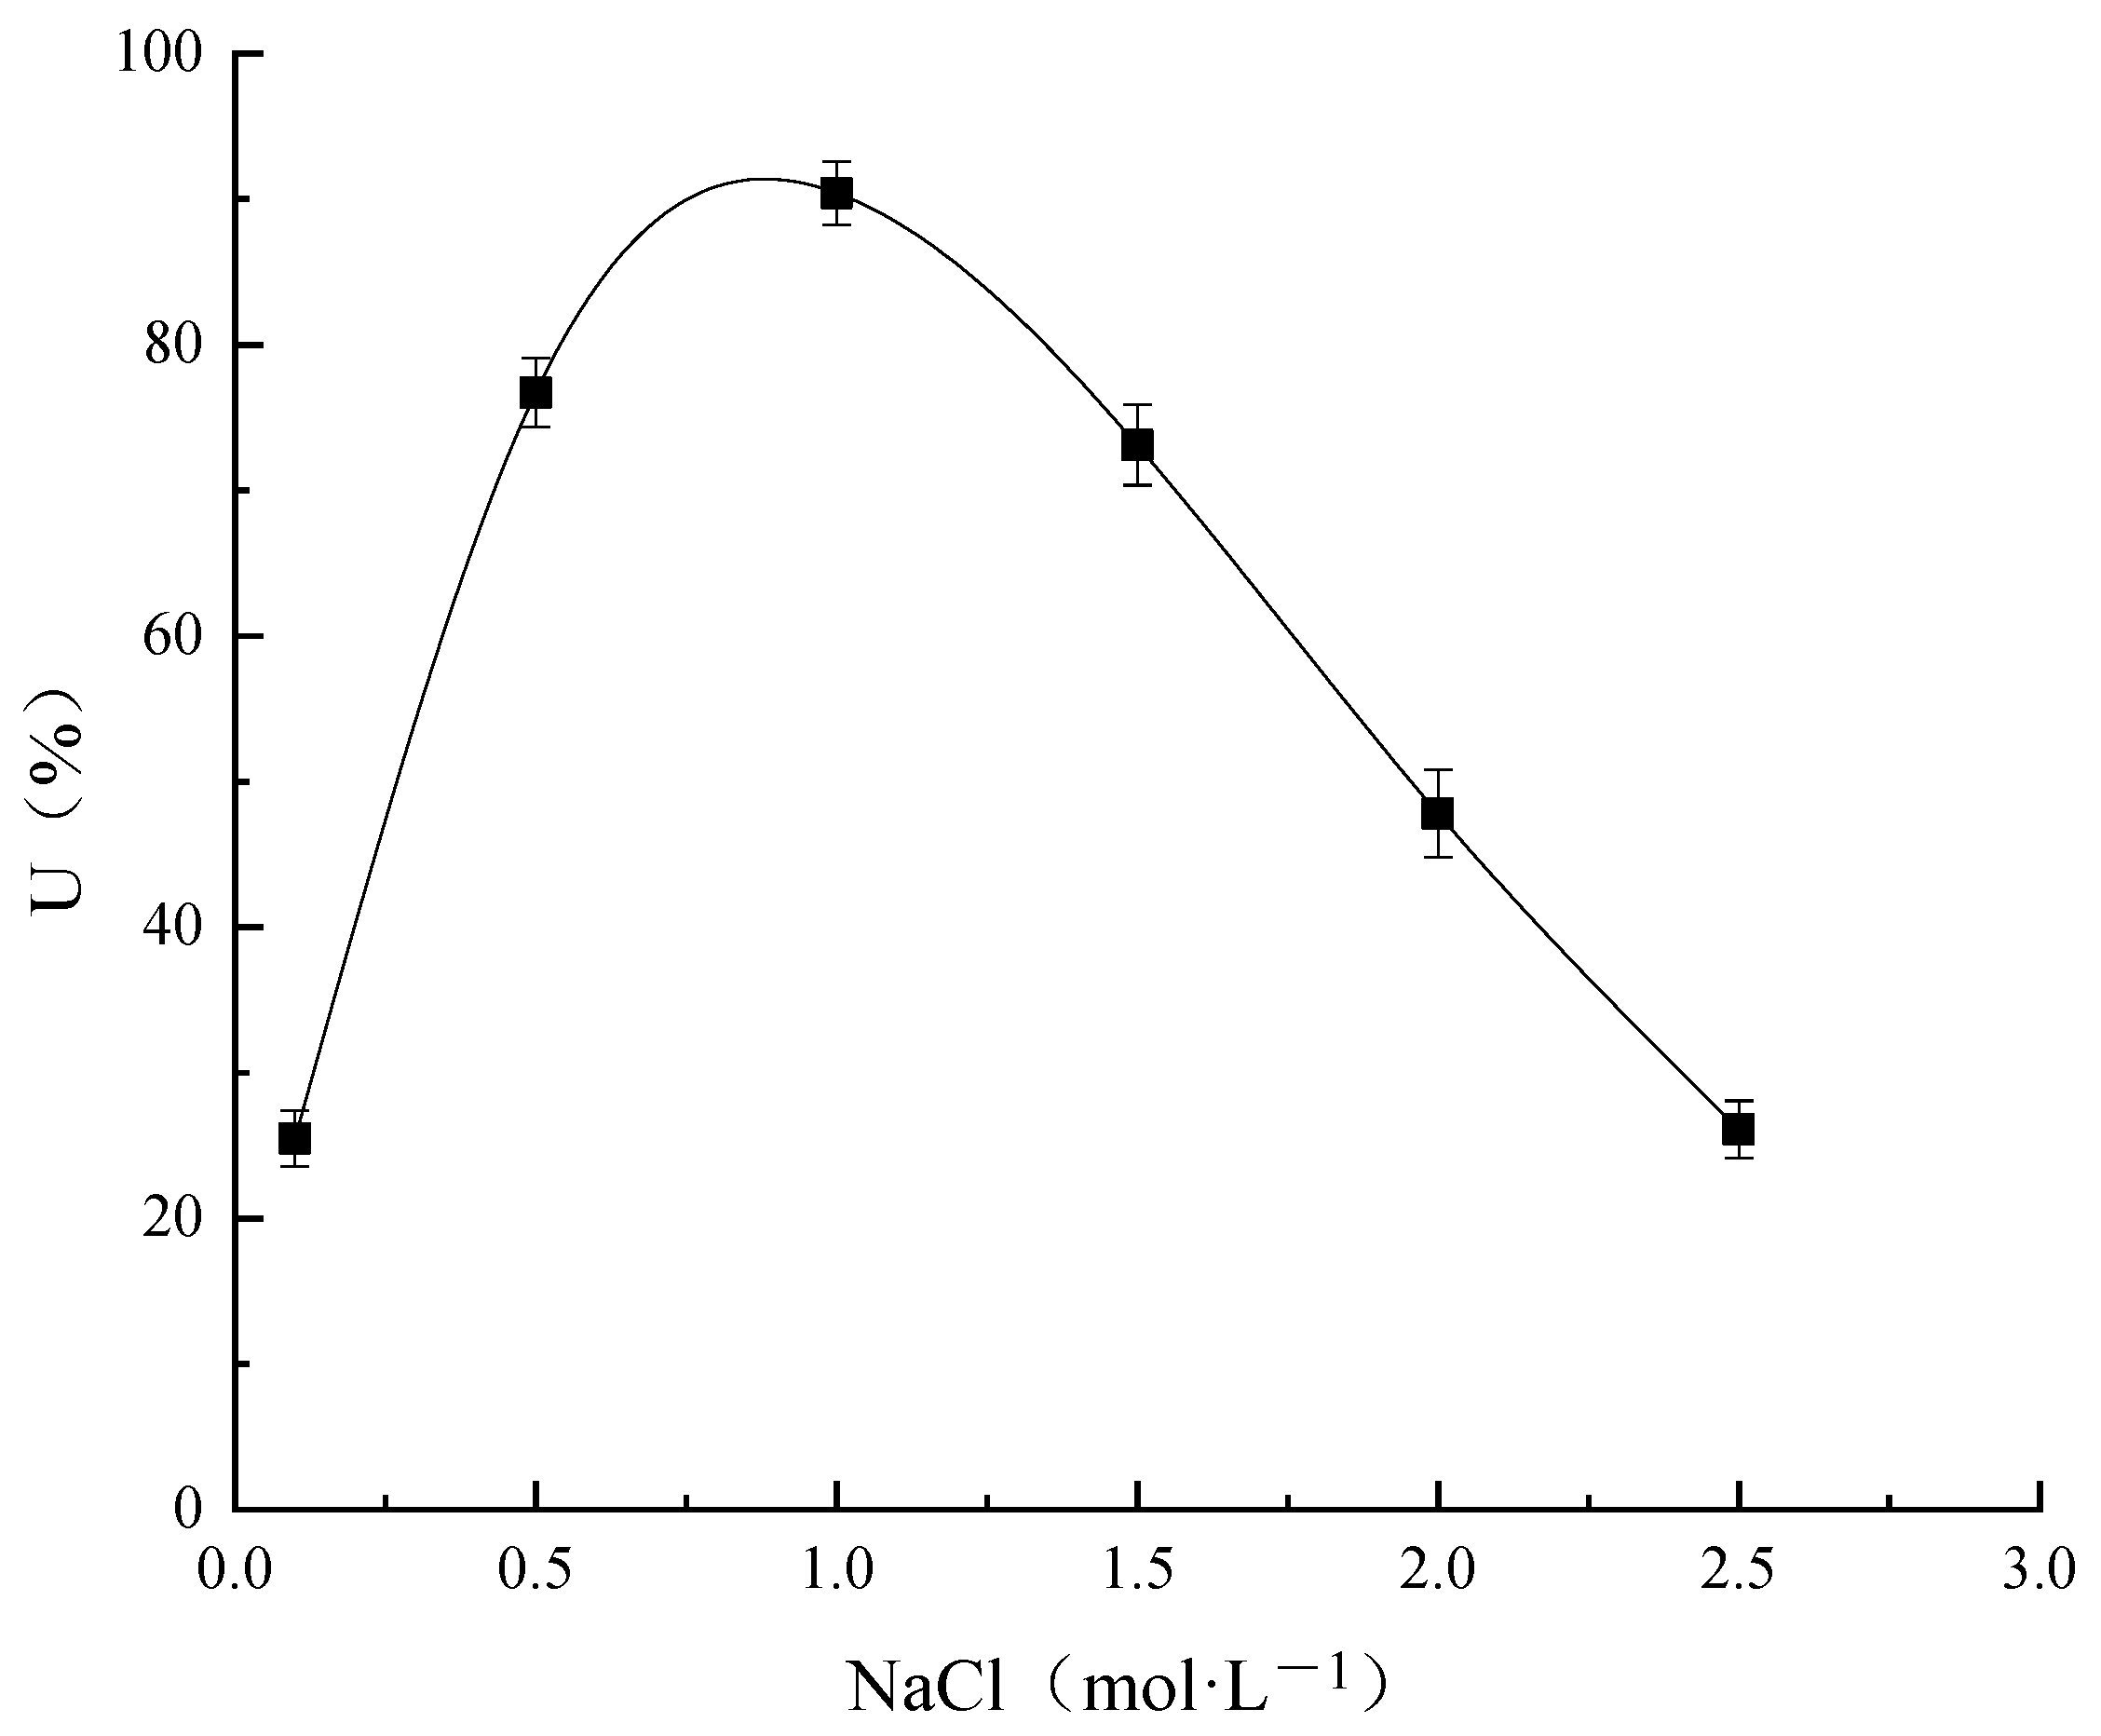
NaCl Concentration
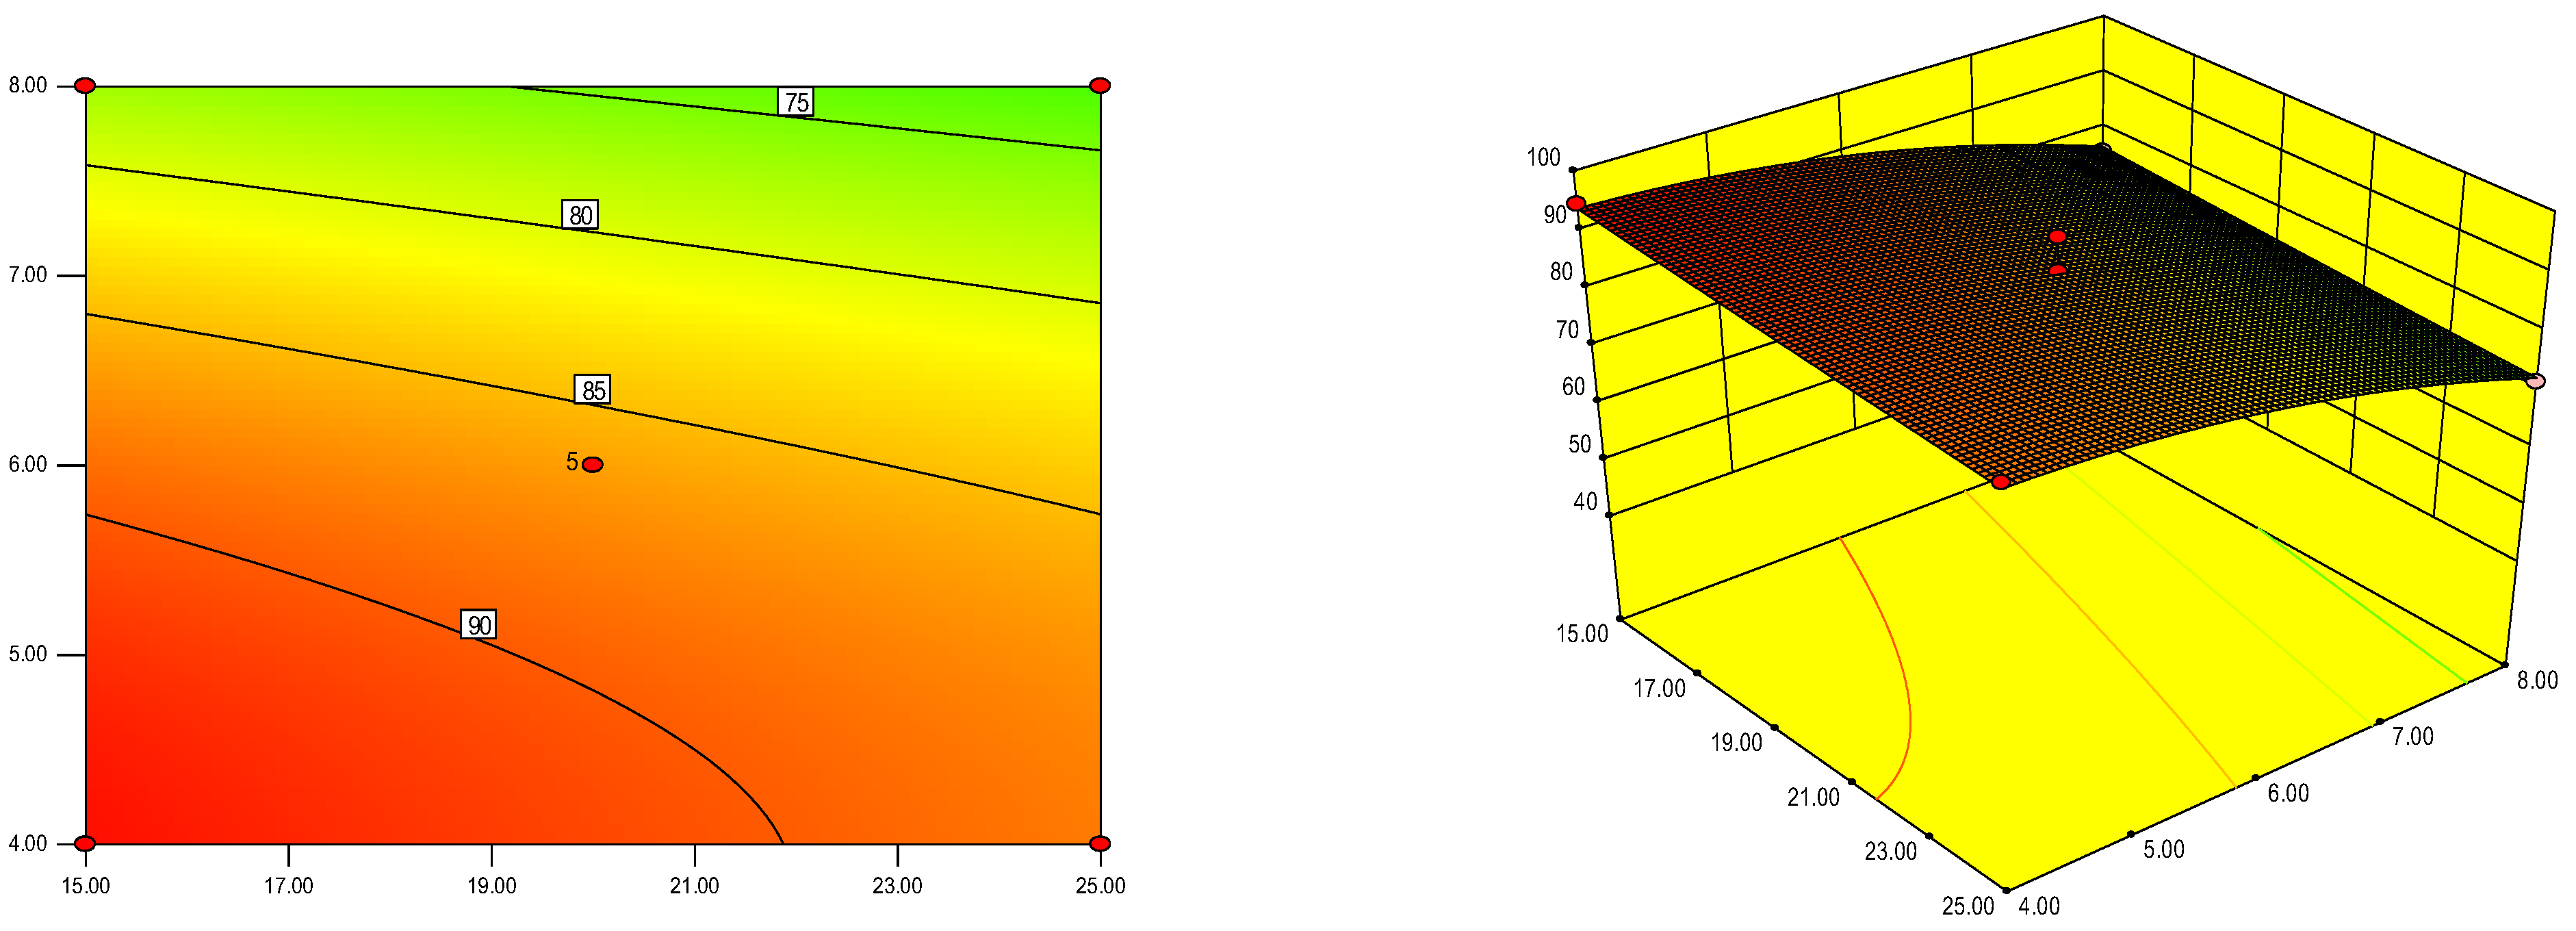
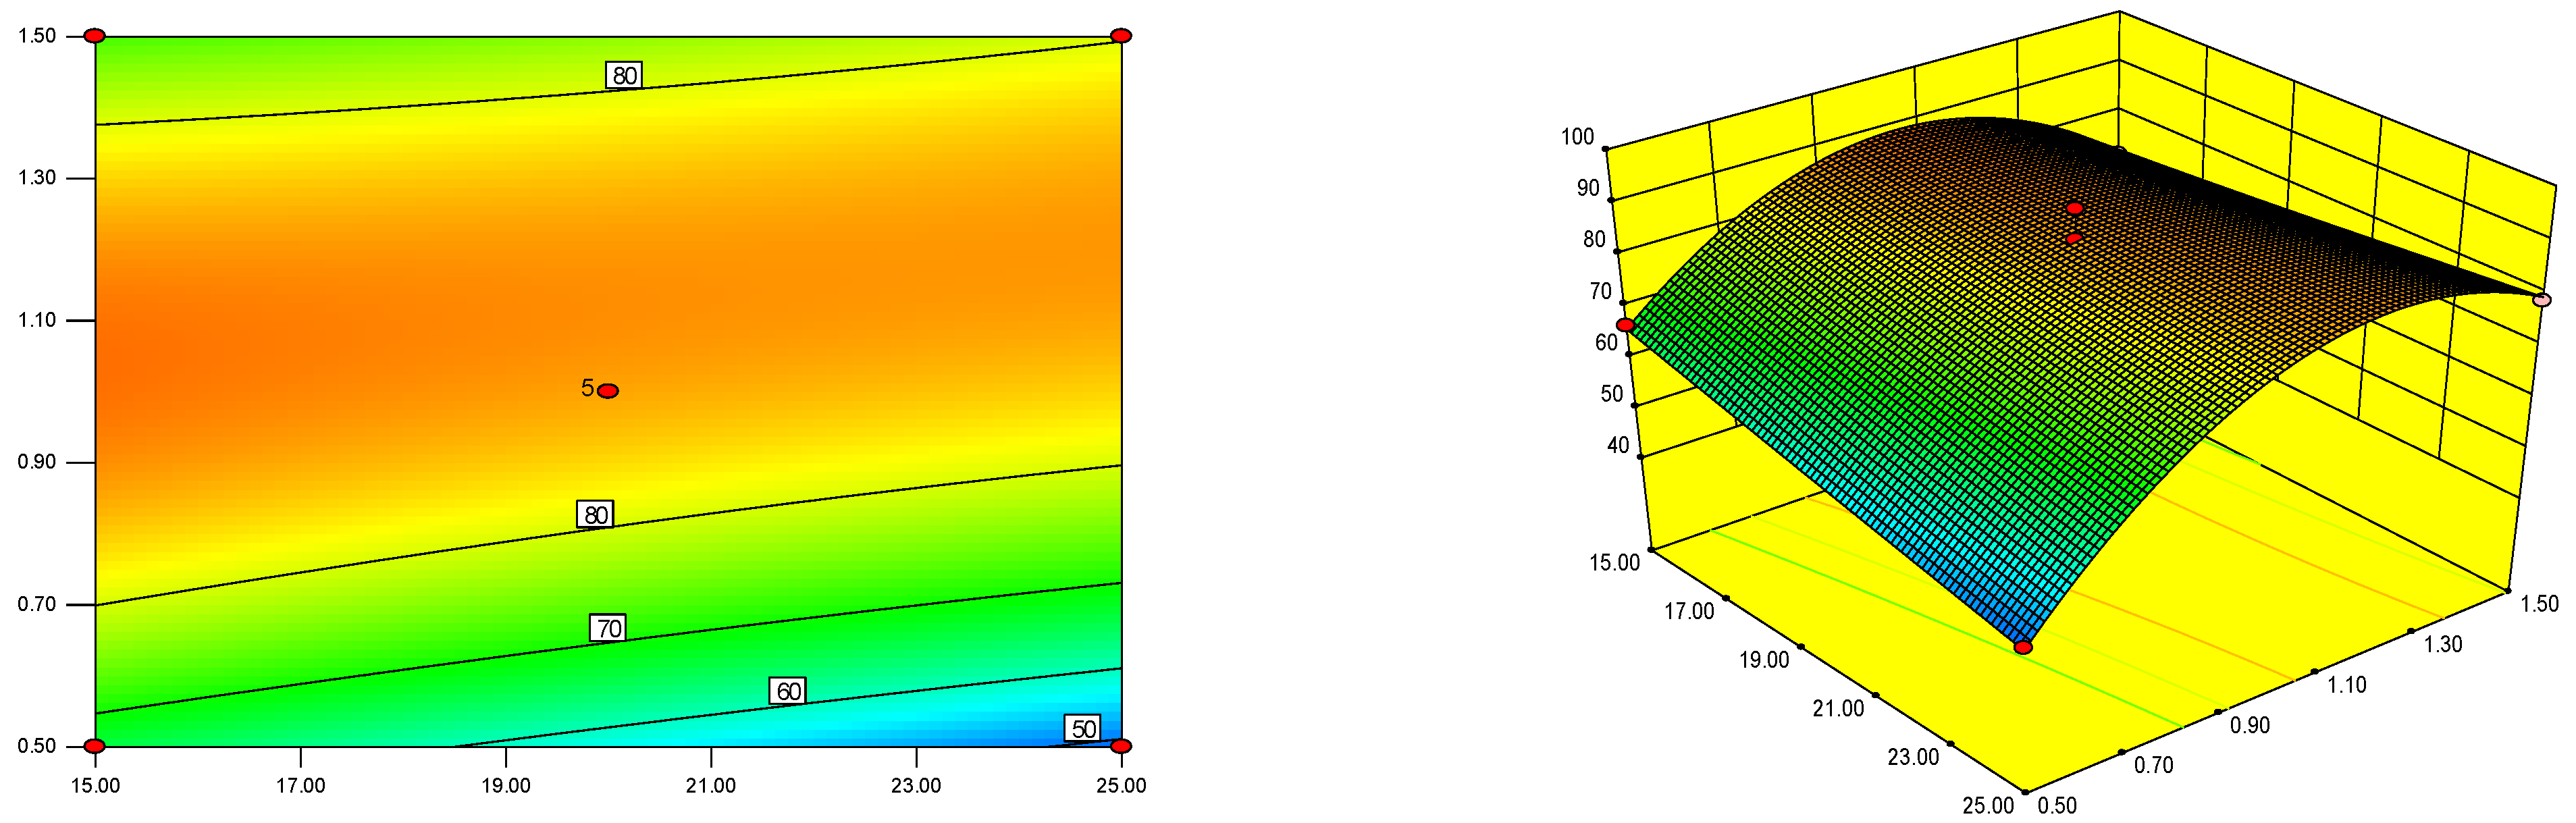
3.3.2. Orthogonal Experiment
Establishment of Regression Model
Regression Model Analysis
Validation Experiment
3.4. Preparation of Dry Enzyme Powder
3.4.1. Enzymatic Property Test
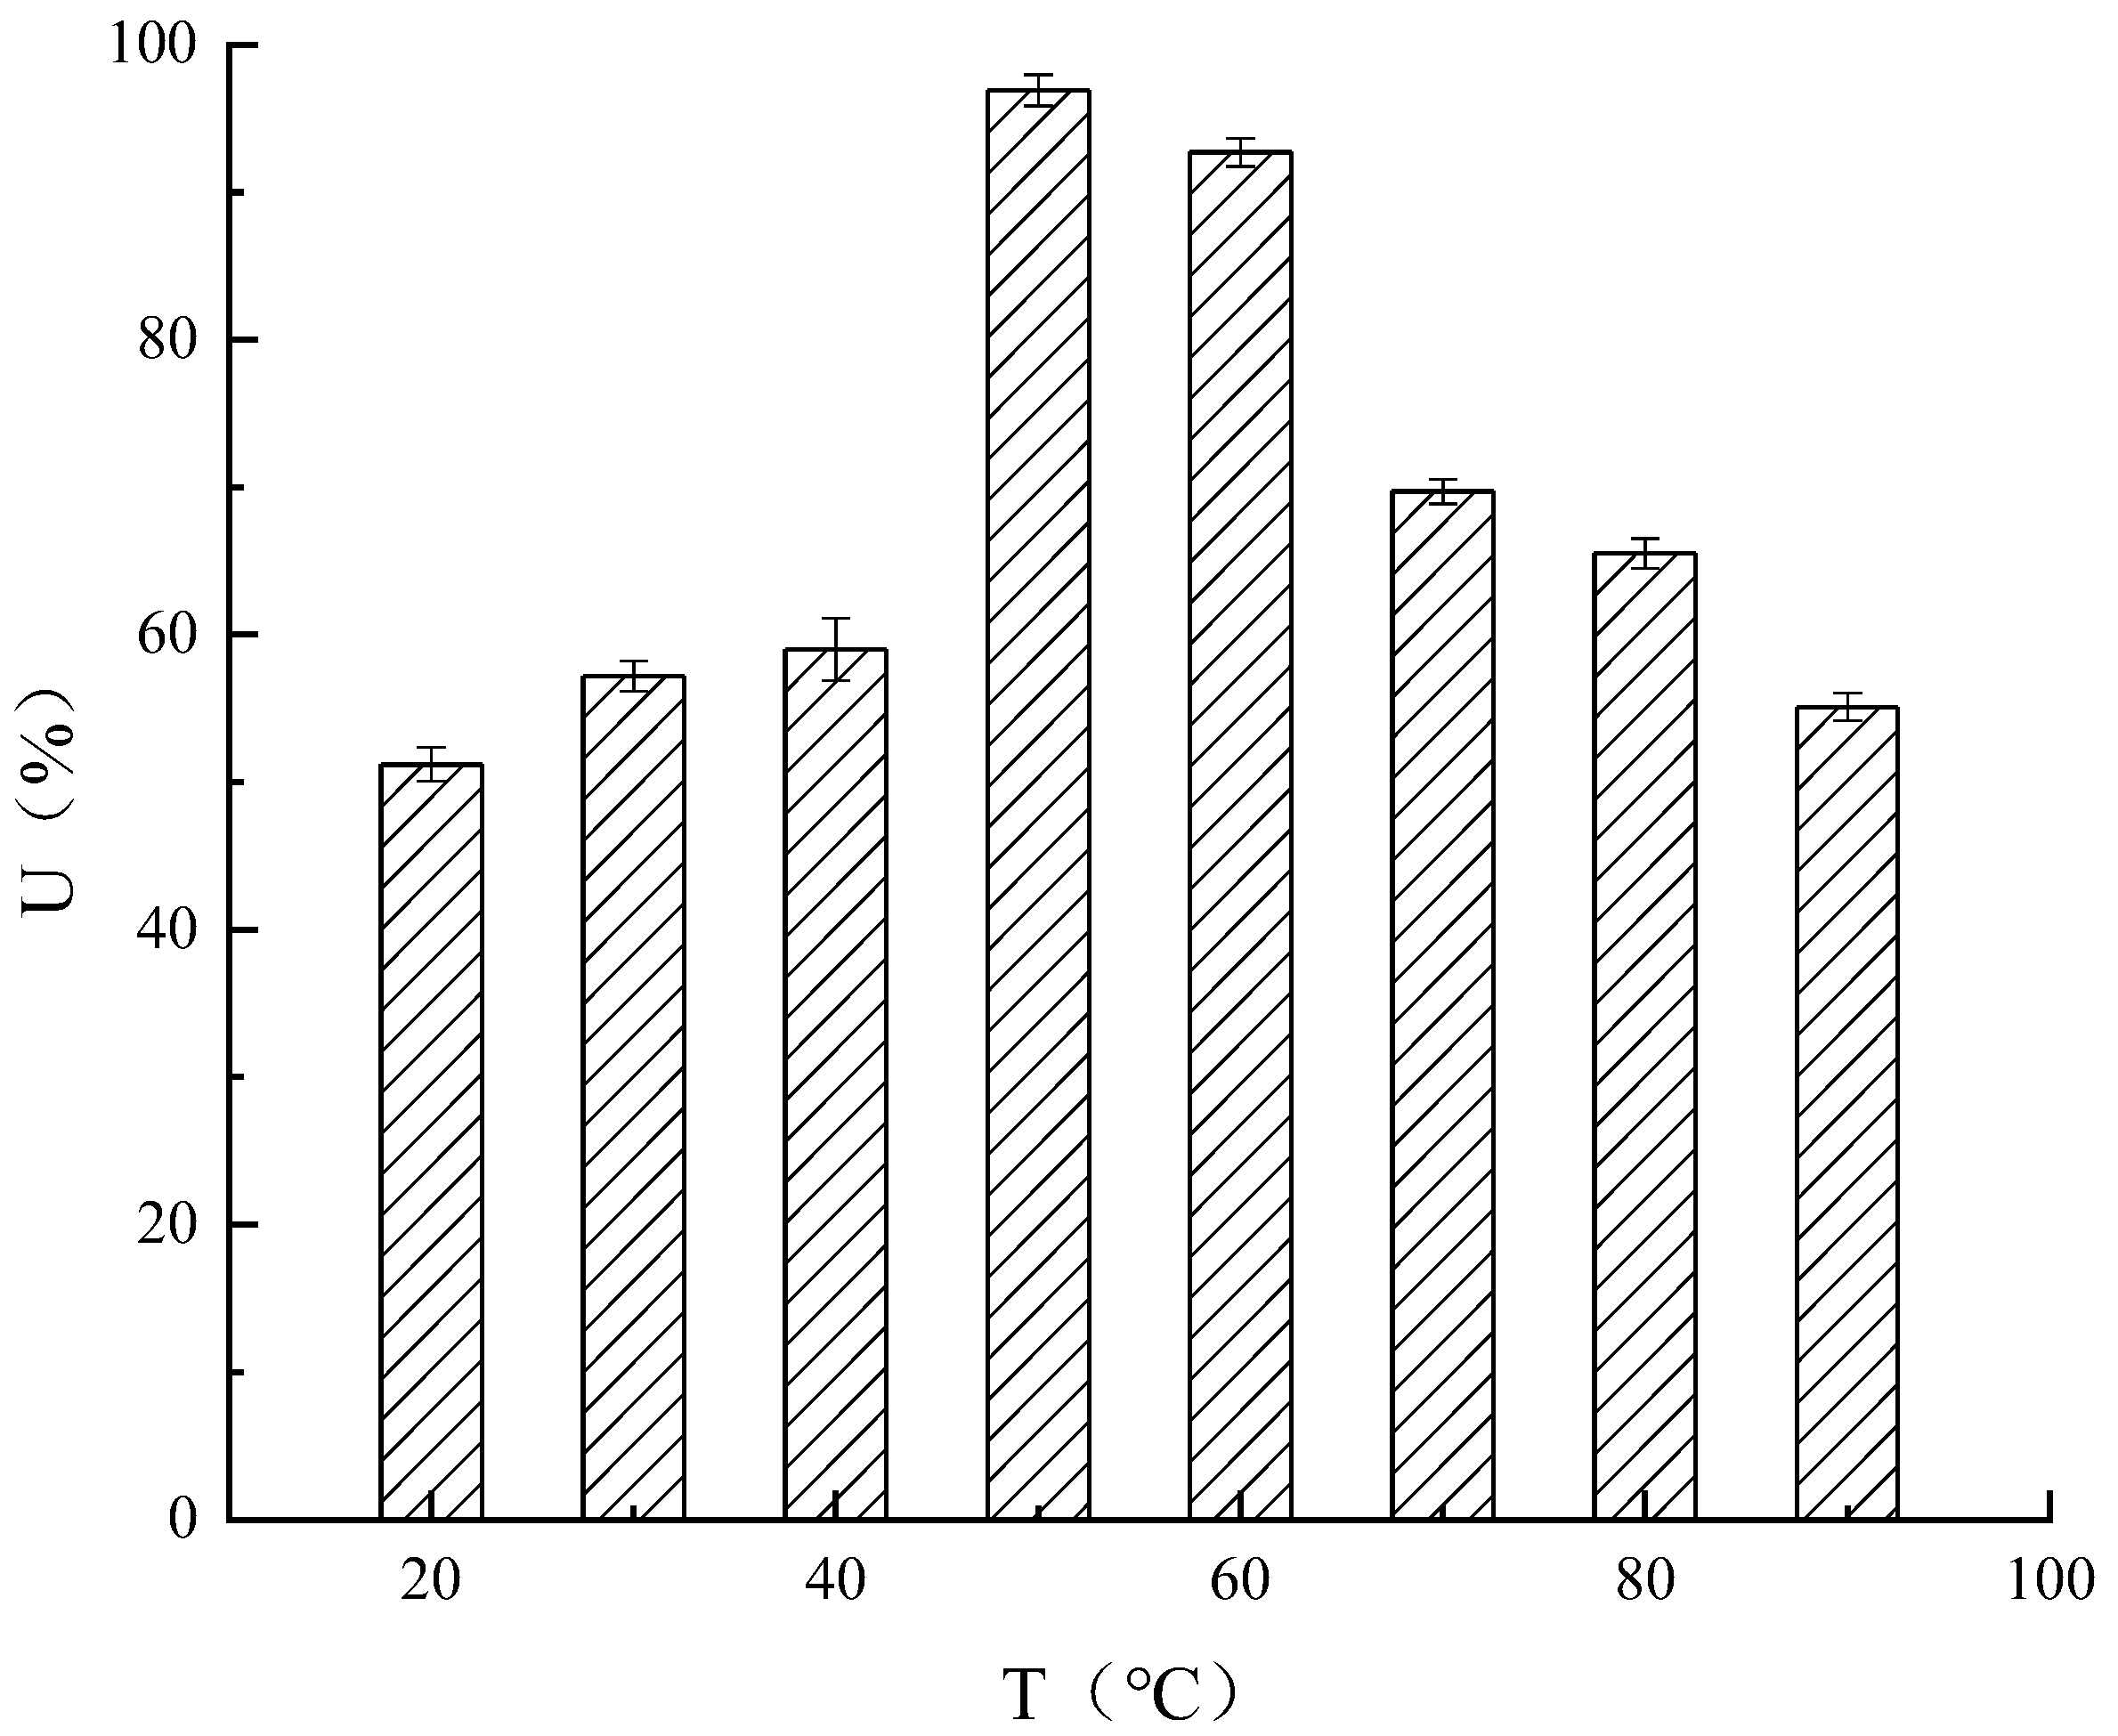
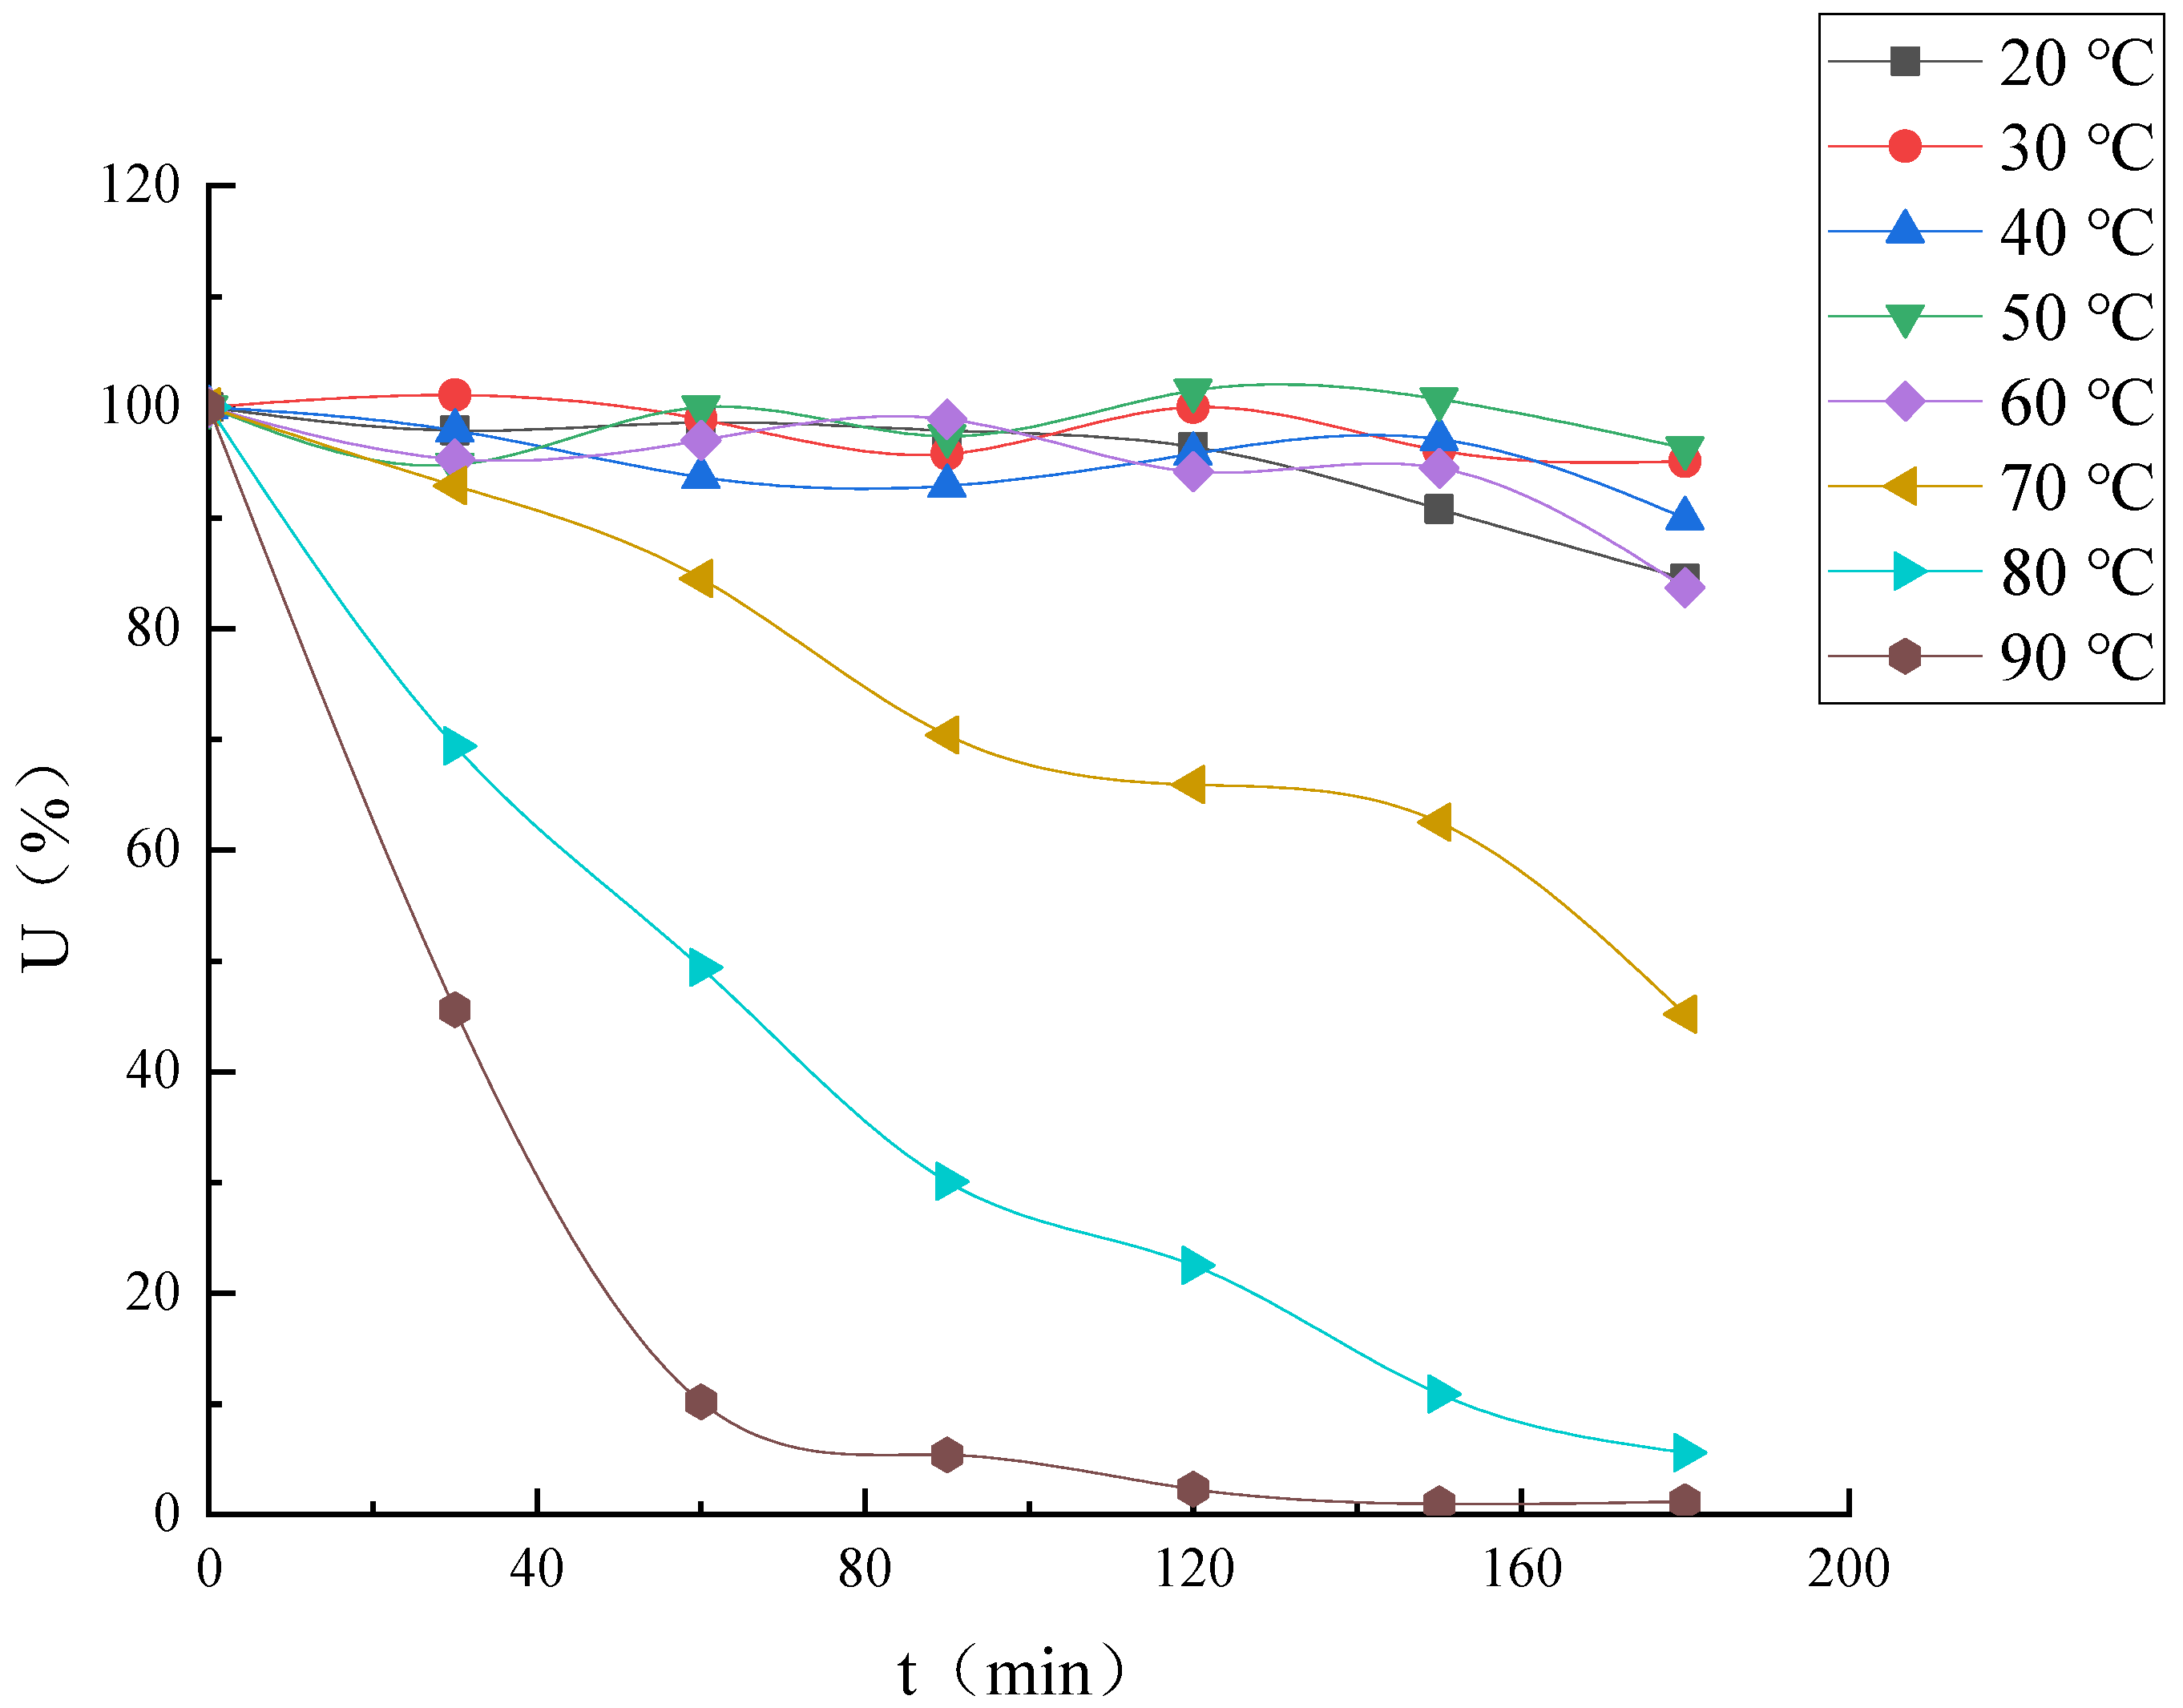
Effect of Temperature on Enzyme Activity and Thermal Stability
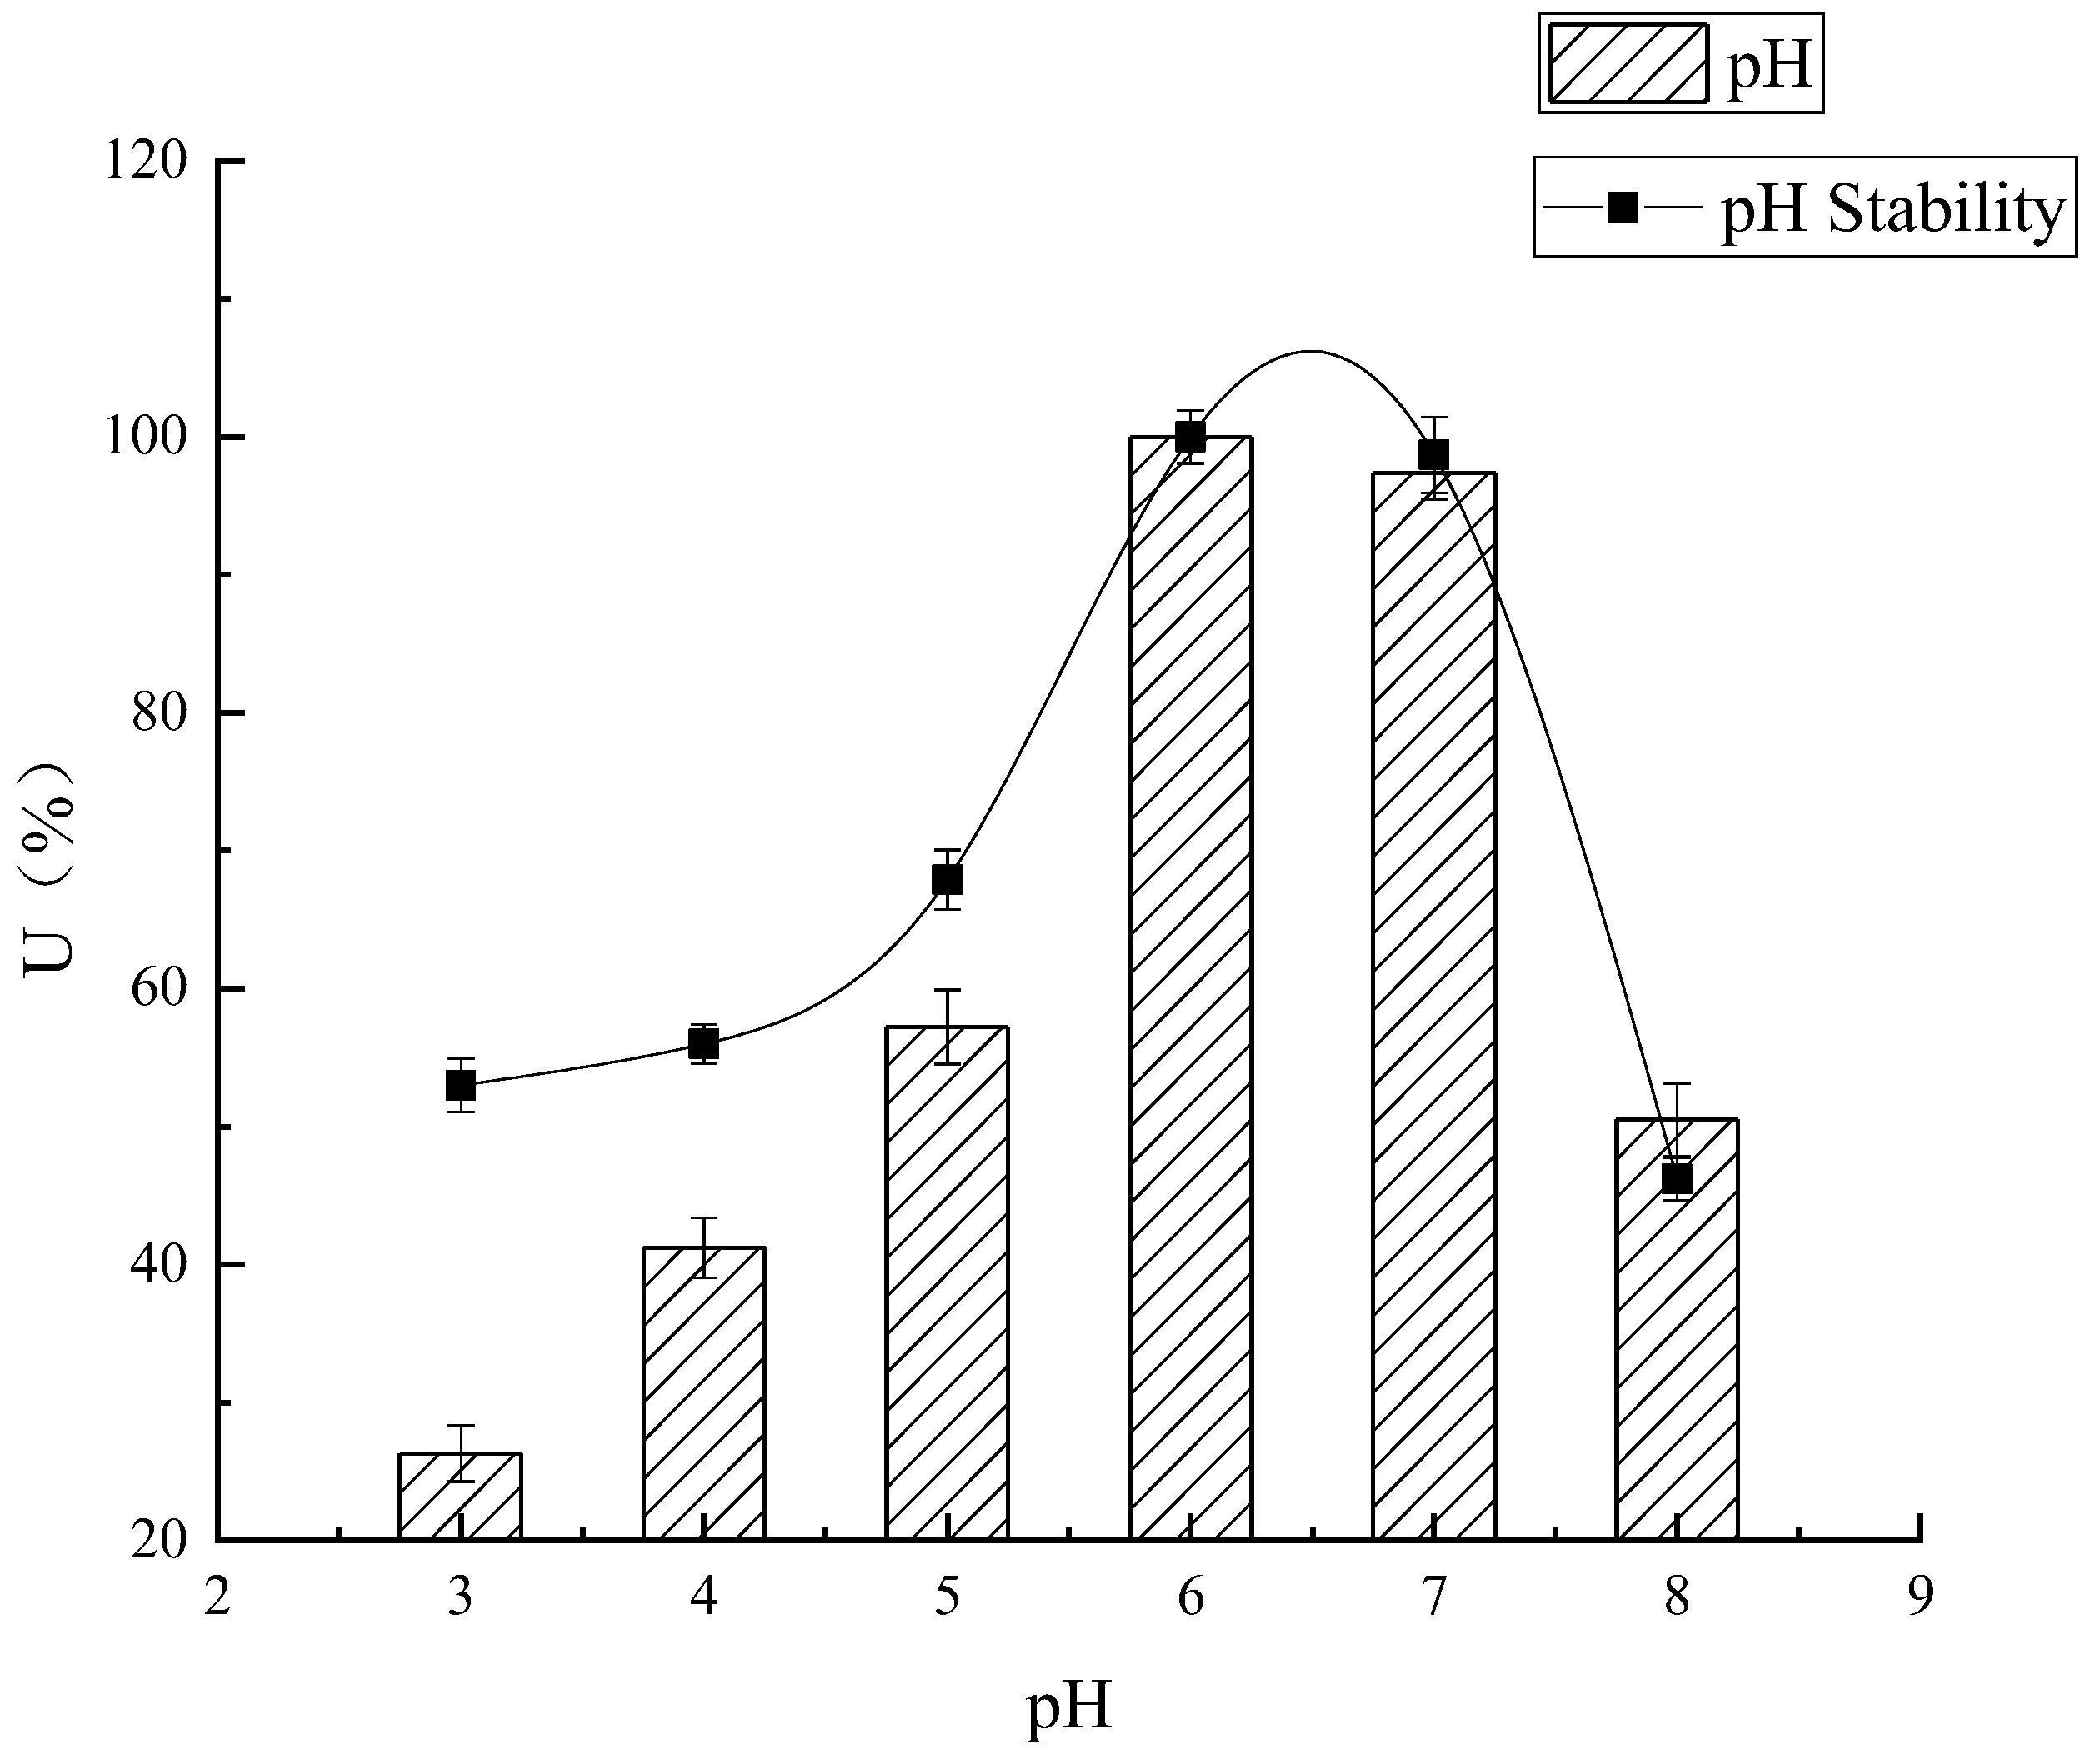
Effect of pH on Enzyme Activity and pH Stability
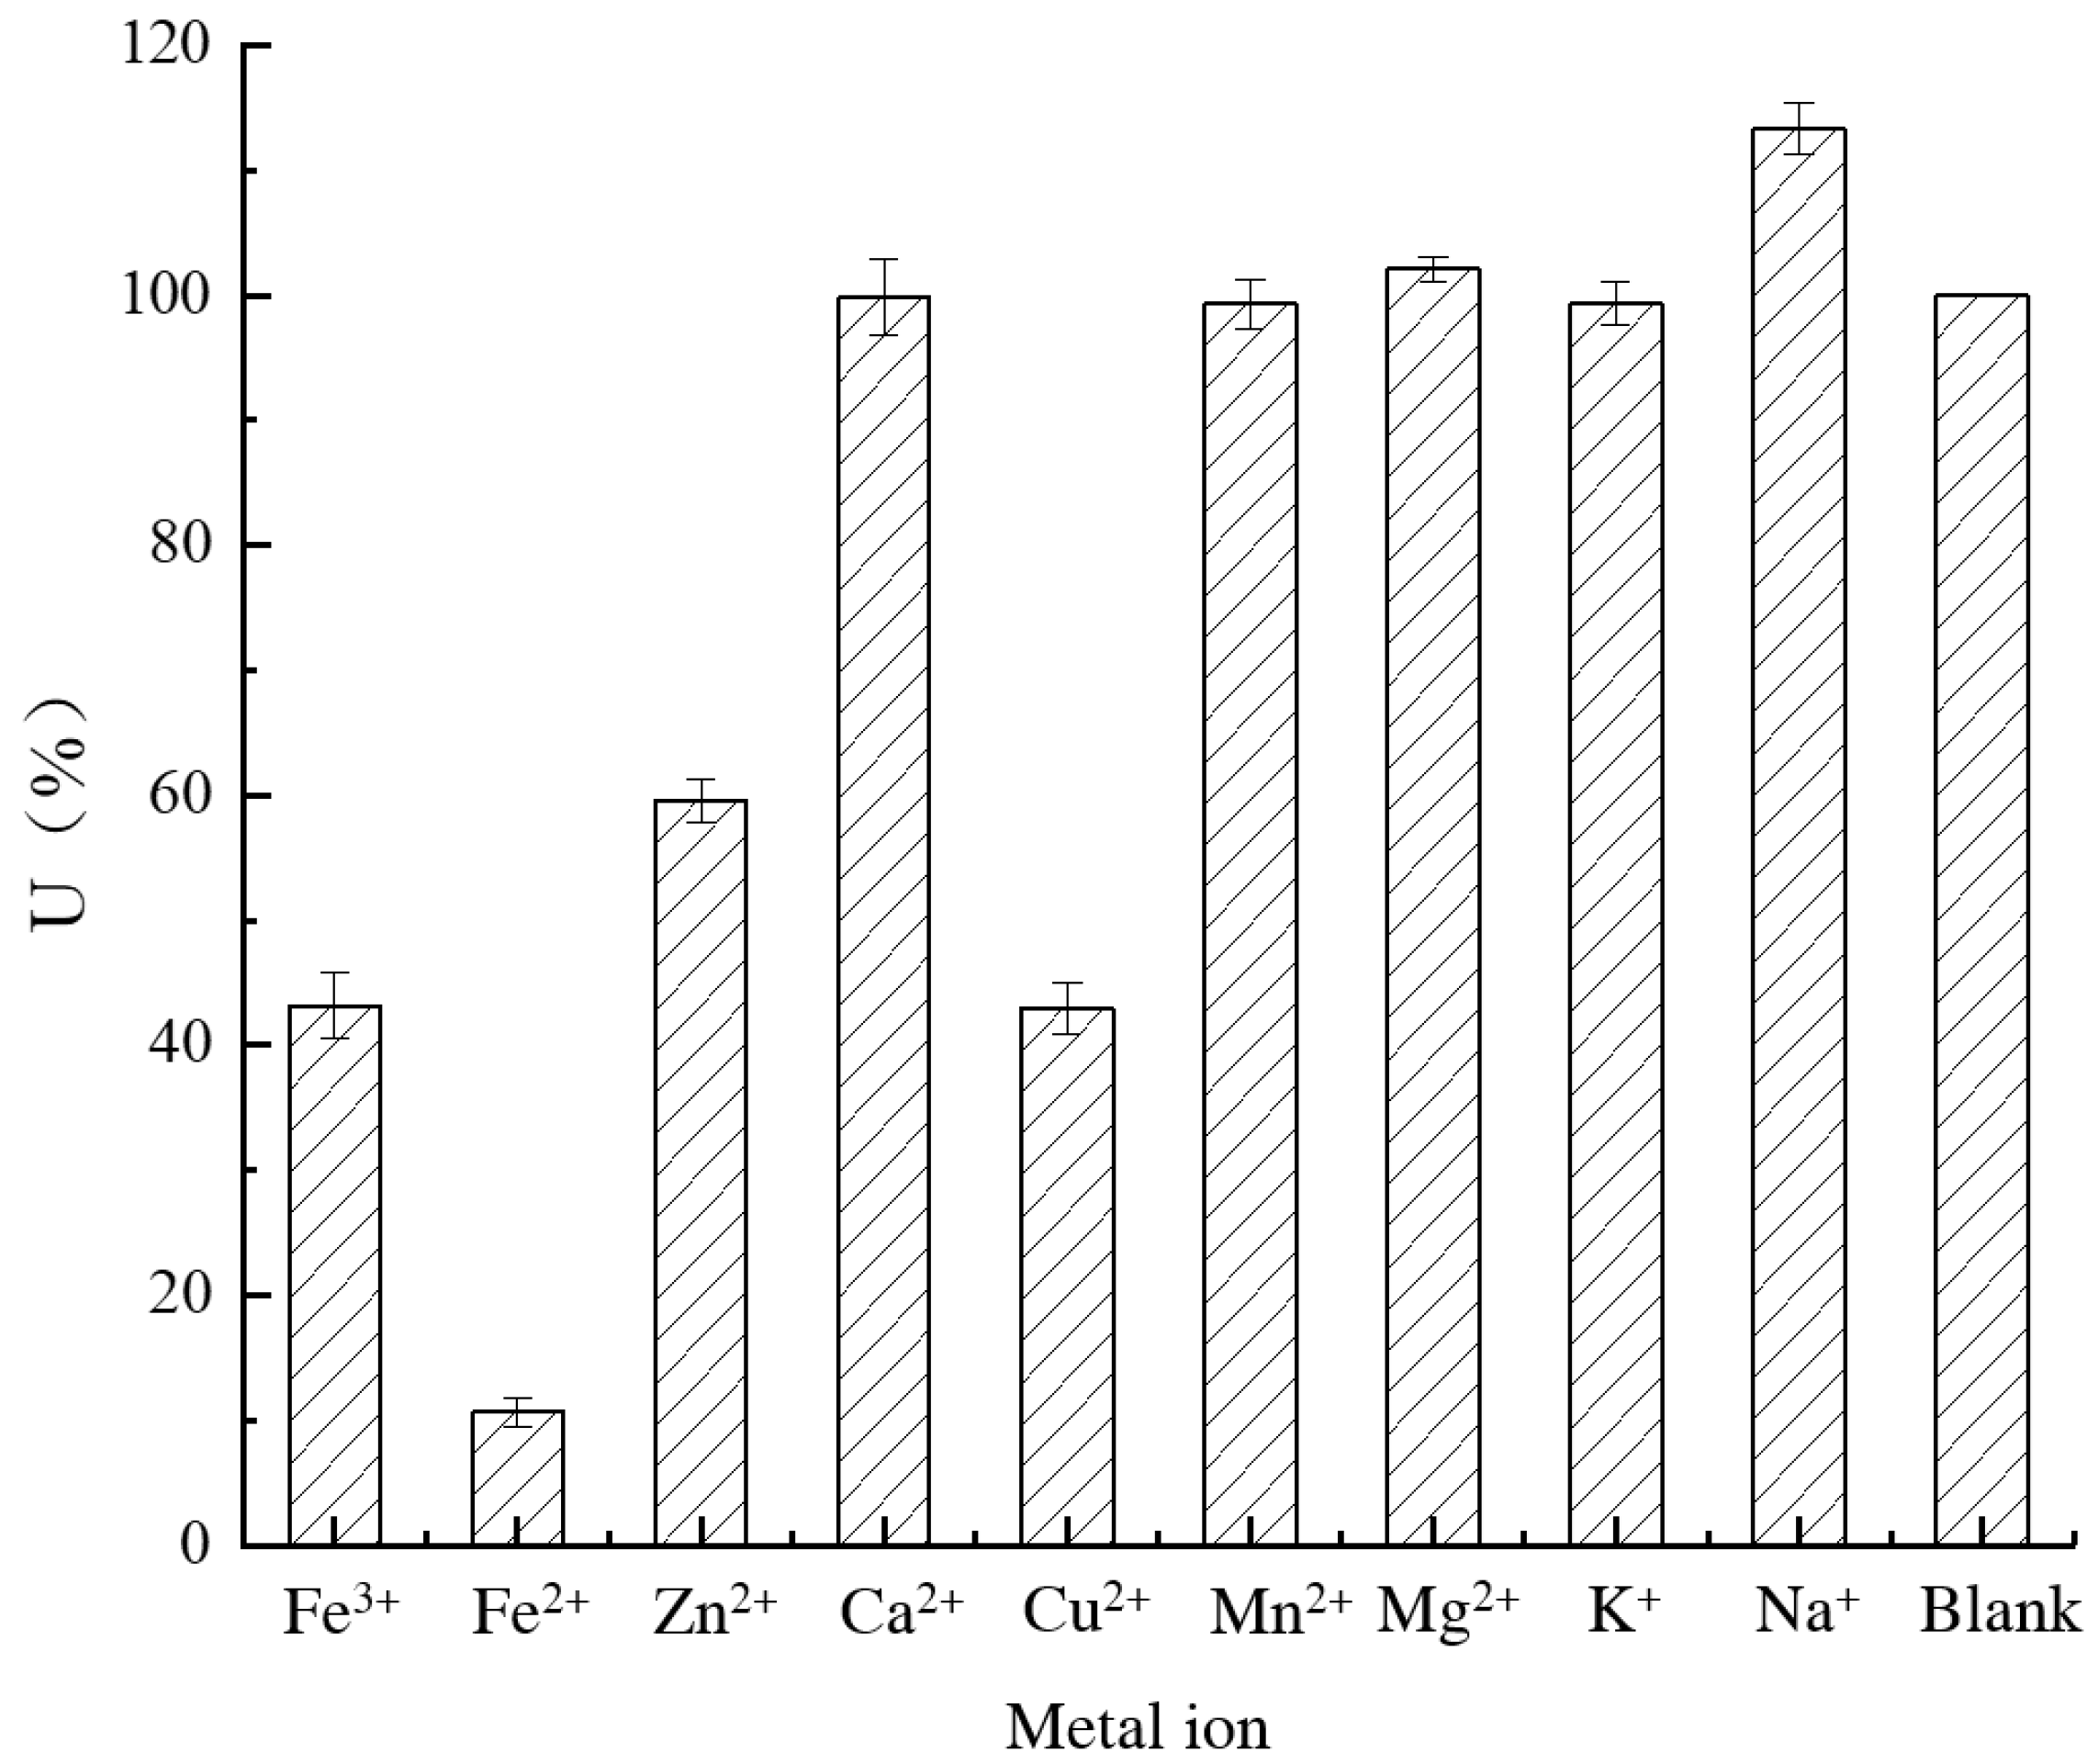
Effect of Metal Ions on Enzyme Activity
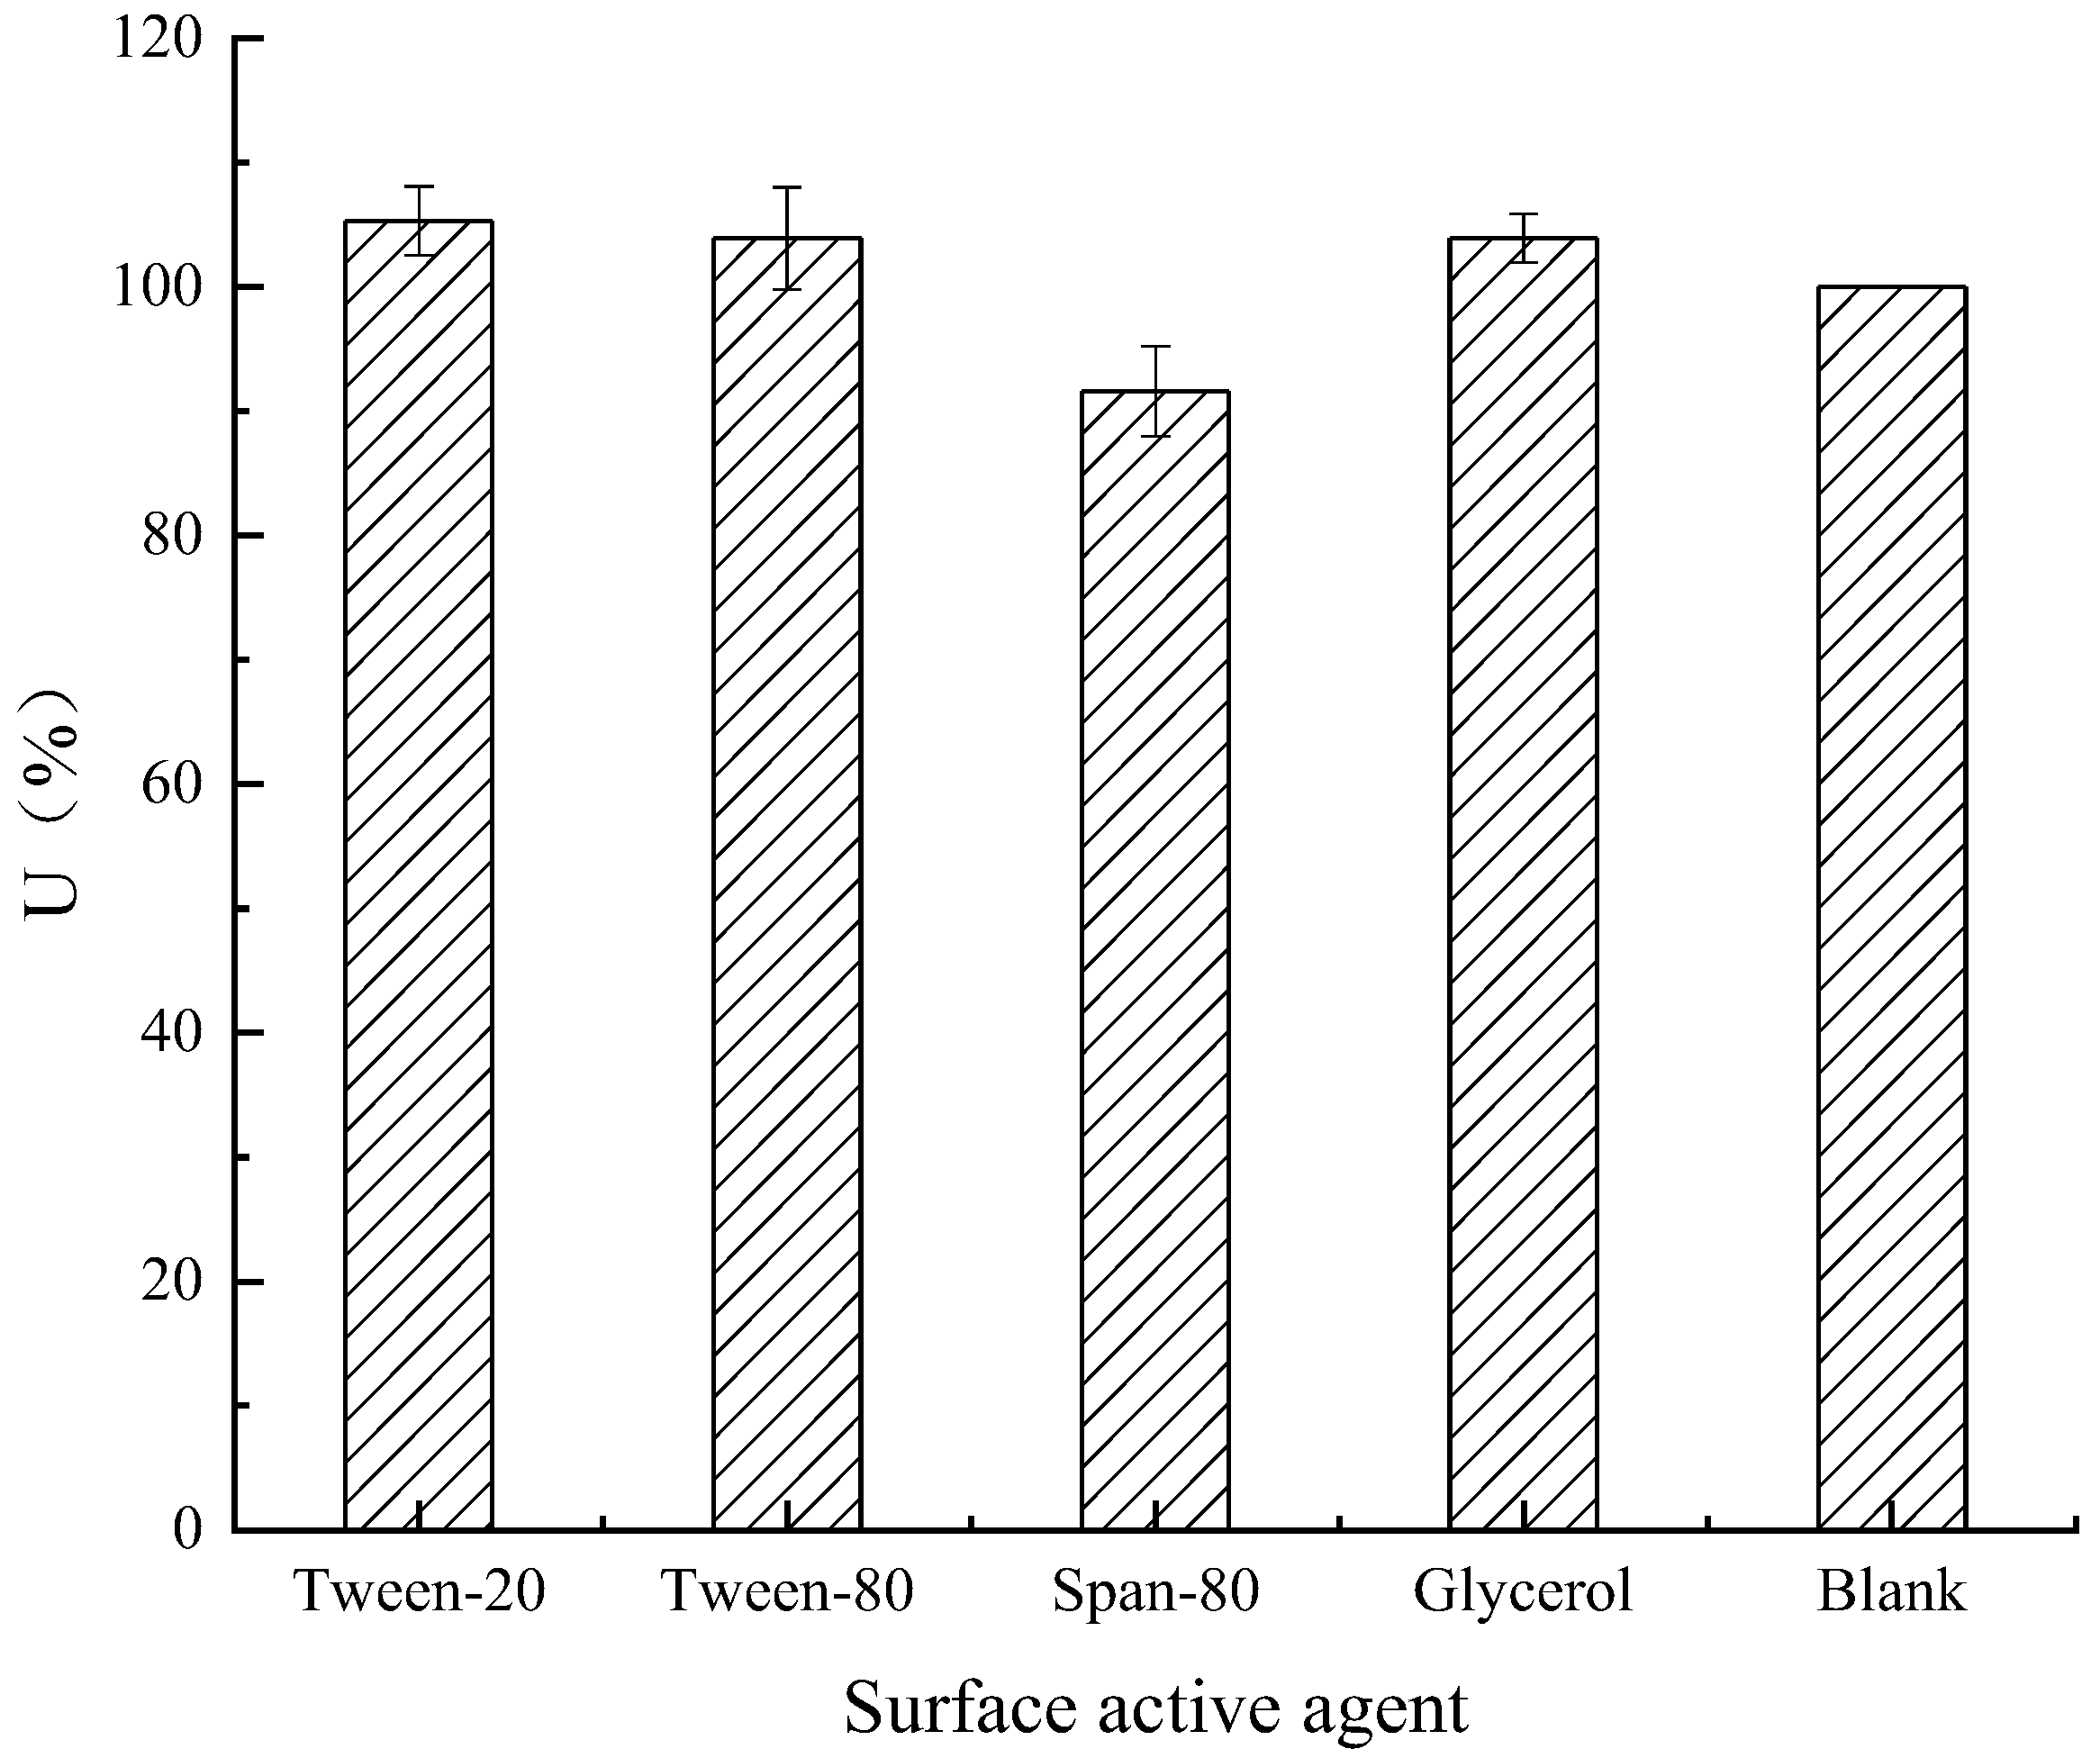
Effect of Surfactants on Enzyme Activity
3.4.2. Bacteriostatic Test
4. Conclusions
Author Contributions
Funding
Institutional Review Board Statement
Conflicts of Interest
References
- Li, H.; Wei, X.; Yang, J.; Zhang, R.; Yang, J. The bacteriolytic mechanism of an invertebrate-type lysozyme from mollusk Octopus ocellatus. Fish Shellfish. Immunol. 2019, 93, 232–239. [Google Scholar] [CrossRef] [PubMed]
- Zhe, W.; Hu, S.; Gao, Y.; Chen, Y.; Wang, H. Effect of collagen-lysozyme coating on fresh-salmon fillets preservation. LWT-Food Sci. Technol. 2017, 75, 59–64. [Google Scholar] [CrossRef]
- Satish, L.; Rana, S.; Arakha, M.; Rout, L.; Ekka, B.; Jha, S.; Dash, P.; Sahoo, H. Impact of imidazolium-based ionic liquids on the structure and stability of lysozyme. Spectrosc. Lett. 2016, 49, 383–390. [Google Scholar] [CrossRef]
- Jha, I.; Bisht, M.; Mogha, N.K.; Venkatesu, P. Effect of Imidazolium-Based Ionic Liquids on the Structure and Stability of Stem Bromelain: Concentration and Alkyl Chain Length Effect. J. Phys. Chem. B Condens. Matter Mater. Surf. Interfaces Biophys. 2018, 122, 7522–7529. [Google Scholar] [CrossRef]
- Loske, L.; Nakagawa, K.; Yoshioka, T.; Matsuyama, H. 2D Nanocomposite Membranes: Water Purification and Fouling Mitigation. Membranes 2020, 10, 295. [Google Scholar] [CrossRef]
- Xing, Y.; Ama, C.; Aa, A.; Lfdd, E.; Xz, F.; Sht, G.; Hp, H.; Lk, A. Towards next generation high throughput ion exchange membranes for downstream bioprocessing: A review. J. Membr. Sci. 2022, 647, 120325. [Google Scholar] [CrossRef]
- Tomczak, W.; Gryta, M. Comparison of Polypropylene and Ceramic Microfiltration Membranes Applied for Separation of 1,3-PD Fermentation Broths and Saccharomyces cerevisiae Yeast Suspensions. Membranes 2021, 11, 44. [Google Scholar] [CrossRef]
- Tomczak, W.; Gryta, M. Clarification of 1,3-Propanediol Fermentation Broths by Using a Ceramic Fine UF Membrane. Membranes 2020, 10, 319. [Google Scholar] [CrossRef]
- Ruby-Figueroa, R.; Saavedra, J.; Bahamonde, N.; Cassano, A. Permeate flux prediction in the ultrafiltration of fruit juices by ARIMA models. J. Membr. Sci. 2016, 524, 108–116. [Google Scholar] [CrossRef]
- Chen, C.; Li, X.; Yue, L.; Jing, X.; Yang, Y.; Xu, Y.; Wu, S.; Liang, Y.; Liu, X.; Zhang, X. Purification and characterization of lysozyme from Chinese Lueyang black-bone Silky fowl egg white. Prep. Biochem. Biotechnol. 2019, 49, 215–221. [Google Scholar] [CrossRef]
- Smma, B.; Pda, B.; Kta, B.; Apa, B. Filtration of protein-based solutions with ceramic ultrafiltration membrane. Study of selectivity, adsorption, and protein denaturation. Comptes Rendus Chim. 2019, 22, 198–205. [Google Scholar] [CrossRef]
- Lu, J.; Wan, Y.; Cui, Z. Strategy to separate lysozyme and ovalbumin from CEW using UF. Desalination 2006, 200, 477–479. [Google Scholar] [CrossRef]
- Al-Hakeim, H.K.; Al-Shams, J.K.; Kadhem, M.A. Immobilization of Urease enzyme on ion-exchange resin. J. Univ. Babylon 2012, 20, 1231–1236. [Google Scholar]
- Easton, L.E.; Shibata, Y.; Lukavsky, P.J. Rapid, nondenaturing RNA purification using weak anion-exchange fast performance liquid chromatography. RNA 2010, 16, 647–653. [Google Scholar] [CrossRef] [PubMed] [Green Version]
- Parhi, R.; Suresh, P. Formulation optimization and characterization of transdermal film of simvastatin by response surface methodology. Mater. Sci. Eng. C 2016, 58, 331–341. [Google Scholar] [CrossRef] [PubMed]
- Rabinarayan, P.; Suresh, P.; Patnaik, S. Application of Response Surface Methodology for Design and Optimization of Reservoir-type Transdermal Patch of Simvastatin. Curr. Drug Deliv. 2016, 13, 742–753. [Google Scholar] [CrossRef]
- Mondal, S.C.; Kumar, J. Application of Box-Behnken design for the optimisation of process parameters in dry drilling operation. Int. J. Product. Qual. Manag. 2016, 18, 456–473. [Google Scholar] [CrossRef]
- Yang, D.; Wang, Q.; Cao, R.; Chen, L.; Liu, Y.; Cong, M.; Wu, H.; Li, F.; Ji, C.; Zhao, J. Molecular characterization, expression and antimicrobial activities of two c-type lysozymes from manila clam Venerupis philippinarum. Dev. Comp. Immunol. 2017, 73, 109–118. [Google Scholar] [CrossRef]
- Cugnata, N.M.; Guaspari, E.; Pellegrini, M.C.; Fuselli, S.R.; Alonso-Salces, R.M. Optimal Concentration of Organic Solvents to be Used in the Broth Microdilution Method to Determine the Antimicrobial Activity of Natural Products Against Paenibacillus Larvae. J. Apic. Sci. 2017, 61, 37–53. [Google Scholar] [CrossRef] [Green Version]
- Evli, S.; Akta, D.; Enzymatic, U. Activity of Urokinase Immobilized onto Cu 2+-Chelated Cibacron Blue F3GA-Derived Poly (HEMA) Magnetic Nanoparticles. Appl. Biochem. Biotechnol. 2019, 188, 194–207. [Google Scholar] [CrossRef]
- Bezemer, J.M.; Radersma, R.; Grijpma, D.W.; Dijkstra, P.J.; Feijen, J.; Van Blitterswijk, C.A. Zero-order release of lysozyme from poly(ethylene glycol)/poly(butylene terephthalate) matrices. J. Control. Release 2000, 64, 179–192. [Google Scholar] [CrossRef]
- Czermak, P.; Grzenia, D.L.; Wolf, A.; Carlson, J.O.; Specht, R.; Han, B.; Wickramasinghe, S.R. Purification of the densonucleosis virus by tangential flow ultrafiltration and by ion exchange membranes. Desalination 2008, 224, 23–27. [Google Scholar] [CrossRef]
- Lu, W.; Khan, T.; Mohanty, K.; Ghosh, R. Cascade ultrafiltration bioreactor-separator system for continuous production of F(ab′)2 fragment from immunoglobulin G. J. Membr. Sci. 2010, 351, 96–103. [Google Scholar] [CrossRef]


| Level | Factor | ||
|---|---|---|---|
| A (Ratio of Resin Dosage to Liquid Volume) in % | B (Adsorption Time) in h | C (NaCl Concentration) in mol/L | |
| −1 | 15 | 4 | 0.5 |
| 0 | 20 | 6 | 1.0 |
| 1 | 25 | 8 | 1.5 |
| P (MPa) | R (%) | R′ (%) | REC (%) |
|---|---|---|---|
| 0.10 | 11.2 | 37.4 | 93.6 |
| 0.20 | 7.4 | 45.7 | 96.6 |
| 0.30 | 15.85 | 37.7 | 91.9 |
| pH | R (%) | R′ (%) | REC (%) |
|---|---|---|---|
| 4.5 | 16.2 | 48.5 | 92.1 |
| 6.5 | 7.4 | 45.7 | 96.6 |
| 11 | 15.3 | 47.7 | 93 |
| Number | A | B | C | U/% |
|---|---|---|---|---|
| 1 | 0 | 1 | −1 | 43.432 |
| 2 | −1 | 0 | −1 | 66.8512 |
| 3 | 1 | 1 | 0 | 71.8863 |
| 4 | −1 | −1 | 0 | 94.5497 |
| 5 | 0 | −1 | 1 | 77.8369 |
| 6 | 0 | 0 | 0 | 92.4846 |
| 7 | 0 | 0 | 0 | 81.9566 |
| 8 | 0 | 1 | 1 | 67.7667 |
| 9 | 1 | 0 | 1 | 78.9759 |
| 10 | −1 | 0 | 1 | 71.6521 |
| 11 | 0 | 0 | 0 | 86.7681 |
| 12 | −1 | 1 | 0 | 76.006 |
| 13 | 0 | −1 | −1 | 62.9551 |
| 14 | 1 | 0 | −1 | 49.2229 |
| 15 | 1 | −1 | 0 | 89.2804 |
| 16 | 0 | 0 | 0 | 85.6185 |
| 17 | 0 | 0 | 0 | 85.1607 |
| Source | SS | Df | MS | F | p |
|---|---|---|---|---|---|
| Model | 3195.16 | 9 | 355.02 | 37.15 | <0.0001 |
| A | 48.48 | 1 | 48.48 | 5.07 | 0.059 |
| B | 536.79 | 1 | 536.79 | 56.17 | 0.0001 |
| C | 680.26 | 1 | 680.26 | 71.18 | <0.0001 |
| AB | 0.33 | 1 | 0.33 | 0.035 | 0.8578 |
| AC | 155.65 | 1 | 155.65 | 16.29 | 0.005 |
| BC | 22.34 | 1 | 22.34 | 2.34 | 0.1702 |
| A2 | 0.047 | 1 | 0.047 | 4.893 × 10⁻³ | 0.9462 |
| B2 | 53.74 | 1 | 53.74 | 5.62 | 0.0495 |
| C2 | 1655.29 | 1 | 1655.29 | 173.19 | <0.0001 |
| Residua | 66.9 | 7 | 9.56 | ||
| Lack of Fit | 7.85 | 3 | 2.62 | 0.18 | 0.9065 |
| Pure Error | 59.05 | 4 | 14.76 | ||
| Cor Total | 3262.06 | 16 | |||
| R2 | 0.9795 | ||||
| R2 (adj) | 0.9531 | ||||
| C.V.% | 0.041 |
| Software | R2 | p | Significant Factor |
|---|---|---|---|
| Design-Expert | 0.9795 | <0.05 | NaCl |
| SPSS | 0.9820 | <0.05 | NaCl |
Publisher’s Note: MDPI stays neutral with regard to jurisdictional claims in published maps and institutional affiliations. |
© 2022 by the authors. Licensee MDPI, Basel, Switzerland. This article is an open access article distributed under the terms and conditions of the Creative Commons Attribution (CC BY) license (https://creativecommons.org/licenses/by/4.0/).
Share and Cite
Chen, S.; Tan, Y.; Zhu, Y.; Sun, L.; Lin, J.; Zhang, H. Application of Ultrafiltration and Ion Exchange Separation Technology for Lysozyme Separation and Extraction. Fermentation 2022, 8, 297. https://doi.org/10.3390/fermentation8070297
Chen S, Tan Y, Zhu Y, Sun L, Lin J, Zhang H. Application of Ultrafiltration and Ion Exchange Separation Technology for Lysozyme Separation and Extraction. Fermentation. 2022; 8(7):297. https://doi.org/10.3390/fermentation8070297
Chicago/Turabian StyleChen, Shanshan, Yaqing Tan, Yaqing Zhu, Liqin Sun, Jian Lin, and Hailing Zhang. 2022. "Application of Ultrafiltration and Ion Exchange Separation Technology for Lysozyme Separation and Extraction" Fermentation 8, no. 7: 297. https://doi.org/10.3390/fermentation8070297
APA StyleChen, S., Tan, Y., Zhu, Y., Sun, L., Lin, J., & Zhang, H. (2022). Application of Ultrafiltration and Ion Exchange Separation Technology for Lysozyme Separation and Extraction. Fermentation, 8(7), 297. https://doi.org/10.3390/fermentation8070297