Abstract
The aim of a significant part of current wine technology research is to better understand and monitor mixed culture fermentations and optimize the microbiological processes and characteristics of the final wine. In this context, the yeast couple formed by Lachancea thermotolerans and Saccharomyces cerevisiae is of particular interest. The diverse results observed in the literature have shown that wine characteristics are dependent on both interactions between yeasts and environmental and fermentation parameters. Here, we took a multiparametric approach to study the impact of fermentation parameters on three different but related aspects of wine fermentation: population dynamics, fermentation, and volatile compound production. An experimental design was used to assess the effects of four independent factors (temperature, oxygenation, nitrogen content, inoculum ratio) on variables representing these three aspects. Temperature and, to a lesser extent, oxygenation and the inoculum ratio, were shown to constitute key factors in optimizing the presence of Lachancea thermotolerans during fermentation. The inoculum ratio also appeared to greatly impact lactic acid production, while the quantity of nitrogen seemed to be involved more in the management of aroma compound production. These results showed that a global approach to mixed fermentations is not only pertinent, but also constitutes an important tool for controlling them.
1. Introduction
For several years, the management of must fermentation to obtain wines with high organoleptic quality has involved the use of Saccharomyces cerevisiae and non-Saccharomyces yeasts. The latter are indeed interesting for use in wine production for several reasons [1]: they increase aromatic diversity [2,3], decrease ethanol concentration [4], induce acidification [5,6], and contribute to biopreservation [7], etc. Nevertheless, cofermentations of S. cerevisiae and non-Saccharomyces yeasts are not yet completely controlled (longer fermentations, variability of product quality, etc.) due to complex and as yet not fully understood interactions between yeasts. Various interactions (competition, amensalism, mutualism, and commensalism) can be involved through different mechanisms (release of beneficial or toxic compounds, exchange of metabolites, metabolism changes linked to production of quorum sensing molecules or to cell-to-cell contacts, etc.) [8]. These interactions have an impact on the population dynamics (dominance of one species, persistence throughout fermentation), fermentation results (modulation of ethanol content, pH, etc.) and aroma production. The aroma profile in mixed S. cerevisiae/non-Saccharomyces cultures is indeed not just a simple juxtaposition of aroma compounds produced by each species in pure culture conditions, as it is also impacted by interactions between these species, either directly via population dynamics or indirectly via metabolism variations [9,10].
Among all non-Saccharomyces yeasts, Lachancea thermotolerans is of particular interest. Its unique ability to generate lactic acid as a coproduct of its sugar metabolism makes it very valuable for reducing the pH of wines, especially those from warmer viticulture areas [11]. In addition to this specificity, L. thermotolerans also provides many other technical benefits for vinification, such as a lower sugar-to-ethanol yield [12], high glycerol production [13], and low acetic acid production [2,11]. In addition, L. thermotolerans can modulate volatile compound production in wine, since it is the only species amongst non-Saccharomyces yeasts to potentially possess all the enzymes involved in aroma production. The following enzymes have been highlighted: lipases and esterases to produce esters from free fatty acids, aminopeptidases to release the amino acid precursors of aromas, β-glucosidase to release terpenes from precursors, and carbohydrolases to degrade the cell walls of berries and release aroma precursors [14,15]. Esters, terpenes, and higher alcohols confer fruity and floral notes to wine, thus leading to greater aroma diversity in the final product [2,11,14].
Moreover, interactions between L. thermotolerans and S. cerevisiae have already been described in the past, and both seemed to significantly impact fermentation results and vary depending on culture conditions [16,17,18]. This study therefore focused on L. thermotolerans as the non-Saccharomyces species of interest due to both its technical capabilities and its interactions with Saccharomyces cerevisiae.
Studies by different authors on cofermentations between S. cerevisiae (Sc) and L. thermotolerans (Lt) showed variable impacts on products (ethanol production, acidification, the production of metabolites as aroma compounds, etc.) [19]. These inconsistent results can be explained by strain dependence and by the impact of environmental conditions. Factors such as medium composition, temperature, oxygenation, inoculation conditions, and so forth are indeed known to have an impact on yeast metabolism, on interactions between yeasts, and consequently on product quality. For example, Gobbi et al. (2013) showed that the population dynamics observed and the aroma compounds produced within a mixed Sc/Lt culture varied with medium (must), batch volume, and temperature [16]. Other studies highlighted that oxygen played a significant role in the population dynamics [17,20], and that both the amount and nature of nitrogen sources influenced global gene expression and thus impacted yeast growth, fermentation performance, and general metabolism [21,22]. An inoculum ratio favoring one yeast or the other has also been shown to significantly impact the population dynamics over time, and then the volatile compound profiles as well [23].
However, these factors are often studied separately, and their impacts have been shown to change when other conditions vary [19]. It is thus necessary to standardize study conditions to obtain a better understanding of the mechanisms involved and to optimize wine fermentation with both non-Saccharomyces yeasts and S. cerevisiae. Some authors have already adapted their protocols for this purpose, with some of them using a synthetic medium instead of natural must [24,25,26], and others applying experimental designs to study how yeast populations or fermentative media are impacted by different culture parameters [27,28,29]. The aim of this study was to combine these standardized conditions with a multiparametric approach to environmental conditions and their consequences on multiple levels: from population and fermentation dynamics to metabolite production (ethanol, lactic acid, volatile compounds). The general objective was, overall, to better understand how mixed culture fermentations involving S. cerevisiae and L. thermotolerans can be monitored and influenced, and how the resulting final wine will be shaped as a consequence.
2. Materials and Methods
2.1. Microorganisms, Preservation, and Preculture
Two yeast species were used in this study: Saccharomyces cerevisiae 59A HO::eGFP (Sc), a haploid derivative of the commercial wine strain EC1118 (Lallemand Inc., Montréal, QC, Canada) and Lachancea thermotolerans BBMCZ7FA20 (Lt) (previously isolated and identified by Sadoudi et al. 2012 [10]). The eGFP mutation in S. cerevisiae confers a green fluorescence to this strain and allows the differentiation between both yeasts in flow cytometry.
Yeasts were preserved in YPD/glycerol (50/50 w/w) at −80 °C in the lab collection.
Each strain was grown first at 28 °C on YPD agar (glucose 20 g·L−1, peptone 10 g·L−1, yeast extract 5 g·L−1, agar 18 g·L−1). Then, a preculture was obtained in MS300 liquid medium at 28 °C and agitated at 150 rpm. This synthetic must was first developed by Bely et al. (1990) [24], and is usually used in oenological research [30,31,32,33]. It contains carbon sources (glucose, fructose, organic acids), nitrogen sources (mineral and organic, 300 mg·L−1), minerals, vitamins, and growth factors. Media components were purchased from SigmaTM (Merck KGaA, Darmstadt, Germany). The yeasts were collected at the end of the exponential phase to inoculate the culture media.
2.2. Experimental Design
A 2-level Taguchi experimental design was used to assess the effects of 4 independent factors (temperature, oxygenation, the nitrogen content of the culture medium, and the Sc/Lt inoculation ratio) at two different levels on different variables (yeast population, medium composition, volatiles). Given this experimental design, only 8 out of 16 possible conditions had to be tested to assess the relations between the entry parameters and the observed variables, resulting in a L8(42) Taguchi plan. The levels for the 4 independent factors studied are summarized in Table 1. Table 2 shows the eight conditions of the experimental design and corresponding parameters.

Table 1.
Parameters tested in the experimental design.
Table 2.
Conditions tested in the experimental design and corresponding parameters.
Synthetic must was prepared with 2 levels of nitrogen content: MS300 (300 mg·L−1 of total nitrogen) and MS150 (150 mg·L−1 of total nitrogen). Sterile glass flasks (Schott AG, Mainz, Germany) (GL45 screw thread, effective volume 1 L) were filled with 1 L of synthetic must. Media were inoculated with L. thermotolerans at 106 cells·mL−1 and with S. cerevisiae at 105 and 106 cells·mL−1 to obtain a Sc/Lt ratio of 0.1 and 1, respectively.
Cultures were carried out in these nonhermetically closed Schott flasks and in static conditions. For the oxygenated samples, air was added at the end of exponential growth by sparging (until oxygen saturation of the medium) to mimic the process in industrial conditions.
Cultures were conducted at two temperatures: 18 °C and 28 °C, which can be used in winemaking for white and red wine fermentations, respectively.
2.3. Yeast Population
The yeast population was monitored during fermentation using flow cytometry, with the eGFP mutation of Sc allowing for discrimination between Sc and Lt. To study yeast viability, propidium iodide dye (PI) (InvitrogenTM, Thermo Fisher Scientific Inc., Waltham, MA, USA) was used due to its ability to bind to DNA when the cell membrane was compromised, triggering its fluorescence (maximum excitation/emission wavelengths 538/617 nm). The fermentation medium (1 mL) was centrifuged (10,000× g, 5 min, 4 °C), the pellet was resuspended in 1 mL phosphate-buffered saline (PBS) buffer (Fisher ScientificTM, Thermo Fisher Scientific Inc.), and serial dilutions were prepared. PI (1 µL at 0.1 mg·mL−1 in water) was added to a 100 μL aliquot. Samples were incubated for 10 min in the dark and analyzed.
A BD AccuriTM C6 flow cytometer (BD Biosciences, Franklin Lakes, NJ, USA) was used with the following conditions: a sample of 20 µL, flow 34 µL·min−1, 488 nm wavelength argon laser to excite cells (autofluorescence) and dye, FL3-H long-pass filter (675 nm) for PI fluorescence, and FSC threshold of 80,000. Data were analyzed using the BD Accuri C6 software.
At the same time, the yeast population was monitored by enumeration on plates with Wallerstein Laboratory (WL) Nutrient Agar (OxoidTM, Thermo Fisher Scientific Inc.). This nutritive medium allows the identification of various yeasts via colony morphology and their aptitude to degrade bromocresol green: Lt appears as small blue colonies, while Sc colonies are larger and present a creamy-white color [34]. Serial dilutions (in PBS) of cell suspensions (100 µL) were spread on WL Nutrient Agar and incubated at 30 °C for 48 h before counting.
2.4. Chemical Analysis
Aliquots of culture media were centrifuged at 10,000× g for 5 min, and supernatants were stored at −20 °C until chemical analysis.
Ethanol concentration, residual sugars, and pH were determined using FTIR spectroscopy (OenoFossTM type 4101, FOSS, Hilleroed, Denmark).
Lactic acid concentration was analyzed with an L-Lactic Acid Enzymatic Assay Kit (BioSenTec, Portet-sur-Garonne, France).
Volatile compounds were quantified using headspace–solid-phase microextraction/gas chromatography–mass spectrometry (HS–SPME/GC–MS). The extraction of volatiles was carried out using a Combi-pal autosampler (CTC Analytics, Zwingen, Switzerland). A volume of 2 mL of sample was placed in a 10 mL vial that was then fitted with a polytetrafluoroethylene (PTFE)/silicone septum and maintained under agitation at 40 °C for 10 min. After sample conditioning, an SPME fiber (divinylbenzene/carboxen/polydimethylsiloxane 50/30 μm, 1 cm long (DVB/CAR/PDMS, Supelco (Bellefonte, PA, USA)) was exposed for 30 min to the sample headspace and immediately desorbed in the gas chromatograph injector. Volatile compounds were analyzed by gas chromatography coupled to quadrupolar mass selective spectrometry using an Agilent 5973 Network Detector (Agilent Technologies, Palo Alto, CA, USA). Analytes were separated on a Supelcowax-10 (Supelco) 60 m × 0.25 mm I.D. with a 0.25 μm film thickness. The column temperature was held at 4 °C for 10 min, increased to 150 °C at 3 °C·min−1., then to 250 °C at 15 °C·min−1, and held for 5 min. The injector temperature was 260 °C, and the time of desorption of the fiber into the injection port was fixed at 5 min. The carrier gas was helium at a flow rate of 1.5 mL·min−1. The temperature of the ion source was 230 °C, and that of the transfer line was 280 °C. Electron impact mass spectra were recorded at 70 eV ionization energy, 5.1 scan·s−1. The GC–MS analysis was performed in the complete scanning mode (SCAN) in a mass range of 35–300 u.
The compounds were identified by comparison of their mass spectra and retention times with those of standard compounds or with those available in the Wiley 6 mass spectrum library and in the literature, respectively. The response factors of volatile compounds were calculated using a calibration curve obtained by analyzing a hydroalcoholic solution (ethanol 10%, v/v) with different concentrations of reference compounds (ethanol 96%, 1-propanol, 3-methylbutyl acetate, 3-methylbutanol, ethyl octanoate, ethyl decanoate, 1-hexanol, 2-phenylethyl alcohol, and octanoic acid purchased from SigmaTM (Merck KGaA, Darmstadt, Germany).
2.5. Result Processing and Analysis
To analyze the impact of fermentation parameters on the population dynamics, several quantitative data were calculated for each strain: maximal population (Nmax), maximal growth rate (µmax), and area under growth curve (AUC). AUC provides information about the global presence of a yeast throughout fermentation. To compare both yeasts and mitigate AUC-inherent variations depending on fermentation time, the following ratios were also calculated: µmax Lt/µmax Sc and AUCLt/AUCSc.
The impact of the chosen factors on fermentation was studied as a function of the fermentation time (end of fermentation when sugar was totally consumed) and the production of ethanol and lactic acid.
Data analysis of the experimental design was performed with Ellistat software v.7.0.0 (Ellistat, Chavanod, France). To compare the effect of the fermentation parameters studied, a standardized effect was calculated, as was the corresponding p-value (Student’s t-test), providing information about the significance of a given factor’s effect (very significant if the p-value < 0.01, significant if the p-value < 0.05). The contribution to total variance was also expressed in percent for each factor to help visualize and compare how each of them impacted each observed or calculated variable relative to the others. Interactions between factors were not considered for any of the variables studied, as residuals contributed less to the total observed variance than other non-significant factors, and thus did not account for a sufficiently significant effect to warrant further analysis.
3. Results and Discussion
To obtain a better understanding of the impact of fermentation parameters on the interactions between S. cerevisiae and L. thermotolerans, and consequently on the transformation of must into wine, it was vital to study fermentation through a global approach. To reach this goal, the population dynamics were first studied due to the direct influence of the environment on yeast development. Then, fermentation kinetics and volatile metabolites production were assessed in that order, as they not only depend on environmental conditions, but also on the population dynamics and yeast–yeast interactions that took place during the fermentation process. The resulting combination of these three datasets made it possible to better understand the overall impacts of each factor studied.
3.1. Impact of Fermentation Parameters on Population Dynamics
The first objective was to study how fermentation parameters such as nitrogen content, inoculum ratio, oxygenation, and temperature could impact the development of both yeasts: how their maximal growth rate and maximal population were modified and, mainly, which strain would be predominant throughout fermentation. Here, the aim was not to study the impact of chosen parameters independently as in previous studies, but simultaneously through the experimental design to allow for a comparison between effects.
The impacts of fermentation parameters on variables describing the population dynamics are given in Table 3. For each parameter/variable couple, the standard effect, p-value, and contribution to variance are shown. The standardized effect provides information on the nature and level of the impact of the parameter on the variable: an increase in the parameter chosen leads to an increase in the variable studied when the standardized effect is positive, and to a decrease when the standardized effect is negative. The p-value provides information on the significance of this variation, and the contribution to variance indicates the importance of the parameter chosen in explaining the total variation of the variable studied.
Table 3.
Impact of fermentation parameters on population dynamics (µmax, Nmax, AUC).
Regarding Saccharomyces cerevisiae, the growth rate µmax was positively and significantly impacted by temperature (stand. effect 4.094) and not by the other factors (contribution to variance of 73.4% for temperature). In contrast, the growth rate of Lachancea thermotolerans seemed to be impacted only by the inoculum ratio Sc/Lt, and at the limit of significance (stand. effect −3.010, p-value 0.057): µmax Lt tended to be higher when the inoculum ratio favored Lt. In this study, oxygenation had no impact on the growth rate of either yeast, whereas previous works showed a positive effect on the µmax of Lt [20]. No significant effect of nitrogen content was observed here, despite nitrogen sources having been previously shown to influence the growth of yeasts differently according to the nature and quantity of nitrogen compounds [21,35]. However, nitrogen content significantly impacted the growth rate only up to around 100 mg/L, depending on the species and strains of Sc [36]. As this “limiting concentration” was below both our chosen nitrogen levels (in line with our goal of avoiding nitrogen-scarce conditions), this explained the lack of a significant effect of this particular parameter on growth rate.
Thus, a decrease in temperature favored the faster development of Lt versus Sc: the µmax Lt/µmax Sc ratio was indeed higher at 18 °C than at 28 °C (stand. effect −3.594), which supported previous results [16]. Although both Lt and Sc were able to grow at 15–20 °C and even better at 25–30 °C on YPD agar [37], temperature affected the population dynamics in mixed cultures [38,39]. S. cerevisiae’s ability to grow at higher temperatures than most yeasts gives it an advantage: the temperature increase during fermentation can lead to its dominance versus non-Saccharomyces species during wine fermentation [40,41,42,43]. On the contrary, a decrease in temperature can enhance the growth and survival of non-Saccharomyces yeasts by attenuating their susceptibility to ethanol [29,44]. In addition, culture at low temperature could induce an increase in the intracellular level of ROS (reactive oxygen species) and an oxidative stress response (through mechanisms that are still not well understood) in S. cerevisiae: this can lead to a decrease in its maximal growth rate and reduce its competitiveness against other yeasts [36,45]. These different factors can provide an explanation for the significant impact of temperature on growth rates, both absolute (µmax Sc and µmax Lt) and relative (µmax Lt/µmax Sc).
Otherwise, in the conditions tested, the maximal population of both yeasts was affected differently by the factors studied. For Sc, the Nmax was significatively influenced by both temperature (positive effect, stand. effect 4.546, contrib. var. 45.7%) and oxygenation (negative effect, stand. effect −4.443, contrib. var. 43.7%). On the contrary, the maximal population of Lt was significantly impacted by temperature (which explained 77.5% of the variance, with a standard effect of −7.750) and with low significance by nitrogen (p-value 0.052, stand. effect 3.131).
Thus, an increase in temperature from 18 °C to 28 °C led to a higher Sc and a lower Lt population. Gobbi et al. (2013) [16] also described a lower maximal population of Sc when the temperature was decreased, but they did not observe a higher Lt population (they noticed the same population with a higher persistence during fermentation). In addition to temperature, in other studies [17,20] oxygenation favored the development of Lt and led to a higher maximal population, which was not observed as significant here. Garcia et al. (2021) [46] also showed that the survival of Lt in ethanol-stress conditions was enhanced in the presence of oxygen. The fact that such an impact was not observed here could be explained by differences in the oxygenation levels studied. Indeed, in this study, simple sparging of compressed air at the end of exponential growth was used to stay closer to cellar capabilities, although the works cited made use of either constant aerobic conditions [20,46] or multiple oxygen pulses over the fermentation process [17].
Concerning nitrogen, a higher concentration in the medium seemed to positively affect the Nmax Lt (stand. effect 3.131) but with low significance (p-value 0.052). As previously discussed for µmax, the chosen nonscarce nitrogen conditions may explain this lack of significant impact on this population variable. The incubation ratio had no significant effect on the maximal population obtained for both yeasts, thereby supporting the work of Comitini et al. (2011) [47], who observed the same maximum population (but with longer persistence) of Lt when favored by the inoculum ratio.
As the effects observed on the µmax and Nmax were different, the AUC was calculated to assess the impact of fermentation parameters on the population dynamics more precisely (see additional data in Table A1). Yeast distribution over time (AUCLt/AUCSc) was significantly and mainly managed by temperature (var. contribution 40.80%, stand. effect −8.267), but also by yeast ratio (var. contribution 29.20%, stand. effect −6.999) and oxygenation (var. contribution 27.80%, stand. effect 6.822), as illustrated in Figure 1.
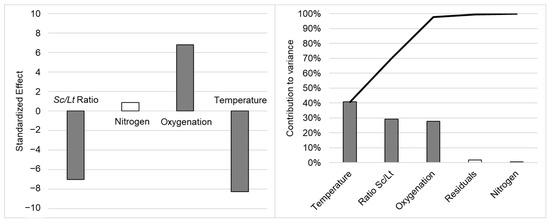
Figure 1.
Impact of fermentation parameters on the AUCLt/AUCSc ratio: standardized effect (left) and Pareto chart of contributions to variance (right). Data are noted as statistically not significant (p-value > 0.1, white) or very significant (p-value < 0.01, dark grey). The black curve on the Pareto chart is the cumulated contribution to variance.
A lower fermentation temperature, an inoculation ratio favoring Lt (lower Sc/Lt ratio), and air sparging at the end of exponential growth phase all led to a significant increase in the overall presence of Lt compared to Sc throughout fermentation (higher AUCLt/AUCSc). The inoculation ratio was quite straightforward, favoring Lt during the early days of culture, either directly by increasing its relative population at inoculation, or more indirectly by limiting the Sc population early on and thus reducing its potential negative interactions toward Lt. Oxygenation probably acted as described in the literature, as hypothesized by Shekhawat et al., by allowing the Lt population to better fulfill its oxygen needs, consequently allowing for better persistence over time and leading to higher cell counts through the stimulation of the respiratory metabolism over the fermentative one [17]. Moreover, Varela et al. (2021) [48] observed the population dynamics during the spontaneous fermentation of natural grape musts and also showed that aeration led to an increased proportion of non-Saccharomyces yeasts in the natural consortium, possibly related to the modification of membrane lipid composition, conferring a higher ethanol tolerance to the yeasts in question. The temperature effect on the AUC ratio probably resulted from previously discussed effects on the µmax, with quicker Sc growth inducing a quicker takeover of the culture media.
Considering these very important impacts of temperature, ratio, and oxygenation on the population dynamics (especially the AUC ratio), only two conditions (D and G: 18 °C, ratio Sc/Lt 0.1, oxygenation) led to the predominance of Lt on Sc and to the persistence of Lt with a high population throughout fermentation (see additional data in Figure A1). The results also showed that the amount of nitrogen in the culture medium had no significant effect on the population dynamics when modulated between the two levels chosen (150 mg·L−1 and 300 mg·L−1), except for a small positive but nonsignificant (p-value = 0.052) effect on the Nmax for Lt. As discussed for the single variables, the nature of nitrogen sources (ammonium, amino acids, or both) can impact maximal growth and maximal population of Lt in pure culture, but with strain-dependent variability [21,35,49]. In addition, the consumption kinetics of amino acids can vary according to the amino acid and differ from those observed in Sc, leading to possible competition in Sc/Lt coculture. Nevertheless, Kemsawad et al. (2015) noticed that Lt could grow and maintain itself even if no nitrogen was present in the synthetic medium, making use of autolysis phenomena to obtain nitrogen compounds [21]. In addition, the amount of nitrogen, even at the lowest value, is usually sufficient to allow for yeast growth and complete fermentation, as a minimum of 140 mg/L is usually recommended [22]. For all these reasons, the result observed here could be explained by the fact that the experimental conditions chosen did not aim to emulate complete nitrogen scarcity, or by a strain-specific tolerance to these lower levels of nitrogen, or both.
By studying the different fermentation factors, we expected to see an effect of all these factors on the population dynamics, as observed by other authors. Nevertheless, when all these factors were combined, their relative importance could be seen. It seemed in the conditions studied that overall, temperature was the most important factor in optimizing Lt presence over time during fermentation (AUCLt/AUCSc ratio). In addition to temperature, oxygenation and the inoculum ratio also appeared to be significant, but were still secondary factors in obtaining the persistence or predominance of Lt over Sc throughout the fermentation process.
To our knowledge, this is the first time information has been obtained regarding the combined effect of different fermentation parameters on the population dynamics. Such information constitutes a tool to control proper Lt implantation, and also to help in determining which yeast (Sc or Lt) will dominate the other during a mixed culture with given or adjustable parameters. This ensures both that Lt will have enough overall persistence to potentially influence final wine quality and that Sc will still persist to ensure fermentation does not go on for too long or become stuck.
3.2. Impact of Fermentation Parameters on Fermentation Time and Physicochemical Variables
As mentioned in the general introduction of this study, both Sc and Lt have different fermentative capabilities when used in pure culture, with Sc leading to a shorter fermentation and a higher amount of ethanol, and Lt culture leading to less alcohol and a decrease in pH via lactic acid production, but with a higher fermentation time. The goal of an optimized mixed fermentation is to obtain a compromise between the properties of both yeasts. Thus, after having studied the influence of the different parameters on the population dynamics, it was necessary to study their general impact on fermentation to see how both these different population equilibria and the more direct impact of the yeast metabolism parameters chosen could modify the characteristics of the medium.
The effects of incubation ratio, nitrogen content, oxygenation, and temperature on fermentation are given in Table 4.
Table 4.
Impact of parameters on fermentation.
Fermentation took between 7 and 16 days to obtain the total consumption of sugars, depending on the conditions tested (see additional data in Figure A1 and Table A2). Thus, the choice of environmental conditions could considerably affect the resulting fermentation kinetics.
The four factors studied had different impacts on fermentation time. Oxygenation seemed to lead to longer fermentation times (stand. effect 3.086), which was to be expected, given that it was shown above to favor Lt more than Sc. On the contrary, an increase in the Sc/Lt ratio or in the amount of nitrogen resulted in a decrease in fermentation time (stand. effect −3.057 and −2.384, respectively, but with a slight significance (p-value 0.055 and 0.097, respectively)) due to their positive impact on the Sc population. An increase in temperature led to a shorter fermentation (stand. effect −7.122, p-value 0.006). This very significant effect (which explained 64.8% of the variance) was certainly linked to the positive effect of temperature on the Sc population (see Section 3.1), and supported the work of Gobbi et al. (2013) [16].
Ethanol production reached values of about 11–12% ethanol (v/v) at the end of the fermentation for all the conditions tested (see additional data in Table A2). This production was not impacted by temperature or the amount of nitrogen, but was impacted, albeit with a low significance (p-value of 0.063 and 0.065, respectively), by the Sc/Lt ratio and oxygenation. An increase in the Sc/Lt ratio led to an increase in Sc at the expense of Lt (see Section 3.1.) and to an increase in ethanol production (stand. effect 2.899). On the contrary, oxygenation, which led to a decrease in the Sc compared to Lt population (see Section 3.1), led at the same time to a decrease in ethanol production (stand. effect −2.857). As the Crabtree effect, which was weaker in Lt than in Sc, favors respiration and leads to lower ethanol production by Lt [11], this lower ethanol production could be explained by the modulation of this metabolic pathway. Moreover, the ethanol yield of Lt has also been described as being significantly lower than for Sc [12]. Although the respective impacts of these two hypotheses were impossible to properly determine within the scope of this study, the overall negative impact of oxygenation on ethanol production was still observable, and could be of interest to winemakers willing to decrease the ethanol content of their wines.
The final pH was not significantly impacted by temperature, oxygenation, or nitrogen content. The Sc/Lt ratio had a positive effect on pH (stand. effect 2.575, var. contrib. 57.90%). The pH values observed when the inoculum ratio was 0.1 (predominance of Lachancea thermotolerans) were lower than those obtained with a ratio of 1. This pH reduction in mixed cultures Sc/Lt compared to Sc pure culture is often observed whatever the conditions (modalities of inoculation, temperature, medium) [16].
This decrease in pH could be linked at least partially to the production of lactic acid. Lachancea thermotolerans, as discussed above, is specifically known amongst non-Saccharomyces for its ability to transform pyruvate into this acid through lactate dehydrogenases [11,50]. As S. cerevisiae is not able to produce lactic acid [51] or, depending on the strain, can produce it in trace amounts only [50], the final amount of this acid can be directly related to the population dynamics, and specifically to the Lt population. Conditions either favoring Lt development compared to Sc or inhibiting antagonistic interactions from Sc that limit Lt growth or persistence will therefore indirectly favor lactic acid production during the fermentation process.
In the different conditions tested, the production of lactic acid varied between 0.82 and 3.52 g·L−1. These values are classical ones as the production of this acid is highly dependent on the strain (<0.1 to >15 g·L−1) and on conditions [11,50,52,53]. Lactic acid concentration was considerably impacted by the Sc/Lt ratio (var. contrib. 83.30%, stand. effect −7.322). A decrease in this ratio indeed favored the predominance of Lt in the earlier stages of the fermentation, and this species’ lactic acid production has previously been shown to occur predominantly at the beginning of fermentation, during exponential growth [2,6,16,54]. This hypothesis was further supported by the pH dynamics shown in Figure 2, in which a rapid pH decrease during the first 72 h can be observed, with this falloff being on average significantly greater for conditions with an Sc/Lt ratio of 0.1.
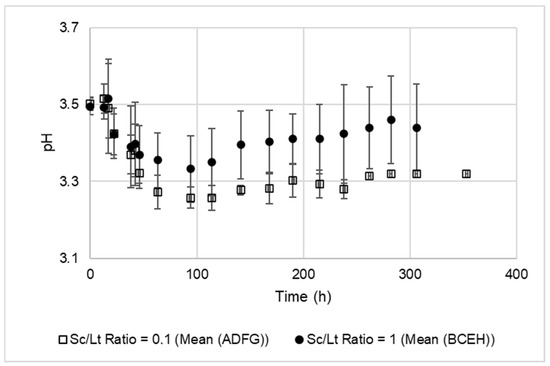
Figure 2.
Evolution of pH during fermentation in mixed cultures with a Sc/Lt ratio of 0.1 or 1.
Using an Sc/Lt ratio of 0.1 in mixed culture in natural must, Gobbi et al. (2013) [16] showed that the effects of the interaction between Lt and Sc on fermentation (decreases in ethanol and pH, increase in lactic acid compared to a pure culture of Sc) were more significant at 20 °C than at 30 °C, but this could have been related to the better persistence of Lt in these conditions (as also observed earlier in this study—see Section 3.1).
Morata et al. (2018) also observed that a higher lactic acid production was correlated with a more numerous Lt population and a higher nitrogen content (up to 500 mg/L) [54]. This impact of nitrogen was not significant here within our chosen concentration levels.
Lactic acid production did not appear to be impacted by oxygenation, although Shekhawat et al. (2020) showed an induction of lactate dehydrogenase gene expression in pure cultures of Lt and the redirection of metabolism toward lactic acid in response to anaerobic conditions [55]. However, the direct impact of oxygenation conditions on effective lactic acid production has not yet been shown in the current literature, and conclusions are therefore hard to draw based only on transcriptomic results.
This study highlighted the key role of temperature to control fermentation time over other factors that did not have as much impact or significance. This role can be linked to the population dynamics seen in Section 3.1, and confirmed that overfavoring Lt in a mixed culture can lead to sluggish or stuck fermentations, an eventuality that must be avoided. Decreasing the ethanol concentration in these Sc/Lt cultures was difficult in these conditions, since the parameters chosen had no or very little impact on ethanol production. In contrast, the inoculum ratio turned out to be the most important factor in modulating lactic acid production, without it being necessary to modulate other fermentation parameters. It could be an interesting tool to control wine acidification without drastic changes in usual winemaking practices.
3.3. Impact of Fermentation Parameters on Volatile Compound Production
As the production of aroma compounds is variable according to previous studies [2], it was also interesting to observe this production in the mixed Sc/Lt culture and study the influence of fermentation parameters, as the volatile compounds produced modified the final sensorial characteristics of the wine. As seen above, the parameters chosen had a significant impact on the population dynamics, a modulation that also had repercussions on fermentation variables such as fermentation time and lactic acid production. We therefore assumed it would also impact the production of aroma compounds in a similar way, both directly (metabolism modifications) and indirectly (population dynamics).
The volatile compounds present in the final synthetic wines obtained with the different conditions tested were subjected to a principal component analysis. The first two principal components, F1 and F2, explained 36.4 and 25.4% of the variance, respectively, as shown in Figure 3.
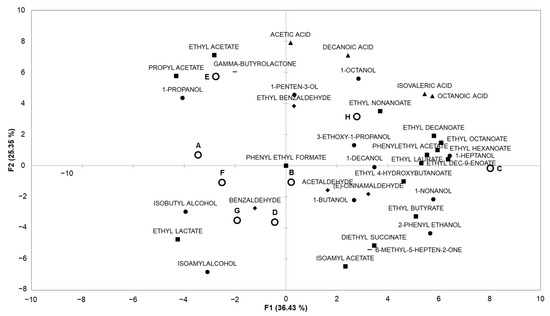
Figure 3.
Principal component analysis (PCA) based on volatile compounds present in the final medium after fermentation in conditions A to H. The compounds are represented as followed: ● alcohols; ◆ aldehydes; ▲ carboxylic acids; ▬ ketones; ■ esters.
Axis F1 marks a separation between four groups: condition E, which is close to ɣ-butyrolactone and esters with short chains; condition H, which is closer to carboxylic acids; conditions G and D, which are close to benzaldehyde (conditions corresponding to the predominance of Lt throughout the fermentation); and the other conditions.
Axis F2 separates condition C, which is close to esters derived from C6 to C10 carboxylic acids; condition H, which is closer to alcohols and acids; and the other conditions
Some conditions (A, B, D, F, G) led to media with quite similar volatilomes and others (C, E, H) with different volatile compound profiles. These results showed that the fermentation parameters studied seemed to broadly impact the production of aroma compounds, and could therefore be useful in modifying the volatile composition of the final wine.
A statistical analysis was performed first on the results concerning each class (aroma compounds grouped into alcohols, aldehydes, ketones, carboxylic acids, and esters), then on the results concerning each volatile molecule. The results are presented in Table 5, Table 6, Table 7 and Table 8.
Table 5.
Impact of fermentation parameters on the production of volatile compounds.
Table 6.
Impact of fermentation parameters on the production of different volatile alcohols.
Table 7.
Impact of fermentation parameters on the production of different volatile compounds (aldehydes, ketones, acids).
Table 8.
Impact of fermentation parameters on the production of different esters.
The Sc/Lt ratio had a significant positive impact on the production of carboxylic acids and esters (stand. effect 6.199 and 2.614, respectively) and a negative impact on alcohol production (stand. effect −9.037). The Sc population seemed to be mainly linked to the formation of acids and esters. This was in line with the work of Morales et al. (2019) [23], who showed an increase in ethyl esters, acetals, and acids, as well as a decrease in alcohols, when the proportion of Saccharomyces cerevisiae increased in the inoculum. As the Sc/Lt ratio significantly impacted the proportion of each yeast in the media over time (as seen in Section 3.1), and as these two species did not produce the same aroma compounds [16,20,23], the aroma profile of a given mixed culture was indeed expected to be very different from either pure culture. However, interactions between yeasts can also change their metabolism and their aroma production, resulting in an apparent synergy (higher amount in mixed culture compared to pure cultures), as observed previously [16,23].
The amount of nitrogen had a significant effect (stand. effect 4.742) only on alcohol production. Rollero et al. (2021) highlighted the link between nitrogen sources and aroma production in cocultures of Sc with several non-Saccharomyces yeasts [56]. Higher alcohols can be produced from both sugars and amino acids: differences in the consumption kinetics of nitrogen sources and in metabolism flux according to the yeast can then lead to various productions of aroma compounds. Some authors also found that modifying nitrogen levels can lead to the production of different volatile compounds in pure Sc cultures [22], thus correlating with this conclusion.
Oxygenation had no significant impact on the production of the different families of volatile compounds. This was in contradiction with the results of Shekhawat et al. (2017), who noticed an increase in the production of alcohols and volatile acids and a decrease in medium-chain fatty acids and corresponding esters [20]. However, the differences in oxygenation protocols already discussed in Section 3.1 could explain this lack of a significant effect in the conditions of our study.
Temperature had a negative impact on the production of alcohols and ketones (stand. effect −10.175 and −3.825, respectively), a positive effect on ester and acid production (stand. effect 4.514 and 2.685, respectively), and no significant effect on aldehyde production. As temperature was previously shown to significantly impact population dynamics in this study, such shifts in aroma production were to be expected, as the media was fermented by very different yeast populations depending on the temperature chosen.
An increase in aroma production, notably esters, was observed previously at low temperature with some strains of S. cerevisiae, and this increase seemed to be related to a change in membrane lipid composition in response to the stress linked to the temperature decrease [57,58].
More specifically, regarding the volatile molecules produced during fermentation, several alcohols are produced: primary alcohols with 3 to 10 carbons, isobutyl alcohol, isoamyl alcohol, 2-phenylethanol, etc. Table 6 shows the impacts of fermentation parameters on the production of these alcohols. These results are also illustrated in Figure 4, which presents the standardized effects of each fermentation parameter on this production.
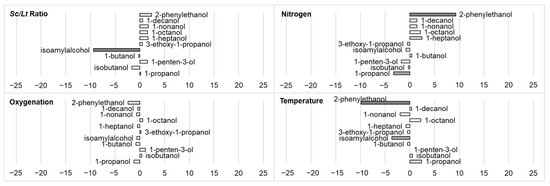
Figure 4.
Impact (standardized effects) of fermentation parameters (Sc/Lt ratio, nitrogen, oxygenation, temperature) on the production of different volatile alcohols. Data are identified as statistically almost significant (0.05 < p-value < 0.1, light grey), significant (p-value < 0.05, grey), or very significant (p-value < 0.01, dark grey).
A significant impact of environmental factors was observed only on three molecules: 1-propanol, isoamyl alcohol, and 2-phenylethanol. For the other alcohols, the contribution of residuals to total variance was high, but no significant impact of interactions between factors could be observed, even when examined in more detail. This furthered the hypothesis that this lack of observed effects was due to a real absence of effects of the conditions studied on the production of these molecules.
The production of 1-propanol was significantly influenced by nitrogen content (negatively, stand. effect −3.271) and to a lesser extent (p-value 0.097) by temperature (positively, stand. effect 2.392). The negative influence of nitrogen content showed the complexity of forecasting the production of an aroma compound in a coculture. Propanol is indeed produced from amino acids (while other alcohols can come from both amino acids and sugars) [56]: an increase in nitrogen content should have favored its production. Gobbi et al. (2013) [16] and Balikci et al. (2016) [59] observed a higher production of propanol by Lt compared to Sc in pure culture, in contrast to the observations of Morales et al. (2019) [23] in a sugar-rich must. Vicente et al. (2021) noticed that L. thermotolerans usually produced low amounts of higher alcohols, but with a high strain variability [11]. Temperature had a positive effect (stand. effect 2.392) on the production of 1-propanol, contrary to the results of Gobbi et al. (2013) [16]. All these conflicting observations highlighted the variability of propanol production, depending on strains, media, and culture conditions chosen, especially in mixed cultures [16,23,53,59].
The production of 2-phenylethanol was impacted mainly by nitrogen content (positively, stand. effect 9.281) and temperature (negatively, stand. effect −9.895). Gonzalez et al. (2018) observed that nutrient conditions (nitrogen sources, glucose amount) affected the production of phenylethanol (a molecule that can play a quorum-sensing role) with other non-Saccharomyces yeasts [60]. Fairbairn et al. (2021) noticed an increase in the production of 2-phenyl ethanol by Lt when the medium was supplemented with phenylalanine (its precursor) compared to a medium with an addition of ammonium only [49]. In a mixed culture Sc/Lt under anaerobic conditions compared to a pure culture of Lt, Shekhawat et al. (2019) [61] observed an upregulation of genes involved in the metabolism of amino acids, and especially those involved in the conversion of phenylalanine into phenylethanol. This suggested that this upregulation, which probably was linked to interactions, could be lower in the case of aerobic conditions. This could then explain the negative impact that oxygenation seemed to have on phenylethanol production in this study (stand. effect −2.367, with a lower significance: p-value 0.099).
Temperature had a negative effect on 2-phenylethanol production (stand. effect −9.895). Gobbi et al. (2013) observed no effect on this production [16]. However, they observed a higher concentration of 2-phenylethanol in the presence of Lt compared to a pure culture of Sc under all of the conditions tested (inoculation modalities, temperature of fermentation, different grape juices). They explained that this production was due to synergy between Sc and Lt, as both of these yeasts are low producers of this compound. On the other hand, Morales et al. (2019) observed an increase in phenylethanol production in natural must when the Sc/Lt ratio decreased in the inoculum from 0.2 to 0.02 [23]: the results here showed a slight inverse trend (stand. effect 2.350, p-value 0.1), although it did not seem to be the most impactive factor, accounting for only 2.79% of the observed variance. Both these impacts of temperature and Sc/Lt ratio on 2-phenylethanol production may, at first glance, be perceived as the sole result of the impact of temperature and Sc/Lt ratio on yeast populations shown in Section 3.1. However, metabolism modifications via yeast–yeast interactions tend to complexify the phenomenon, as discussed earlier in this study.
The production of isoamyl alcohol decreased when the inoculum ratio favored Sc (stand. effect −9.407, var. contrib. 83.70%) or when temperature was increased (stand. effect −3.636, var. contrib. 12.50%). A negative impact of the Sc/Lt ratio on isoamyl alcohol production was also observed by Morales et al. (2019) [23]. Temperature had a negative effect on isoamyl alcohol, but Gobbi et al. (2013) did not observe any impact of temperature on the production of this molecule [16]. Fairbairn et al. (2021) noticed an increase in the production of isoamyl alcohol by Lt when the medium was supplemented with the amino acid precursors of this alcohol (leucine, isoleucine) compared to a medium with an addition of ammonium only [49]: such an impact of nitrogen was not observed here. Shekhawat et al. (2017) [20] observed, in mixed Sc/Lt cultures, that oxygenation resulted in an increase in higher alcohols, particularly isoamyl alcohol, 2-phenylethanol, and isobutanol: the absence of an effect of oxygenation observed here can be linked to different conditions of temperature and medium composition (yeast extract as a nitrogen source versus individual amino acids), to the differences in oxygenation levels mentioned previously, or to a strain-dependence factor.
Table 7 shows the impacts of fermentation parameters on the production of various volatile compounds (aldehydes, ketones, and acids). These results are also illustrated in Figure 5, which presents the standardized effects of each fermentation parameter on this production.
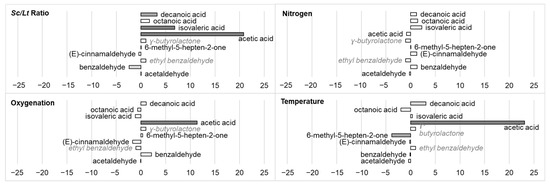
Figure 5.
Impact (standardized effects) of fermentation parameters (Sc/Lt ratio, nitrogen, oxygenation, temperature) on the production of different volatile compounds (aldehydes, ketones, acids). Data are identified as statistically almost significant (0.05 < p-value < 0.1, light grey), significant (p-value < 0.05, grey), or very significant (p-value < 0.01, dark grey). Compounds in italics and in grey were only present in trace amounts, with values too low to perform a relevant statistical test.
During fermentation in the different conditions tested, aldehydes (acetaldehyde, benzaldehyde) and some ketones were produced. Concerning the global production of aldehydes, none of the four factors tested had a significant effect on their production. As far acetaldehyde is concerned, the Sc/Lt ratio had a positive effect on its production according to Morales et al. (2019) [23], but this was not observed here. The results concerning the production of acetaldehyde in mixed Sc/Lt cultures indeed seemed to be variable and strain-dependent [11]. A slight effect of the Sc/Lt ratio on benzaldehyde production (stand. effect −2.424, p-value 0.094) was nevertheless observed.
Regarding ketones, the production of 6-methyl-5-hepten-2-one was negatively impacted by an increase in temperature (stand. effect −3.838), but not by the other factors. Morales et al. 2019 [23] showed that this compound was produced more by Sc than Lt in pure culture, and that in mixed culture with different Sc/Lt ratios, it led to lower quantities than in Lt culture, leading to the assumption that it may be regulated by an interaction between the two species.
The fermentation of the different synthetic musts in tested conditions led to the production of various organic acids: isovaleric acid, octanoic acid, decanoic acid, and acetic acid. Octanoic acid was not affected by the factors studied. Decanoic acid production was impacted by the Sc/Lt ratio as isovaleric acid (stand. effects 3.250 and 6.826, p-value 0.048 and 0.006, respectively) and also by temperature (stand. effect 3.100, p-value 0.053). Regarding acetic acid, its final content was managed by temperature and oxygenation (stand. effect 23.103 and 11.375, respectively). Its production also increased when the Sc/Lt ratio increased (stand. effect 20.805), supporting previous results [23,47]. Lt is indeed known to produce acetic acid at low concentrations, leading to a lower volatile acidity of wine [2,14]; however, high strain variability was observed in previous studies [11]. The positive impact of oxygenation on acetic acid production was unexpected, as this parameter favors the overall presence of Lt over time. Lt does not produce as much acetic acid as Sc [20,23]. However, it has also been shown in previous works that oxygenation significantly modulated acetic acid metabolism and increased its production for both species in both pure and mixed cultures. Moreover, this modulation was linked to a decrease in ethanol production [20], a tendency noted in Section 3.2 (albeit with low significance), which further corroborated this hypothesis.
Table 8 shows the impacts of fermentation parameters on the production of esters. These results are also illustrated in Figure 6, which presents the standardized effects of each fermentation parameter on this production.
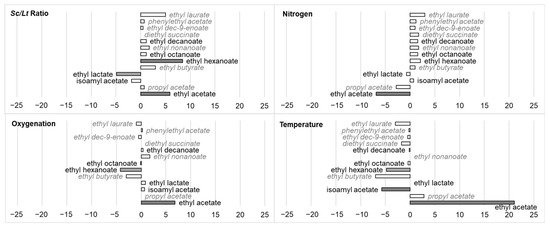
Figure 6.
Impact (standardized effects) of fermentation parameters (Sc/Lt ratio, nitrogen, oxygenation, temperature) on the production of different esters. Data are identified as statistically almost significant (0.05 < p-value < 0.1, light grey), significant (p-value < 0.05, grey), or very significant (p-value < 0.01, dark grey). Compounds in italics and in grey were only present in trace amounts, with values too low to perform a relevant statistical test.
After fermentation, the media contained different esters derived from different acids and fatty acids: ethyl acetate, isoamyl acetate, ethyl lactate, ethyl hexanoate, octanoate, etc. Although some factors influenced the production of fatty acids such as decanoic acid, no significant effect was observed on esters from these acids. The environmental factors studied significantly impacted only four molecules: ethyl acetate, isoamyl acetate, ethyl hexanoate, and ethyl lactate. Ethyl acetate production increased with an increase in the Sc/Lt ratio, oxygenation, and particularly temperature (stand. effects 5.914, 6.856 and 21.058, respectively), but with a decrease in nitrogen content (stand. effect −6.856). These results were in contradiction with previous works [16,23] in which an increase in ethyl acetate was observed in conditions favoring the development of Lt (low temperature, low Sc/Lt ratio). However, other studies have also shown that the population dynamics were not the only factor in play here, and that synergy effects could occur as mixed Sc/Lt cultures can end up with higher ethyl acetate content than either of the pure ones [20,59]. Isoamyl acetate production was negatively impacted by temperature (stand. effect −5.746), while ethyl hexanoate was influenced mostly and positively by the Sc/Lt ratio (stand. effect 8.486), and negatively by oxygenation and temperature (stand. effects −4.185 and −4.766, respectively). Ethyl lactate production was negatively influenced by the Sc/Lt ratio (stand. effect −4.883). This result should be linked to results concerning lactic acid, since it is a precursor of ethyl lactate. Hranilovic et al. (2021) [53] showed that sequential inoculation, which allows Lt to develop better at the beginning of fermentation, led to an increase in ethyl lactate, but these authors also noted that the production of this aroma compound was strain-dependent.
Overall, the production of aroma compounds was impacted by fermentation parameters, but in very different ways depending on both the modulated factor and the volatile molecule studied. Some impacts could be explained by the population dynamics, but interactions between Lt and Sc often occurred. These interactions led to metabolism changes and consequently to volatile production, which was different from what would be expected. As far as the production of higher alcohols is concerned, nitrogen content seemed to be a key factor to control. As was shown in Section 3.1 nitrogen content did not significantly impact the population dynamics; this suggested an interaction between Sc and Lt, and more specifically competition for amino acids known to be aroma precursors [22,35]. These results then highlighted both the possibility of impacting the final wine volatilome by modulating specific fermentation parameters depending on the goal sought: carboxylic acid production could be modulated by modifying only the inoculum ratio (in a way similar to that of lactic acid, as noted in Section 3.2), whereas for ketones and esters, temperature seemed to be the most important (and only significant) lever of action. The presence of higher alcohols could be impacted by both of these parameters and, as discussed above, by supplementation with nitrogen, which could offset competition between Sc and Lt for specific precursors.
4. Conclusions
Through a multiparametric approach making use of experimental design, this work provided a better understanding of the impact of fermentation parameters on wine fermentation that simultaneously involved Saccharomyces cerevisiae and Lachancea thermotolerans. In contrast to most studies, factors here were studied simultaneously and not separately. This global approach allowed us to establish discrepancies between the relative impacts of each parameter studied for the first time. Indeed, previous works mostly focused on one parameter at a time, and not always in controlled and repeatable conditions (natural must, for example). Although these methods had their obvious advantages (better characterization of the single effect of a given factor, closer to real conditions, etc.), they were often unable to conclude globally by comparing different impacts of factors studied; moreover, the natural media induced variability and hindered reproducibility. The choices made in this study were meant to fill this gap by relying on experimental design as well as the use of a synthetic medium and controlled conditions to help establish how the chosen parameters (inoculum ratio, nitrogen, oxygenation, temperature) could influence fermentation on many interconnected levels (population dynamics, fermentation dynamics and results, final volatile compound profiles).
This study suggested that fermentation parameters could constitute tools to control various variables of interest in winemaking, such as the proper implantation of a yeast strain in must, the persistence or dominance of one yeast over another, fermentation time, acidification, and even the characteristics of the final wine volatilome. The population dynamics, as shown, were mostly and strongly impacted by temperature, and to a limited extent by oxygenation. The fermentation dynamics were influenced by temperature and the Sc/Lt ratio, while lactic acid and pH were dependent on the Sc/Lt ratio only. The production of volatile compounds (especially alcohols) seemed to be partly modulated by nitrogen content, and this area would therefore be an interesting perspective to explore in further studies. Analyzing precisely how the nitrogen content of the media fluctuates over time during the fermentation process [62] would provide valuable insight by helping to establish links between the modulation of specific compounds and the availability of specific amino acids. Thanks to the global approach taken, this study also highlighted that the production of certain volatile compounds was not only related to the population dynamics, but also was most likely impacted by interactions between species. Further works could eventually go as far as using a sensorial analysis to attempt to link the chosen fermentation parameters and resulting population dynamics to the final wine obtained and its subsequent perception by oenologists and consumers.
These results showed that the effects of fermentation parameters were very different depending on which variable was studied, which could explain the variability of the results observed in previous different studies.
To manage a mixed culture between L. thermotolerans and S. cerevisiae, it is then necessary to follow a global approach (population dynamics, fermentation kinetics and products, physicochemical parameters, aroma compounds, etc.) to find the best compromise between manageable conditions, leading to an optimized wine. For example, the two conditions allowing for the persistence of Lt until the end were also those that took the most time to complete, and the risk of them becoming sluggish or even stuck was non-negligible. On the other hand, the results showed that the lactic acid content of the final wine could very well be modulated by modifying only the inoculation ratios, without any regard for other factors. Indeed, ensuring adequate Lt persistence over time did not seem vital to achieving such a goal. Thus, this study showed that monitoring mixed-culture fermentations seems to be achievable, and can even impact specific variables of interest through the modification of certain precise fermentation conditions.
Overall, although this was not the main goal of this study, it still paved the way toward establishing a potential model for simulating population dynamics and obtaining final synthetic wines in similarly controlled conditions. Building such a model and ensuring its reliability would demand both a broadening of the experimental design given above by including other external conditions to be studied and refining it by including more levels per factor, and thus characterizing the linearity or non-linearity of responses to the external conditions chosen. Of course, either one of these perspectives would also be interesting to pursue separately, and could be the focus of future studies.
Author Contributions
Conceptualization, A.J., G.K. and H.A.; methodology, A.J., G.K., C.R.-G. and H.A.; validation, A.J., G.K. and H.A.; formal analysis, A.J. and C.R.-G.; investigation, A.J.; resources, A.J. and H.A.; data curation, A.J.; writing—original draft preparation, A.J.; writing—review and editing, G.K. and H.A.; visualization, A.J.; supervision, H.A.; project administration, G.K. and H.A.; funding acquisition, H.A. All authors have read and agreed to the published version of the manuscript.
Funding
This work is part of the project JCE 2018, supported by the Conseil Régional de Bourgogne Franche-Comté and the European Union through the PO Feder-FSE Bourgogne 2014/2020 programs.
Institutional Review Board Statement
Not applicable.
Informed Consent Statement
Not applicable.
Data Availability Statement
The authors confirm that the data supporting the findings of this study are available within the article and its Appendix A. The raw data are available from the corresponding author upon reasonable request.
Conflicts of Interest
The authors declare no conflict of interest.
Appendix A
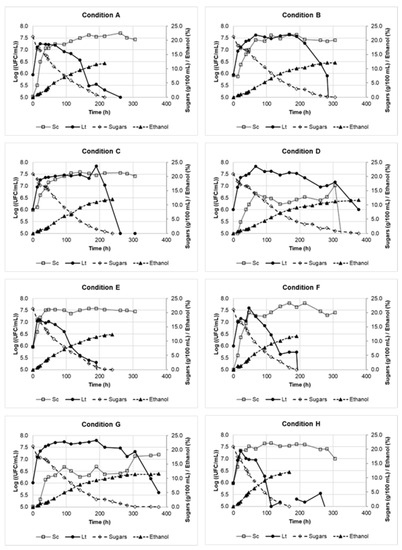
Figure A1.
Evolution of both yeast populations, sugar concentrations, and ethanol concentrations during coculture of S. cerevisiae and L. thermotolerans in the different conditions of the experimental design (A–H).
Table A1.
Quantitative data related to population dynamics in the different conditions of the experimental design (A to H): maximal population (Nmax), maximal growth rate (µmax), area under growth curve (AUC), µmax Sc/µmax Lt ratio, AUCLt/AUCSc ratio.
Table A1.
Quantitative data related to population dynamics in the different conditions of the experimental design (A to H): maximal population (Nmax), maximal growth rate (µmax), area under growth curve (AUC), µmax Sc/µmax Lt ratio, AUCLt/AUCSc ratio.
| Sc/Lt Ratio | Nitrogen (mg·L−1) | Oxygenation | Temperature (°C) | µmax Sc (h−1) | µmax Lt (h−1) | µmax Lt/ µmax Sc | Nmax Sc (UFC·mL−1) | Nmax Lt (UFC·mL−1) | AUCSc | AUCLt | AUCLt/AUCSc | |
|---|---|---|---|---|---|---|---|---|---|---|---|---|
| A | 0.1 | 150 | No | 28 | 0.278 | 0.201 | 0.72 | 5.00 × 10⁷ | 1.80 × 10⁷ | 9.14 × 10⁹ | 1.67 × 10⁹ | 0.18 |
| B | 1 | 150 | No | 18 | 0.063 | 0.073 | 1.16 | 4.40 × 10⁷ | 4.40 × 10⁷ | 8.52 × 10⁹ | 7.16 × 10⁹ | 0.84 |
| C | 1 | 300 | No | 18 | 0.052 | 0.162 | 3.12 | 3.80 × 10⁷ | 6.90 × 10⁷ | 8.88 × 10⁹ | 6.21 × 10⁹ | 0.70 |
| D | 0.1 | 300 | Yes | 18 | 0.082 | 0.243 | 2.96 | 1.10 × 10⁷ | 6.70 × 10⁷ | 1.12 × 10⁹ | 9.16 × 10⁹ | 8.18 |
| E | 1 | 150 | Yes | 28 | 0.286 | 0.198 | 0.69 | 3.80 × 10⁷ | 1.20 × 10⁷ | 9.80 × 10⁹ | 8.70 × 10⁸ | 0.09 |
| F | 0.1 | 300 | No | 28 | 0.268 | 0.216 | 0.81 | 6.40 × 10⁷ | 4.00 × 10⁷ | 1.03 × 10¹⁰ | 1.70 × 10⁹ | 0.17 |
| G | 0.1 | 150 | Yes | 18 | 0.080 | 0.240 | 3.00 | 1.60 × 10⁷ | 6.20 × 10⁷ | 1.92 × 10⁹ | 1.22 × 10¹⁰ | 6.35 |
| H | 1 | 300 | Yes | 28 | 0.116 | 0.168 | 1.45 | 4.50 × 10⁷ | 2.10 × 10⁷ | 9.65 × 10⁹ | 9.00 × 10⁸ | 0.09 |
Table A2.
Quantitative data related to fermentation in the different conditions of the experimental design (A to H): fermentation time (time of total consumption of initial sugars), ethanol concentration, pH, and lactic acid concentration at the end of the fermentation.
Table A2.
Quantitative data related to fermentation in the different conditions of the experimental design (A to H): fermentation time (time of total consumption of initial sugars), ethanol concentration, pH, and lactic acid concentration at the end of the fermentation.
| Sc/Lt Ratio | Nitrogen (mg·L−1) | Oxygenation | Temperature (°C) | Fermentation Time (h) | Ethanol (%) | pH | Lactic Acid (g·L−1) | |
|---|---|---|---|---|---|---|---|---|
| A | 0.1 | 150 | No | 28 | 215 | 11.93 | 3.34 | 2.02 |
| B | 1 | 150 | No | 18 | 306 | 11.98 | 3.44 | 0.93 |
| C | 1 | 300 | No | 18 | 238 | 12.08 | 3.45 | 0.85 |
| D | 0.1 | 300 | Yes | 18 | 377 | 11.53 | 3.40 | 2.69 |
| E | 1 | 150 | Yes | 28 | 238 | 11.92 | 3.40 | 0.82 |
| F | 0.1 | 300 | No | 28 | 190 | 11.78 | 3.33 | 2.33 |
| G | 0.1 | 150 | Yes | 18 | 377 | 11.17 | 3.24 | 3.52 |
| H | 1 | 300 | Yes | 28 | 168 | 11.80 | 3.42 | 0.85 |
References
- Roudil, L.; Russo, P.; Berbegal, C.; Albertin, W.; Spano, G.; Capozzi, V. Non-Saccharomyces Commercial Starter Cultures: Scientific Trends, Recent Patents and Innovation in the Wine Sector. Recent Pat. Food Nutr. Agric. 2020, 11, 27–39. [Google Scholar] [CrossRef] [PubMed]
- Borren, E.; Tian, B. The Important Contribution of Non-Saccharomyces Yeasts to the Aroma Complexity of Wine: A Review. Foods 2020, 10, 13. [Google Scholar] [CrossRef] [PubMed]
- Tufariello, M.; Fragasso, M.; Pico, J.; Panighel, A.; Castellarin, S.D.; Flamini, R.; Grieco, F. Influence of Non-Saccharomyces on Wine Chemistry: A Focus on Aroma-Related Compounds. Molecules 2021, 26, 644. [Google Scholar] [CrossRef] [PubMed]
- Varela, C. The Impact of Non-Saccharomyces Yeasts in the Production of Alcoholic Beverages. Appl. Microbiol. Biotechnol. 2016, 100, 9861–9874. [Google Scholar] [CrossRef] [PubMed]
- Vilela, A. Lachancea Thermotolerans, the Non-Saccharomyces Yeast That Reduces the Volatile Acidity of Wines. Fermentation 2018, 4, 56. [Google Scholar] [CrossRef] [Green Version]
- Morata, A.; Escott, C.; Loira, I.; Manuel Del Fresno, J.; Vaquero, C.; Antonia Bañuelos, M.; Palomero, F.; López, C.; González, C. PH Control and Aroma Improvement Using the Non-Saccharomyces Lachancea Thermotolerans and Hanseniaspora Spp. Yeasts to Improve Wine Freshness in Warm Areas. In Grapes and Wine; IntechOpen: London, UK, 2021. [Google Scholar]
- Morata, A.; Loira, I.; González, C.; Escott, C. Non-Saccharomyces as Biotools to Control the Production of Off-Flavors in Wines. Molecules 2021, 26, 4571. [Google Scholar] [CrossRef]
- Zilelidou, E.A.; Nisiotou, A. Understanding Wine through Yeast Interactions. Microorganisms 2021, 9, 1620. [Google Scholar] [CrossRef]
- Howell, K.S.; Cozzolino, D.; Bartowsky, E.J.; Fleet, G.H.; Henschke, P.A. Metabolic Profiling as a Tool for Revealing Saccharomyces Interactions during Wine Fermentation. FEMS Yeast Res. 2006, 6, 91–101. [Google Scholar] [CrossRef] [Green Version]
- Sadoudi, M.; Tourdot-Maréchal, R.; Rousseaux, S.; Steyer, D.; Gallardo-Chacón, J.-J.; Ballester, J.; Vichi, S.; Guérin-Schneider, R.; Caixach, J.; Alexandre, H. Yeast–Yeast Interactions Revealed by Aromatic Profile Analysis of Sauvignon Blanc Wine Fermented by Single or Co-Culture of Non-Saccharomyces and Saccharomyces Yeasts. Food Microbiol. 2012, 32, 243–253. [Google Scholar] [CrossRef]
- Vicente, J.; Navascués, E.; Calderón, F.; Santos, A.; Marquina, D.; Benito, S. An Integrative View of the Role of Lachancea Thermotolerans in Wine Technology. Foods 2021, 10, 2878. [Google Scholar] [CrossRef]
- Hranilovic, A.; Gambetta, J.M.; Schmidtke, L.; Boss, P.K.; Grbin, P.R.; Masneuf-Pomarede, I.; Bely, M.; Albertin, W.; Jiranek, V. Oenological Traits of Lachancea Thermotolerans Show Signs of Domestication and Allopatric Differentiation. Sci. Rep. 2018, 8, 14812. [Google Scholar] [CrossRef] [PubMed]
- Benito, Á.; Calderón, F.; Palomero, F.; Benito, S. Quality and Composition of Airen Wines Fermented by Sequential Inoculation of Lachancea Thermotolerans and Saccharomyces Cerevisiae. Food Technol. Biotechnol. 2016, 54, 135–144. [Google Scholar] [CrossRef] [PubMed]
- Porter, T.J.; Divol, B.; Setati, M.E. Investigating the Biochemical and Fermentation Attributes of Lachancea Species and Strains: Deciphering the Potential Contribution to Wine Chemical Composition. Int. J. Food Microbiol. 2019, 290, 273–287. [Google Scholar] [CrossRef]
- Escribano, R.; González-Arenzana, L.; Garijo, P.; Berlanas, C.; López-Alfaro, I.; López, R.; Gutiérrez, A.R.; Santamaría, P. Screening of Enzymatic Activities within Different Enological Non-Saccharomyces Yeasts. J. Food Sci. Technol. 2017, 54, 1555–1564. [Google Scholar] [CrossRef] [Green Version]
- Gobbi, M.; Comitini, F.; Domizio, P.; Romani, C.; Lencioni, L.; Mannazzu, I.; Ciani, M. Lachancea Thermotolerans and Saccharomyces Cerevisiae in Simultaneous and Sequential Co-Fermentation: A Strategy to Enhance Acidity and Improve the Overall Quality of Wine. Food Microbiol. 2013, 33, 271–281. [Google Scholar] [CrossRef] [PubMed]
- Shekhawat, K.; Porter, T.J.; Bauer, F.F.; Setati, M.E. Employing Oxygen Pulses to Modulate Lachancea Thermotolerans–Saccharomyces Cerevisiae Chardonnay Fermentations. Ann. Microbiol. 2018, 68, 93–102. [Google Scholar] [CrossRef]
- Petitgonnet, C.; Klein, G.L.; Roullier-Gall, C.; Schmitt-Kopplin, P.; Quintanilla-Casas, B.; Vichi, S.; Julien-David, D.; Alexandre, H. Influence of Cell-Cell Contact between L. Thermotolerans and S. Cerevisiae on Yeast Interactions and the Exo-Metabolome. Food Microbiol. 2019, 83, 122–133. [Google Scholar] [CrossRef]
- Bordet, F.; Joran, A.; Klein, G.; Roullier-Gall, C.; Alexandre, H. Yeast–Yeast Interactions: Mechanisms, Methodologies and Impact on Composition. Microorganisms 2020, 8, 600. [Google Scholar] [CrossRef] [Green Version]
- Shekhawat, K.; Bauer, F.F.; Setati, M.E. Impact of Oxygenation on the Performance of Three Non-Saccharomyces Yeasts in Co-Fermentation with Saccharomyces Cerevisiae. Appl. Microbiol. Biotechnol. 2017, 101, 2479–2491. [Google Scholar] [CrossRef]
- Kemsawasd, V.; Viana, T.; Ardö, Y.; Arneborg, N. Influence of Nitrogen Sources on Growth and Fermentation Performance of Different Wine Yeast Species during Alcoholic Fermentation. Appl. Microbiol. Biotechnol. 2015, 99, 10191–10207. [Google Scholar] [CrossRef]
- Gobert, A.; Tourdot-Maréchal, R.; Sparrow, C.; Morge, C.; Alexandre, H. Influence of Nitrogen Status in Wine Alcoholic Fermentation. Food Microbiol. 2019, 83, 71–85. [Google Scholar] [CrossRef] [PubMed]
- Morales, M.L.; Fierro-Risco, J.; Ríos-Reina, R.; Ubeda, C.; Paneque, P. Influence of Saccharomyces Cerevisiae and Lachancea Thermotolerans Co-Inoculation on Volatile Profile in Fermentations of a Must with a High Sugar Content. Food Chem. 2019, 276, 427–435. [Google Scholar] [CrossRef] [PubMed]
- Bely, M.; Sablayrolles, J.-M.; Barre, P. Automatic Detection of Assimilable Nitrogen Deficiencies during Alcoholic Fermentation in Oenological Conditions. J. Ferment. Bioeng. 1990, 70, 246–252. [Google Scholar] [CrossRef]
- Bagheri, B.; Zambelli, P.; Vigentini, I.; Bauer, F.F.; Setati, M.E. Investigating the Effect of Selected Non-Saccharomyces Species on Wine Ecosystem Function and Major Volatiles. Front. Bioeng. Biotechnol. 2018, 6, 169. [Google Scholar] [CrossRef] [PubMed]
- Mencher, A.; Morales, P.; Curiel, J.A.; Gonzalez, R.; Tronchoni, J. Metschnikowia Pulcherrima Represses Aerobic Respiration in Saccharomyces Cerevisiae Suggesting a Direct Response to Co-Cultivation. Food Microbiol. 2021, 94, 103670. [Google Scholar] [CrossRef] [PubMed]
- Rollero, S.; Bloem, A.; Camarasa, C.; Sanchez, I.; Ortiz-Julien, A.; Sablayrolles, J.-M.; Dequin, S.; Mouret, J.-R. Combined Effects of Nutrients and Temperature on the Production of Fermentative Aromas by Saccharomyces Cerevisiae during Wine Fermentation. Appl. Microbiol. Biotechnol. 2015, 99, 2291–2304. [Google Scholar] [CrossRef] [PubMed]
- Maturano, Y.P.; Mestre, M.V.; Kuchen, B.; Toro, M.E.; Mercado, L.A.; Vazquez, F.; Combina, M. Optimization of Fermentation-Relevant Factors: A Strategy to Reduce Ethanol in Red Wine by Sequential Culture of Native Yeasts. Int. J. Food Microbiol. 2019, 289, 40–48. [Google Scholar] [CrossRef] [PubMed]
- Barbosa, C.; Ramalhosa, E.; Vasconcelos, I.; Reis, M.; Mendes-Ferreira, A. Machine Learning Techniques Disclose the Combined Effect of Fermentation Conditions on Yeast Mixed-Culture Dynamics and Wine Quality. Microorganisms 2022, 10, 107. [Google Scholar] [CrossRef]
- Zupan, J.; Avbelj, M.; Butinar, B.; Kosel, J.; Šergan, M.; Raspor, P. Monitoring of Quorum-Sensing Molecules during Minifermentation Studies in Wine Yeast. J. Agric. Food Chem. 2013, 61, 2496–2505. [Google Scholar] [CrossRef]
- Taillandier, P.; Lai, Q.P.; Julien-Ortiz, A.; Brandam, C. Interactions between Torulaspora Delbrueckii and Saccharomyces Cerevisiae in Wine Fermentation: Influence of Inoculation and Nitrogen Content. World J. Microbiol. Biotechnol. 2014, 30, 1959–1967. [Google Scholar] [CrossRef] [Green Version]
- Vendramini, C.; Beltran, G.; Nadai, C.; Giacomini, A.; Mas, A.; Corich, V. The Role of Nitrogen Uptake on the Competition Ability of Three Vineyard Saccharomyces Cerevisiae Strains. Int. J. Food Microbiol. 2017, 258, 1–11. [Google Scholar] [CrossRef] [PubMed] [Green Version]
- Alonso-del-Real, J.; Pérez-Torrado, R.; Querol, A.; Barrio, E. Dominance of Wine Saccharomyces Cerevisiae Strains over S. Kudriavzevii in Industrial Fermentation Competitions Is Related to an Acceleration of Nutrient Uptake and Utilization. Environ. Microbiol. 2019, 21, 1627–1644. [Google Scholar] [CrossRef] [PubMed] [Green Version]
- Pallmann, C.L.; Brown, J.A.; Olineka, T.L.; Cocolin, L.; Mills, D.A.; Bisson, L.F. Use of WL Medium to Profile Native Flora Fermentations. Am. J. Enol. Vitic. 2001, 52, 198–203. [Google Scholar]
- Roca-Mesa, H.; Sendra, S.; Mas, A.; Beltran, G.; Torija, M.-J. Nitrogen Preferences during Alcoholic Fermentation of Different Non-Saccharomyces Yeasts of Oenological Interest. Microorganisms 2020, 8, 157. [Google Scholar] [CrossRef] [PubMed] [Green Version]
- García-Ríos, E.; Gutiérrez, A.; Salvadó, Z.; Arroyo-López, F.N.; Guillamon, J.M. The Fitness Advantage of Commercial Wine Yeasts in Relation to the Nitrogen Concentration, Temperature, and Ethanol Content under Microvinification Conditions. App. Environ. Microbiol. 2014, 80, 704–713. [Google Scholar] [CrossRef] [Green Version]
- Schnierda, T.; Bauer, F.F.; Divol, B.; van Rensburg, E.; Görgens, J.F. Optimization of Carbon and Nitrogen Medium Components for Biomass Production Using Non-Saccharomyces Wine Yeasts. Lett. Appl. Microbiol. 2014, 58, 478–485. [Google Scholar] [CrossRef] [PubMed]
- Andorrà, I.; Landi, S.; Mas, A.; Esteve-Zarzoso, B.; Guillamón, J.M. Effect of Fermentation Temperature on Microbial Population Evolution Using Culture-Independent and Dependent Techniques. Food Res. Int. 2010, 43, 773–779. [Google Scholar] [CrossRef]
- Bagheri, B.; Bauer, F.F.; Cardinali, G.; Setati, M.E. Ecological Interactions Are a Primary Driver of Population Dynamics in Wine Yeast Microbiota during Fermentation. Sci. Rep. 2020, 10, 4911. [Google Scholar] [CrossRef] [Green Version]
- Salvadó, Z.; Arroyo-López, F.N.; Guillamón, J.M.; Salazar, G.; Querol, A.; Barrio, E. Temperature Adaptation Markedly Determines Evolution within the Genus Saccharomyces. Appl. Environ. Microbiol. 2011, 77, 2292–2302. [Google Scholar] [CrossRef] [Green Version]
- Salvadó, Z.; Arroyo-López, F.N.; Barrio, E.; Querol, A.; Guillamón, J.M. Quantifying the Individual Effects of Ethanol and Temperature on the Fitness Advantage of Saccharomyces Cerevisiae. Food Microbiol. 2011, 28, 1155–1161. [Google Scholar] [CrossRef]
- Goddard, M.R. Quantifying the Complexities of Saccharomyces cerevisiae’s Ecosystem Engineering via fermentation. Ecology 2008, 89, 2077–2082. [Google Scholar] [CrossRef] [PubMed] [Green Version]
- Ganucci, D.; Guerrini, S.; Mangani, S.; Vincenzini, M.; Granchi, L. Quantifying the Effects of Ethanol and Temperature on the Fitness Advantage of Predominant Saccharomyces Cerevisiae Strains Occurring in Spontaneous Wine Fermentations. Front. Microbiol. 2018, 9, 1563. [Google Scholar] [CrossRef] [PubMed] [Green Version]
- Pretorius, I.S. Tailoring Wine Yeast for the New Millennium: Novel Approaches to the Ancient Art of Winemaking. Yeast 2000, 16, 675–729. [Google Scholar] [CrossRef]
- García-Ríos, E.; Ramos-Alonso, L.; Guillamón, J.M. Correlation between Low Temperature Adaptation and Oxidative Stress in Saccharomyces Cerevisiae. Front. Microbiol. 2016, 7, 1199. [Google Scholar] [CrossRef] [PubMed] [Green Version]
- García, M.; Crespo, J.; Cabellos, J.M.; Arroyo, T. Growth of Non-Saccharomyces Native Strains under Different Fermentative Stress Conditions. Fermentation 2021, 7, 124. [Google Scholar] [CrossRef]
- Comitini, F.; Gobbi, M.; Domizio, P.; Romani, C.; Lencioni, L.; Mannazzu, I.; Ciani, M. Selected Non-Saccharomyces Wine Yeasts in Controlled Multistarter Fermentations with Saccharomyces Cerevisiae. Food Microbiol. 2011, 28, 873–882. [Google Scholar] [CrossRef]
- Varela, C.; Cuijvers, K.; Van Den Heuvel, S.; Rullo, M.; Solomon, M.; Borneman, A.; Schmidt, S. Effect of Aeration on Yeast Community Structure and Volatile Composition in Uninoculated Chardonnay Wines. Fermentation 2021, 7, 97. [Google Scholar] [CrossRef]
- Fairbairn, S.; Engelbrecht, L.; Setati, M.E.; du Toit, M.; Bauer, F.F.; Divol, B.; Rossouw, D. Combinatorial Analysis of Population Dynamics, Metabolite Levels and Malolactic Fermentation in Saccharomyces Cerevisiae/Lachancea Thermotolerans Mixed Fermentations. Food Microbiol. 2021, 96, 103712. [Google Scholar] [CrossRef]
- Sgouros, G.; Mallouchos, A.; Filippousi, M.-E.; Banilas, G.; Nisiotou, A. Molecular Characterization and Enological Potential of A High Lactic Acid-Producing Lachancea Thermotolerans Vineyard Strain. Foods 2020, 9, 595. [Google Scholar] [CrossRef]
- Sauer, M.; Porro, D.; Mattanovich, D.; Branduardi, P. 16 Years Research on Lactic Acid Production with Yeast–Ready for the Market? Biotechnol. Genet. Eng. Rev. 2010, 27, 229–256. [Google Scholar] [CrossRef]
- Gatto, V.; Binati, R.L.; Lemos Junior, W.J.F.; Basile, A.; Treu, L.; de Almeida, O.G.G.; Innocente, G.; Campanaro, S.; Torriani, S. New Insights into the Variability of Lactic Acid Production in Lachancea Thermotolerans at the Phenotypic and Genomic Level. Microbiol. Res. 2020, 238, 126525. [Google Scholar] [CrossRef] [PubMed]
- Hranilovic, A.; Albertin, W.; Capone, D.L.; Gallo, A.; Grbin, P.R.; Danner, L.; Bastian, S.E.P.; Masneuf-Pomarede, I.; Coulon, J.; Bely, M.; et al. Impact of Lachancea Thermotolerans on Chemical Composition and Sensory Profiles of Merlot Wines. Food Chem. 2021, 349, 129015. [Google Scholar] [CrossRef] [PubMed]
- Morata, A.; Loira, I.; Tesfaye, W.; Bañuelos, M.A.; González, C.; Suárez Lepe, J.A. Lachancea Thermotolerans Applications in Wine Technology. Fermentation 2018, 4, 53. [Google Scholar] [CrossRef] [Green Version]
- Shekhawat, K.; Bauer, F.F.; Setati, M.E. The Transcriptomic Response of a Wine Strain of Lachancea Thermotolerans to Oxygen Deprivation. FEMS Yeast Res. 2020, 20, foaa054. [Google Scholar] [CrossRef] [PubMed]
- Rollero, S.; Bloem, A.; Brand, J.; Ortiz-Julien, A.; Camarasa, C.; Divol, B. Nitrogen Metabolism in Three Non-Conventional Wine Yeast Species: A Tool to Modulate Wine Aroma Profiles. Food Microbiol. 2021, 94, 103650. [Google Scholar] [CrossRef]
- Torija, M.J.; Beltran, G.; Novo, M.; Poblet, M.; Guillamón, J.M.; Mas, A.; Rozès, N. Effects of Fermentation Temperature and Saccharomyces Species on the Cell Fatty Acid Composition and Presence of Volatile Compounds in Wine. Int. J. Food Microbiol. 2003, 85, 127–136. [Google Scholar] [CrossRef]
- Beltran, G.; Novo, M.; Guillamón, J.M.; Mas, A.; Rozès, N. Effect of Fermentation Temperature and Culture Media on the Yeast Lipid Composition and Wine Volatile Compounds. Int. J. Food Microbiol. 2008, 121, 169–177. [Google Scholar] [CrossRef]
- Balikci, E.K.; Tanguler, H.; Jolly, N.P.; Erten, H. Influence of Lachancea Thermotolerans on Cv. Emir Wine Fermentation: Lachancea Thermotolerans Affects Wine Fermentation. Yeast 2016, 33, 313–321. [Google Scholar] [CrossRef] [Green Version]
- González, B.; Vázquez, J.; Morcillo-Parra, M.Á.; Mas, A.; Torija, M.J.; Beltran, G. The Production of Aromatic Alcohols in Non-Saccharomyces Wine Yeast Is Modulated by Nutrient Availability. Food Microbiol. 2018, 74, 64–74. [Google Scholar] [CrossRef]
- Shekhawat, K.; Patterton, H.; Bauer, F.F.; Setati, M.E. RNA-Seq Based Transcriptional Analysis of Saccharomyces Cerevisiae and Lachancea Thermotolerans in Mixed-Culture Fermentations under Anaerobic Conditions. BMC Genom. 2019, 20, 145. [Google Scholar] [CrossRef] [Green Version]
- Gobert, A.; Tourdot-Maréchal, R.; Morge, C.; Sparrow, C.; Liu, Y.; Quintanilla-Casas, B.; Vichi, S.; Alexandre, H. Non-Saccharomyces Yeasts Nitrogen Source Preferences: Impact on Sequential Fermentation and Wine Volatile Compounds Profile. Front. Microbiol. 2017, 8, 2175. [Google Scholar] [CrossRef] [PubMed] [Green Version]
Publisher’s Note: MDPI stays neutral with regard to jurisdictional claims in published maps and institutional affiliations. |
© 2022 by the authors. Licensee MDPI, Basel, Switzerland. This article is an open access article distributed under the terms and conditions of the Creative Commons Attribution (CC BY) license (https://creativecommons.org/licenses/by/4.0/).