Article

Starmerella bacillaris Strains Used in Sequential Alcoholic Fermentation with Saccharomyces cerevisiae Improves Protein Stability in White Wines

by
Luiza de Paula Dias Moreira
1,
Chiara Nadai
2,3,*,
Vinícius da Silva Duarte
4,
Edward John Brearley-Smith
1,
Matteo Marangon
1,
Simone Vincenzi
1,3,
Alessio Giacomini
1,3 and
Viviana Corich
1,3
1
Department of Agronomy Food Natural Resources Animals and Environment (DAFNAE), University of Padova, Viale dell’Università 16, 35020 Legnaro, PD, Italy
2
Department of Land, Environment, Agriculture and Forestry (TESAF), University of Padova, Viale dell’Università 16, 35020 Legnaro, PD, Italy
3
Interdepartmental Centre for Research in Viticulture and Enology (CIRVE), University of Padova, Viale XXVIII Aprile 14, 31015 Conegliano, TV, Italy
4
Faculty of Chemistry, Biotechnology, and Food Science, The Norwegian University of Live Sciences, P.O. Box 5003, N-1432 Ås, Norway
*
Author to whom correspondence should be addressed.
Fermentation 2022, 8(6), 252; https://doi.org/10.3390/fermentation8060252
Submission received: 12 May 2022 / Revised: 23 May 2022 / Accepted: 25 May 2022 / Published: 27 May 2022
(This article belongs to the Section Microbial Metabolism, Physiology & Genetics)

Abstract

:
Haze can appear in white wines as a result of the denaturation and subsequent aggregation of grape pathogenesis-related (PR) proteins. Yeast cell-wall polysaccharides, particularly mannoproteins, represent a promising strategy to reduce the incidence of this phenomenon. The aim of this study was to evaluate the effects of 13 Starmerella bacillaris strains, in sequential fermentation with Saccharomyces cerevisiae, on wine protein stability of three white wines (Sauvignon blanc, Pinot grigio, and Manzoni bianco). The resulting wines were characterized in terms of their chemical composition, content of PR proteins and polysaccharides, and heat stability. In addition, the mannoprotein fraction was purified from six wines, five produced with S. bacillaris and one with S. cerevisiae EC1118 used as control. Generally, wines produced with S. bacillaris strains were more heat-stable, despite generally containing higher amounts of PR proteins. The increased heat stability of Starmerella wines was attributed to the stabilizing effect resulting from their higher concentrations of both total polysaccharides and mannoprotein fractions. In particular, for the most heat unstable wine (Manzoni bianco), the low MW mannoprotein fraction resulted to be the most involved in wine stability. The ability to produce wines with different heat stability was demonstrated to be strain-dependent and was more evident in the most unstable wines. By reducing fining waste, the use of S. bacillaris as an enological starter can be proposed as a new tool to manage wine protein stability for a more sustainable winemaking.

1. Introduction

Protein haze formation is the most common non-microbiological defect in white wines [1]. This is a multifactorial phenomenon mostly depending on the presence in finished wines of grape pathogenesis-related (PR) proteins such as thaumatin-like proteins (TLPs) and chitinases which accumulate during berry ripening and whose content depends on the grape variety, climatic conditions, soil type, vinification technique, and several others [2]. These proteins, despite being soluble in wine, present low conformational stability and, therefore, have a great tendency to denature irreversibly (chitinases and unstable TLP isoforms) or reversibly (stable TLP isoforms) [3,4]. After alcoholic fermentation (AF), and upon inadequate storage conditions, these proteins can undergo denaturation followed by self-aggregation and/or interaction with other non-proteinaceous wine compounds (e.g., polyphenols, salts, and sulfate), which lead to colloidal aggregation, flocculation, and formation of undesirable precipitates. Physicochemical factors such as protein concentration, temperature, pH, ethanol content, and ionic strength have been reported to influence wine haze formation [5,6,7,8,9].
Bentonite, a nonrenewable natural clay mined, is typically used to remove unstable proteins from white juices and wines. However, its use has been reported to negatively affect wine quality as, due to its lack of specificity toward wine proteins, it also removes compounds that contribute to wine sensory properties such as colored pigments and volatile compounds [8,10]. Therefore, several alternatives to the use of bentonite have been evaluated, including the use of other fining agents such as polysaccharides [11,12,13], grape seed powder [14,15], and protease enzymes in combination with heat treatment [16] and ultrafiltration [17].
An alternative approach for wine stabilization is based on the notion that yeast polysaccharides in general and mannoproteins in particular have been reported to prevent protein aggregation [18,19], thus improving wine stability. Mannoproteins are compounds from the outermost layer of the yeast cell wall and are released into the wine during AF and wine aging processes [20,21]. Their addition to the wine is allowed by OIV International Oenological Codex (OIV Codex) and the European Union Council Regulation (EC) (No. 2165/2005), as well as by regulatory agencies of several countries such as Argentina, Australia, Canada, EU, New Zealand, and the USA [22]. Mannoproteins are mostly composed of carbohydrates (80–95%), contain over 50% of mannose, and include a small portion of glycosylated proteins (1–10%) [23].
Some studies have shown that the use of non-Saccharomyces yeast species as a pure culture in complete growth medium or as co-starter strains with Saccharomyces cerevisiae in mixed or sequential AF is a good strategy to increase the amount of polysaccharides released by yeast cell walls into the medium [24,25,26,27]. Besides, the combined use of yeasts can be an important strategy to improve wine quality, for example, by increasing the wines’ glycerol content, by modifying the wines’ flavor profiles and overall complexity, and by reducing wines’ ethanol levels [28].
In this context, Starmerella bacillaris (synonym: Candida zemplinina) has shown great capability to release polysaccharides and mannoproteins during AF, as well as increased levels of glycerol [29]. Purified mannoprotein-enriched extracts, obtained from sequential fermentations conducted in synthetic must, affected wine turbidity differently. However, the role of S. bacillaris in sequential fermentation on the protein stability in white wine remains unclear. Therefore, this study aimed to evaluate the effect of the presence of 13 S. bacillaris strains in sequential AF on protein stability with respect to EC1118 single fermentation in Sauvignon blanc, Pinot grigio, and Manzoni bianco white wines. Polysaccharide and mannoprotein fractions released during fermentation were also quantified.

2. Materials and Methods

2.1. Yeast Strains

The yeast strains of Starmerella bacillaris used in this work, namely, FRI719, FRI728, FRI729, FRI751, FRI754, FRI7100, PAS13, PAS 55, PAS66, PAS92, PAS103, PAS151, and PAS173 [30,31,32], were isolated from fermenting must obtained from dried grapes, as described by Lemos Junior [30]. Saccharomyces cerevisiae EC1118 (Lallemand Inc., Montreal, QC, Canada) was used as a control.

2.2. Fermentation Trials

Precultures of each strain were prepared as described by Bovo [33]. Fermentations were performed as described by Nadai [34]. Briefly, a suitable aliquot of each yeast culture, corresponding to a final concentration of 106 cells/mL, was used to inoculate 120 mL capacity bottles, fitted with closures that enabled the carbon dioxide to escape, containing 100 mL of grape must. Sauvignon blanc, Pinot grigio, and Manzoni bianco juices were obtained from grapes harvested in Northern Italy vineyards (Treviso, Veneto region) during vintage 2020 (Table S1). Before fermentation, the pH of the three juices was adjusted to 3.20 with HCl, and yeast assimilable nitrogen (YAN) was adjusted to 140 mg/L with diammonium phosphate (DAP) addition.
The inoculum concentration of each yeast was 2 × 10⁶ cells/mL. In sequential fermentations, S. cerevisiae EC1118 was added 48 h after the inoculum of S. bacillaris. A single strain fermentation with S. cerevisiae EC1118 (Lallemand Inc., Montreal, QC, Canada) was used as a control. After yeast inoculation, the bottles were incubated at 20 °C. All experiments were performed in triplicate. Production of CO2 was monitored by weighting the bottles twice a day and calculating the weight loss for each culture. Each fermentation was stopped when the weight loss was lower than 0.1 g during 24 h.
The obtained wines were centrifuged (4500× g, 15 min), and 10 mL was collected to perform the heat stability test. The rest of the supernatant was frozen and kept at −20 °C for further analyses.

2.3. Chemical Analysis

The concentrations of glucose, fructose, succinic acid, acetic acid, glycerol, and ethanol were determined by HPLC as described by Lemos Junior [35]. Ten microliters of filtered sample was analyzed using a Waters 1525 HPLC binary pump (Waters, Milford, MA, USA) equipped with a 300 × 7.8 mm Aminex HPX_87H HPLC column (Bio-Rad, Hercules, CA, USA). A Waters 2414 Refractive Index Detector (Waters, Milford, MA, USA) was used for the determination of glucose, fructose, glycerol, and ethanol, while acetic and succinic acids were determined using a Waters 2487 Dual Absorbance Detector (Waters, Milford, MA, USA) set to 210 nm. The analyses were performed isocratically at 0.6 mL/min and 65 °C using 0.01 N H2SO4 as the mobile phase. The concentrations, expressed as g/L, were calculated by using calibration curves of the individual compounds, and peak areas were determined by the Waters Breeze 2 software (Waters, Milford, MA, USA), an internal software that acquired and processed the data.

2.4. Protein Stability of White Wines

The protein stability was evaluated by measuring the turbidity of the produced wines after heating at 80 °C for 6 h, with subsequent cooling at 4 °C for 12 h [36]. The differences in nephelometric turbidity units (NTUs) between the heated and unheated samples were measured by a HI83749 Nephelometer (Hanna Instruments, Ronchi di Campanile, Italy). Samples were considered protein unstable when the difference in NTUs between heated and unheated samples were >2 NTU.

2.5. Quantification of Grape Proteins

The concentration of pathogenesis-related (PR) proteins such as thaumatin-like proteins (TLP) and chitinases was determined in the supernatant by reverse-phase high-pressure liquid chromatography (RP-HPLC) using a column 300SB-C8, 5 μm, 4.6 × 250 mm (Agilent) fitted on an Agilent 1260 system according to the method reported by Van Sluyter [37]. Briefly, 1 mL of each sample was membrane-filtered (0.45 μm), diluted (1:1) in a specific buffer (20% acetonitrile and 0.2% trifluoroacetic acid), and kept at −20 °C for 30 min. Samples were then centrifuged (14,000 rpm, 4 °C, 15 min), and 100 μL of the supernatant were injected. Protein identity was assigned by comparing the retention time of the unknown proteins with those of purified PR proteins used as standards. The calibration curve was generated using commercial thaumatin (Thaumatin from Thaumatococcus daniellii—Sigma-Aldrich, Life Science, St. Louis, MO, USA), in serial dilutions from 500 mg/L to 0 mg/L. The absorbance at 210 nm was recorded using a diode array detector (DAD). The comparison was done by the retention times of purified grape PR proteins as follows: peaks with a retention time between 7.2 min and 12 min were assigned to the TLP class, whereas peaks eluted from 18 and 25 min were classified as chitinases [37].

2.6. Quantification of Total Polysaccharides by HRSEC-RID

The polysaccharide concentration and molecular distribution were measured by HRSEC as previously described [38,39]. Briefly, 1 mL of wine was membrane-filtered (0.45 µm), freeze-dried, dissolved with 200 μL of Milli-Q water, added to 1 mL of cold acidified ethanol (0.3 mol/L HCl in absolute ethanol), and kept for 24 h at 4 °C. The samples were centrifuged (14,000× g, 15 min), and the supernatant was discarded. The pellet was washed with 1 mL of absolute ethanol and freeze-dried. The samples were resuspended with 1 mL of ammonium formate 50 mM (Merk, Darmstadt, Germany), vortexed, centrifuged (14,000× g, 2 min), and the supernatant transferred into HPLC vials. Then, 10 μL were injected into the chromatographic system. The analyses were carried out in an Agilent 1260 series II quaternary pump LC (Agilent Technologies) equipped with both DAD and RID detectors. Samples were held at 4 °C prior to injection in a temperature controlled auto-sampler. The separation was carried out at 20 °C using a gel permeation HPLC column (PL-Aquagel-OH 40, Agilent). The mobile phase was applied at a constant flow of 0.6 mL/min for 35 min, and the temperature of the RID cell was kept at 35 °C. The molecular weight distribution of the extracts’ polysaccharides was identified using a qualitative calibration curve made with 10 pullulan standards (Merk, Darmstadt, Germany) at MW ranging between 342 and 805,000 Da, while pectin and dextran were used in the range between 0 and 2 g/L to create the calibration curve for polysaccharide quantification. The high MW fraction varied between 1100 kDa and 180 kDa with retention time 11.243 min–13.393 min; the medium MW fraction varied between 180 kDa (13.393 min) and 40 kDa (15.179 min); the low MW fraction varied between 40 kDa (15.179 min) and 7.5 kDa (17.167 min). The total polysaccharide content was considered as the sum of these peak areas (high, medium, and low MW fractions) and expressed as mg/L.

2.7. Mannoprotein Quantification

Mannoprotein quantification was performed in six of the 14 fermentation trials, namely, EC1118 control, FRI751, FRI7100, PAS13, PAS55, and PAS103. One milliliter of filtered wine (0.45 μm) was diluted with 9 mL of buffer ConA (0.02 M Tris, 1M NaCl, 1 mM MnCl2, 1 mM MgCl2, 1 mM CaCl2, pH 7.4) and passed through a 0.5 mL column packed with Concanavalin Sepharose 4B resin (Sigma, C9017). The column was washed with 5 mL of ConA buffer, and mannoproteins were eluted with 2 mL of 0.2 M methyl α-D-mannopyranoside in ConA buffer. Eluted mannoproteins were precipitated with 80% cold ethanol and washed twice with 1 mL of absolute ethanol. The pellet was dissolved with 1 mL of ammonium formate 20 mM and submitted to HRSEC-RID polysaccharide analysis as described above.

2.8. Statistical Analysis

The statistical analyses were performed using XLSTAT software, version 2016.02 (Addinsoft, Paris, France). The data were subjected to one-way analysis of variance (ANOVA) followed by the Tukey’s post hoc test. The normal distribution of the data was tested by means of the Shapiro–Wilk test. The analyses were carried out comparing the averages of three independent replicates, and differences were considered statistically significant for a p-value lower than 0.05. Principal component analysis (PCA) and Pearson correlation were performed with the following parameters: turbidity, TLP, chitinase, polysaccharide high-, medium-, and low-molecular-weight fractions, and mannoprotein medium- and low-molecular-weight fractions.

3. Results and Discussion

3.1. Sequential Fermentation Performance in Three Grape Juices

In this study, 13 Starmerella bacillaris strains were used in sequential alcoholic fermentation (AF) with Saccharomyces cerevisiae (EC1118) to ferment juices of Sauvignon blanc (SB), Pinot grigio (PG), and Manzoni bianco (MB). The three juices had a similar sugar concentration (on average 224.65 g/L). The natural yeast population of the three juices was 1.2 × 10⁴ ± 1.5 × 10³ CFU/mL for SB, 9.0 × 10⁴ ± 3.2 × 10³ CFU/mL for PG, and 5.2 × 10⁴ ± 6.6 × 10³ CFU/mL for MB, all values well below the S. bacillaris inoculum size (2 × 10⁶ cells/mL). Forty-eight hours after the inoculation of S. bacillaris, S. cerevisiae was inoculated (2 × 10⁶ cells/mL). Single strain fermentation with S. cerevisiae was performed as a control. Before the inoculation of S. cerevisiae in sequential fermentations, yeast population was evaluated. In all sequential fermentations, yeast concentrations after 48 h were greater than 107 CFU/mL (Supplementary Table S2). Considering the natural yeast population and the initial S. bacillaris inoculum, these data indicate that the increase in yeast population was mainly due to S. bacillaris. For each juice, single fermentations with S. cerevisiae completed sugar consumption earlier than sequential fermentations. The advantage was 3 days for SB (14 days vs. 17 days for sequential inoculation), 3 days for PG (12 days vs. 15 days for sequential fermentation), and 4 days for MB (10 days vs. 14 days for sequential fermentation). These results confirm previous observations in which the presence of S. bacillaris in sequential AF resulted in decreasing S. cerevisiae activity and, therefore, the overall fermentation rate [40,41].
Glucose and fructose concentrations measured at 48 h, before the addition of S. cerevisiae in sequential fermentations (Table 1, Table 2 and Table 3), showed a decrease in fructose concentration in all musts inoculated with S. bacillaris, whereas glucose concentration was almost unchanged. This result confirms the fructophilic behavior of this species [29,42]. Significant differences were observed among S. bacillaris strains, probably related to differences in yeasts growth. As expected, S. cerevisiae consumed both sugars, with a preference for glucose.
At the end of the fermentation, no residual sugars were detected among the samples, indicating that sugar content was completely consumed by the yeasts, with the exception of PAS92, PAS103, and PAS151 wines (22.95, 29.51, and 9.84 g/L, respectively) in PG and PAS66 and PAS92 wines (9.67 and 10.25 g/L, respectively) in MB.
The glycerol content depends on the sugar concentration in the grape must, as well as on fermentation conditions such as temperature, yeast strains, sequential or mixed fermentation, and SO2 content [28]. Moreover, high glycerol production contributes to palate fullness (“body”) of wine [43]. Our results confirmed a significant increase in glycerol concentration in sequential AF compared to the control group for all grape varieties, except for PAS103 wine in PG (probably due to uncompleted sugar consumption). This increase ranged from 42.9% (PAS55, 7.39 g/L) to 76.4% (FRI7100, 9.12 g/L) in SB, from 10.8% (PAS92, 5.94 g/L) to 49.2% (FRI7100, 8.00 g/L) in PG, and from 28.1% (PAS92, 6.42 g/L) to 65.9% (FRI7100, 8.31 g/L) in MB wines. Overall, the best performance was observed for S. bacillaris FRI7100, indicating that variations in glycerol content are strain-specific. As described elsewhere, S. bacillaris can produce a higher amount of glycerol in mixed/sequential fermentation when compared to EC1118 control; however, sequential fermentations showed a higher level compared to mixed fermentation [29,44,45,46,47,48].
Studies have also demonstrated that the high glycerol production by S. bacillaris can lead to a reduced wine ethanol concentration in grape juices with high sugar content [29,49]. In our study, a general ethanol reduction was not observed, probably due to the limited grape sugar content. The only significant differences, with respect to EC1118, were related to the presence of sugar residues.
Rantsiou et al. [50] verified that the use of S. bacillaris in sequential fermentation with S. cerevisiae can decrease acetic acid production. However, in our study, in general, there were no statistically significant differences regarding the acetic acid concentration between the sequential fermentations and the control EC1118, except for PAS13 (1.17 g/L), FRI7100 (1.10 g/L), and PAS173 wines (1.07 g/L) in SB, where the content was higher than the EC1118 control fermentation (0.43 g/L). These results confirmed that the juice composition together with the presence of specific S. bacillaris strains influenced the production of acetic acid in wines. However, the presence of S. bacillaris did not influence acetic acid perception preserving wine quality, as, in most of the cases, the detected values were lower than the acetic acid flavor recognition threshold, 0.7–1.1 g/L [51].
Succinic acid production occurs mainly during the exponential growth phase and less during the stationary phase. This compound can react with other molecules and form esters which can affect the wine taste (e.g., bitter–salty taste). In addition, its production can be influenced by the yeast strain, grape must composition, and fermentation parameters such as temperature, aerobic conditions, and nitrogen [52]. In our study, there was no statistical difference regarding the succinic acid content between sequential fermentations and EC1118 in SB and MB wines. In PG, the succinic acid concentration of PAS173 (1.95 g/L), PAS66 (1.91 g/L), PAS151 (1.88 g/L), FRI7100 (1.83 g/L), and PAS55 wines (1.79 g/L) was slightly higher than the control EC1118 wine (1.45 g/L).

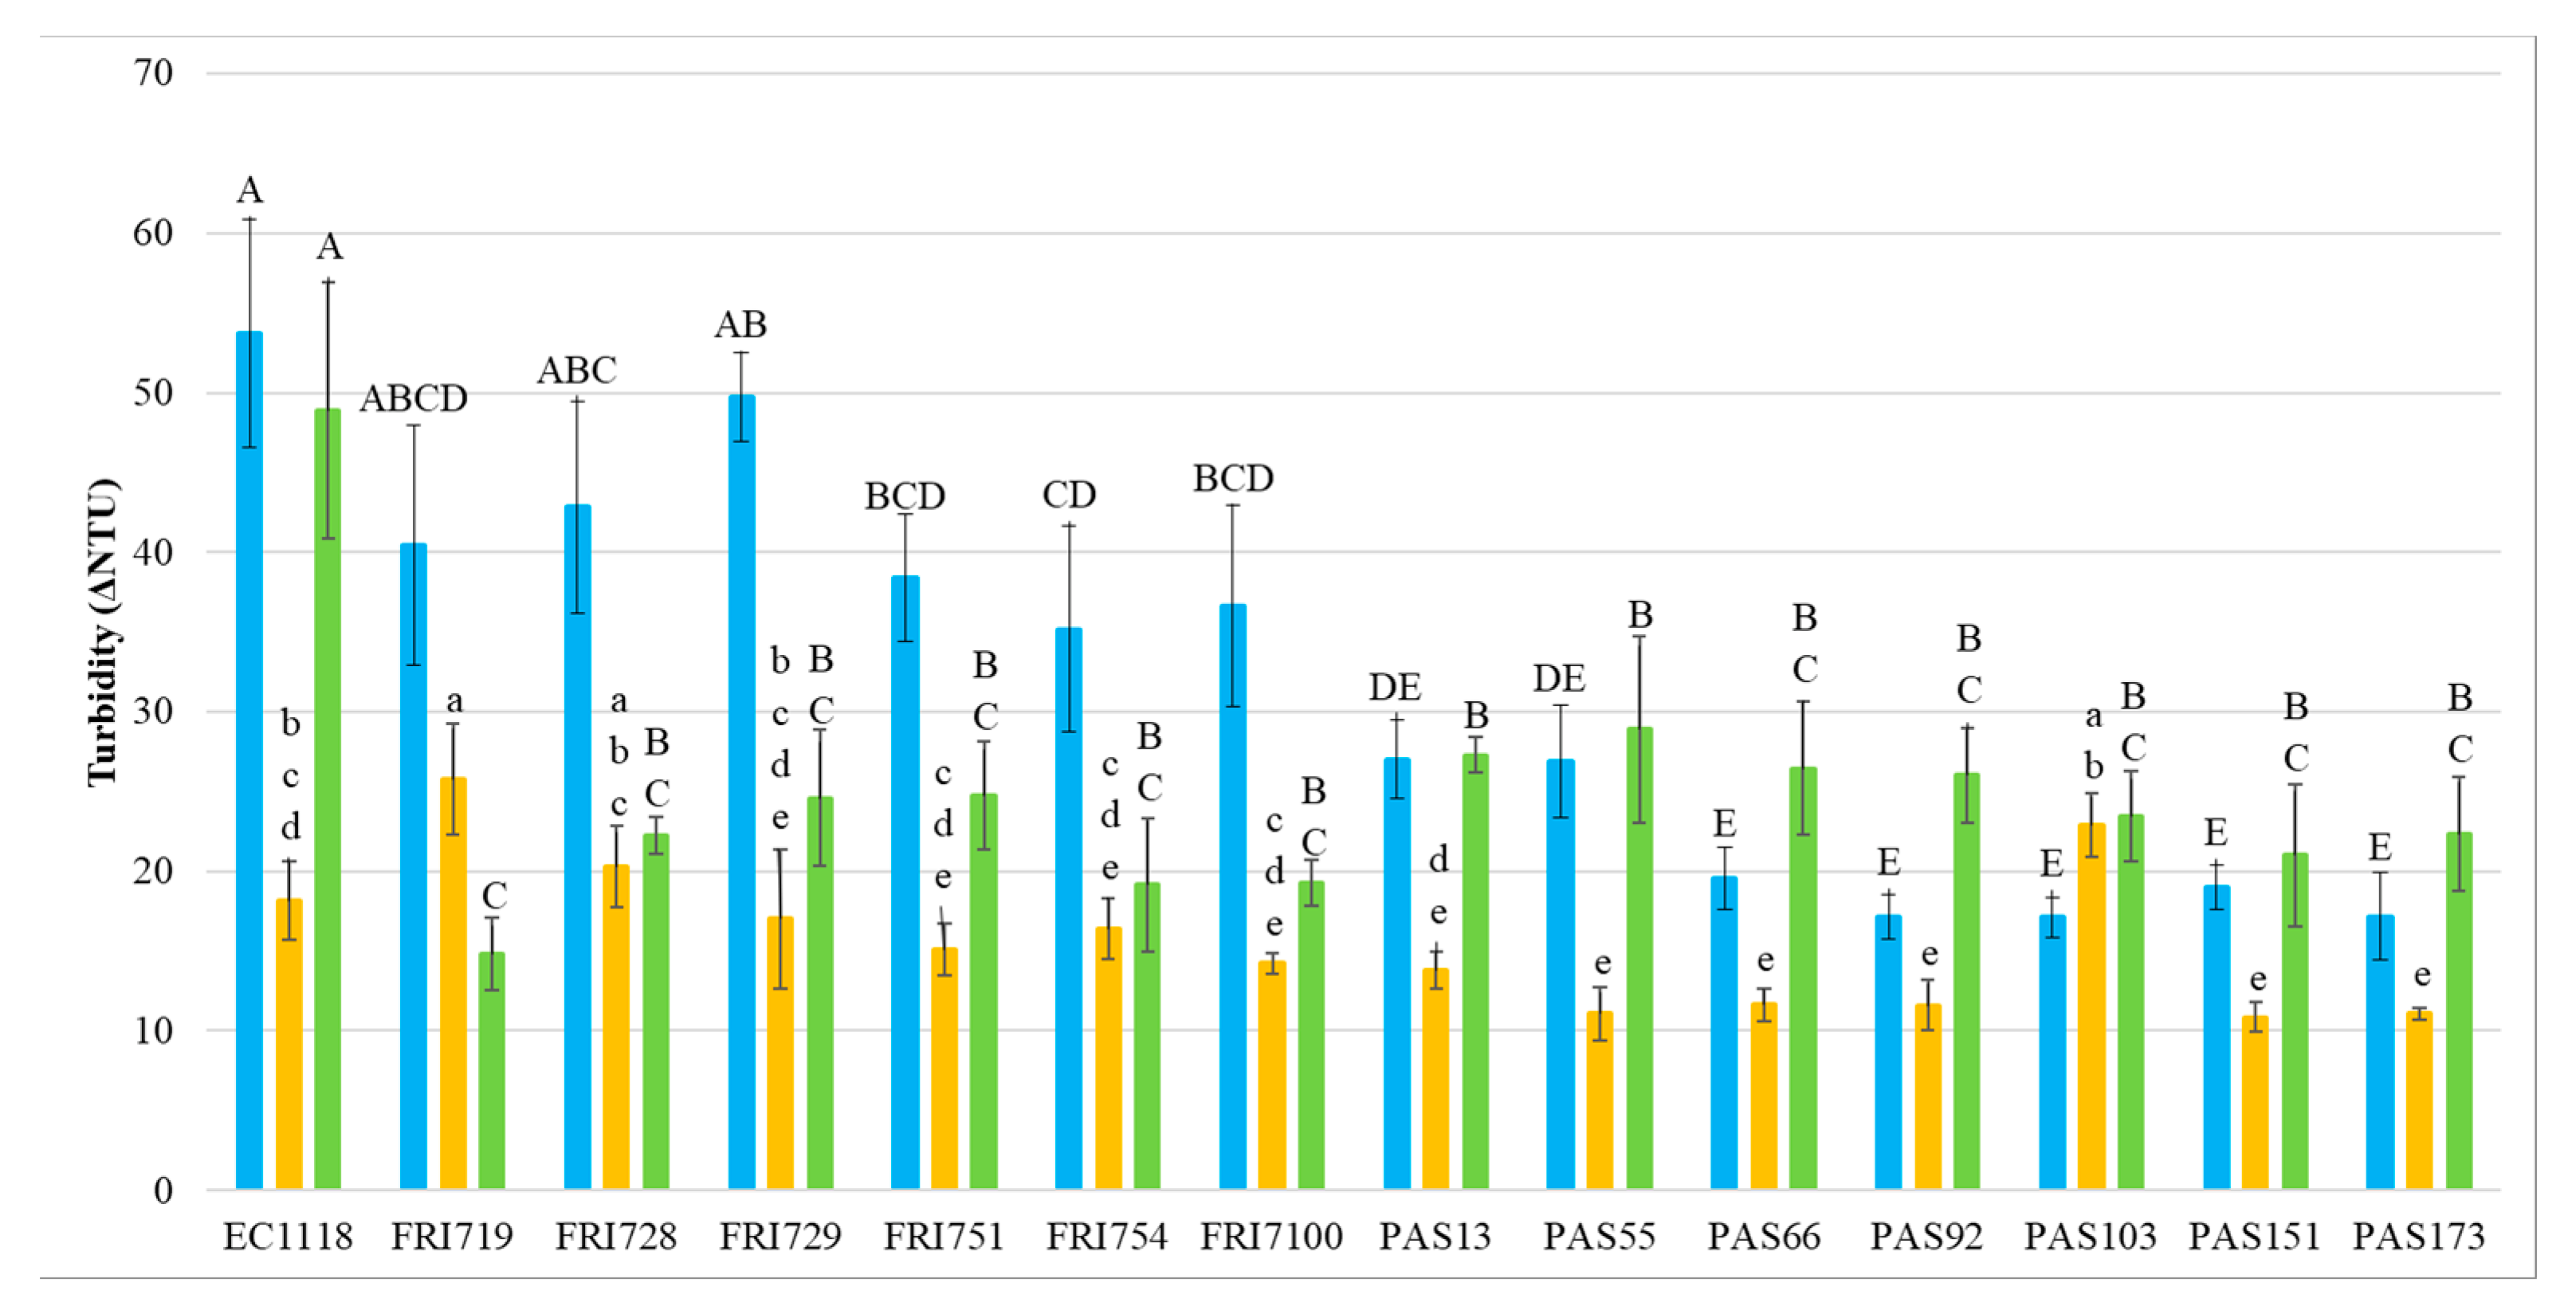
3.2. Wine Protein Stability

At the end of the fermentation, the wines’ protein stability was measured by heat test (Figure 1).
In general, results indicate that the presence of S. bacillaris in sequential fermentation with S. cerevisiae EC1118 significantly increased the wine protein stability, with the largest effect in MB wines where all S. bacillaris wines showed significantly lower ΔNTU values than EC1118 control wine, with reductions ranging from 40.9% (PAS55) to 69.7% (FRI719). In SB wines, 10 S. bacillaris strains statistically reduced ΔNTU values respect to the control EC1118, and the highest reduction level was reached by the strain PAS103 (68.1%).
The heat stability of PG wines was generally less impacted by the presence of S. bacillaris, with only four strains (PAS151, PAS55, PAS173, PAS92, and PAS66) significantly reducing ΔNTU values (from 36% to 40%) compared to control EC1118. Focusing on the heat stability test on EC1118 wines, PG wines showed a clearly lower ΔNTU values than SB and MB. This result confirmed that PG wines, due to the specific grape composition, can be considered less unstable than MB and SB, which have been generally reported to be more heat unstable due to their higher protein content [53,54].

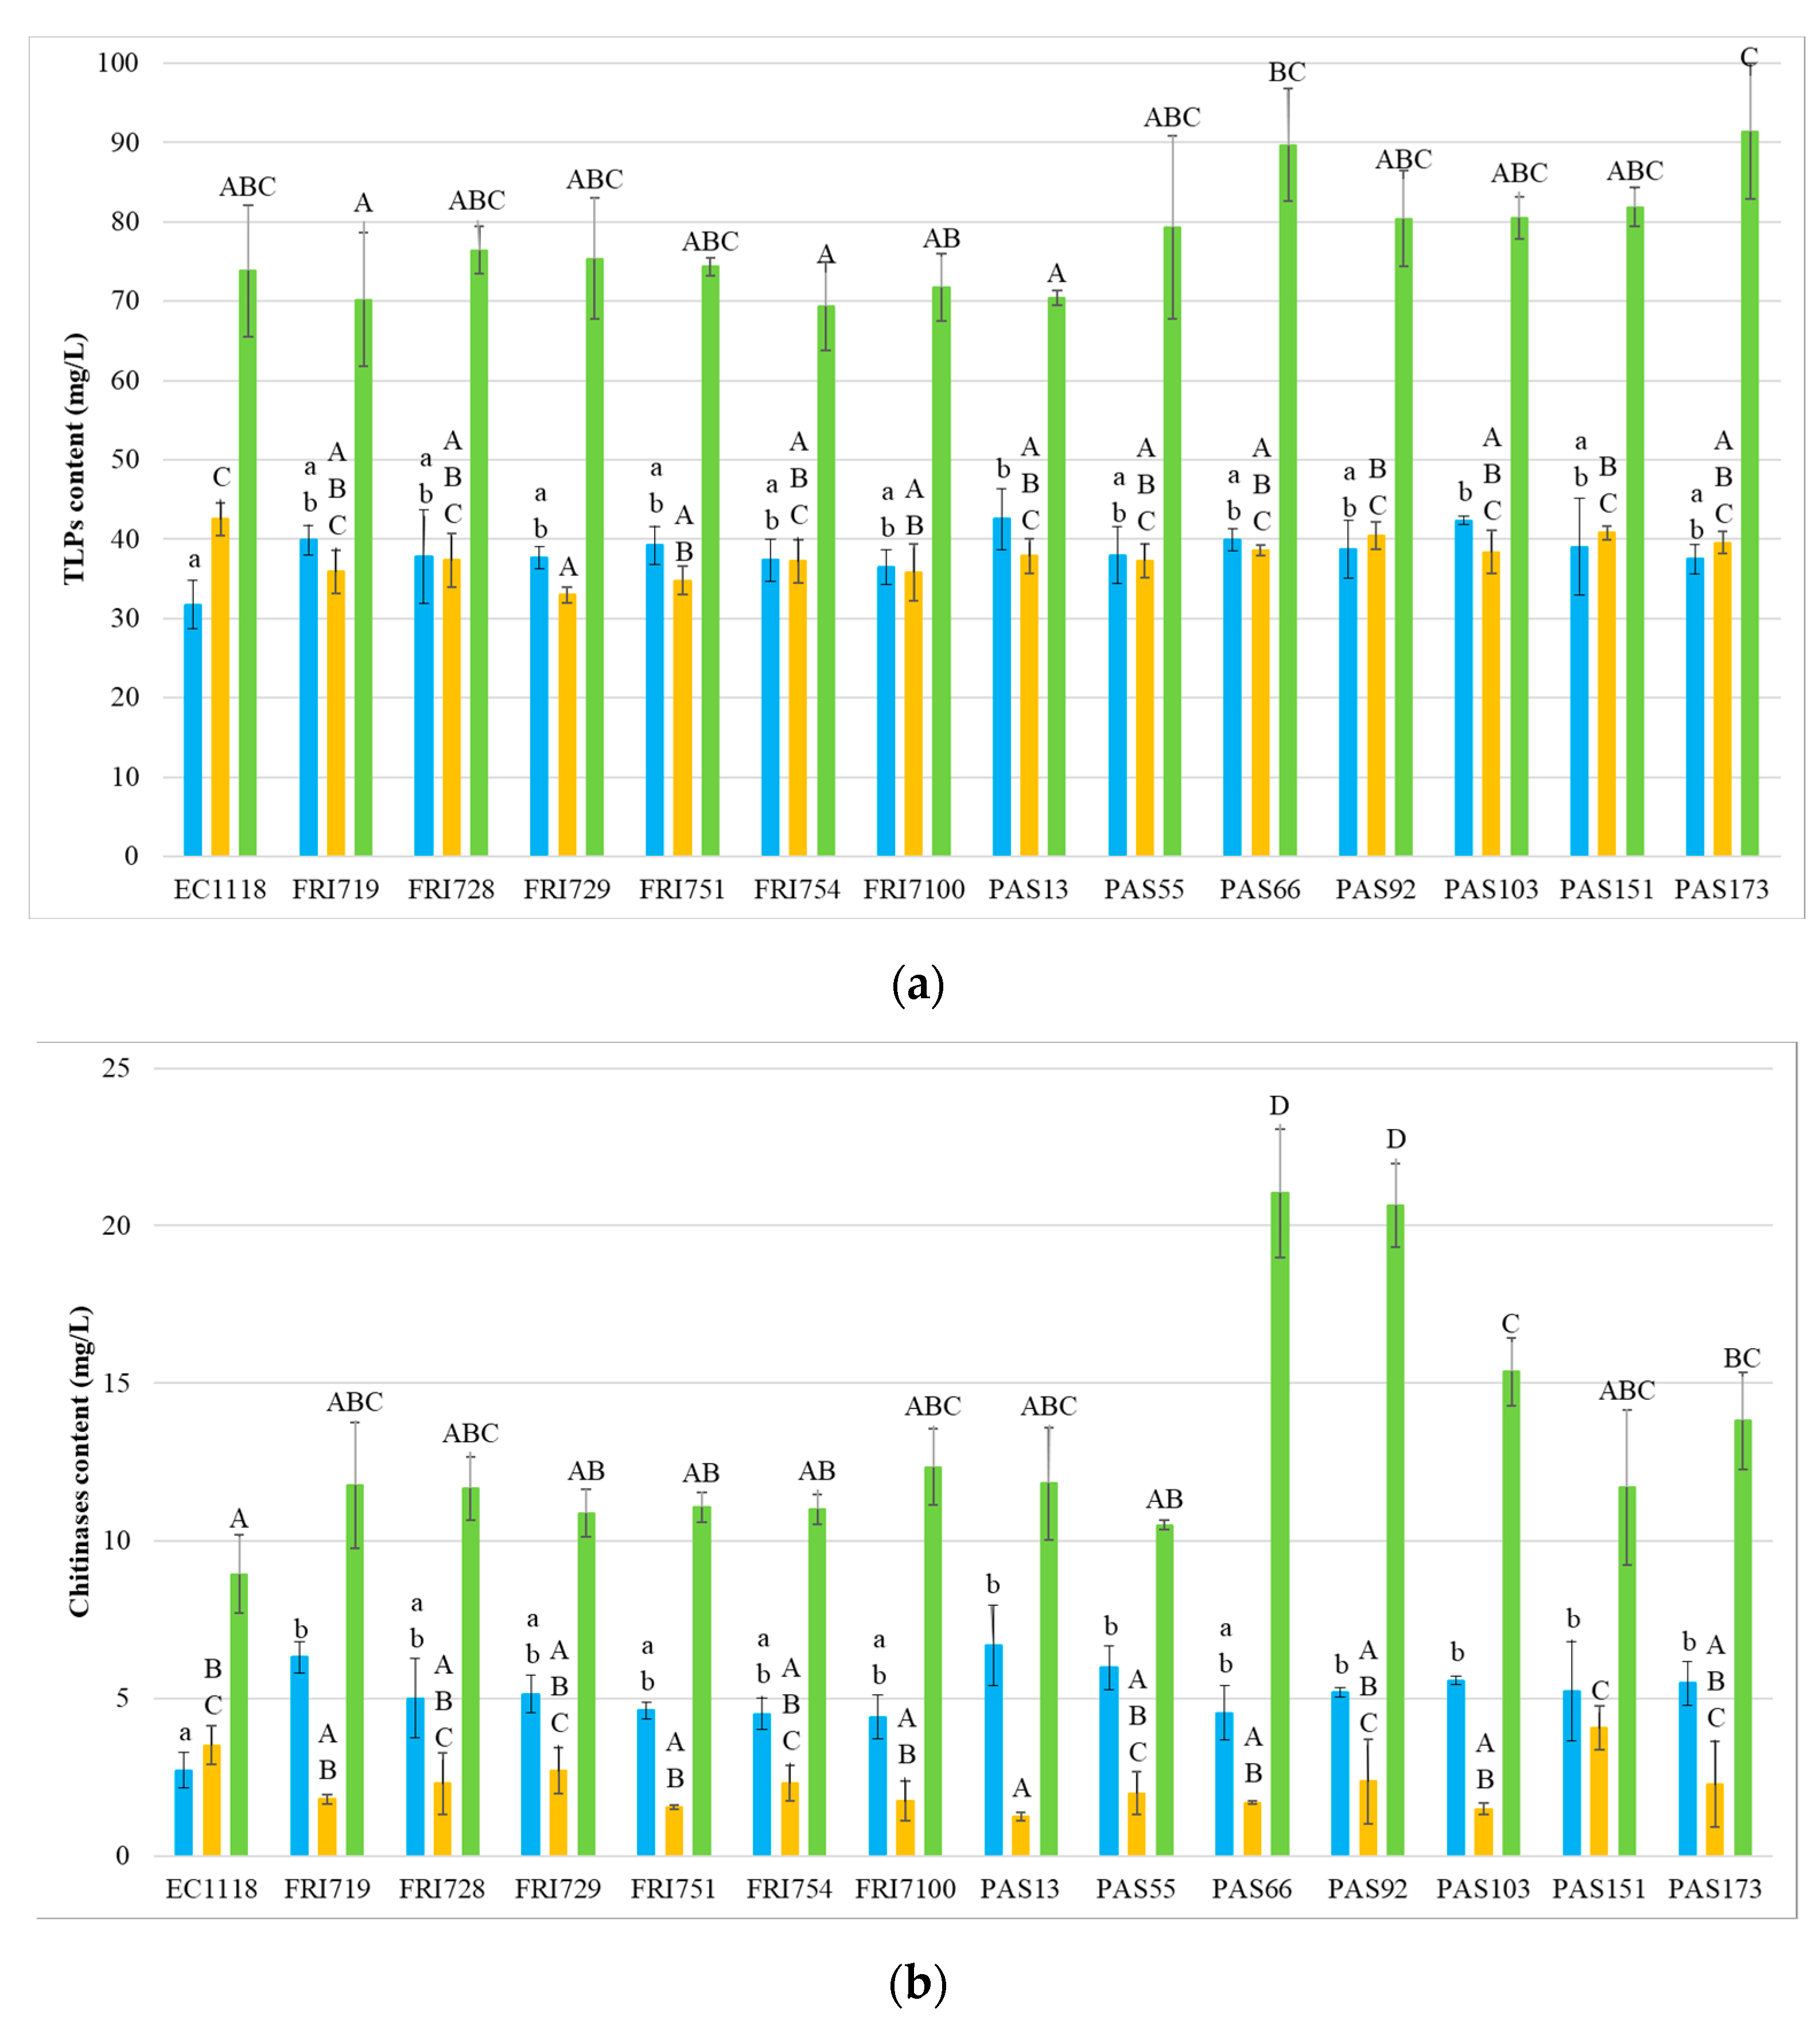
3.3. Wine Protein Profiles

Given that protein instability in white wines is due to the presence of grape pathogenesis-related (PR) proteins, particularly thaumatin-like proteins (TLP) and chitinases [6,55], these classes of proteins were quantified in all the wines (Figure 2).
Results indicate a prevalence of TLPs for all wines, with chitinases being always found at low level, especially for SB and PG. Generally, the yeast strains used in AF did not result in significant differences for the TLPs content of wines. In PG, only FRI729, FRI751, and FRI7100 wines showed significantly lower TLP content than EC1118. In SB, the wines were PAS13 and PAS103, whereas, in MB, no significant differences were detected.
With regard to chitinases, in PG, most of the wines obtained with S. bacillaris showed no significant differences compared to the control, while PAS13 wine showed a significantly lower level. In SB, generally, the concentration of chitinases was higher in presence of S. bacillaris (strains FRI719, PAS13, PAS55, PAS92, PAS103, PAS151, and PAS173 showed significant differences). In MB, four sequential fermentations related to strains PAS66, PAS92, PAS103, and PAS173 evidenced higher chitinase level than the control.
Therefore, it can be concluded that S. bacillaris generally slightly influenced TLP content, while, in the unstable Starmerella wines SB and MB, chitinase concentrations showed a higher level. Previous observations indicated chitinases as being the most heat-unstable proteins as they possess a lower melting temperature that renders them more susceptible to precipitation than TLPs during winemaking [3,6,56]. Other studies suggest that chitinases can be degraded by plant and yeast proteases, and that the chitin level of yeast cell wall, binding grape chitinases, can reduce chitinase concentration [57]. The higher chitinase level of Starmerella wines compared to EC1118 allows to formulate a hypothesis that the S. bacillaris cell wall could contain less chitin than EC1118 or that the S. cerevisiae strain could possess higher protease activity. However, further studies are necessary to investigate the effects and mechanisms of the interaction between S. bacillaris and S. cerevisiae during alcoholic fermentation. These results evidence that the increase of protein stability in Starmerella wines cannot be related to the removal of grape haze proteins, suggesting the involvement of other mechanisms.

3.4. Wine Polysaccharides

In wine, polysaccharides are typically considered as “protective colloids” due to their ability in preventing or limiting aggregation, flocculation, and therefore, haze formation and tartrate salt crystallization [38]. Wine polysaccharides originate from both grape primary cell walls (pectic polysaccharides) and yeast cell walls (mannoproteins and mannans) [58]. To verify if the differences in wine stability observed in Figure 1 are attributable to the released material of polysaccharide nature, the concentration of polysaccharides in finished wines was measured (Table 4, Table 5 and Table 6).
Apart from three wines (PG FRI754, MB FRI719, and FRI 729), in all other samples, the presence of S. bacillaris resulted in higher concentrations of total polysaccharides than EC1118 control wine. In EC1118 control wines, the total polysaccharide content changed according to the grape variety: 135.54 mg/L in SB, 230.96 mg/L in PG, and 276.10 mg/L in MB. The average total polysaccharide content of Starmerella wines in SB was 221.5 mg/L (corresponding to a 63.4% increase), in PG, it was 274.9 mg/L (+19%), and, in MB, it was 299.71 mg/L (+8.5%). In particular, SB PAS103 wine showed an increase in the total polysaccharide concentration of 128% with respect to EC1118 control wine. In PG, only FRI754 and PAS 173 wines showed total polysaccharide content slightly lower than or equal to EC1118. In MB, PAS103 and PAS151 wines were not significantly different from the control, while only FRI719 and FRI729 wines contained less polysaccharides than the control wine. These data confirmed those reported by Lemos Junior [45] and suggest a synergistic effect of S. cerevisiae and S. bacillaris in releasing cell-wall polysaccharides. These polysaccharides could be responsible for the higher protein stability of the S. bacillaris wines (Figure 1).
The polysaccharides were further characterized on the basis of their molecular weight by size fractionation in HPLC (Table 4, Table 5 and Table 6). In general, the fraction with the lowest content of polysaccharides was high MW (1100–180 kDa). The concentration of this fraction, compared to the control wine, varied depending on Starmerella strains and grape variety. S. bacillaris SB wines showed a higher (in seven wines) or equal (in six wines) concentration of high MW fraction with respect to EC1118. Conversely, S. bacillaris PG wines showed a generally (in eight wines) lower concentration of high MW fraction than EC1118, except for FRI7100 wine that showed a significantly higher content. On the contrary, all S. bacillaris MB wines showed a significantly lower concentration of high MW fraction than EC1118.
The fractions with medium and low MW included most of the total polysaccharides in all experimental wines. SB wines all contained significantly higher medium and low MW polysaccharides than the control wine. The same results were found in PG, except for FRI754 wine that showed no significant differences for both fractions, and PAS 173 wine where the low MW fraction was significantly lower. In S. bacillaris MB wines, the low MW fraction was always significantly higher than EC1118 control wines, as well as the medium MW fraction, except for PAS13 wine that showed no significant differences, while FRI719, FRI729, PAS103, and PAS151 wines showed significantly lower level than EC1118.
The above-discussed polysaccharide data clearly indicate that the presence of S. bacillaris results in an increase in concentrations of the medium and low MW polysaccharide fractions.

3.5. Mannoproteins Quantification

Even though other polysaccharides such as arabinogalactan proteins isolated from wine [60] showed a positive effect against protein precipitation, many of the macromolecules showing a stabilizing effect were demonstrated to be mannoproteins [19,39,61].
With respect to the total polysaccharide content, FRI751 and FRI7100 wines always showed high concentrations, whereas PAS55 and PAS13 wines showed intermediate and intermediate to low concentrations, respectively. In PAS103 wines, the total polysaccharides varied with the respect to grape varieties: the level was very high in SB and PG wines, while, in MB, it was not significantly different from the control wine. On the basis of the total polysaccharides results (Table 4, Table 5 and Table 6), these five Starmerella wines (FRI751, FRI7100, PAS13, PAS55, and PAS103) were selected, alongside with the control EC1118 wines, for a targeted quantification of their mannoprotein content following their purification by binding to Concanavalin A resin.
Generally, the wines produced with the five S. bacillaris strains showed significantly higher concentrations of total mannoproteins compared to EC1118 (Table 7).
Twelve Starmerella wines out of 15 showed a total mannoprotein content higher than the corresponding EC1118 control wines, evidencing an increase in mannoprotein content with respect to total polysaccharides. Interestingly, the high MW mannoprotein fraction was not detected, indicating that the molecular weight of mannoproteins was lower than 180 kDa for all wines. With respect to the medium MW polysaccharide fraction, a dramatic decrease was observed in the corresponding medium MW mannoprotein fraction. These results confirmed the large presence of polysaccharides from different origin (yeast cell wall and/or plant), not related to the mannoprotein structure. In general, the highest concentration of mannoprotein was observed in the low MW fraction (40–7.5 kDa). The highest total mannoprotein content was present in the MB wines with a 212% increase (in PAS13) compared to EC1118, followed by PG (120%, PAS103), while, in SB wines, the highest increased was registered in FRI7100 wine (115.8%) (Table 7). On the contrary, the lowest mannoprotein content was achieved by S. bacillaris PAS55.
By looking at the HRSEC-RID chromatograms of the purified mannoprotein fractions, an important difference in terms of the maximum size (MW) was visible between S. bacillaris strains and EC1118 control. In EC1118 control wine, the highest mannoprotein MW was 65 kDa in SB, 64.9 kDa in PG, and 56.6 kDa in MB. Conversely, the highest MW of the mannoproteins in S. bacillaris wines was notably larger. For SB, the highest MW (174.9 kDa) was reached by PAS103, while, for PG and MB (178.6 and 174.8 kDa, respectively), it was reached by FRI751. These results indicate that differences are not only related to the mannoprotein content but also to the size distribution.
In the literature, the stabilizing effect has been attributed to both high-molecular-weight (420 kDa [19] and 210 kDa [60]) and low-molecular-weight (32 kDa [61]) mannoprotein fractions, suggesting that the chemical structure, rather than the size, is responsible for the protective effect against protein precipitation.

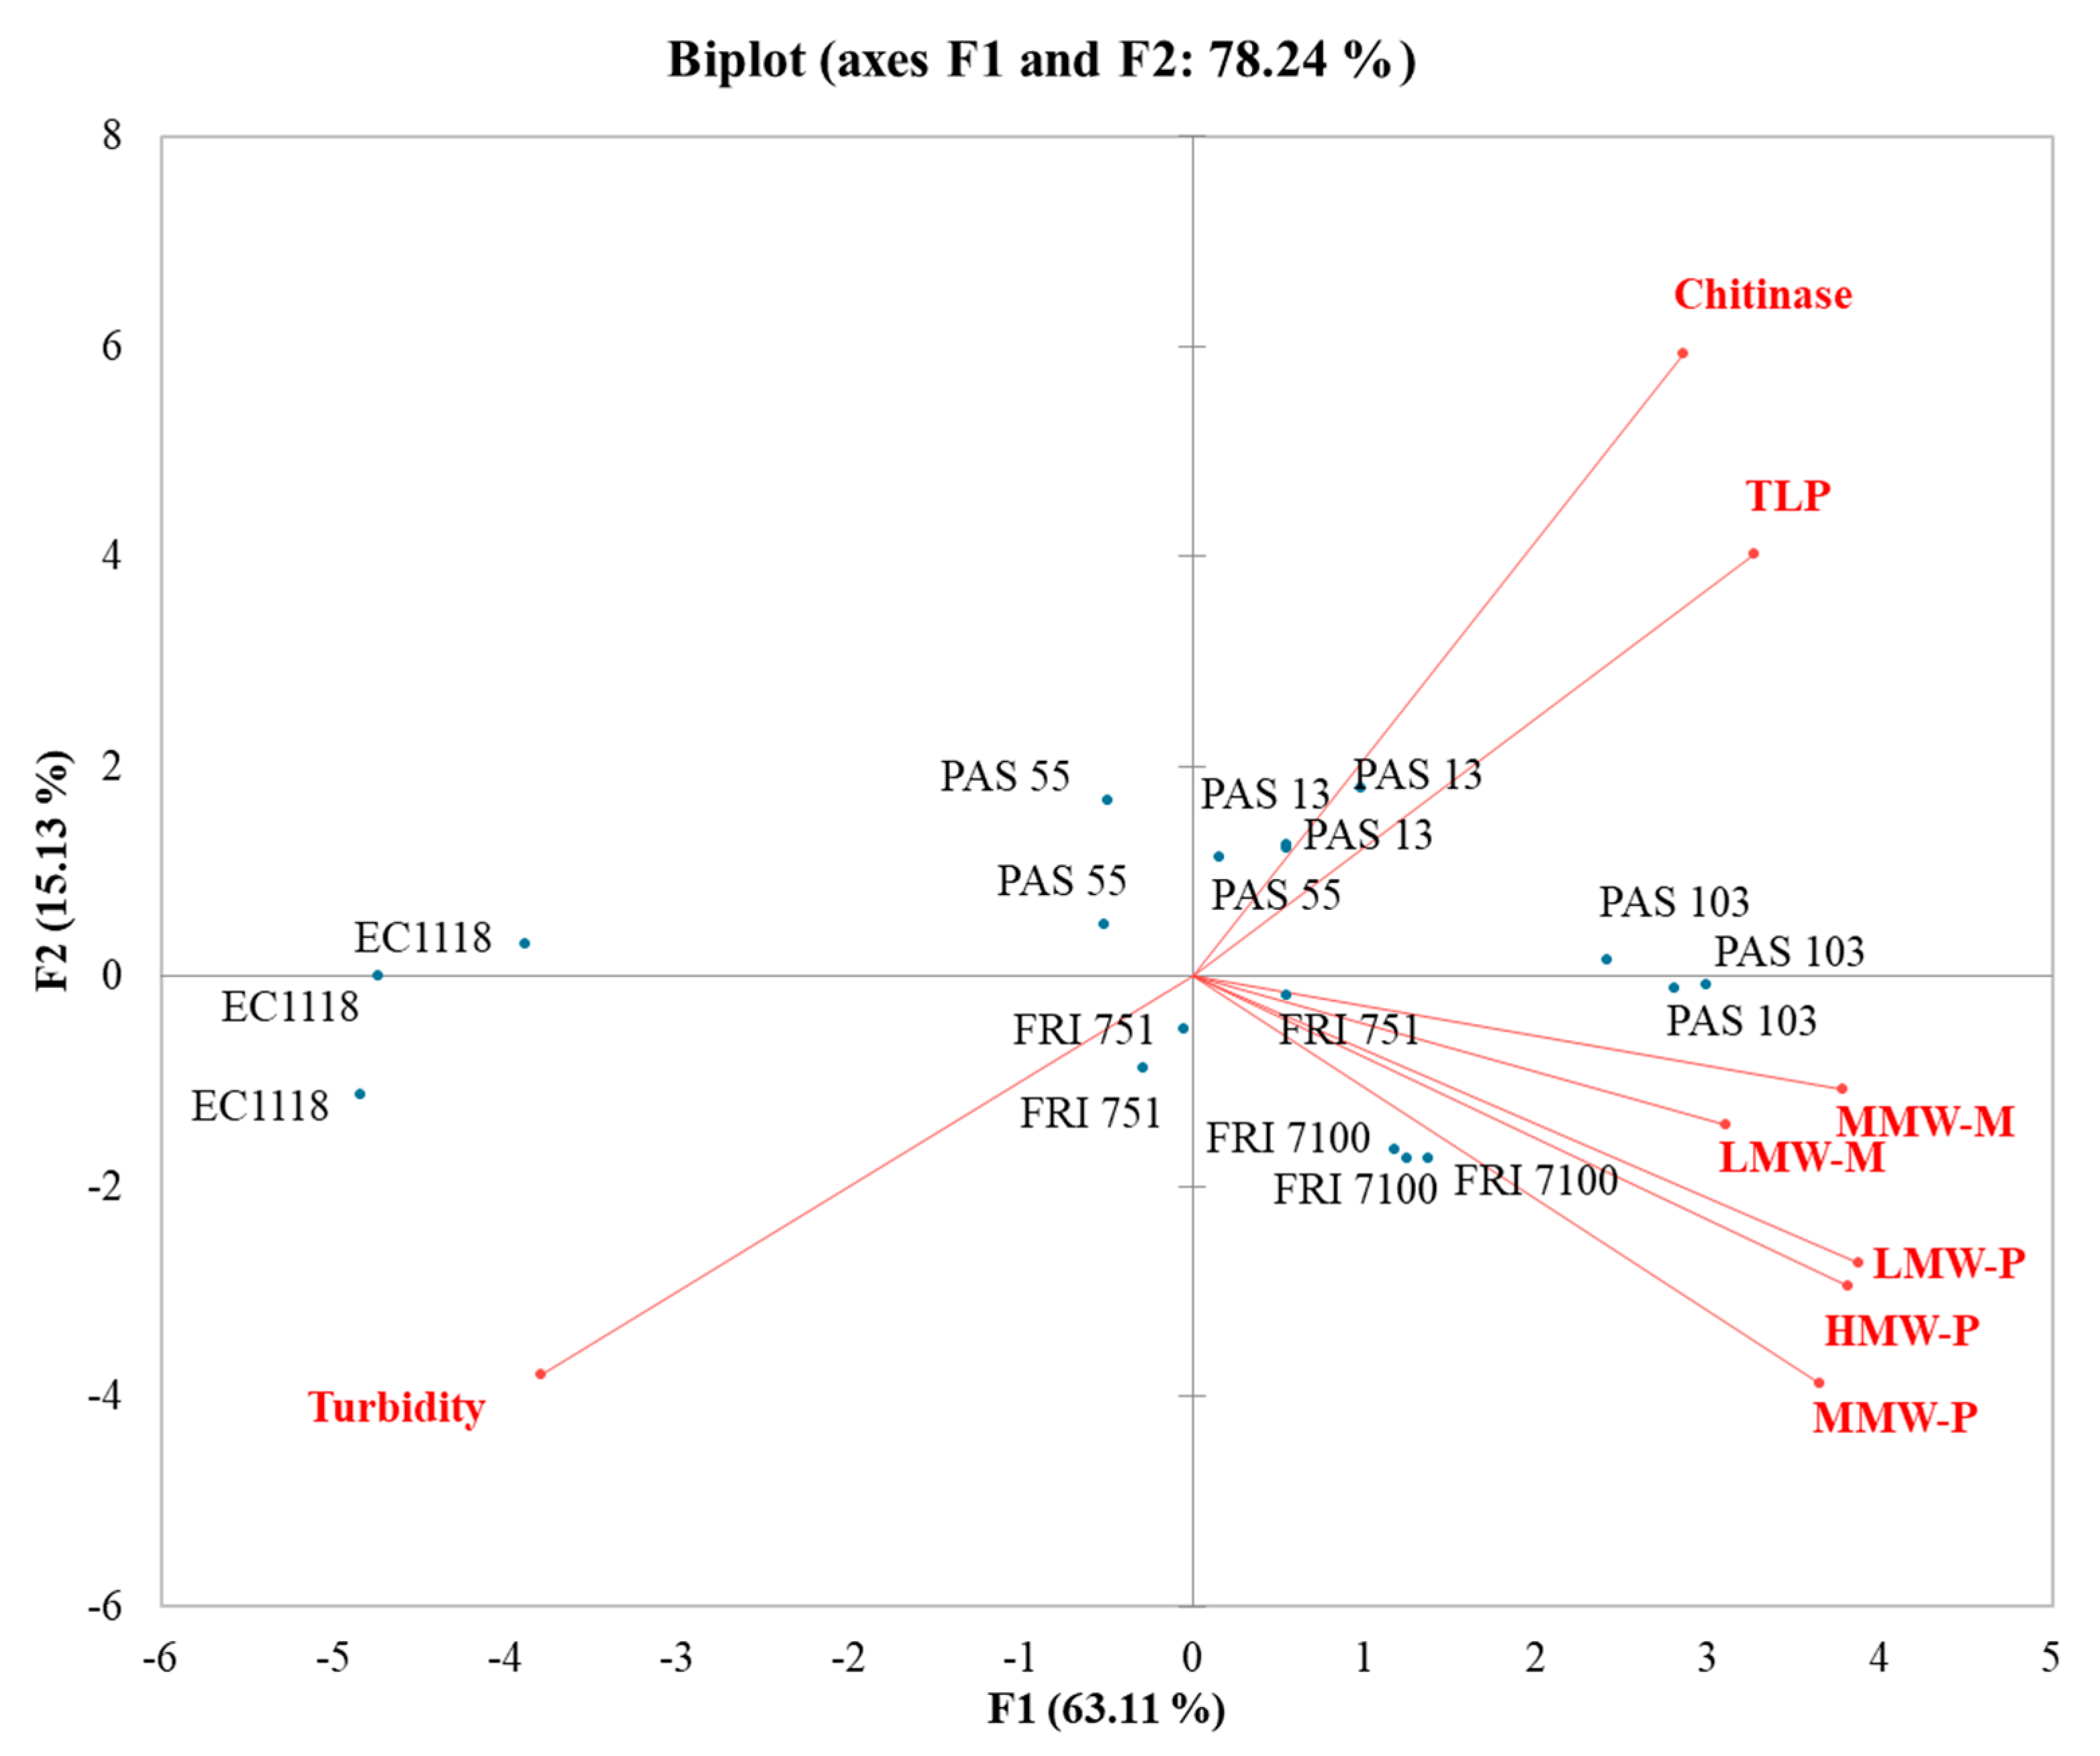
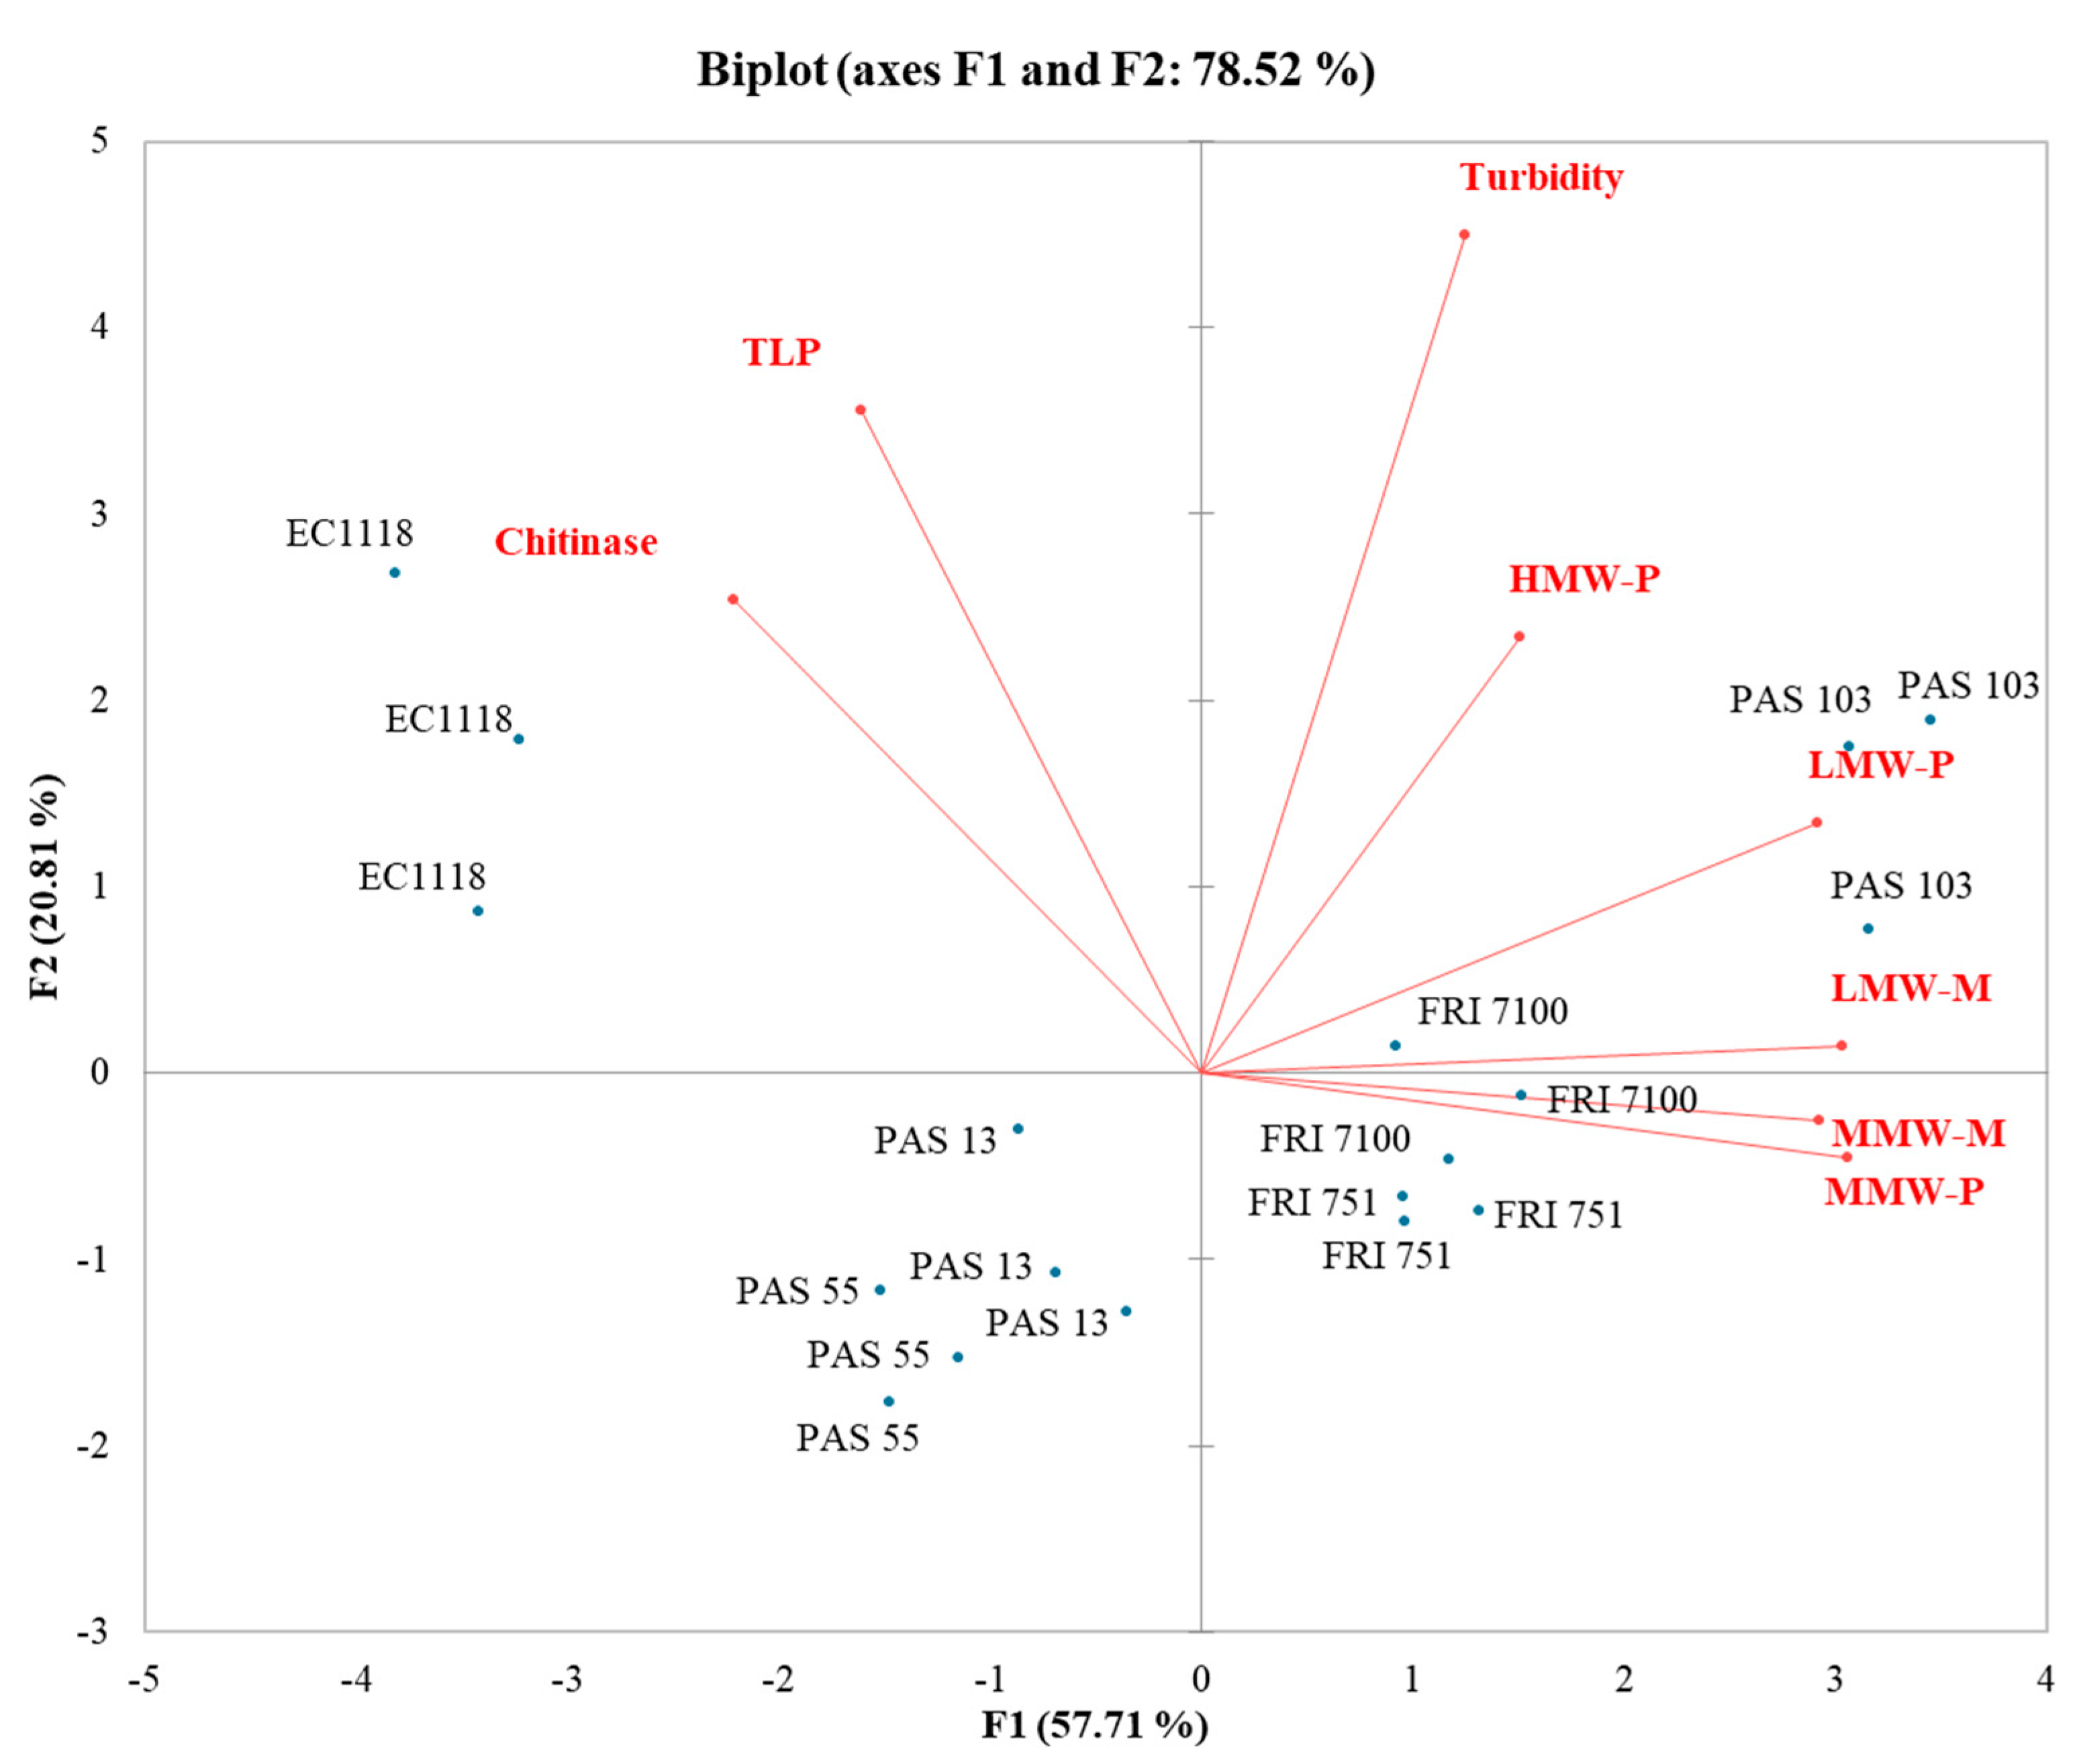
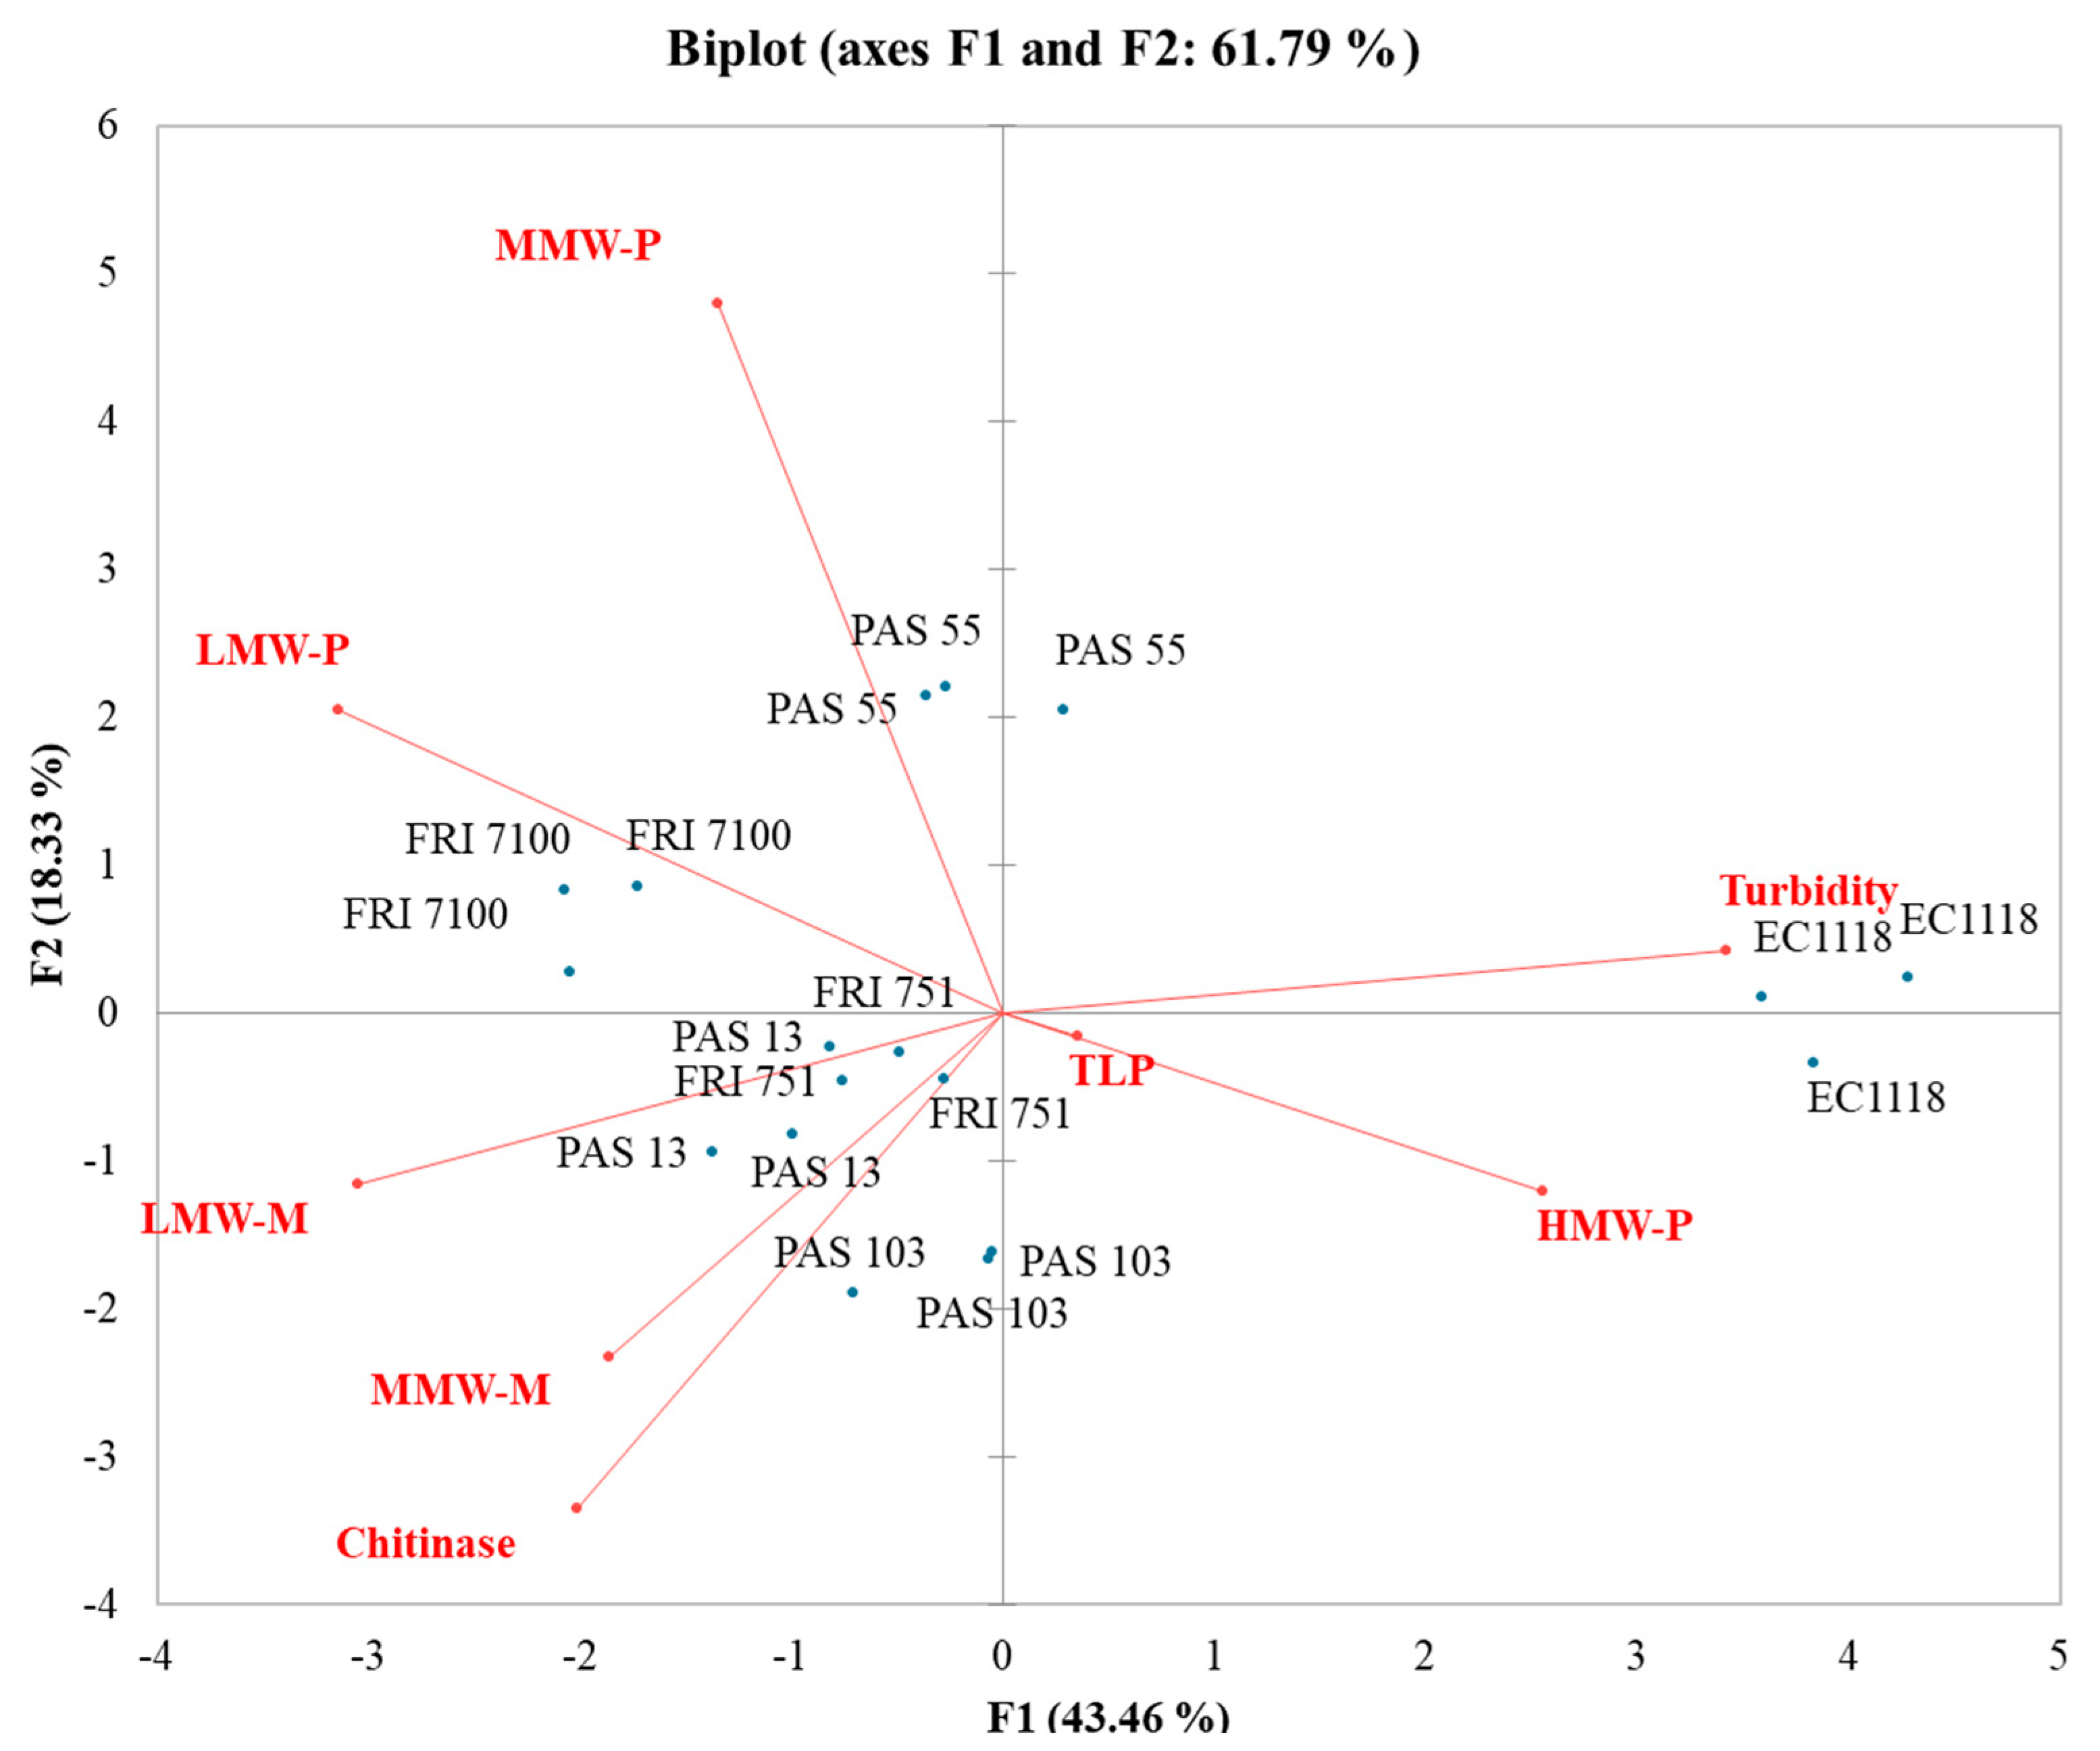
3.6. Influence of Polysaccharides and Mannoproteins on Wines Stability

To evaluate the influence of Starmerella strains on protein stability, the collected data were used to perform a principal component analysis (PCA) considering as parameters turbidity (protein instability measured as ΔNTU), grape proteins, polysaccharide fractions, and mannoprotein fractions. The Pearson correlation analysis related to heat stability is reported in Table 8.
In SB wines, a significant negative correlation (Pearson, p < 0.05) was found for all parameters except for the low MW mannoprotein fraction. The strongest correlation was found with TLPs, chitinases, low MW polysaccharides, and medium MW mannoproteins. Interestingly, and somewhat counterintuitively, wines with more PR proteins are also more heat-unstable [6], while an increase in turbidity corresponds to a decrease in both TLPs and chitinase content. For these grape varieties, our results indicate that the presence of S. bacillaris increased wines’ heat stability, even if the grape protein concentrations were higher than in the control. In PG wines, obtained from the most stable variety, none of the parameters significantly correlated with turbidity except for low MW polysaccharides. This parameter positively correlated with turbidity, indicating, in this condition, that the release of polysaccharides seems to reduce wine protein stability. In MB wines, a significant negative correlation (Pearson, p < 0.05) was observed between the turbidity, and chitinases, low MW polysaccharide, and medium and low MW mannoproteins. On the contrary, for MB wines, the high MW fraction of polysaccharides showed a significant positive correlation. As no high MW mannoproteins were found, this result underlines the role of mannoproteins, instead of polysaccharides from different origin, in increasing wine stability. Moreover, the highest level of correlation was found for low MW polysaccharides and low MW mannoproteins, strongly suggesting the involvement of this MW mannoprotein fraction when wines are obtained with a very unstable grape variety. In S. cerevisiae, it is well known that some mannoprotein fractions play a role in decreasing haze formation. This is due to the mannoprotein competition with grape-derived proteins for other non-proteinaceous wine components, which are necessary for the formation of insoluble aggregation [62].
In the SB-PCA (Figure 3), the first function (F1) accounted for 63.11% of the total variance, while the second function (F2) explained 15.13%. EC1118 wines clustered separately from the others (Starmerella wine cluster) and strongly with turbidity. Most of the Starmerella wines clustered with polysaccharides and mannoproteins. In fact, S. bacillaris increases the presence of these components in wines. This enhances their effect on wine stability. PAS55 and PAS13 wines clustered with TLPs and chitinases, evidencing that a higher level of grape proteins was generally found in Starmerella wines.
In the PG-PCA (Figure 4), the first function (F1) accounted for 57.71% of the total variance, while the second function (F2) explained 20.81% of the total variance. The strain distribution evidences a clear separation between EC1118 and S. bacillaris wines. Although no effect of S. bacillaris on wine stability was found, the composition of the two wines groups was different. Starmerella wines contained a higher level of polysaccharides and mannoproteins, whereas EC1118 wines contained a higher level of PR proteins.
In the MB-PCA (Figure 5), the first function (F1) accounted for 43.46% of the total variance, while the second function (F2) explained 18.33% of the total variance. EC1118 wines clustered separately from the other Starmerella wines and strongly correlated with turbidity and high MW mannoproteins. All Starmerella wines clustered with polysaccharides and mannoproteins. In particular, the low MW mannoprotein vector was the most divergent from the turbidity, confirming a strong involvement of this mannoprotein fraction in increasing wine stability.

4. Conclusions

According to our knowledge, this is the first study evaluating the effect of sequential fermentation with S. bacillaris and S. cerevisiae on the release of polysaccharides and mannoproteins, as well as their effect on protein stability in white wines. The use of S. bacillaris strains, an enological non-Saccharomyces strain, in sequential fermentation with S. cerevisiae EC1118 was demonstrated to be a good and interesting strategy for improving the wine quality and winemaking process. Indeed, Starmerella increased the glycerol level in wines regardless of the grape variety, without increasing volatile acidity. Results clearly demonstrated that S. bacillaris wines were more protein-stable than EC1118. This is the first evidence that the presence of S. bacillaris during fermentation can positively influence wine protein stability. This finding encourages the use of S. bacillaris as a commercial starter for improving wine protein stability, thus reducing the need for bentonite use with improvements in terms of wine quality and winemaking sustainability. The effect on protein stability was demonstrated to be strain-dependent and became more evident when using more heat-unstable wines. In fact, the greatest impact of S. bacillaris was recorded for the MB wines, which were those with the highest protein instability. The quantitative analysis of the polysaccharides and mannoprotein fractions evidenced that both are involved in protein stability. In particular, for the most unstable wine (MB), LMW-P and LMW-M were the fractions most involved. This strongly suggests that the mannoproteins contained in the low MW fraction were the most responsible for wine stability in our condition. However, further studies are necessary to explain the higher level of polysaccharides and particularly mannoproteins released during sequential fermentations. These will help to clarify the complex interaction between S. bacillaris and S. cerevisiae during the alcoholic fermentation.

Supplementary Materials

The following supporting information can be downloaded at https://www.mdpi.com/article/10.3390/fermentation8060252/s1: Table S1. Chemical parameters of the three grape juices before pH and YAN adjustment; Table S2. Saccharomyces cerevisiae and Starmerella bacillaris concentrations at 48 h in the three grape juices.

Author Contributions

Conceptualization, V.C., M.M., and S.V.; formal analysis, L.d.P.D.M., C.N., and E.J.B.-S.; investigation, L.d.P.D.M., C.N., E.J.B.-S., and V.d.S.D.; resources, V.C., A.G., M.M., and S.V.; writing—original draft preparation, L.d.P.D.M., V.d.S.D., C.N., and V.C.; writing—review and editing, V.C., C.N., M.M., S.V., A.G., and L.d.P.D.M.; supervision, V.C.; funding acquisition, V.C. and A.G. All authors have read and agreed to the published version of the manuscript.

Funding

This research was scholarship funded by Fondazione Cassa di Risparmio di Padova e Rovigo (CARIPARO) and funded by Ministero dell’Istruzione, dell’Università e della Ricerca, grant number BIRD174030/17 and grant number DOR1678399/16. The HPLC Agilent 1260 series II quaternary pump LC was funded by Progetto di Eccellenza “Centro per l’Agricoltura, la Sostenibilità e gli Alimenti” (CASA), CUP C26C18000190001, MIUR, Italy.

Institutional Review Board Statement

Not applicable.

Acknowledgments

The authors gratefully acknowledge Francesca Apuzzo and Milena Carlot for the technical assistance during the project.

Conflicts of Interest

The authors declare no conflict of interest.

References

  1. Cosme, F.; Filipe-Ribeiro, L.; Nunes, F.M. Wine stabilisation: An overview of defects and treatments. In Chemistry and Biochemistry of Winemaking, Wine Stabilization and Aging; Cosme, F., Nunes, F.M., Filipe-Ribeiro, L., Eds.; IntechOpen: London, UK, 2021. [Google Scholar] [CrossRef]
  2. Van Sluyter, S.C.; McRae, J.M.; Falconer, R.J.; Smith, P.A.; Bacic, A.; Waters, E.J.; Marangon, M. Wine protein haze: Mechanisms of formation and advances in prevention. J. Agric. Food Chem. 2015, 63, 4020–4030. [Google Scholar] [CrossRef] [PubMed]
  3. Falconer, R.J.; Marangon, M.; Van Sluyter, S.C.; Neilson, K.A.; Chan, C.; Waters, E.J. Thermal stability of thaumatin-like protein, chitinase, and invertase isolated from Sauvignon blanc and Semillon juice and their role in haze formation in wine. J. Agric. Food Chem. 2010, 58, 975–980. [Google Scholar] [CrossRef] [PubMed]
  4. Marangon, M.; Sluyter, S.C.V.; Waters, E.J.; Menz, R.I. Structure of haze forming proteins in white wines: Vitis vinifera thaumatin-like proteins. PLoS ONE 2014, 9, e113757. [Google Scholar] [CrossRef] [PubMed] [Green Version]
  5. Marangon, M.; Sauvage, F.-X.; Waters, E.J.; Vernhet, A. Effects of ionic strength and sulfate upon thermal aggregation of grape chitinases and thaumatin-like proteins in a model system. J. Agric. Food Chem. 2011, 59, 2652–2662. [Google Scholar] [CrossRef]
  6. Marangon, M.; Van Sluyter, S.C.; Neilson, K.A.; Chan, C.; Haynes, P.A.; Waters, E.J.; Falconer, R.J. Roles of grape thaumatin-like protein and chitinase in white wine haze formation. J. Agric. Food Chem. 2011, 59, 733–740. [Google Scholar] [CrossRef]
  7. Ruzza, P.; Honisch, C.; Marangon, M.; Curioni, A.; Bakalinsky, A.; Vincenzi, S. Influence of the reducing environment in the misfolding of wine proteins. Adv. Protein Chem. Struct. Biol. 2019, 118, 413–436. [Google Scholar] [CrossRef]
  8. Vernhet, A.; Meistermann, E.; Cottereau, P.; Charrier, F.; Chemardin, P.; Poncet-Legrand, C. Wine thermosensitive proteins adsorb first and better on bentonite during fining: Practical implications and proposition of alternative heat tests. J. Agric. Food Chem. 2020, 68, 13450–13458. [Google Scholar] [CrossRef]
  9. Di Gaspero, M.; Ruzza, P.; Hussain, R.; Honisch, C.; Biondi, B.; Siligardi, G.; Marangon, M.; Curioni, A.; Vincenzi, S. The secondary structure of a major wine protein is modified upon interaction with polyphenols. Molecules 2020, 25, 1646. [Google Scholar] [CrossRef] [Green Version]
  10. Dordoni, R.; Colangelo, D.; Giribaldi, M.; Giuffrida, M.G.; De Faveri, D.M.; Lambri, M. Effect of bentonite characteristics on wine proteins, polyphenols, and metals under conditions of different pH. Am. J. Enol. Vitic. 2015, 66, 518–530. [Google Scholar] [CrossRef]
  11. Arenas, I.; Ribeiro, M.; Filipe-Ribeiro, L.; Vilamarim, R.; Costa, E.; Siopa, J.; Cosme, F.; Nunes, F.M. Effect of pre-fermentative maceration and fining agents on protein stability, macromolecular, and phenolic composition of Albariño white wines: Comparative efficiency of chitosan, k-carrageenan and bentonite as heat stabilisers. Foods 2021, 10, 608. [Google Scholar] [CrossRef]
  12. Marangon, M.; Lucchetta, M.; Duan, D.; Stockdale, V.J.; Hart, A.; Rogers, P.J.; Waters, E.J. Protein removal from a Chardonnay juice by addition of carrageenan and pectin: Adsorbents for protein stabilization of wines. Aust. J. Grape Wine Res. 2012, 18, 194–202. [Google Scholar] [CrossRef]
  13. Ratnayake, S.; Stockdale, V.; Grafton, S.; Munro, P.; Robinson, A.L.; Pearson, W.; McRae, J.M.; Bacic, A. Carrageenans as heat stabilisers of white wine. Aust. J. Grape Wine Res. 2019, 25, 439–450. [Google Scholar] [CrossRef]
  14. Romanini, E.; McRae, J.M.; Bilogrevic, E.; Colangelo, D.; Gabrielli, M.; Lambri, M. Use of grape seeds to reduce haze formation in white wines. Food Chem. 2021, 341, 128250. [Google Scholar] [CrossRef]
  15. Romanini, E.; McRae, J.M.; Colangelo, D.; Lambri, M. First trials to assess the feasibility of grape seed powder (GSP) as a novel and sustainable bentonite alternative. Food Chem. 2020, 305, 125484. [Google Scholar] [CrossRef]
  16. Marangon, M.; Van Sluyter, S.C.; Robinson, E.M.C.; Muhlack, R.A.; Holt, H.E.; Haynes, P.A.; Godden, P.W.; Smith, P.A.; Waters, E.J. Degradation of white wine haze proteins by Aspergillopepsin I and II during juice flash pasteurization. Food Chem. 2012, 135, 1157–1165. [Google Scholar] [CrossRef]
  17. Sui, Y.; McRae, J.M.; Wollan, D.; Muhlack, R.A.; Godden, P.; Wilkinson, K.L. Use of ultrafiltration and proteolytic enzymes as alternative approaches for protein stabilisation of white wine. Aust. J. Grape Wine Res. 2021, 27, 234–245. [Google Scholar] [CrossRef]
  18. Brown, S.L.; Stockdale, V.J.; Pettolino, F.; Pocock, K.F.; de Barros Lopes, M.; Williams, P.J.; Bacic, A.; Fincher, G.B.; Høj, P.B.; Waters, E.J. Reducing haziness in white wine by overexpression of Saccharomyces cerevisiae genes YOL155c and YDR055w. Appl. Microbiol. Biotechnol. 2007, 73, 1363–1376. [Google Scholar] [CrossRef]
  19. Dupin, I.V.S.; Stockdale, V.J.; Williams, P.J.; Jones, G.P.; Markides, A.J.; Waters, E.J. Saccharomycescerevisiae mannoproteins that protect wine from protein haze: Evaluation of extraction methods and immunolocalization. J. Agric. Food Chem. 2000, 48, 1086–1095. [Google Scholar] [CrossRef]
  20. Llaubères, R.M.; Dubourdieu, D.; Villettaz, J.C. Exocellular polysaccharides from Saccharomyces in Wine. J. Sci. Food Agric. 1987, 41, 277–286. [Google Scholar] [CrossRef]
  21. Charpentier, C.; Dos Santos, A.M.; Feuillat, M. Release of macromolecules by Saccharomyces cerevisiae during ageing of French flor sherry wine “Vin jaune”. Int. J. Food Microbiol. 2004, 96, 253–262. [Google Scholar] [CrossRef]
  22. FAO. Yeast Extracts Containing Mannoproteins. 2021. Available online: https://www.fao.org/3/cb3376en/cb3376en.pdf (accessed on 11 January 2022).
  23. Klis, F.M.; Boorsma, A.; De Groot, P.W.J. Cell wall construction in Saccharomyces cerevisiae. Yeast 2006, 23, 185–202. [Google Scholar] [CrossRef]
  24. Millarini, V.; Ignesti, S.; Cappelli, S.; Ferraro, G.; Adessi, A.; Zanoni, B.; Fratini, E.; Domizio, P. Protection of wine from protein haze using Schizosaccharomyces japonicus polysaccharides. Foods 2020, 9, 1407. [Google Scholar] [CrossRef]
  25. Vejarano, R. Non-Saccharomyces in winemaking: Source of mannoproteins, nitrogen, enzymes, and antimicrobial compounds. Fermentation 2020, 6, 76. [Google Scholar] [CrossRef]
  26. Giovani, G.; Rosi, I.; Bertuccioli, M. Quantification and characterization of cell wall polysaccharides released by non-Saccharomyces yeast strains during alcoholic fermentation. Int. J. Food Microbiol. 2012, 160, 113–118. [Google Scholar] [CrossRef]
  27. Romani, C.; Domizio, P.; Lencioni, L.; Gobbi, M.; Comitini, F.; Ciani, M.; Mannazzu, I. Polysaccharides and glycerol production by non-Saccharomyces wine yeasts in mixed fermentation. Quad. Vitic. Enol. Univ. Torino 2010, 31, 185–189. [Google Scholar]
  28. Goold, H.D.; Kroukamp, H.; Williams, T.C.; Paulsen, I.T.; Varela, C.; Pretorius, I.S. Yeast’s balancing act between ethanol and glycerol production in low-alcohol wines. Microb. Biotechnol. 2017, 10, 264–278. [Google Scholar] [CrossRef]
  29. Lemos Junior, W.J.F.; de Oliveira, V.S.; Guerra, A.F.; Giacomini, A.; Corich, V. From the vineyard to the cellar: New insights of Starmerella bacillaris (synonym Candida zemplinina) technological properties and genomic perspective. Appl. Microbiol. Biotechnol. 2021, 105, 493–501. [Google Scholar] [CrossRef]
  30. Lemos Junior, W.J.; Bovo, B.; Nadai, C.; Crosato, G.; Carlot, M.; Favaron, F.; Giacomini, A.; Corich, V. Biocontrol ability and action mechanism of Starmerella bacillaris (synonym Candida zemplinina) isolated from wine musts against gray mold disease agent Botrytis cinerea on grape and their effects on alcoholic fermentation. Front. Microbiol. 2016, 7, 1249. [Google Scholar] [CrossRef]
  31. Lemos Junior, W.J.F.; Treu, L.; Duarte, V.D.S.; Campanaro, S.; Nadai, C.; Giacomini, A.; Corich, V. Draft genome sequence of the yeast Starmerella bacillaris (syn. Candida zemplinina) FRI751 isolated from fermenting must of dried Raboso grapes. Genome Announc. 2017, 5, e00224–e00317. [Google Scholar] [CrossRef] [Green Version]
  32. Lemos Junior, W.J.F.; Treu, L.; da Silva Duarte, V.; Carlot, M.; Nadai, C.; Campanaro, S.; Giacomini, A.; Corich, V. Whole-genome sequence of Starmerella bacillaris PAS13, a non-conventional enological yeast with antifungal activity. Genome Announc. 2017, 5, e00788–e00817. [Google Scholar] [CrossRef] [Green Version]
  33. Bovo, B.; Nadai, C.; Vendramini, C.; Lemos Junior, W.J.; Carlot, M.; Skelin, A.; Giacomini, A.; Corich, V. Aptitude of Saccharomyces yeasts to ferment unripe grapes harvested during cluster thinning for reducing alcohol content of wine. Int. J. Food Microbiol. 2016, 236, 56–64. [Google Scholar] [CrossRef] [PubMed]
  34. Nadai, C.; Lemos Junior, W.J.; Favaron, F.; Giacomini, A.; Corich, V. Biocontrol activity of Starmerella bacillaris yeast against blue mold disease on apple fruit and its effect on cider fermentation. PLoS ONE 2018, 13, e0204350. [Google Scholar] [CrossRef] [PubMed]
  35. Lemos Junior, W.J.F.; Nadai, C.; Crepalde, L.T.; de Oliveira, V.S.; de Matos, A.D.; Giacomini, A.; Corich, V. Potential use of Starmerella bacillaris as fermentation starter for the production of low-alcohol beverages obtained from unripe grapes. Int. J. Food Microbiol. 2019, 303, 1–8. [Google Scholar] [CrossRef] [PubMed]
  36. Pocock, K.F.; Rankine, B.C. Heat test for detecting protein instability in wine. Aust. Wine Brew. Spirit Rev. 1973, 91, 42–43. [Google Scholar]
  37. Van Sluyter, S.C.; Marangon, M.; Stranks, S.D.; Neilson, K.A.; Hayasaka, Y.; Haynes, P.A.; Ian Menz, R.; Waters, E.J. Two-Step purification of pathogenesis-related proteins from grape juice and crystallization of thaumatin-like proteins. J. Agric. Food Chem. 2009, 57, 11376–11382. [Google Scholar] [CrossRef]
  38. Ayestarán, B.; Guadalupe, Z.; León, D. Quantification of major grape polysaccharides (Tempranillo v.) released by maceration enzymes during the fermentation process. Anal. Chim. Acta 2004, 513, 29–39. [Google Scholar] [CrossRef]
  39. De Iseppi, A.; Marangon, M.; Vincenzi, S.; Lomolino, G.; Curioni, A.; Divol, B. A novel approach for the valorization of wine lees as a source of compounds able to modify wine properties. LWT 2021, 136, 110274. [Google Scholar] [CrossRef]
  40. Gobert, A.; Tourdot-Maréchal, R.; Morge, C.; Sparrow, C.; Liu, Y.; Quintanilla-Casas, B.; Vichi, S.; Alexandre, H. Non-Saccharomyces yeasts nitrogen source preferences: Impact on sequential fermentation and wine volatile compounds profile. Front. Microbiol. 2017, 8, 2175. [Google Scholar] [CrossRef] [Green Version]
  41. Nadai, C.; Giacomini, A.; Corich, V. The addition of wine yeast Starmerella bacillaris to grape skin surface influences must fermentation and glycerol production. OENO One 2021, 55, 47–55. [Google Scholar] [CrossRef]
  42. Horváth, B.O.; Sárdy, D.N.; Kellner, N.; Magyar, I. Effects of high sugar content on fermentation dynamics and some metabolites of wine-related yeast species Saccharomyces cerevisiae, S. uvarum and Starmerella bacillaris. Food Technol. Biotechnol. 2020, 58, 76–83. [Google Scholar] [CrossRef]
  43. Gawel, R.; Sluyter, S.V.; Waters, E.J. The effects of ethanol and glycerol on the body and other sensory characteristics of Riesling wines. Aust. J. Grape Wine Res. 2007, 13, 38–45. [Google Scholar] [CrossRef]
  44. Benito, S. The impacts of Schizosaccharomyces on winemaking. Appl. Microbiol. Biotechnol. 2019, 103, 4291–4312. [Google Scholar] [CrossRef]
  45. Lemos Junior, W.J.F.; Nadai, C.; Rolle, L.; Da Silva Gulao, E.; Miguez da Rocha Leãoe, M.H.; Giacomini, A.; Corich, V.; Vincenzi, S. Influence of the mannoproteins of different strains of Starmerella bacillaris used in single and sequential fermentations on foamability, tartaric and protein stabilities of wines. OENO One 2020, 54, 231–243. [Google Scholar] [CrossRef] [Green Version]
  46. Englezos, V.; Rantsiou, K.; Giacosa, S.; Río Segade, S.; Rolle, L.; Cocolin, L. Cell-to-cell contact mechanism modulates Starmerella bacillaris death in mixed culture fermentations with Saccharomyces cerevisiae. Int. J. Food Microbiol. 2019, 289, 106–114. [Google Scholar] [CrossRef]
  47. Englezos, V.; Rantsiou, K.; Torchio, F.; Rolle, L.; Gerbi, V.; Cocolin, L. Exploitation of the non-Saccharomyces yeast Starmerella bacillaris (synonym Candida zemplinina) in wine fermentation: Physiological and molecular characterizations. Int. J. Food Microbiol. 2015, 199, 33–40. [Google Scholar] [CrossRef]
  48. Comitini, F.; Gobbi, M.; Domizio, P.; Romani, C.; Lencioni, L.; Mannazzu, I.; Ciani, M. Selected non-Saccharomyces wine yeasts in controlled multistarter fermentations with Saccharomyces cerevisiae. Food Microbiol. 2011, 28, 873–882. [Google Scholar] [CrossRef]
  49. Englezos, V.; Rantsiou, K.; Cravero, F.; Torchio, F.; Ortiz-Julien, A.; Gerbi, V.; Rolle, L.; Cocolin, L. Starmerella bacillaris and Saccharomyces cerevisiae mixed fermentations to reduce ethanol content in wine. Appl. Microbiol. Biotechnol. 2016, 100, 5515–5526. [Google Scholar] [CrossRef]
  50. Rantsiou, K.; Dolci, P.; Giacosa, S.; Torchio, F.; Tofalo, R.; Torriani, S.; Suzzi, G.; Rolle, L.; Cocolin, L. Candida zemplinina can reduce acetic acid produced by Saccharomyces cerevisiae in sweet wine fermentations. Appl. Environ. Microbiol. 2012, 78, 1987–1994. [Google Scholar] [CrossRef] [Green Version]
  51. Lambrechts, M.G.; Pretorius, I.S. Yeast and its importance to wine aroma-a review. S. Afr. J. Enol. Vitic. 2000, 21, 97–129. [Google Scholar] [CrossRef] [Green Version]
  52. Mendes Ferreira, A.; Mendes-Faia, A. The role of yeasts and lactic acid bacteria on the metabolism of organic acids during winemaking. Foods 2020, 9, 1231. [Google Scholar] [CrossRef]
  53. Esteruelas, M.; Poinsaut, P.; Sieczkowski, N.; Manteau, S.; Fort, M.F.; Canals, J.M.; Zamora, F. Characterization of natural haze protein in Sauvignon white wine. Food Chem. 2009, 113, 28–35. [Google Scholar] [CrossRef]
  54. Vincenzi, S.; Mosconi, S.; Zoccatelli, G.; Pellegrina, C.D.; Veneri, G.; Chignola, R.; Peruffo, A.; Curioni, A.; Rizzi, C. Development of a new procedure for protein recovery and quantification in wine. Am. J. Enol. Vitic. 2005, 56, 182–187. [Google Scholar]
  55. Waters, E.J.; Shirley, N.J.; Williams, P.J. Nuisance proteins of wine are grape pathogenesis related proteins. J. Agric. Food Chem. 1996, 44, 3–5. [Google Scholar] [CrossRef]
  56. Vincenzi, S.; Marangon, M.; Tolin, S.; Curioni, A. Protein evolution during the early stages of white winemaking and its relations with wine stability: Protein evolution in white wine during winemaking. Aust. J. Grape Wine Res. 2011, 17, 20–27. [Google Scholar] [CrossRef]
  57. Ndlovu, T.; Divol, B.; Bauer, F.F. Yeast cell wall chitin reduces wine haze formation. Appl. Environ. Microbiol. 2018, 84, e00668–e00718. [Google Scholar] [CrossRef] [Green Version]
  58. Vidal, S.; Doco, T.; Moutounet, M.; Pellerin, P. Soluble polysaccharide content at initial time of experimental must preparation. Am. J. Enol. Vitic. 2000, 51, 115–121. [Google Scholar]
  59. González-Royo, E.; Esteruelas, M.; Kontoudakis, N.; Fort, F.; Canals, J.M.; Zamora, F. The effect of supplementation with three commercial inactive dry yeasts on the colour, phenolic compounds, polysaccharides and astringency of a model wine solution and red wine. J. Sci. Food Agric. 2017, 97, 172–181. [Google Scholar] [CrossRef]
  60. Waters, E.J.; Pellerin, P.; Brillouet, J.M. A wine arabinogalactan-protein that reduces heat-induced wine protein haze. Biosci. Biotechnol. Biochem. 1994, 58, 43–48. [Google Scholar] [CrossRef] [Green Version]
  61. Moine-Ledoux, V.; Dubourdieu, D. An invertase fragment responsible for improving the protein stability of dry white wines. J. Sci. Food Agric. 1999, 79, 537–543. [Google Scholar] [CrossRef]
  62. Waters, E.J.; Alexander, G.; Muhlack, R.; Pocock, K.F.; Colby, C.; O’Neill, B.K.; Høj, P.B.; Jones, P. Preventing protein haze in bottled white wine. Aust. J. Grape Wine Res. 2005, 11, 215–225. [Google Scholar] [CrossRef]
Figure 1. Heat stability (expressed as ΔNTU) in S. cerevisiae (EC1118) and S. bacillaris sequential fermentations. Sauvignon blanc Pinot grigio Manzoni bianco. Values are represented by the average (bars) and standard deviation (error bar) (n = 3). The difference between the averages was analyzed by one-way ANOVA and Tukey post hoc tests. Different letters indicate significant statistical differences p < 0.05 (Tukey’s test) among the fermentation trials.
Fermentation 08 00252 g001
Figure 2. Concentration (as mg/L thaumatin) of PR proteins in the 42 experimental wines. (a) Concentration of TLPs. (b) Concentration of chitinases. Sauvignon blanc Pinot grigio Manzoni bianco. Values are represented by the average (bars) and standard deviation (error bar) (n = 3). The difference between the averages was analyzed by one-way ANOVA and Tukey post hoc tests. Different letters indicate significant statistical differences p < 0.05 (Tukey’s test) among the fermentation trials.
Fermentation 08 00252 g002
Figure 3. Principal component analysis (PCA) biplot of turbidity, grape proteins, polysaccharides, and mannoproteins in Sauvignon blanc wines.
Fermentation 08 00252 g003
Figure 4. Principal component analysis (PCA) biplot of turbidity, grape proteins, polysaccharides, and mannoproteins in Pinot grigio wines.
Fermentation 08 00252 g004
Figure 5. Principal component analysis (PCA) biplot of turbidity, grape proteins, polysaccharides, and mannoproteins in Manzoni bianco wines.
Fermentation 08 00252 g005
Table 1. Glucose and fructose residues at 48 h and concentrations of the main fermentation products at the end of sequential fermentations with S. bacillaris strains and S. cerevisiae EC1118 in Sauvignon blanc.
48 hEnd of Fermentation
StrainsGlucose
(g/L)
Fructose
(g/L)
Glycerol
(g/L)
Ethanol
(%v/v)
Succinic
Acid (g/L)
Acetic
Acid (g/L)
EC111890.14 ± 1.03 a91.13 ± 0.57 ab5.17 ± 0.07 a11.76 ± 0.01 b2.52 ± 0.05 ab0.43 ± 0.03 a
FRI719120.12 ± 0.52 c91.28 ± 0.40 abc8.70 ± 0.02 fg11.47 ± 0.09 ab2.50 ± 0.35 ab0.72 ± 0.17 abc
FRI728121.55 ± 1.08 c94.06 ± 0.29 bcde7.61 ± 0.14 bcd11.39 ± 0.25 ab2.67 ± 0.02 ab0.37 ± 0.03 a
FRI729120.17 ± 2.95 c95.12 ± 0.36 e8.25 ± 0.10 ef11.50 ± 0.19 ab2.56 ± 0.01 ab0.40 ± 0.01 a
FRI751122.34 ± 0.22 c94.92 ± 0.11 de7.92 ± 0.03 cde11.52 ± 0.23 ab2.72 ± 0.05 ab0.60 ± 0.27 abc
FRI754121.97 ± 0.28 c94.2 ± 0.64 bcde8.53 ± 0.11 f11.43 ± 0.25 ab2.48 ± 0.27 ab0.67 ± 0.31 abc
FRI7100122.73 ± 0.47 c94.43 ± 0.34 cde9.12 ± 0.15 g11.26 ± 0.09 ab3.16 ± 0.11 b1.10 ± 0.02 c
PAS13121.84 ± 1.38 c95.49 ± 0.73 ef7.95 ± 0.17 cde11.48 ± 0.12 ab3.34 ± 0.12 b1.17 ± 0.09 c
PAS55124.14 ± 5.04 c98.51 ± 2.05 fg7.39 ± 0.16 b11.34 ± 0.25 ab2.71 ± 0.05 ab0.56 ± 0.19 abc
PAS66119.33 ± 0.74 c97.16 ± 1.94 ef7.55 ± 0.07 bc11.12 ± 0.32 ab3.05 ± 0.21 ab0.93 ± 0.23 abc
PAS92109.63 ± 3.28 b101.22 ± 2.34 g8.05 ± 0.18 de11.48 ± 0.18 ab2.26 ± 0.79 ab0.61 ± 0.28 abc
PAS103120.09 ± 0.48 c91.92 ± 0.21 abcd7.87 ± 0.35 cde11.40 ± 0.16 ab1.98 ± 1.02 a0.54 ± 0.45 abc
PAS151118.89 ± 0.71 c91.39 ± 0.30 abc7.97 ± 0.18 cde11.19 ± 0.25 ab2.93 ± 0.29 ab0.44 ± 0.18 ab
PAS173119.12 ± 0.16 c90.76 ± 0.68 a7.94 ± 0.10 cde10.91 ± 0.49 a3.09 ± 0.08 ab1.07 ± 0.05 bc
Values are represented by the average and standard deviation (n = 3). The difference between the averages was analyzed by one-way ANOVA and Tukey post hoc tests. Different letters indicate significant statistical differences p < 0.05 (Tukey’s test).
Table 2. Glucose and fructose residues at 48 h and concentrations of the main fermentation products at the end of sequential fermentations with S. bacillaris strains and S. cerevisiae EC1118 in Pinot grigio.
48 hEnd of Fermentation
StrainsGlucose
(g/L)
Fructose
(g/L)
Glycerol
(g/L)
Ethanol
(%v/v)
Succinic
Acid (g/L)
Acetic
Acid (g/L)
EC111875.80 ± 2.13 a85.78 ± 1.33 a5.36 ± 0.21 a11.11 ± 0.58 c1.45 ± 0.05 a0.68 ± 0.01 abcde
FRI719106.83 ± 1.77 d98.46 ±0.38 c6.79 ± 0.15 cd11.41 ± 0.07 c1.46 ± 0.08 a0.49 ± 0.06 a
FRI728105.99 ± 1.70 cd94.17 ± 1.75 b7.23 ± 0.11 de11.30 ± 0.01 c1.62 ± 0.09 ab0.64 ± 0.07 abcd
FRI729102.50 ± 1.89 bc92.71 ± 1.21 b7.89 ± 0.22 fg11.26 ± 0.02 c1.67 ± 0.17 abc0.81 ± 0.16 cde
FRI751105.48 ± 0.51 cd98.67 ± 0.70 c7.38 ± 0.24 ef11.31 ± 0.10 c1.69 ± 0.06 abc0.66 ± 0.05 abcde
FRI75498.75 ± 0.53 b93.40 ± 0.90 b7.77 ± 0.13 fg11.13 ± 0.03 c1.61 ± 0.09 ab0.84 ± 0.06 de
FRI7100100.04 ± 0.62 b93.82 ± 0.34 b8.00 ± 0.05 g11.15 ± 0.10 c1.83 ± 0.15 bc0.86 ± 0.09 e
PAS13102.88 ± 0.65 bcd95.73 ± 0.72 bc7.10 ± 0.05 cde11.39 ± 0.02 c1.69 ± 0.11 abc0.65 ± 0.03 abcde
PAS55100.55 ± 1.39 b93.61 ± 0.45 b6.70 ± 0.29 c11.38 ± 0.06 c1.79 ± 0.07 bc0.69 ± 0.07 abcde
PAS66100.77 ± 0.58 b93.17 ± 0.96 b7.07 ± 0.06 cde11.21 ± 0.06 c1.91 ± 0.10 bc0.64 ± 0.01 abcd
PAS92102.76 ± 0.97 bcd94.12 ± 2.12 b5.94 ± 0.27 b9.58 ± 0.17 a1.64 ± 0.11 abc0.59 ± 0.11 ab
PAS103102.13 ±2.74 bc92.25 ± 2.78 b5.83 ± 0.10 ab9.18 ± 0.38 a1.70 ± 0.18 abc0.63 ± 0.06 abc
PAS151102.32 ± 1.25 bc95.96 ± 0.99 bc6.15 ± 0.01 b10.36 ± 0.13 b1.88 ± 0.04 bc0.57 ± 0.01 ab
PAS173100.89 ± 0.61 b95.68 ± 0.70 bc7.04 ± 0.21 cde11.00 ± 0.34 bc1.95 ± 0.08 c0.71 ± 0.03 bcde
Values are represented by the average and standard deviation (n = 3). The difference between the averages was analyzed by one-way ANOVA and Tukey post hoc tests. Different letters indicate significant statistical differences p < 0.05 (Tukey’s test).
Table 3. Glucose and fructose residues at 48 h and concentrations of the main fermentation products at the end of sequential fermentations with S. bacillaris strains and S. cerevisiae EC1118 in Manzoni bianco.
48 hEnd of Fermentation
StrainsGlucose(g/L)Fructose(g/L)Glycerol(g/L)Ethanol(%v/v)Succinic Acid (g/L)Acetic Acid (g/L)
EC111859.49 ± 2.93 a75.70 ± 1.65 a5.01 ± 0.17 a12.40 ± 0.11 c2.42 ± 0.21 a0.65 ± 0.01 abc
FRI719103.18 ± 1.05 b86.19 ± 1.18 abcd8.21 ± 0.71 cd11.71 ± 0.96 bc2.30 ± 0.05 a0.70 ± 0.09 abc
FRI728103.54 ± 2.59 b91.76 ± 6.83 cd7.05 ± 0.49 bcd11.17 ± 0.26 abc2.33 ± 0.09 a0.64 ± 0.09 abc
FRI72997.21 ± 5.59 b87.04 ± 5.52 abcd6.86 ± 0.54 bcd10.97 ± 0.19 abc2.15 ± 0.09 a0.53 ± 0.03 a
FRI75199.55 ± 5.05 b88.71 ± 6.60 bcd7.23 ± 0.57 bcd10.92 ± 0.25 abc2.31 ± 0.02 a0.62 ± 0.08 abc
FRI75493.04 ± 4.53 b78.44 ± 4.16 ab7.70 ± 0.36 bcd10.89 ± 0.27 ab2.19 ± 0.07 a0.64 ± 0.09 abc
FRI710093.33 ± 5.95 b78.91 ± 5.59 abc8.31 ± 0.18 d10.71 ± 0.10 ab2.43 ± 0.16 a0.74 ± 0.12 abc
PAS1391.63 ± 1.37 b76.42 ± 0.85 ab8.17 ± 0.64 cd10.70 ± 0.45 ab2.42 ± 0.13 a0.83 ± 0.10 c
PAS5598.91 ± 3.70 b85.77 ± 3.48 abcd7.36 ± 0.58 bcd10.97 ± 0.28 abc2.26 ± 0.09 a0.60 ± 0.04 abc
PAS66101.57 ± 3.36 b94.82 ± 1.75 d6.67 ± 0.52 bc10.90 ± 0.34 ab2.21 ± 0.09 a0.54 ± 0.03 ab
PAS92100.87 ± 3.57 b94.11 ± 3.22 d6.42 ± 0.28 b10.23 ± 0.41 ab2.16 ± 0.06 a0.52 ± 0.02 a
PAS10399.40 ± 4.04 b93.45 ± 5.22 d7.31 ± 0.68 bcd10.93 ± 0.30 abc2.34 ± 0.17 a0.65 ± 0.12 abc
PAS15198.44 ± 5.91 b86.73 ± 5.43 abcd7.76 ± 0.44 bcd11.13 ± 0.21 abc2.09 ± 0.12 a0.60 ± 0.04 abc
PAS17399.64 ± 1.89 b91.98 ± 1.69 d6.85 ± 0.77 bcd10.20 ± 1.26 a2.41 ± 0.30 a0.76 ± 0.09 bc
Values are represented by the average and standard deviation (n = 3). The difference between the averages was analyzed by one-way ANOVA and Tukey post hoc tests. Different letters indicate significant statistical differences p < 0.05 (Tukey’s test).
Table 4. Total polysaccharides and their fractions by SEC-HPLC in Sauvignon blanc wine.
Polysaccharides * (mg/L)
StrainsTotalHigh MWMedium MWLow MW
EC1118135.54 ± 2.11 a14.53 ± 0.93 ab56.96 ± 1.54 a64.05 ± 0.78 a
FRI719219.86 ± 0.44 f13.74 ± 0.28 a88.05 ± 0.96 d118.06 ± 1.59 e
FRI728227.43 ± 2.20 g16.57 ± 0.74 abcde102.15 ± 1.30 fg108.71 ± 1.46 d
FRI729187.33 ± 3.59 bc17.53 ± 1.35 cdef81.33 ± 1.13 b88.47 ± 1.62 b
FRI751237.82 ± 1.18 h18.64 ± 0.66 defg103.30 ± 0.88 g115.89 ± 0.46 e
FRI754216.52 ± 2.64 f16.50 ± 1.41 abcde92.56 ± 1.58 e107.46 ± 1.38 d
FRI7100281.07 ± 0.11 i20.31 ± 0.30 fg111.84 ± 0.76 h148.91 ± 1.12 f
PAS13199.52 ± 2.91 d19.16 ± 0.09 efg82.33 ± 1.68 b98.02 ± 1.36 c
PAS55208.59 ± 2.17 e15.58 ± 1.23 abc86.69 ± 0.95 cd106.32 ± 1.20 d
PAS66183.76 ± 1.40 b16.18 ± 0.47 abcd81.17 ± 0.95 b86.41 ± 1.75 b
PAS92223.37 ± 0.68 fg17.08 ± 0.58 bcde92.04 ± 0.87 e114.25 ± 1.06 e
PAS103308.64 ± 1.90 j20.54 ± 0.97 g98.74 ± 1.00 f189.36 ± 1.85 g
PAS151193.23 ± 3.06 cd21.44 ± 1.23 g82.12 ± 0.96 b89.67 ± 1.89 b
PAS173192.08 ± 4.15 c19.06 ± 1.73 defg83.34 ± 1.29 bc89.68 ± 1.88 b
Total polysaccharides and their fractions (high molecular weight (MW) 1100–180 kDa; medium MW 180–40 kDa; low MW 40–7.5 kDa) released at the end of fermentation by S. cerevisiae control (EC1118) and 13 S. bacillaris strains in sequential fermentation with EC1118 in Sauvignon blanc wine. Values are represented by the average and standard deviation (n = 3). The difference between the averages was analyzed by one-way ANOVA and Tukey post hoc tests. Different letters indicate significant statistical differences p < 0.05 (Tukey’s test). * Measured by SEC-HPLC [59].
Table 5. Total polysaccharides and their fractions by SEC-HPLC in Pinot grigio wine.
Polysaccharides * (mg/L)
StrainsTotalHigh MWMedium MWLow MW
EC1118230.96 ± 3.90 b25.00 ± 1.72 de82.32 ± 1.22 a123.64 ± 2.94 b
FRI719265.94 ± 3.67 de23.07 ± 0.92 cd96.26 ± 1.11 bcd146.61 ± 3.35 ef
FRI728263.97 ± 0.83 de16.49 ± 1.02 a97.16 ± 0.87 bcd150.32 ± 0.96 f
FRI729271.07 ± 1.30 ef24.50 ± 1.20 de105.30 ± 1.09 ef141.27 ± 1.06 de
FRI751290.29 ± 5.32 h26.23 ± 1.12 de106.28 ± 3.73 fg157.78 ± 1.69 g
FRI754215.38 ± 5.08 a15.41 ± 1.21 a79.96 ± 2.76 a120.01 ± 2.14 b
FRI7100300.42 ± 2.52 i32.78 ± 1.61 f107.46 ± 1.12 fgh160.18 ± 1.83 g
PAS13279.29 ± 1.71 fg20.60 ± 1.24 bc100.64 ± 0.70 de158.05 ± 1.18 g
PAS55241.87 ± 6.10 c17.00 ± 1.56 a92.22 ± 2.63 b132.65 ± 2.47 c
PAS66255.86 ± 2.14 d17.82 ± 0.60 ab97.99 ± 1.02 cd140.05 ± 1.57 d
PAS92327.54 ± 0.64 j17.47 ± 1.00 ab111.49 ± 0.87 gh198.58 ± 1.17 h
PAS103351.21 ± 3.86 k27.02 ± 0.50 e112.72 ± 1.14 h211.47 ± 2.78 i
PAS151286.56 ± 2.01 gh18.41 ± 0.62 ab108.82 ± 1.39 fgh159.33 ± 1.05 g
PAS173224.52 ± 2.10 ab18.56 ± 0.83 ab92.96 ± 2.35 bc113.00 ± 1.31 a
Total polysaccharides and their fractions (high molecular weight (MW) 1100–180 kDa; medium MW 180–40 kDa; low MW 40–7.5 kDa) released at the end of fermentation by S. cerevisiae control (EC1118) and 13 S. bacillaris strains in sequential fermentation with EC1118 in Pinot grigio wine. Values are represented by the average and standard deviation (n = 3). The difference between the averages was analyzed by one-way ANOVA and Tukey post hoc tests. Different letters indicate significant statistical differences p < 0.05 (Tukey’s test). * Measured by SEC-HPLC [59].
Table 6. Total polysaccharides and their fractions by SEC-HPLC in Manzoni bianco wine.
Polysaccharides * (mg/L)
StrainsTotalHigh MWMedium MWLow MW
EC1118276.10 ± 2.63 bc59.50 ± 1.02 h124.52 ± 0.97 c92.08 ± 1.60 a
FRI719253.08 ± 4.24 a32.76 ± 2.62 ab97.45 ± 1.44 a122.87 ± 2.06 ef
FRI728324.71 ± 1.05 g29.12 ± 1.19 a176.32 ± 1.96 i119.27 ± 1.10 de
FRI729254.33 ± 0.21 a35.75 ± 1.80 bc117.18 ± 1.71 b101.39 ± 1.06 b
FRI751317.70 ± 1.85 f49.44 ± 1.39 g148.98 ± 1.39 f119.29 ± 0.80 de
FRI754322.49 ± 0.55 fg46.07 ± 1.79 efg157.20 ± 1.24 g119.22 ± 1.06 de
FRI7100350.04 ± 1.32 i41.70 ± 1.37 def150.38 ± 1.90 f157.95 ± 1.25 h
PAS13282.23 ± 2.98 d29.70 ± 2.30 a128.65 ± 1.03 cd123.88 ±1.40 f
PAS55333.45 ± 1.56 h31.1 ± 1.61 ab165.66 ± 1.23 h136.69 ± 0.47 g
PAS66298.90 ± 2.08 e40.12 ± 1.84 cd141.68 ± 1.32 e117.10 ± 1.72 d
PAS92302.00 ± 0.71 e39.29 ± 1.07 cd143.62 ± 0.90 e119.09 ± 1.46 de
PAS103280.14 ± 1.66 cd40.52 ± 1.51 cde116.57 ± 1.79 b123.04 ± 1.39 ef
PAS151274.11 ± 1.37 b46.82 ± 2.94 fg118.73 ± 1.04 b108.56 ± 1.92 c
PAS173303.00 ± 2.09 e47.21 ± 2.30 fg130.62 ± 0.91 d125.17 ± 1.52 f
Total polysaccharides and their fractions (high molecular weight (MW) 1100–180 kDa; medium MW 180–40 kDa; low MW 40–7.5 kDa) released at the end of fermentation by S. cerevisiae control (EC1118) and 13 S. bacillaris strains in sequential fermentation with EC1118 in Manzoni bianco wine. Values are represented by the average and standard deviation (n = 3). The difference between the averages was analyzed by one-way ANOVA and Tukey post hoc tests. Different letters indicate significant statistic differences p < 0.05 (Tukey’s test). * Measured by SEC-HPLC [59].
Table 7. Mannoproteins released by yeasts during fermentation in Sauvignon blanc, Pinot grigio, and Manzoni bianco wine.
Sauvignon Blanc
Yeast StrainsTotal
Mannoproteins (mg/L)
Medium MW
Mannoproteins (mg/L)
Low MW
Mannoproteins (mg/L)
EC111839.77 ± 1.87 a0.68 ± 0.33 a39.09 ± 1.69 a
FRI75161.09 ± 0.55 b8.63 ± 0.56 c52.46 ± 0.89 b
FRI710085.83 ± 1.94 d9.04 ± 0.16 c76.79 ± 1.78 e
PAS1376.39 ± 1.17 c4.60 ± 1.28 b71.79 ± 1.47 d
PAS5560.00 ± 2.18 b9.55 ± 1.04 c50.46 ± 1.78 b
PAS10372.70 ± 2.21 c14.34 ± 1.32 d58.37 ± 1.25 c
Pinot Grigio
Yeast StrainsTotal
Mannoproteins (mg/L)
Medium MW
Mannoproteins (mg/L)
Low MW
Mannoproteins (mg/L)
EC111842.29 ± 1.71 a1.57 ± 0.55 a40.72 ± 1.41 a
FRI75175.69 ± 2.43 d20.05 ± 1.40 d55.64 ± 1.20 c
FRI710074.33 ± 2.37 d16.35 ± 1.06 c57.98 ± 1.51 c
PAS1355.97 ± 2.12 b9.88 ± 0.65 b46.09 ± 1.76 b
PAS5566.07 ± 2.59 c16.58 ± 1.17 c49.48 ± 1.45 b
PAS10393.24 ± 2.14 e30.26 ± 0.48 e62.98 ± 1.94 d
Manzoni Bianco
Yeast StrainsTotal
Mannoproteins (mg/L)
Medium MW
Mannoproteins (mg/L)
Low MW
Mannoproteins (mg/L)
EC111831.57 ± 0.04 a0.16 ± 0.05 a31.44 ± 0.07 a
FRI75196.46 ± 1.04 d25.03 ± 1.04 e71.42 ± 1.95 d
FRI710094.21 ± 1.35 d7.84 ± 0.55 c86.37 ± 1.08 e
PAS1398.51 ± 2.97 d15.52 ± 1.37 d82.90 ± 1.61 e
PAS5548.11 ± 2.05 b3.08 ± 0.70 b45.02 ± 1.89 b
PAS10365.43 ± 2.57 c9.33 ± 1.01 c56.09 ± 1.56 c
Total mannoproteins and fractions (medium molecular weight (MW) 180–40 kDa; low MW 40–7.5 kDa) released by S. cerevisiae control (EC1118) and 13 S. bacillaris strains in sequential fermentation with EC1118. Values are represented by the average and standard deviation (n = 3). The difference between the averages was analyzed by one-way ANOVA and Tukey post hoc tests. Different letters indicate statistically significant differences p < 0.05 (Tukey’s test).
Table 8. Pearson correlation between Turbidity and the other variables in the three wines.
VariablesSBPGMB
Turbidity111
TLP−0.7510.3310.097
Chitinase−0.7650.096−0.586
HMW-P−0.5600.3840.568
MMW-P−0.4740.262−0.292
LMW-P−0.6810.618−0.770
MMW-M−0.7610.351−0.477
LMW-M−0.4220.350−0.692
Values in bold are different from 0 with a significance level of alpha = 0.05.
Publisher’s Note: MDPI stays neutral with regard to jurisdictional claims in published maps and institutional affiliations.

