Article

Evaluation of the Biocontrol Potential of a Commercial Yeast Starter against Fuel-Ethanol Fermentation Contaminants

by
Patrícia Branco
1,2,*,
Mário Diniz
3,4 and
Helena Albergaria
1,*
1
Unit of Bioenergy and Biorefinery, LNEG, Estrada do Paço do Lumiar, 22, 1649-038 Lisboa, Portugal
2
Linking Landscape, Environment, Agriculture and Food (LEAF), Associated Laboratory TERRA, Instituto Superior de Agronomia, University of Lisbon, Tapada da Ajuda, 1349-017 Lisboa, Portugal
3
UCIBIO—Applied Molecular Biosciences Unit, Department of Chemistry, School of Science and Technology, NOVA University Lisbon, 2819-516 Caparica, Portugal
4
Associate Laboratory i4HB—Institute for Health and Bioeconomy, School of Science and Technology, NOVA University Lisbon, 2819-516 Caparica, Portugal
*
Authors to whom correspondence should be addressed.
Fermentation 2022, 8(5), 233; https://doi.org/10.3390/fermentation8050233
Submission received: 19 April 2022 / Revised: 12 May 2022 / Accepted: 15 May 2022 / Published: 17 May 2022
(This article belongs to the Section Industrial Fermentation)

Abstract

:
Lactic acid bacteria (LAB) and Brettanomyces bruxellensis are the main contaminants of bioethanol fermentations. Those contaminations affect Saccharomyces cerevisiae performance and reduce ethanol yields and productivity, leading to important economic losses. Currently, chemical treatments such as acid washing and/or antibiotics are used to control those contaminants. However, these control measures carry environmental risks, and more environmentally friendly methods are required. Several S. cerevisiae wine strains were found to secrete antimicrobial peptides (AMPs) during alcoholic fermentation that are active against LAB and B. bruxellensis strains. Thus, in the present study, we investigated if the fuel-ethanol commercial starter S. cerevisiae Ethanol Red (ER) also secretes those AMPs and evaluated its biocontrol potential by performing alcoholic fermentations with mixed-cultures of ER and B. bruxellensis strains and growth assays of LAB in ER pre-fermented supernatants. Results showed that all B. bruxellensis strains were significantly inhibited by the presence of ER, although LAB strains were less sensitive to ER fermentation metabolites. Peptides secreted by ER during alcoholic fermentation were purified by gel-filtration chromatography, and a bioactive fraction was analyzed by ELISA and mass spectrometry. Results confirmed that ER secretes the AMPs previously identified. That bioactive fraction was used to determine minimal inhibitory concentrations (MICs) against several LAB and B. bruxellensis strains. MICs of 1–2 mg/mL were found for B. bruxellensis strains and above 2 mg/mL for LAB. Our study demonstrates that the AMPs secreted by ER can be used as a natural preservative in fuel-ethanol fermentations.

1. Introduction

Bioethanol is a renewable energy source that can replace fossil fuels, especially in the transportation sector, where it can be used in alternative or blended with gasoline, decreasing negative environmental impacts and greenhouse gas (GHG) emissions [1,2]. Presently (2021), the two main world producers of bioethanol are the United States of America (55%) and Brazil (27%), followed by the European Union (EU), which contributes only 5% to the global bioethanol production and the rest of the world with 13% [3].
Fuel-ethanol fermentations are carried out by selected Saccharomyces cerevisiae strains which are used as starters for a faster and safer fermentation process. However, for economic reasons, bioethanol fermentations are carried out under non-aseptic conditions, which favor the development of microbial contaminants [4]. Therefore, microbial contaminations are a persistent problem in any fuel-ethanol fermentation system, leading to important economic losses which can increase the final cost of the product by 20–30% [5,6]. The main contaminants of industrial bioethanol fermentation are lactic acid bacteria (LAB) and wild yeasts such as Brettanomyces bruxellensis, which survive under the harsh environmental conditions of alcoholic fermentation (i.e., high levels of ethanol and organic acids, low oxygen availability, nutritional limitations, etc.) [4,7]. The proliferation of microbial contaminants in fuel-ethanol fermentations reduces ethanol yields and productivities, leading to significant economic losses for the industry [6,7].
The yeast contaminants most frequently found in fuel-ethanol fermentations belong to the genera Candida, Pichia, Zygosaccharomyces, and Brettanomyces [8,9]. Amongst these yeast contaminants, Brettanomyces bruxellensis is the most dangerous since this species is highly fermentative and resistant to ethanol [4,8,9,10] but has a much slower fermentation rate than S. cerevisiae. Thus, its proliferation in fuel-ethanol fermentations significantly reduces ethanol productivity [7]. The most common LAB found in fuel-ethanol fermentations comprises species from the genera Lactobacilli, Leuconostoc, and Pediococcus [8,11,12]. The proliferation of LAB may interfere with yeast metabolism due to the accumulation of by-products in the medium, such as lactic and acetic acids [13]. Moreover, they compete with fermentative yeasts for available sugars and nutrients, thus causing a decrease in ethanol levels and yields [14,15].
In order to control microbial contaminations, different treatments are applied by the fuel-ethanol industry. Recycling yeast biomass to reuse in a new batch fermentation is a common procedure in bioethanol production processes, and its washing with diluted sulphuric acid before and after fermentation is an efficient measure to control LAB growth [16]. However, acid washing of yeast biomass is not very effective in controlling the development of some yeast contaminants such as B. bruxellensis and decreases the fermentation performance of S. cerevisiae [17]. Moreover, acid washing treatments generate large amounts of wastewater with high levels of sulfates that cannot be directly delivered into the environment [18,19]. Other chemical agents, such as ammonia, urea, and hydrogen peroxide, can also be used to control microbial contaminants in fuel-ethanol fermentations [20,21]. Polyhexamethyl biguanide (PHMB), an antiseptic polymer with a broad spectrum of action against Gram-negative and Gram-positive bacteria, as well as fungi [22,23,24], has also been proposed to control B. bruxellensis growth in fuel-ethanol fermentations [25]. This antiseptic has been shown to specifically kill B. bruxellensis without being detrimental to S. cerevisiae [25]. However, PHMB, according to the European Commission regulation (EU2019/831), has an extremely high risk of adverse health effects to the public (e.g., fatal if inhaled, causes damage to organs through prolonged or repeated exposure) and to the environment (i.e., high toxicity to aquatic life). The use of all the above-mentioned chemical treatments, even if effective in controlling microbial contaminations in fuel-ethanol processes, poses environmental risks due to their general toxicity.
Although expensive due to the large amounts required, the use of antibiotics such as penicillin G, streptomycin, tetracycline, and virginiamycin in the fuel-ethanol industry to eliminate bacterial contamination has also been reported [26,27,28]. Moreover, using antibiotics in large amounts raises concerns regarding wastewater residues and the rise of antibiotic multi-resistant bacteria [29]. Thus, it is crucial to find more environmentally friendly preservation strategies to eliminate microbial contaminants in fuel-ethanol fermentations.
Several natural antimicrobial compounds, effective against foodborne pathogens and food contaminants, may be considered for implementation in the fuel-ethanol industry as safer and more environmentally friendly alternatives to the control measures currently applied in this industry. These natural compounds include chitosan, bacteriocins, plant extracts, and antimicrobial peptides (AMPs). Chitosan has been reported as being active against Pediococcus sp. and Lactobacillus plantarum (now designated as Lactiplantibacillus plantarum) strains isolated from beer production processes [30]. Bacteriocins such as nisin are active against Leuconostoc and Pediococcus species isolated from wine [31]. Plant extracts, e.g., lemon extract, have also been shown to inhibit the growth of some LAB such as Oenococcus oeni and L. plantarum in wine fermentations [32]. Likewise, Garcinia kola, which is used as a substitute for hops in brewing lager beer, was found to be active against beer spoilage L. delbrueckii subsp. delbrueckii [33].
Over the last years, some AMPs with potential applications in food, agriculture, and medicine have been reported, e.g., nisin produced by Lactococcus lactis subsp. lactis. with bactericidal activity against foodborne pathogens such as Listeria monocytogenes and Staphylococcus aureus [34]. What is more, in previous work [35,36,37,38], we found that several S. cerevisiae wine strains secrete AMPs during alcoholic fermentations that are active against O. oeni and wine-related yeasts such as B. bruxellensis. Those AMPs were first isolated from S. cerevisiae fermentation supernatants using chromatographic techniques (i.e., gel filtration and ion-exchange chromatography) and then identified by mass spectrometry [37]. Two bioactive peptides, AMP1 and AMP2/3, were identified, and their amino acid sequences ISWYDNEYGYSAR (AMP1) and VSWYDNEYGYSTR (AMP2/3) showed that they correspond to fragments of the glycolytic enzyme glyceraldehyde 3-phosphate dehydrogenase [37]. Peptides chemically synthesized with the same aa sequences as the natural AMPs were obtained and showed to exert an antimicrobial effect against Hanseniaspora guilliermondii and B. bruxellensis strains [38].
Therefore, the aim of the present study was to investigate if the fuel-ethanol commercial starter S. cerevisiae Ethanol Red secretes the previously identified AMPs and to evaluate its antagonistic effect against the most common fuel-ethanol microbial contaminants, i.e., B. bruxellensis and LAB.

2. Materials and Methods

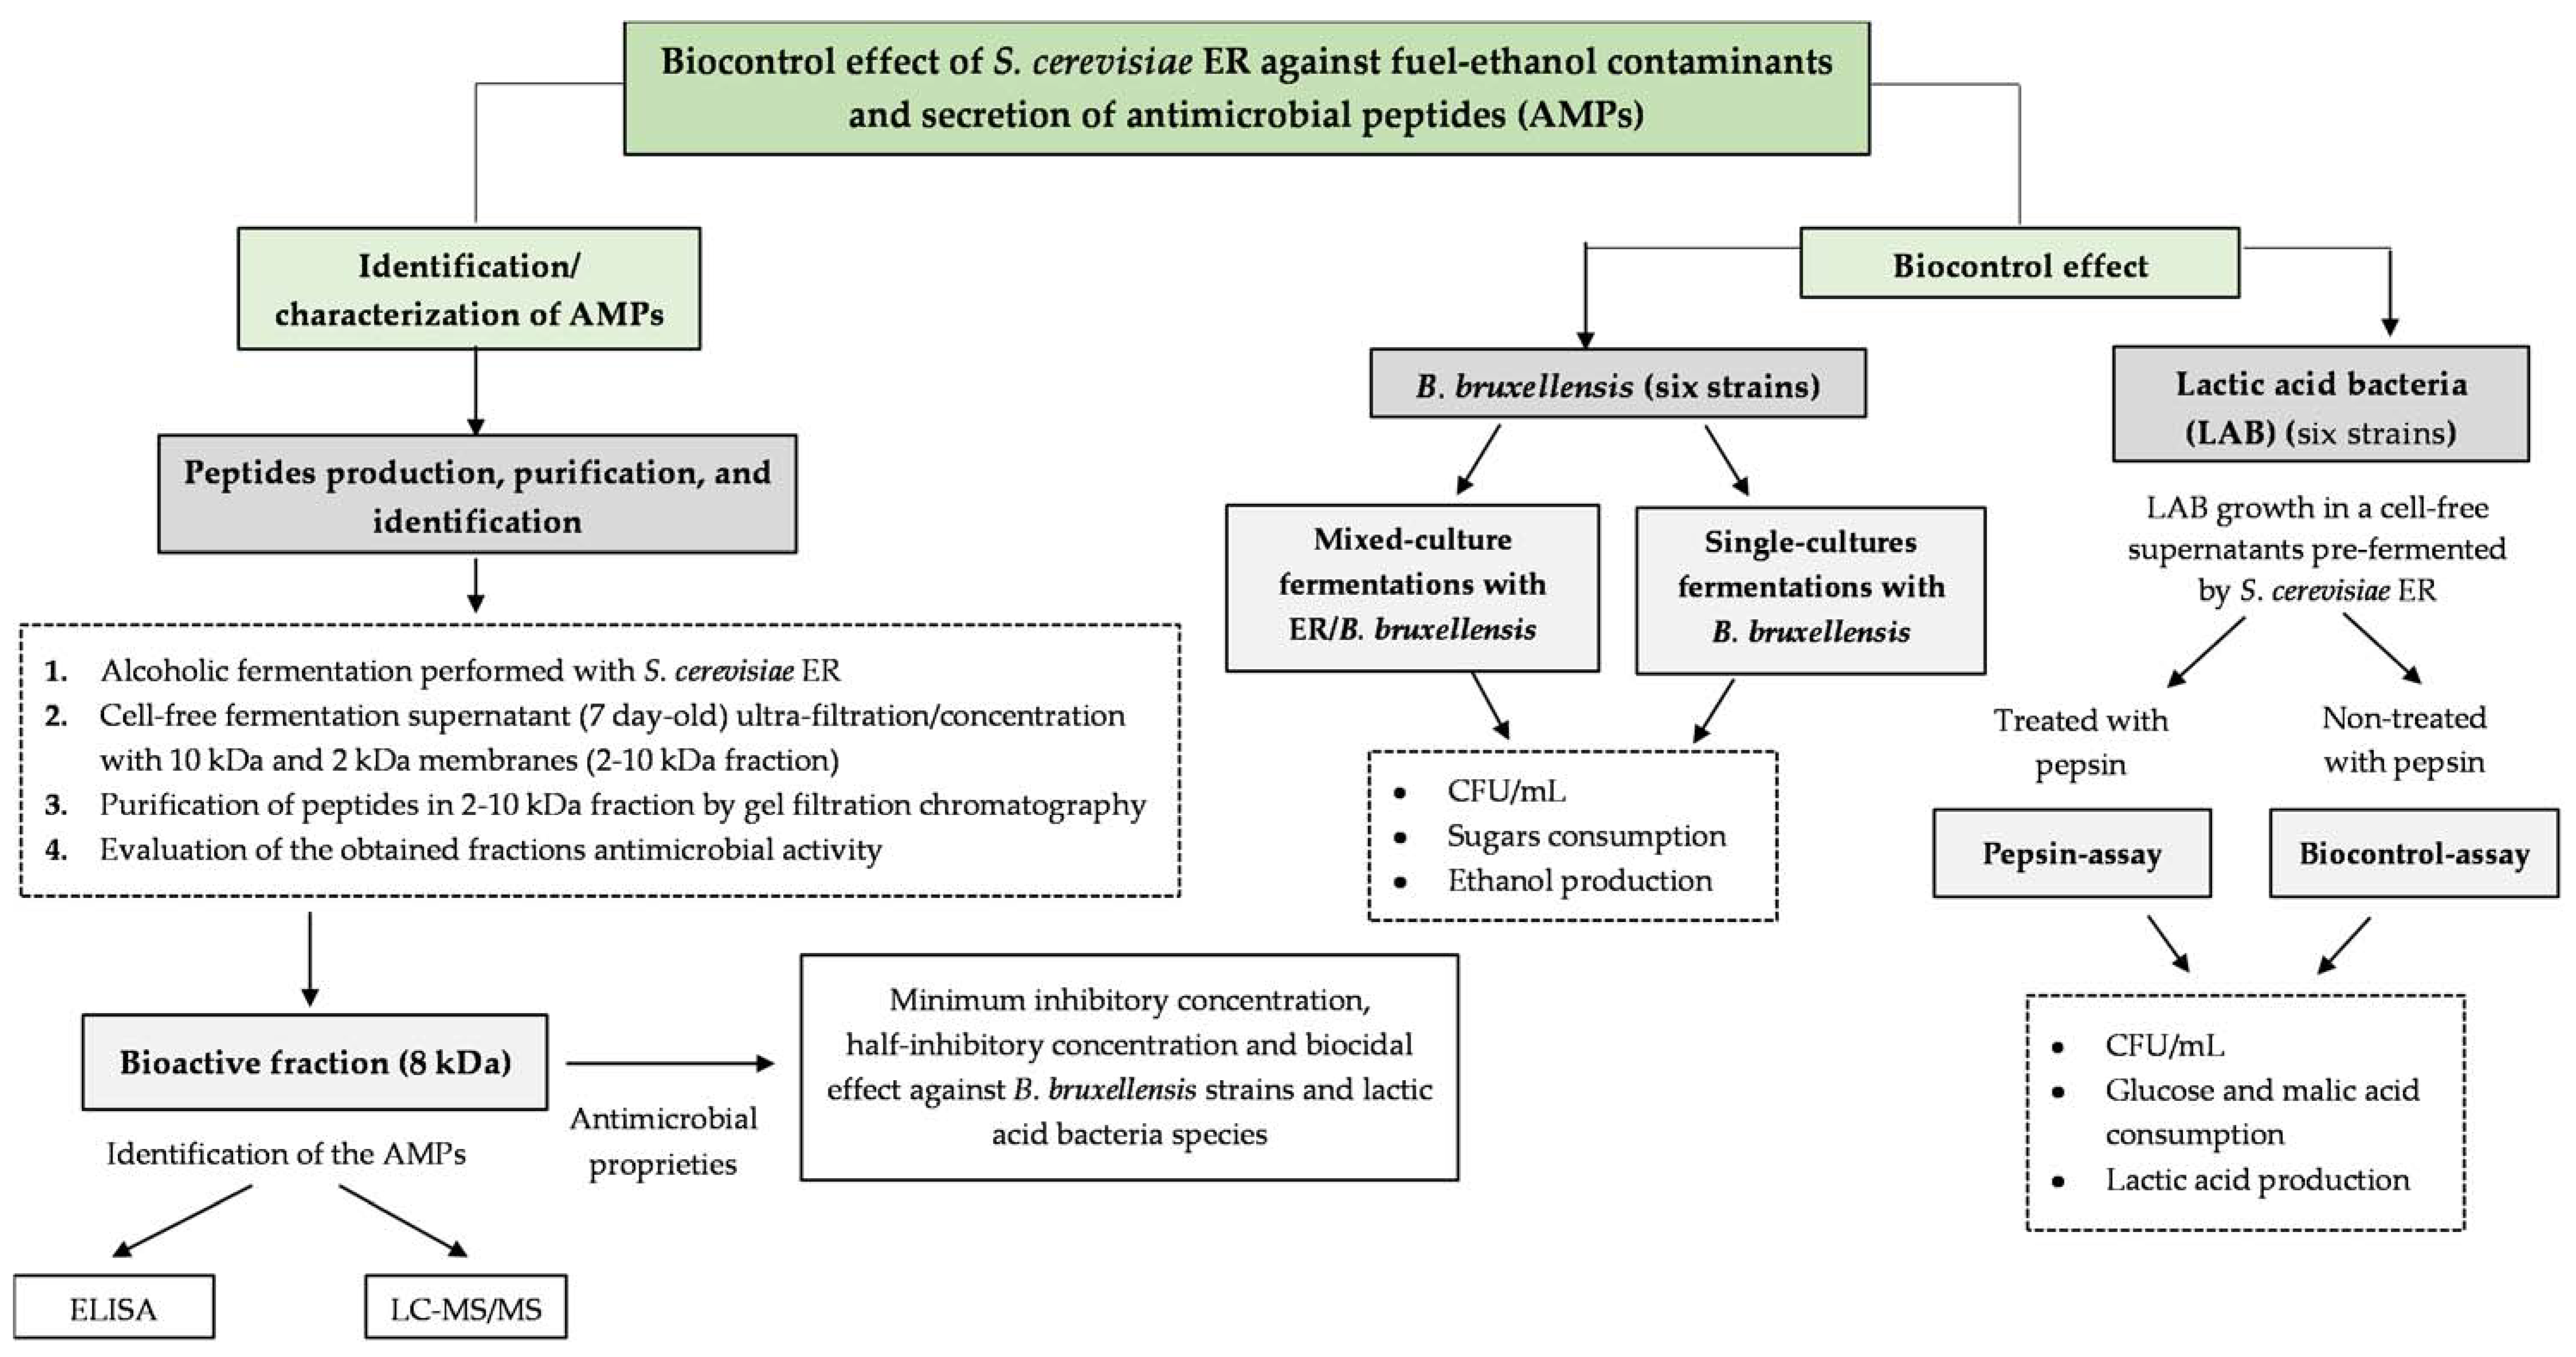
The experimental approach used in the present study is summarized in Flowchart 1.

2.1. Strains and Inoculums Preparation
In this work, we used the following microbial strains: Saccharomyces cerevisiae Ethanol Red (ER), a commercial fuel-ethanol starter obtained from the Lesaffre Advanced Fermentations company (France); Hanseniaspora guilliermondii NCYC 2380 (National Collection of Yeast Cultures, Norwich, United Kingdom); Brettanomyces bruxellensis ISA 1649, ISA 1700, ISA 1791, ISA 2104, ISA 2116 and ISA 2211; Levilactobacillus brevis ISA 4385; Lentilactobacillus hilgardii ISA 4387; Lactiplantibacillus plantarum ISA 4395; Leuconostoc mesenteroides subsp. Cremoris ISA 4383; Pediococcus parvulus ISA 4401; Pediococcus pentosaceus ISA 4379. Strains of B. bruxellensis and Lactic Acid Bacteria (LAB) were all obtained from the culture collection of Instituto Superior de Agronomia (ISA), Portugal. A list of all LAB and yeast strains is presented in Table S1 (supplementary data).
Fermentation 08 00233 i001
Flowchart 1 Main experiments carried out in the present study.
S. cerevisiae ER was obtained in the form of active dry yeast (ADY) and its rehydration was performed as described in Livingstone and Victor [39]. Briefly, 0.33 g of ADY was added to 5.0 mL of Yeast Extract Peptone Dextrose (YEPD) medium (20.0 g/L of glucose, 20.0 g/L of peptone, 10.0 g/L yeast extract), pre-warmed at 37 °C, left static for 30 min and then gently stirred. Thereafter, 3.8 mL of this yeast suspension was used to inoculate 150 mL of YEPD medium that was incubated at 30 °C, under slow agitation (80 rpm), for 48 h. A total of 100 µL of this culture was then spread onto a YEPD-agar plate and incubated at 30 °C in a vertical incubator (Infors, Anjou, QC Canada) for 48 h. Afterward, S. cerevisiae ER colonies were transferred to YEPD-agar slants (20.0 g/L of glucose, 20.0 g/L of peptone, 10.0 g/L yeast extract, 20.0 g/L agar) and incubated again at 30 °C for 48 h. Finally, those YEPD-agar slants were stored at 4 °C. Likewise, all B. bruxellensis strains were maintained on YEPD-agar slants, containing 5.0 g/L of calcium carbonate, stored at 4 °C. Yeasts inoculums were prepared by transferring the biomass of one YEPD-agar slant (pre-grown at 30 °C for 48 h) to 100 mL flasks containing 50 mL of YEPD medium and incubating the flasks at 30 °C, under 150 rpm of agitation, for 16 h (for B. bruxellensis strains incubation took 48–72 h). All LAB species were maintained in MRS (Man, Rogosa, and Sharpe) broth (Merck, Darmstadt, Germany) and stored at 4 °C. LAB inoculums were prepared by transferring 1 mL of bacterium suspension (pre-grown at 30 °C for 72 h) to 10 mL tubes containing 9 mL of MRS broth and then incubating the tubes at 30 °C without agitation for 72 h. All media were sterilized by autoclavation at 120 °C for 20 min.

2.2. Alcoholic Fermentations Performed with Single- and Mixed-Cultures of S. cerevisiae ER and B. bruxellensis

Alcoholic fermentations were performed with mixed cultures of S. cerevisiae ER with each of the above-mentioned B. bruxellensis strains (i.e., ISA 1649, ISA 1700, ISA 1791, ISA 2104, ISA 2116, and ISA 2211) and with single-cultures of the same B. bruxellensis strains. Mixed- and single-culture fermentations were carried out in 250 mL flasks containing 125 mL of synthetic must (SM), containing 110 g/L of glucose and 110 g/L of fructose, prepared as described in Pérez-Nevado et al. [40] with some modifications (i.e., final pH was 4.5 and malic acid concentration was 2.5 g/L). In both mixed- and single-culture fermentations, the medium was inoculated with 5 × 10⁴ cells/mL of each yeast strain and incubated at 30 °C, under gentle agitation (80 rpm). All alcoholic fermentations were performed in duplicates, and daily samples were taken to determine yeast culturability, as well as sugar consumption and ethanol production. Yeast culturability was determined by Colony Forming Units (CFU) counts using the classical plating method. Briefly, 100 μL of culture samples were spread onto YEPD-agar plates, after appropriate decimal dilution, and incubated at 30 °C in a vertical incubator (Infors, Anjou, QC Canada) for 2–6 days. In mixed cultures, CFU counts of B. bruxellensis were obtained on YEPD-agar plates with 0.01% of cycloheximide and CFU counts of S. cerevisiae as the difference between total CFU counts on YEPD-agar plates and CFU counts of B. bruxellensis.

2.3. Lactic Acid Bacteria (LAB) Growth in a Cell-Free Supernatant Pre-Fermented by S. cerevisiae ER

Growth assays were performed with each of the LAB species mentioned in Section 2.1 (i.e., L. brevis ISA 4385, L. hilgardii ISA 4387 and L. plantarum ISA 4395, L. mesenteroides subsp. cremoris ISA 4383, P. parvulus ISA 4401 and P. pentosaceus ISA 4379) in a cell-free supernatant pre-fermented by S. cerevisiae ER. This supernatant was obtained from two alcoholic fermentation carried out in 1500 mL of SM in 2 L flasks that were inoculated with 105 CFU/mL of S. cerevisiae ER and incubated at 25 °C and 80 rpm for 7 days. After that time, fermentation broths were filtrated by 0.22 µm Millipore membranes (Merck, Algés, Portugal), and the cell-free supernatant divided into two aliquots of 1500 mL each. One of the aliquots was treated with pepsin to inactivate the peptides secreted by S. cerevisiae ER, as reported by Albergaria et al. [35], and used as negative control of the AMPs effect. The treatment consisted in adding pepsin to 1500 mL of the cell-free pre-fermented supernatant to a final concentration of 2 g/L and adjusting the pH to optimal pepsin activity, i.e., pH = 2.0. Flasks containing 1500 mL of the pre-fermented cell-free supernatant, with and without pepsin, were incubated at 37 °C for 72 h without agitation. After that time, the pH of the media was readjusted to 4.5, and the two flasks were autoclaved (121 °C for 15 min) for pepsin inactivation. Both autoclaved media were then supplemented with 5.0 g/L of yeast extract, 10.0 g/L of glucose, 2.5 g/L of malic acid, and 30.0 g/L of ethanol. Then, 125 mL of each cell-free supernatant, i.e., treated (pepsin assay) and non-treated with pepsin (biocontrol assay), were inoculated with 105 cells/mL of each of the six LAB species. All growth assays were performed in duplicates, and daily samples were taken to determine cell growth, sugars and malic acid consumption, as well as lactic acid production. Cell growth of LAB was determined by CFU counts on MRS-agar plates using the classical plating method. Briefly, 100 μL of culture sample were spread onto MRS-agar plates, after appropriate decimal dilution, and incubated at 30 °C in a vertical incubator (Infors, Anjou, Canada) for 3–6 days.

2.4. Determination of Sugars, Ethanol, Malic Acid, and Lactic Acid by High-Performance Liquid Chromatography (HPLC)

Glucose, fructose, and ethanol concentrations in mixed- and single-culture fermentations performed with S. cerevisiae ER and B. bruxellensis, as well as glucose, ethanol, malic acid, and lactic acid concentrations in growth assays performed with LAB species, were quantified in an HPLC system (Waters, Dublin, Ireland) equipped with a refractive index detector (2414 Waters). Daily samples were first filtered through 0.22 µm Millipore membranes and then injected in a Rezex™ ROA Organic Acid H+ (8%) column (300 mm × 7.8 mm, Phenomenex, Torrance, CA, USA) and eluted with sulfuric acid (5 mmol/L) at 65 °C with a flow rate of 0.5 mL/min. Each biological sample was analyzed in triplicate.

2.5. Statistical Analysis of Results

Glucose, malic, and lactic acids values (Section 3.1 and Table S1), ELISA results (Figure S2), and biocidal effect results (Figures S3 and S4) were statistically analyzed using first the Levene’s test (to check equal variances) and, whenever variances were equal, the one-way ANOVA method was applied. Values were considered significantly different when p-values were lower than 0.05, as described by Fry [41].

2.6. Identification of Peptides Secreted by S. cerevisiae ER during Alcoholic Fermentation

2.6.1. Purification of Peptides by Gel-Filtration Chromatography and Determination of Their Inhibitory Effect

Peptides secreted by S. cerevisiae ER were purified from a 7-day-old fermentation supernatant performed as described in Section 2.3. The cell-free supernatant (filtrated by 0.22 μm Millipore membranes) was first ultra-filtrated through centrifugal filter units (Vivaspin 15R, Sartorius, Göttingen, Germany) equipped with 10 kDa membranes, and then the permeate was concentrated (40-fold) using the same system equipped with 2 kDa membranes. This 2–10 kDa concentrated fraction was then fractionated by gel filtration chromatography using a Superdex-Peptides 10/300 GL column (GE Healthcare, London, UK) coupled to an HPLC system equipped with a UV detector (Merck Hitachi, Darmstadt, Germany). A total of 200 µL of fraction were eluted with ammonium acetate 0.1 M at a flow rate of 0.7 mL/min, and fraction 8 kDa indicated in Figure 1 was collected into a 2 mL Eppendorf, freeze-dried and lyophilized.
In order to confirm its antimicrobial activity, the lyophilized fraction 8 kDa was resuspended in YEPD medium (pH 4.5) containing 30 g/L of ethanol and growth inhibitory assays were performed against the sensitive yeast H. guilliermondii NCYC 2380. Inhibitory assays were carried out in a 96-wells microplate containing 300 μL of the above-mentioned medium, without the peptidic fraction (control assay) and with the peptidic fraction (inhibitory assay) at a final total protein concentration of 1 mg/mL, inoculated with 105 cells/mL of the sensitive yeast. The microplate was incubated in a Multiskan-GO spectrophotometer (Thermo-Fisher Scientific Inc., Waltham, MA, USA) at 30 °C under strong agitation. Cell growth was followed by optical density measurements (at 590 nm) in the Multiskan-GO spectrophotometer (Thermo-Fisher Scientific Inc., Waltham, MA, USA) and by enumeration of CFU. For CFU counts, the method described in Branco et al. [42] was applied. Briefly, 10 µL of samples were taken, and after appropriate dilution, 100 µL were plated onto YEPD-agar plates, as described in Section 2.2. Whenever no colonies were detected in the agar plates inoculated with diluted samples, 100 µL of sample were directly plated onto YEPD-agar plates. Thus, the detection limit of the CFU method for results presented in Section 3.3 was 10 CFU/mL.

2.6.2. AMPs Identification by Indirect Enzyme-Linked Immunosorbent Assay (ELISA)

Since the gel-filtration fraction 8 kDa (indicated in Figure 1) demonstrated antimicrobial activity, those bioactive peptides were analyzed by indirect ELISA to check if they matched with those previously identified by Branco et al. [37]. Specific polyclonal antibodies raised against the two AMPs that compose saccharomycin (i.e., AMP1 and AMP2/3 derived from the isoenzymes GAPDH1 and GAPDH2/3, respectively) were obtained from GenScript Inc. Company (GenScript HK Limited, Hong Kong). The procedure described in Branco et al. [38] was applied with some modifications. Briefly, 100 μL of PBS (blank) and 100 μL of the gel-filtration fraction 8 kDa were used for coating each well of the 96-well microplate MICROLON high binding (Greiner Bio-One, Essen, Germany). Then, the 96-well microplate was incubated overnight at 4 °C. Afterward, 100 μL of urea 6 M was added to samples to denature proteins and improve their detection by indirect ELISA, as previously described by Hnasko et al. [43]. The microplate was thereafter washed 4 times using a PBS-Tween washing solution (0.05% Tween 20 in 0.01 M PBS). Samples were blocked for 2 h at room temperature by adding 200 μL of blocking solution containing bovine serum albumin (BSA) 1% w/v in PBS and washed 4 times with washing solution. Next, 100 μL of the primary polyclonal antibody specific to the GAPDH-derived AMPs (GenScript HK Limited, Hong Kong), diluted in 1% w/v BSA to a final concentration of 10 μg/mL, was added to each well and incubated for 2 h at 37 °C. The unbound material was removed by washing the microplate 4 times with PBS-Tween solution. Thereafter, 100 μL of a secondary antibody (anti-rabbit IgG-fab specific, alkaline phosphatase conjugate, Sigma-Aldrich, St. Louis, MO, USA) diluted in 1% w/v BSA to 1.0 μg/mL was added to each well, followed by 2 h of incubation at 37 °C. Subsequently, the microplate was washed 4 times with PBS-Tween solution, followed by the addition of 100 μL/well of alkaline phosphatase substrate (100 mM Tris-HCL, 100 mM Nacl, 5 mM MgCl2, and 1 mg/mL p-Nitrophenylphosphate) to the microplate and incubated for 10 to 30 min at room temperature in the dark. The enzyme-substrate reaction was stopped by adding 100 μL of 3 N NaOH to each well. The optical density (OD) was measured at 405 nm using a microplate reader (Bio-Rad, Hercules, CA, USA). Three replicates of 100 μL were taken from each diluted standard and transferred to a 96-well microplate MICROLON high binding (Greiner Bio-One, Essen, Germany) and analyzed as above-mentioned. All samples were analyzed in triplicate.

2.6.3. Liquid Chromatography with Tandem Mass Spectrometry (LC-MS/MS) Analysis

The gel-filtration fraction 8 kDa (shown in Figure 1) was subjected to a buffer exchange procedure, and LC-MS/MS analysis was performed on an Exion-LC AD UPLC system coupled to X500B QTOF with the TwinSpray ion source (Sciex, Framingham, MA, USA). Peptides were separated through reversed-phase chromatography (RP-LC) using an XBridge BEH C18, 2.5 µm 2.1 × 150 mm (Waters, Milford, MA, USA) at 200 μL/min. Water with 0.1% (v/v) formic acid (solvent A) and acetonitrile with 0.1% (v/v) formic acid (solvent B) were used. The gradient was as follows: 0–1 min, 2% B; 1–16 min, 2–40% B; 16–18 min, 40–95% B; 18–20 min, 95% B; 20–22 min, 95–2% B; 22–25 min, 2% B. The column oven was maintained at 40 °C. Peptide samples were analyzed by information-dependent acquisition (IDA) method. The source parameters were set as follows: 50 GS1, 50 GS2, 35 CUR, 5.5 keV ISVF, and 450 °C IHT. The acquisition method was set with a TOF-MS survey scan of 350–2000 m/z. The 12 most intense precursors were selected for subsequent fragmentation, and the MS/MS spectra were acquired for 100 msec. Rolling collision energy was used together with dynamic background substation. The obtained spectra were processed and analyzed using ProteinPilot™ software with the Paragon search engine (version 5.0, Sciex). A reviewed database (6721 entries, accessed on 9 December 2021) containing the sequences of the proteins from S. cerevisiae was used. The following search parameters were set: Cys alkylation—None; digestion—None; TripleTOF 6600, as the Instrument; ID focus as biological modifications; search effort as thorough; and FDR analysis. Only proteins with Unused Protein Score above 1.3 and 95% confidence were considered for peptide identification. Mass spectrometry data were generated by the UniMS—Mass Spectrometry Unit, iBET/ITQB, Oeiras, Portugal.

2.7. Determination of Minimum Inhibitory Concentration (MIC), Half-Inhibitory Concentration (IC50), and Biocidal Effect of the AMPs Secreted by S. cerevisiae ER

Minimal inhibitory concentration (MIC) and half inhibitory concentration (IC50) of the AMPs secreted by S. cerevisiae ER were determined against six B. bruxellensis strains (i.e., strains ISA 1649, ISA 1700, ISA 1791, ISA 2104, ISA 2116 and ISA 2211) and six LAB i.e., L. brevis ISA 4385, L. hilgardii ISA 4387 and L. plantarum ISA 4395, L. mesenteroides subsp. Cremoris ISA 4383, P. parvulus ISA 4401 and P. pentosaceus ISA 4379). The gel-filtration lyophilized fraction 8 kDa (Figure 1) obtained in Section 2.6 was resuspended in YEPD medium (with 30 g/L of ethanol and pH 4.5). Growth inhibitory assays were performed, as described in Section 2.4 with some modifications, for each of the above-mentioned B. bruxellensis and LAB strains. Briefly, 150 μL of YEPD medium (for B. bruxellensis strains), or MRS broth medium (for LAB), without (control assay) and with addition of fraction 8 kDa at final protein concentration of 0.5, 1.0, 1.5 and 2.0 mg/mL (inhibitory assay) were added to a 96-well microplate and inoculated with 105 cells/mL of each strain. The 96-well microplate was incubated in a Multiskan-GO spectrophotometer (Thermo-Fisher Scientific Inc., Waltham, USA) at 30 °C, under strong agitation for B. bruxellensis strains, and without agitation for LAB species. Cell growth was followed by optical density measurements (at 590 nm) in the Multiskan-GO spectrophotometer and by enumeration of CFU. For CFU counts, the method described in Section 2.6.1 was applied. The MIC was defined as the minimum concentration of fraction 8 kDa that completely inhibited the growth of the tested microorganisms. The IC50 was defined as the concentration of fraction 8 kDa that induced a growth reduction of 50% by comparison with growth in the respective control assay, when cells reached the stationary phase. The biocidal effect of fraction 8 kDa against B. bruxellensis and LAB strains was determined as the number of logarithms (Log) that cell density (CFU/mL) decreased in the inhibitory assays, from an initial value of 105 CFU/mL to a final value determined when the respective control assay reached the stationary growth phase.

3. Results and Discussion

In industrial bioethanol processes, growth media (e.g., sugar cane, beet molasses, etc.) are inoculated with selected yeast starters such as Saccharomyces cerevisiae Ethanol Red (ER) at high cell densities to allow fast and reliable fermentations. However, the proliferation of microbial contaminants, mainly lactic acid bacteria (LAB) and wild yeasts such as Brettanomyces bruxellensis are unavoidable [4,7]. Thus, controlled bioethanol fermentations should not present populations of microbial contaminants in the musts above 105 CFU/mL since that may result in significant losses of ethanol yields and, in extreme cases, lead to loss of economic viability of the production process [7]. In the present study, we evaluated the biocontrol effect of ER against the proliferation of several B. bruxellensis strains since this yeast species are the most dangerous fuel-ethanol contaminant [7], and LAB species are usually present in fuel-ethanol fermentations [8].

3.1. Biocontrol Potential of Saccharomyces Cerevisiae Ethanol Red (ER) against Brettanomyces bruxellensis Strains and LAB

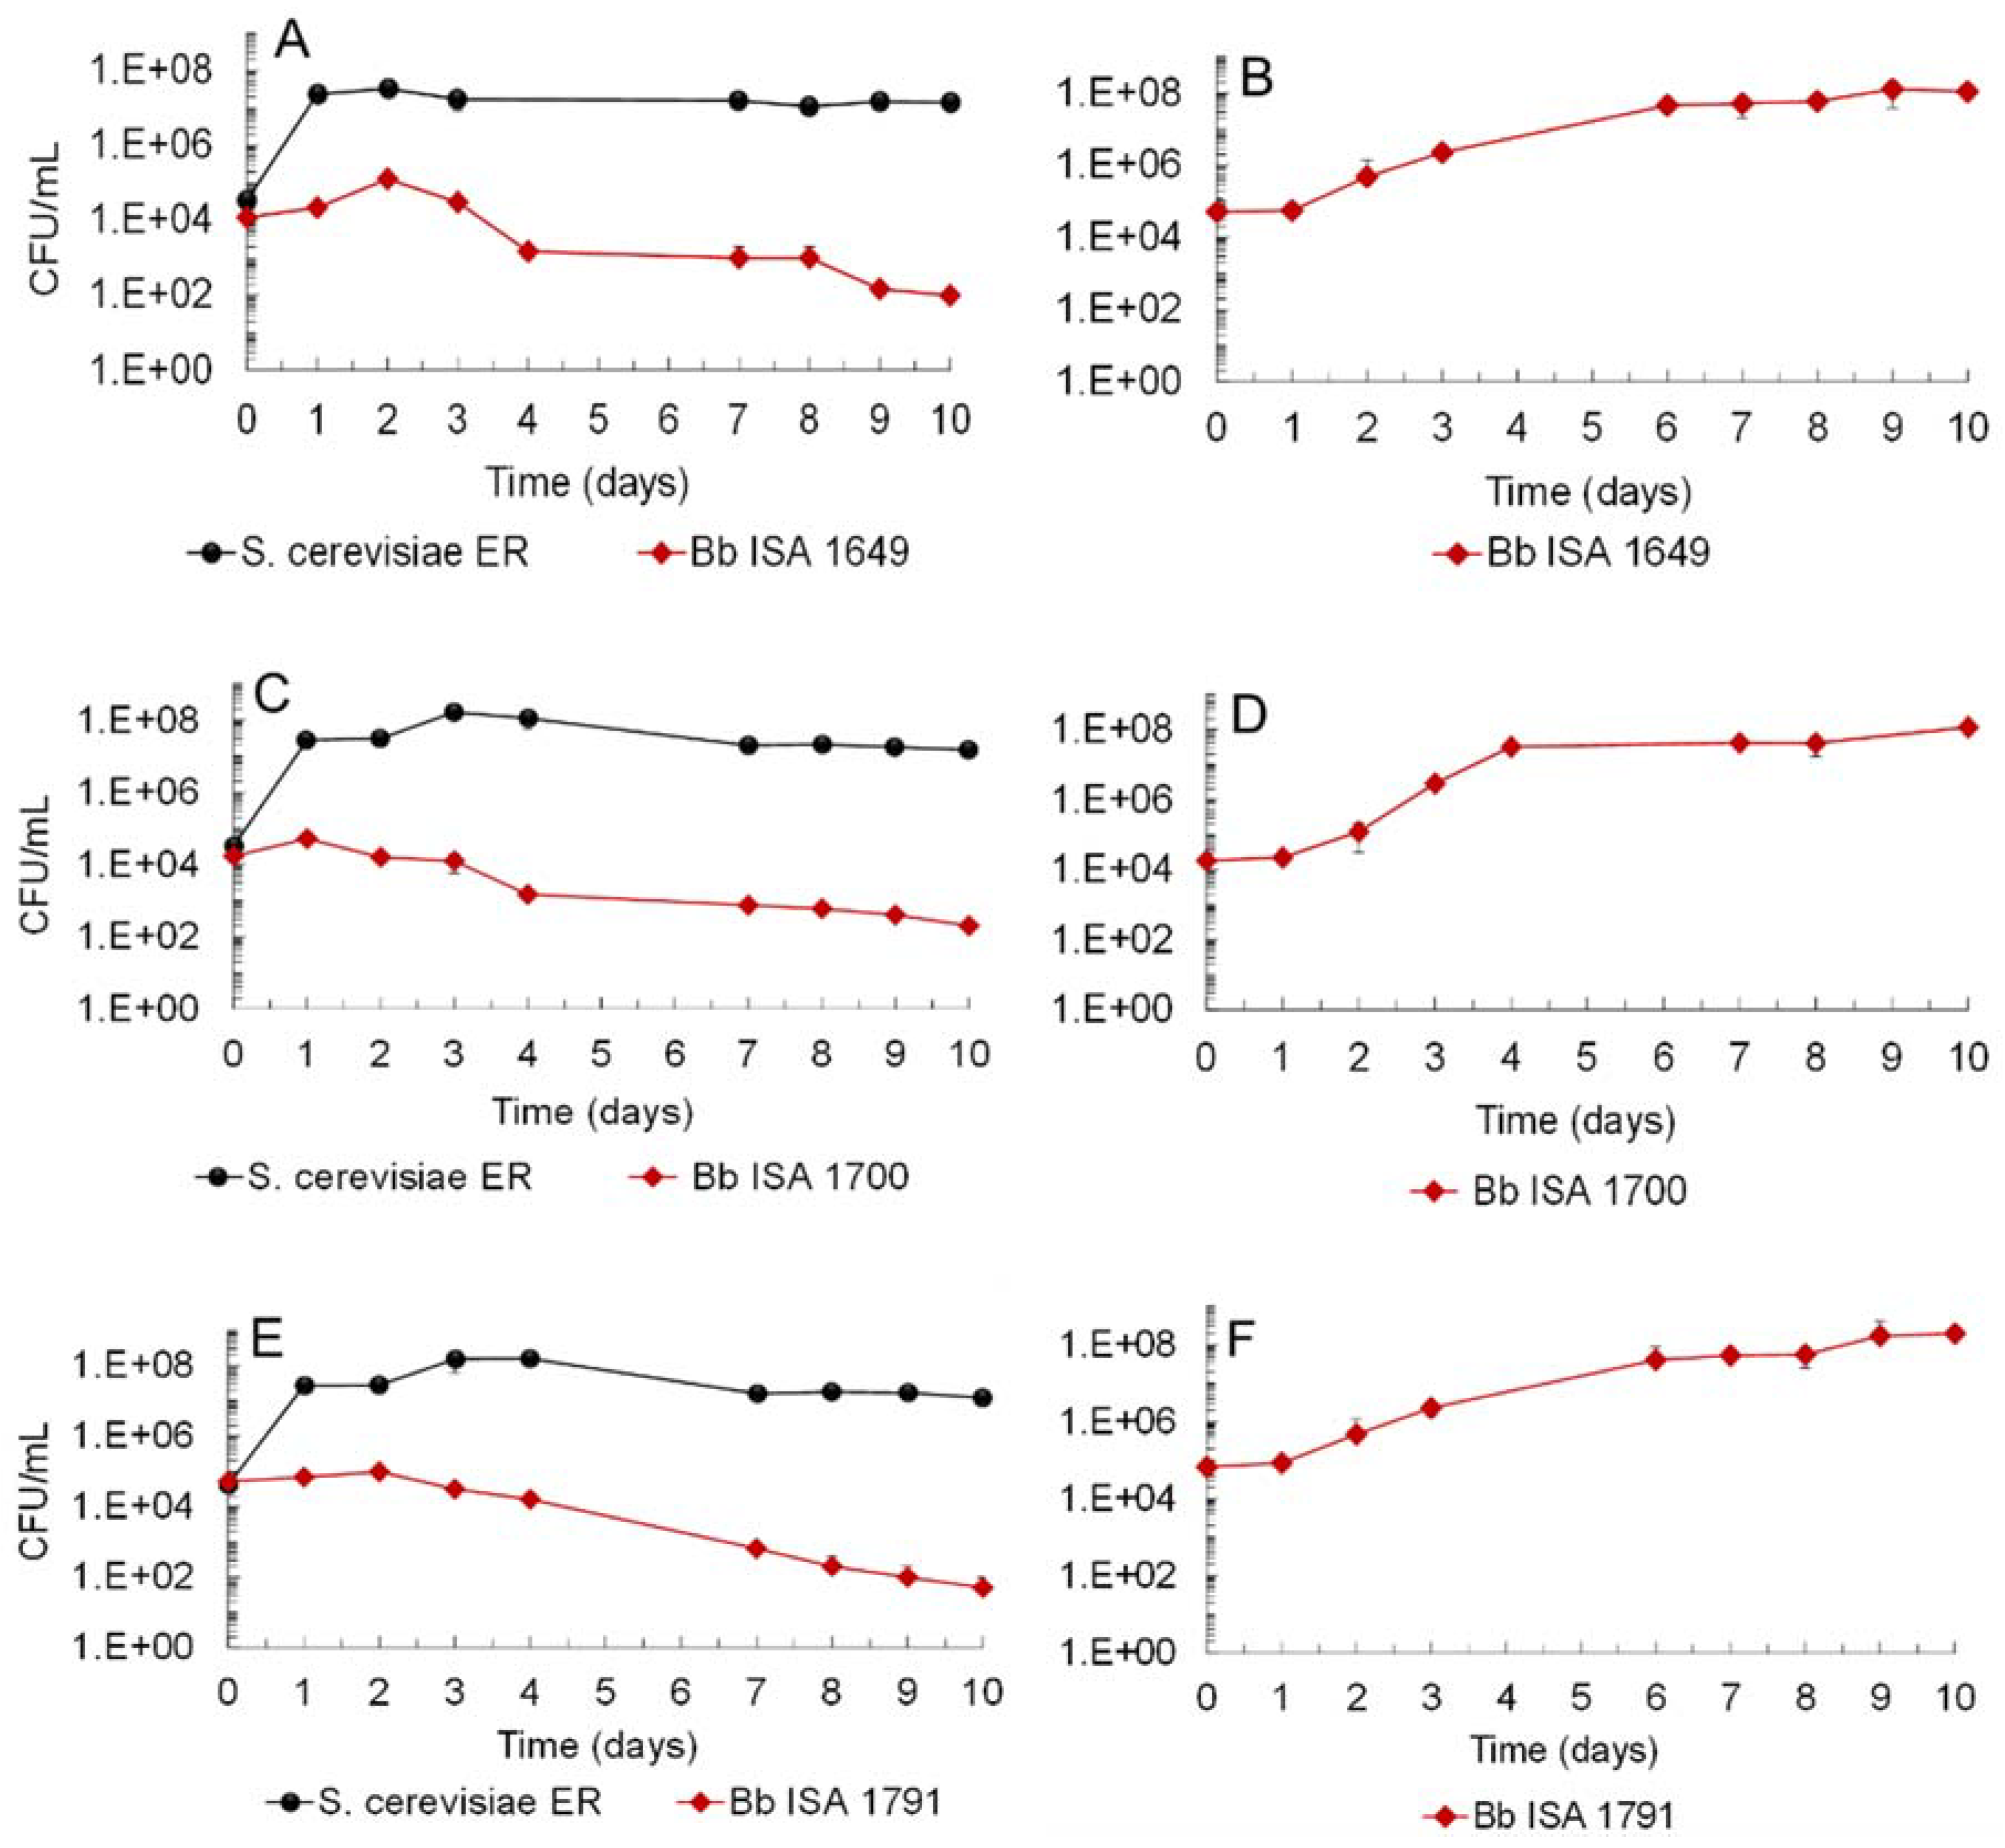
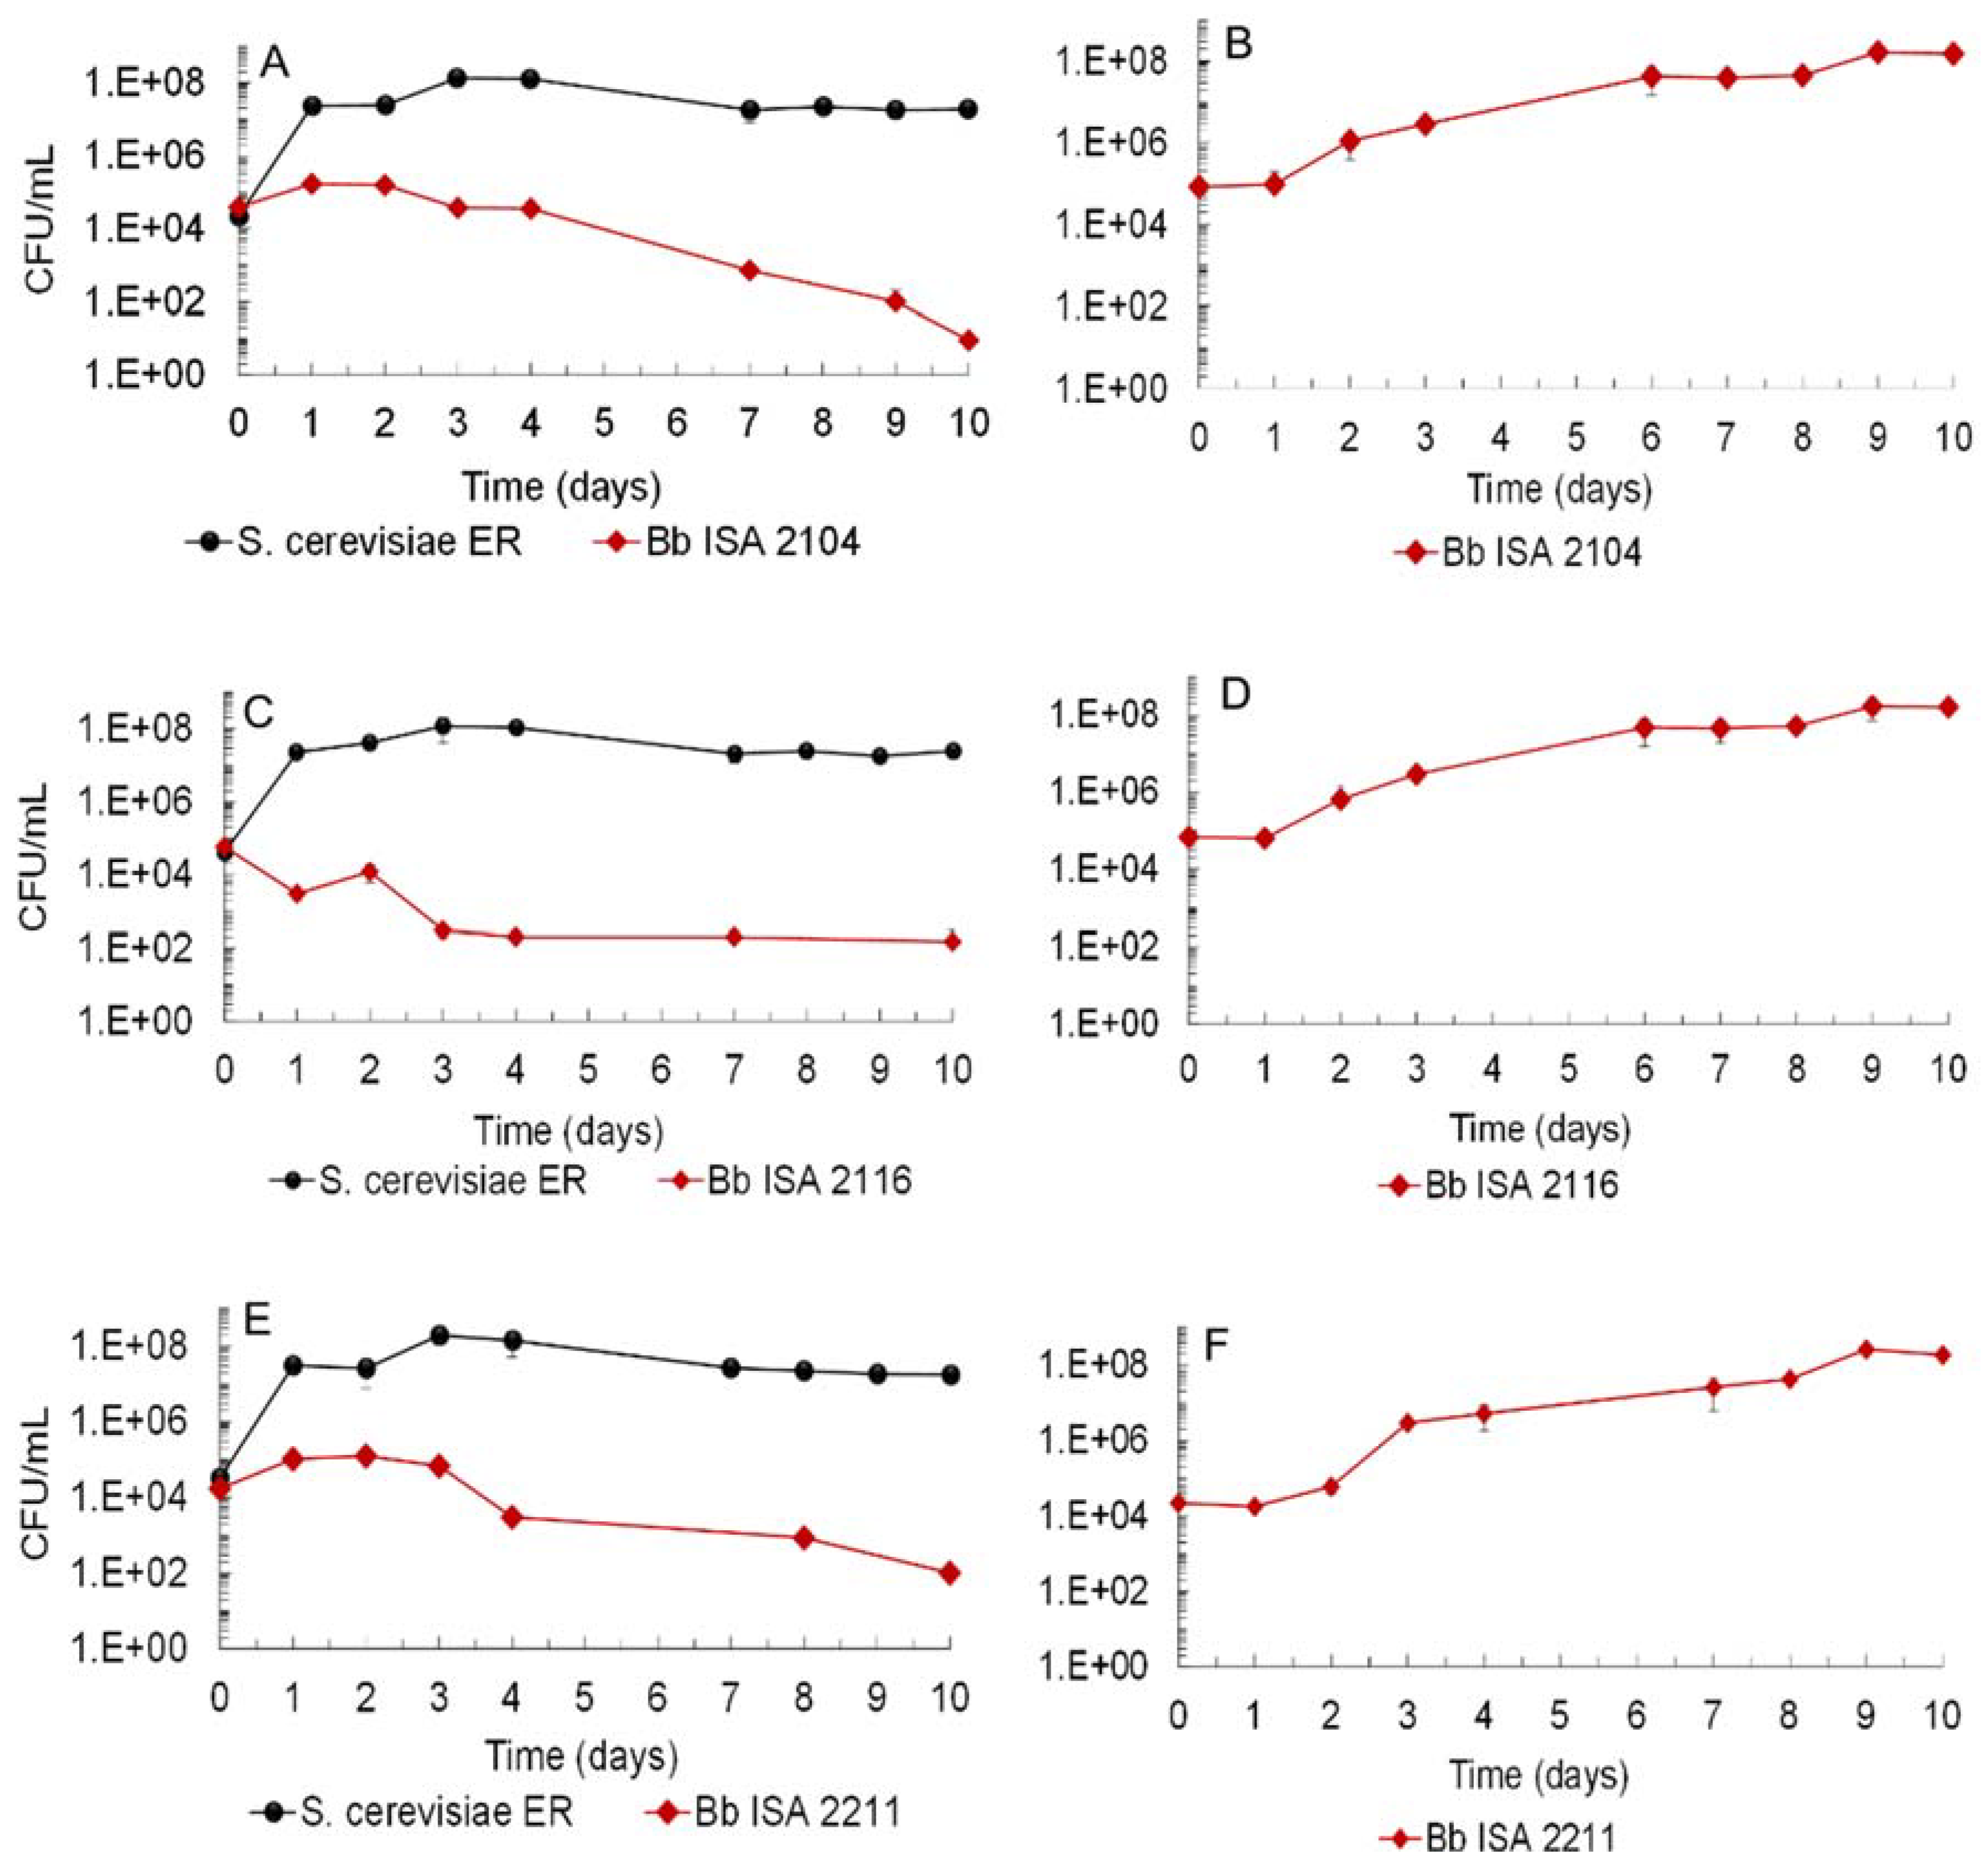
Culturability of S. cerevisiae ER and B. bruxellensis was determined during alcoholic fermentations performed with six B. bruxellensis strains, i.e., ISA 1649, ISA 1700, ISA 1791 (Figure 2) and ISA 2104, ISA 2116, ISA 2211(Figure 3), in mixed-culture with S. cerevisiae ER (panels A,C,E) and in single-culture (panels B,D,F). In both mixed- and single-culture fermentations, the medium was inoculated with 5 × 10⁴ cells/mL of each yeast strain and incubated at 30 °C. Single-culture fermentations of B. bruxellensis strains were used as a negative control of the antagonistic effect exerted by S. cerevisiae.
Figure 2 and Figure 3 show that all B. bruxellensis strains lost their cell viability by ca 2.5–3.5 orders of magnitude (i.e., from an initial value of 5 × 10⁴ cells/mL to a final value of about 102 cells/mL) in the first 10 days when in mixed-culture with S. cerevisiae (panels A,C,E), whereas in single-culture (panels B,D,F) the same strains were able to grow, increasing their culturability by approx. four orders of magnitude (up to 108 CFU/mL) in the first 6 days of fermentation and maintaining this value until the end of fermentation. Sugars consumption and ethanol production during these mixed- and single-culture fermentations are shown in Table 1 and Table 2, respectively. Results show that in all mixed-culture fermentation, approx. 99.9% of sugars were consumed in the first 10 days (Table 1), with ethanol reaching concentrations ranging from 96.9 to 109.1 g/L (Table 2). Conversely, during single-culture fermentations B. bruxellensis strains ISA 1649, ISA 1700, ISA 1791, ISA 2104, ISA 2116 and ISA 2211 consumed just 66.1%, 44.2%, 54.5%, 23,2%, 59.5% and 66.5% of the initial sugars (Table 1) and produced 49.9 g/L, 22.8 g/L, 44.7 g/L, 14.9 g/L, 47.7 g/L and 40.5 g/L of ethanol (Table 2), respectively, in the first 10 days.
These results strongly indicate that the fuel-ethanol starter ER exerted a significant antagonistic effect against all B. bruxellensis strains in a similar way to S. cerevisiae wine strains [44]. In fact, although ethanol is a well-known stress factor for yeast growth [45,46], B. bruxellensis strains are extremely resistant to ethanol, tolerating up to 14% (v/v) of ethanol [47]. Thus, the ethanol levels reached in the mixed-culture fermentation (Table 2), as well as any nutrient limitations, cannot explain per si the early death (from day-1) of B. bruxellensis strains during these fermentations. Nevertheless, and despite the antagonistic effect exerted by S. cerevisiae ER against all the B. bruxellensis strains tested, one can see that the ER antagonistic effect was not sufficient to induce their total death (Figure 2 and Figure 3). The persistence of this yeast species, even at low levels, in the fermentation broth may represent a serious problem to industrial bioethanol fermentation, namely those using cell recycling with acid washing. In fact, some studies have demonstrated that after several recycling cycles, S. cerevisiae metabolism is affected, allowing the highly resistant B. bruxellensis strains to proliferate [6].
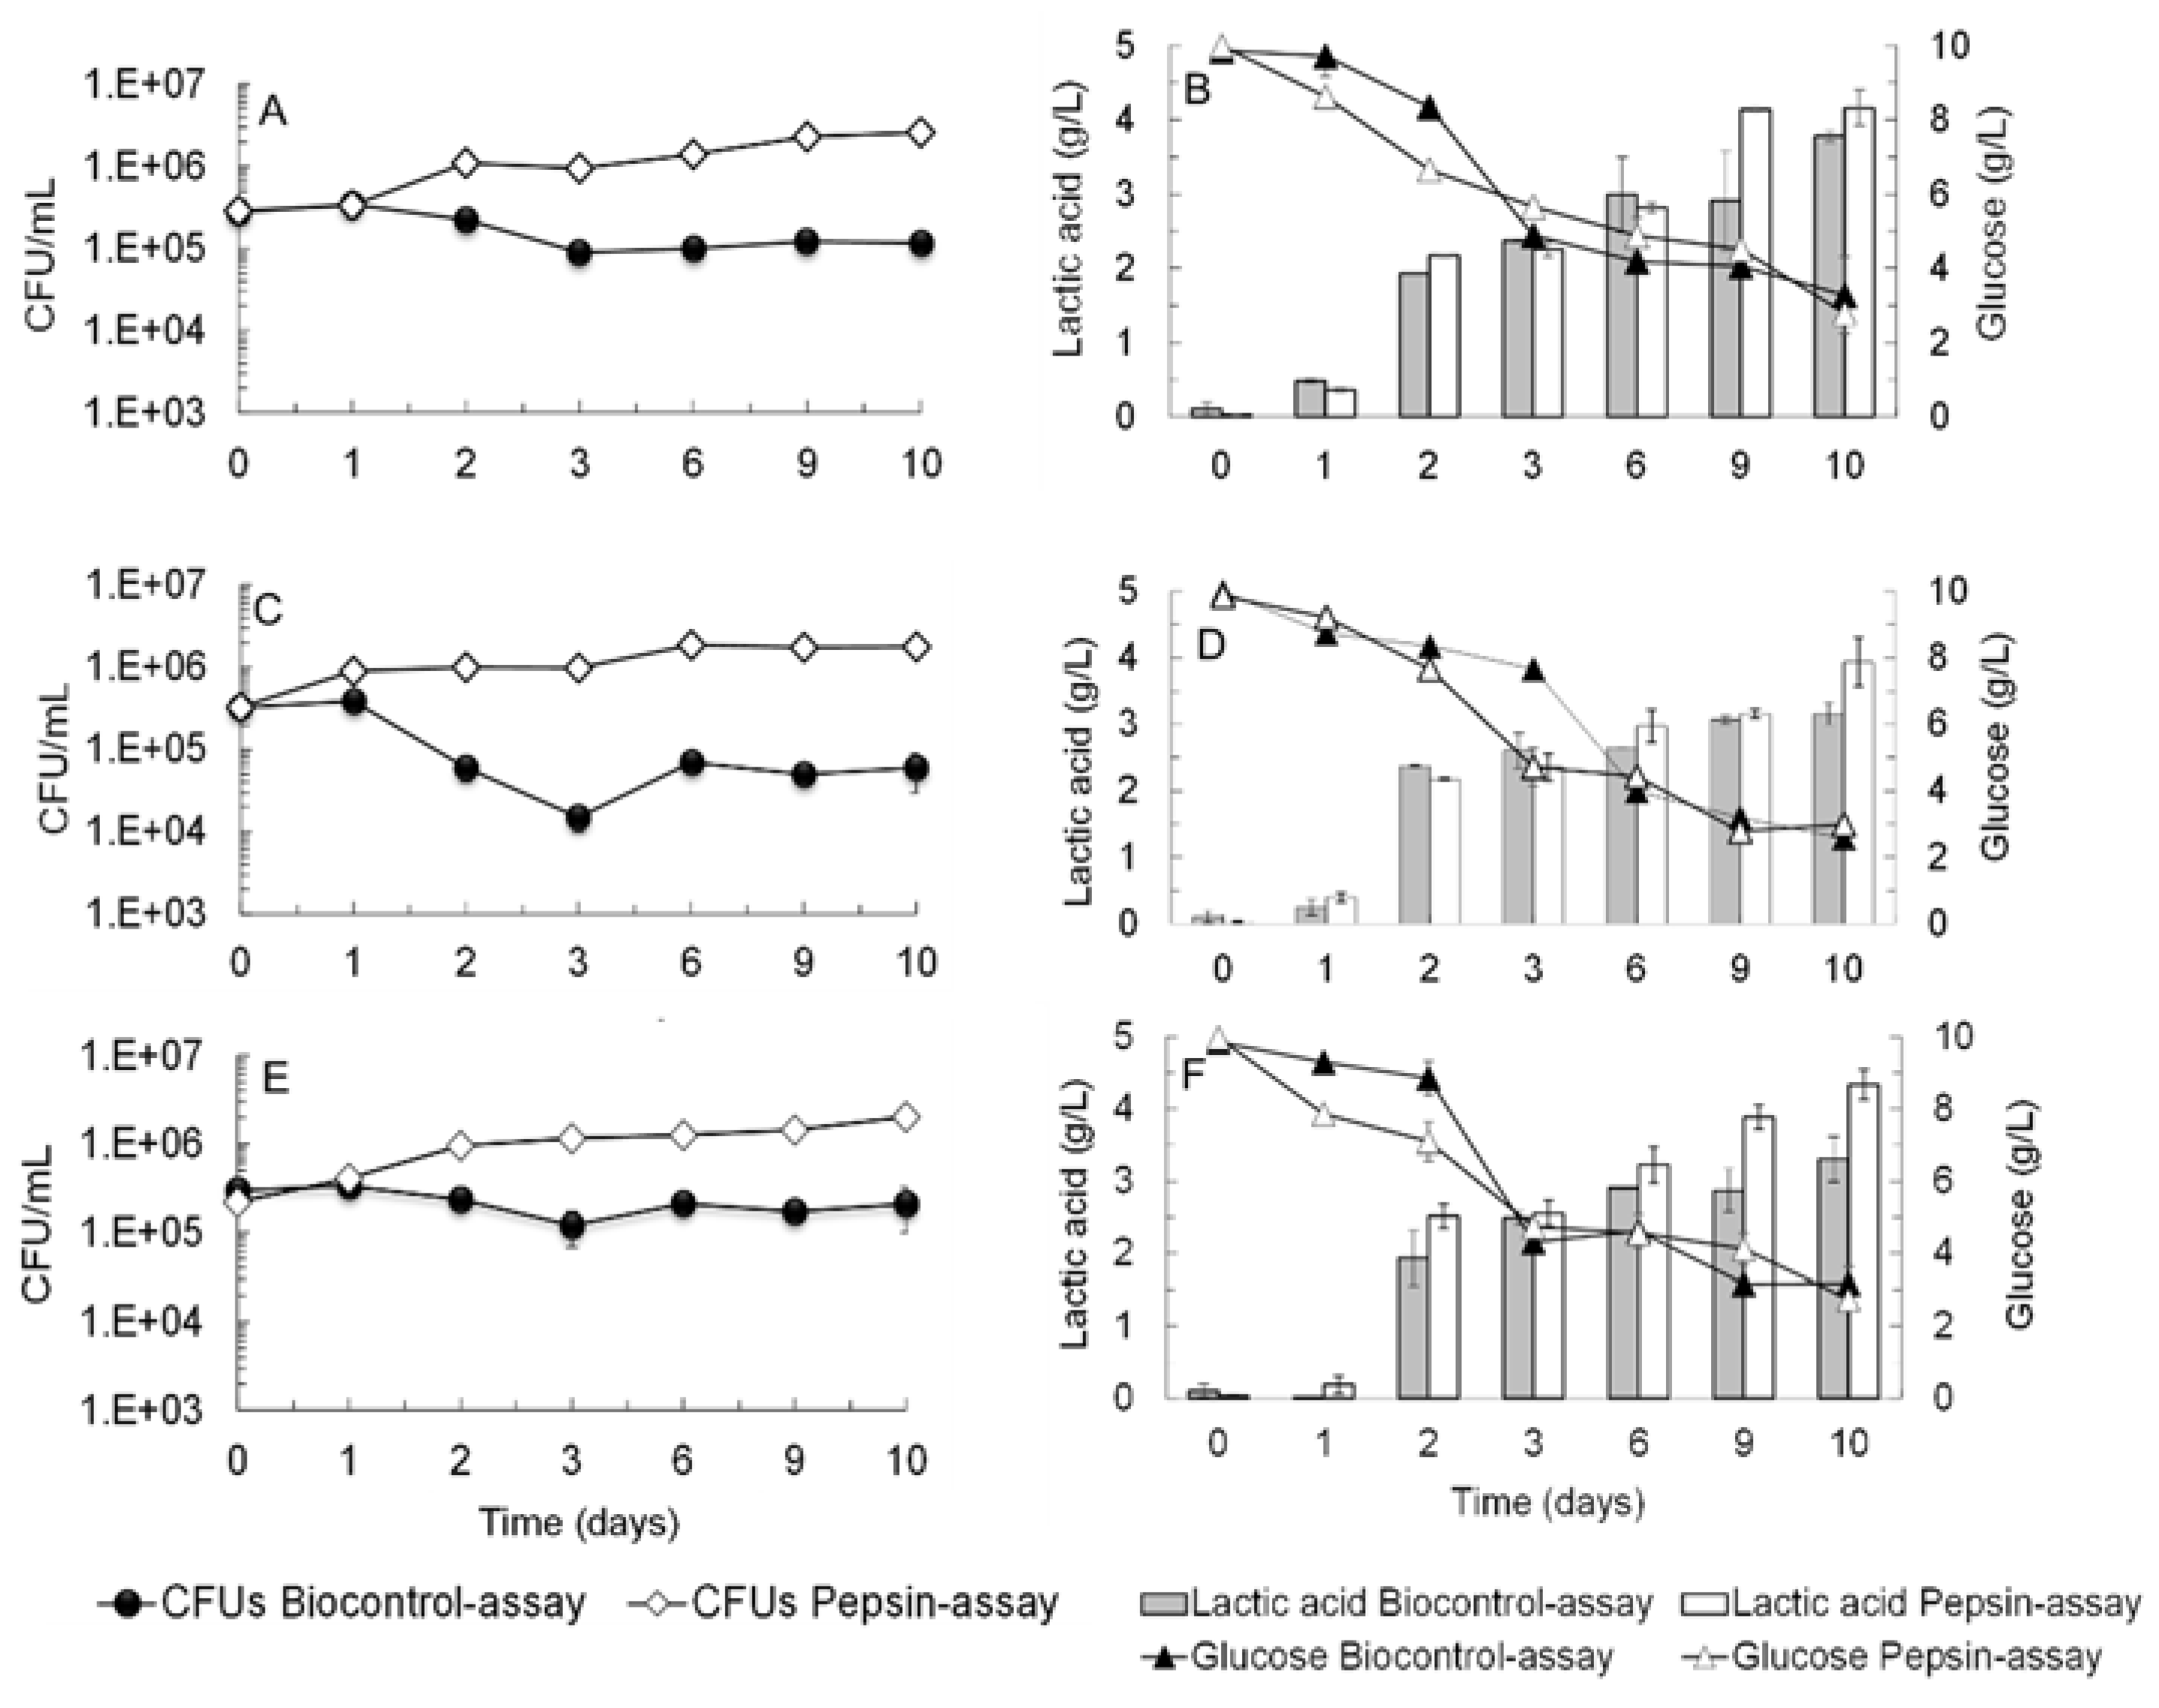
The proliferation of LAB in fuel-ethanol fermentations can decrease ethanol levels and yields due to sugar consumption and accumulation of by-products such as lactic acid in the medium, which may affect S. cerevisiae metabolism resulting in sluggish fermentations [13,14,15]. Since, in previous work, we demonstrated that several S. cerevisiae wine strains secrete AMPs during alcoholic fermentation that inhibit the growth of some LAB, namely of Oenococcus oeni strains [36,37], in the present study, we performed growth assays with six LAB species in a cell-free supernatant pre-fermented by S. cerevisiae ER (biocontrol assays). As a negative control of the antagonistic effect exerted by the AMPs secreted by S. cerevisiae ER against these LAB, the same cell-free supernatant was treated with pepsin (pepsin assay) to inactivate the AMPs. Both cell-free supernatants were supplemented with glucose and malic acid to evaluate glucose consumption and lactic acid production in the presence (biocontrol assay) and in the absence (pepsin assay) of the AMPs. Figure 4 and Figure 5 show the culturability (panels A,C,E), glucose consumption, and lactic acid production (panels B,D,F) profiles of Levilactobacillus brevis ISA 4385; Lentilactobacillus hilgardii ISA 4387; Lactiplantibacillus plantarum ISA 4395 (Figure 4) and Leuconostoc mesenteroides subsp. cremoris ISA 4383, Pediococcus parvulus, and Pediococcus pentosaceus (Figure 5) during the biocontrol assays and pepsin assays.
Results (Figure 4 and Figure 5) show growth inhibition (panels A,C,E) of all LAB, except for L. brevis, in the biocontrol assays by comparison with their growth in the pepsin assays where the AMPs secreted by S. cerevisiae were inactivated. In biocontrol assays, L. plantarum (Figure 4E) and P. parvulus (Figure 5C) lost their culturability by ca 1.5 orders of magnitude in the first 3 days, while L. hilgardii (Figure 4C), L. mesenteroides subsp. cremoris (Figure 5A) and P. pentosaceus (Figure 5C) decreased their culturability by less than one order of magnitude. Conversely, in the pepsin assays, L. hilgardii, L. plantarum, L. mesenteroides, P. parvulus, and P. pentosaceus increased their culturability by ca one order of magnitude in the first 3 days (Figure 4C,E and Figure 5A,C,E respectively), indicating that the AMPs secreted by S. cerevisiae seem to be active towards these LAB species. However, after 6 days, all the LAB tested increased their culturability in the biocontrol assays. Therefore, one must conclude that the concentration of AMPs secreted by S. cerevisiae ER during alcoholic fermentation is not sufficient to fully prevent the proliferation of these LAB.
Comparing the glucose and lactic acid concentrations in the biocontrol assays with those in the pepsin–assays (Figure 4B,D,F and Figure 5B,D,F) on day-3, when major differences were observed between the LAB culturability, no statistically different (p > 0.05) values were detected, except for P. parvulus (Figure 5D). In the absence of the AMPs (pepsin assay), P. parvulus consumed 5.22 g/L of glucose (Figure 5D) and 1.71 g/L of malic acid (Table S2) until the third day, while in the presence of the AMPs (biocontrol assay) only 2.33 g/L of glucose and 2.15 g/L of malic acid were consumed, although no significant differences (p > 0.05) were detected in the lactic acid production at the third day comparing the two assays (Figure 5D). In summary, although metabolites secreted by S. cerevisiae ER during alcoholic fermentation exerted a slight inhibition on the growth of these LAB, the concentration of those metabolites was not sufficient to avoid the negative impact that these LAB might cause in fuel-ethanol processes.

3.2. Identification of the AMPs Secreted by S. cerevisiae ER by Indirect ELISA and Liquid Chromatography with Tandem Mass Spectrometry (LC-MS/MS)

In previous work [35,36,37,38], we found that several S. cerevisiae wine strains secrete AMPs during alcoholic fermentations that are derived from the glycolytic enzyme glyceraldehyde 3-phosphate dehydrogenase (GAPDH). Those AMPs were isolated from S. cerevisiae fermentation supernatants and two bioactive peptides with amino acid sequences of ISWYDNEYGYSAR (AMP1) and VSWYDNEYGYSTR (AMP2/3, were identified by mass spectrometry [37]. To investigate if these GAPDH-derived AMPs are also secreted by the ER strain, peptides from a 7-day-old ER fermentation supernatant were purified by means of size-exclusion chromatography and then identified by enzyme-linked immunosorbent assay (ELISA) and mass spectrometry (MS) analysis. First, the 2–10 kDa peptidic fraction of the ER fermentation supernatant was fractionated by gel-filtration chromatography, and the peak indicated in Figure 1 as fraction 8 kDa (retention time 27–29 min) was collected and tested for its antimicrobial effect against the sensitive yeast H. guilliermondii [37]. Antimicrobial tests (Figure S1) showed that 1.0 mg/mL of fraction 8 kDa was enough to completely inhibit H. guilliermondii growth. Provided these results, fraction 8 kDa was selected to be further analyzed by indirect ELISA and LC-MS/MS.
In the ELISA procedure, we used a primary polyclonal antibody specific to the GAPDH-derived AMPs, previously identified by Branco et al. [37], with the following amino acid sequences: ISWYDNEYGYSAR (AMP1) and VSWYDNEYGYSTR (AMP2/3). Results (Figure S2) revealed that the gel-filtration fraction 8 kDa indeed contained the GAPDH-derived AMPs.
The amino acid sequence of the peptides existent in the bioactive fraction 8 kDa was also analyzed by LC-MS/MS to validate ELISA results. LC-MS/MS results (Figure 6, Tables S3–S5) confirmed the presence of both GAPDH-derived AMPs in fraction 8 kDa, with the same amino acid sequences (i.e., ISWYDNEYGYSAR and VSWYDNEYGYSTR) as those previously found in S. cerevisiae wine strains [37,38].

3.3. Minimum Inhibitory Concentration (MIC), Half-Inhibitory Concentration (IC50) and Biocidal Effect of the AMPs Secreted by S. cerevisiae ER against Fuel-Ethanol Microbial Contaminants

The MIC and IC50 of fraction 8 kDa were determined for the six B. bruxellensis and LAB strains mentioned in Section 2.1, using fraction 8 kDa at four different concentrations (0.5, 1.0, 1.5, and 2.0 mg/mL). The percentage of growth inhibition was determined when cells in the control assay reached the stationary phase (approximately 40–48 h). The biocidal effect of fraction 8 kDa was quantified by loss of culturability (CFU/mL), measured as the number of logarithmic reductions (Logs of [CFU/mL] reduction). Results showed that the minimum concentration of fraction 8 kDa that prevents any visible growth (MIC) of B. bruxellensis varied from 1.5 mg/mL for strains ISA 2116 and ISA 2211 (Table 3 and Figure S3E,F and 2.0 mg/mL for strains ISA 1791 and ISA 2104 (Table 3 and Figure S3C,D). The most resistant B. bruxellensis strains were ISA 1649 and ISA 1700, which, in the presence of 2.0 mg/mL of fraction 8 kDa, although inhibited, were still able to grow (Figure S3A,B). The concentration of fraction 8 kDa that induced 50% of growth reduction (IC50) was determined when cells in the control assay reached the stationary growth phase, and values varied from 0.28 mg/mL for B. bruxellensis strain ISA 1791 and 0.70 mg/mL for strain ISA 1700 (Table 3 and Figure S3A,E). The fungicidal effect of fraction 8 kDa against these B. bruxellensis strains agrees well with the MIC values determined, showing once again that the most sensitive strains are B. bruxellensis ISA 2116 and ISA 2211, which reduced their culturability by 1.0 and 1.2 orders of magnitude when exposed to 1.5 mg/mL and by 1.5 and 1.8 orders of magnitude when exposed to 2.0 mg/mL of fraction 8 kDa, respectively.
The MIC of fraction 8 kDa was slightly higher than 2.0 mg/mL for all LAB species (Table 4 and Figure S4A–E) since the percentage of growth inhibition at this concentration varied from 94% for L. brevis to 98% for P. parvulus and L. hilgardii (Figure S4). L. brevis showed to be the most resistant species since when exposed to 2.0 mg/mL of fraction 8 kDa, its growth was inhibited by 94% (Figure S4A). Moreover, after 3 days, L. brevis was able to grow in the presence of 2.0 mg/mL of fraction 8 kDa, which was not observed for the other LAB species (Figure S4A–G). These results confirmed what was previously observed in the evaluation of the biocontrol effect exerted by S. cerevisiae ER against these LAB, where L. brevis was able to maintain its cell viability at about 105–106 CFU/mL for 10 days in the presence of the AMPs (Figure 4A). Half inhibitory concentrations (IC50) agree well with MICs for the same LAB species (Table 4 and Figure S4A–E). Fraction 8 kDa at 2.0 mg/mL showed the strongest bactericidal effect against L. hilgardii, L. plantarum, and P. parvulus, which decreased their cell viability by 1.2, 1.1, and 1.9 orders of magnitude, respectively. This once again confirms the results obtained in the evaluation of the biocontrol effect exerted by S. cerevisiae ER (Figure 5A,C,E), where L. plantarum and P. parvulus were revealed to be the most susceptible species to the AMPs secreted by S. cerevisiae ER.

4. Conclusions

In the present work, we found that the industrial fuel-ethanol starter S. cerevisiae ER secretes the same GAPDH-derived AMPs that were previously identified in S. cerevisiae wine strains [37,38]. In addition, we also demonstrate that these AMPs exert an antimicrobial effect against several LAB and B. bruxellensis strains. However, the level of AMPs naturally secreted by ER during alcoholic fermentation is not sufficient to completely inhibit the growth of the LAB tested (i.e., P. pentosaceus, L. mesenteroides subsp. cremoris, L. brevis, L. hilgardii, L. plantarum) and to induce total death of the B. bruxellensis strains analyzed. One foreseeable approach to improve the biocontrol effect of S. cerevisiae ER against fuel-ethanol contaminants could be the genetic modification of this strain to over-express and over-produce these GAPDH-derived AMPs. Nevertheless, the present study raised experimental evidence that it is worth exploring the biocontrol potential of S. cerevisiae ER against fuel-ethanol fermentations microbial contaminants.

Supplementary Materials

The following supporting information can be downloaded at: https://www.mdpi.com/article/10.3390/fermentation8050233/s1, Table S1: List of microorganisms used in the present study and their origin; Table S2: Comparison of malic acid consumption during growth assays performed with Levilactobacillus brevis, Lentilactobacillus hilgardii, Lactiplantibacillus plantarum, Leuconostoc mesenteroides subsp. cremoris, Pediococcus parvulus, and Pediococcus pentosaceus, inoculated in a cell-free supernatant pre-fermented by S. cerevisiae ER, without any treatment (Control assay) and after a pepsin treatment (pepsin assay). Data represented correspond to means ± SD (error bars) of two independent biological assays; Table S3: Proteins identified in fraction 8 kDa by LC-MS/MS with Unused Protein Score above 1.3 and 95% confidence; Table S4: Peptides identified by LC-MS/MS in fraction 8 kDa derived from glyceraldehyde-3-phosphate dehydrogenase-1 protein, TDH1 gene; Table S5: Peptides identified by LC-MS/MS in fraction 8 kDa derived from glyceraldehyde-3-phosphate dehydrogenase protein-3, TDH3 gene. Figure S1: Culturable cells (CFU) and optical density (OD) of Hanseniaspora guilliermondii in the antimicrobial tests (AMT) without addition of Fraction 8 kDa (Control) and with addition of 1 mg/mL of Fraction 8 kDa (AMT). Data represented correspond to mean values of triplicate independent assays ± SD (error bars). Different letters located over the error bars indicate significant differences (p < 0.05); Figure S2: Absorbance (404 nm) comparison of the blank with the GAPDH-derived AMPs present in the fraction 8 kDa determined by indirect ELISA. Values represented correspond to the means ± SD (error bars) of three absorbance measurements. Different letters located over the error bars indicate significant differences (p < 0.05); Figure S3: (A–F) Growth inhibition (%) of B. bruxellensis strains in function of fraction 8 kDa concentration (0.0, 0.5, 1.0, 1.5 and 2.0 mg/mL). The percentage of growth inhibition (measured by absorbance) was determined when the respective control assay reached the stationary growth phase, ca 48 h; (G–L) Culturability (CFU/mL) of B. bruxellensis strains in function of time (days) in the absence of fraction 8 kDa (Control) and in the presence of 0.5, 1.0, 1.5 and 2.0 mg/mL of fraction 8 kDa (Fr 8 kDa). (A,G) ISA 1649; (B,H) ISA 1700; (C,I) ISA 1791; (D,J) ISA 2104; (E,K) ISA 2116; (F,L) ISA 2211. Data represented correspond to means ± SD (error bars) of triplicate independent assays. Different letters located over the error bars indicate significantly different values (p < 0.05); Figure S4: (A–F) Growth inhibition (%) of LAB in function of fraction 8 kDa concentration (0.0, 0.5, 1.0, 1.5 and 2.0 mg/mL). The percentage of growth inhibition (measured by absorbance) was determined when the respective control assay reached the stationary growth phase, ca 48 h; (G–L) Culturability (CFU/mL) of LAB in function of time (days) in the absence of fraction 8 kDa (Control) and in the presence of 0.5, 1.0, 1.5 and 2.0 mg/mL of fraction 8 kDa (Fr 8 kDa). (A,G) L. brevis; (B,H) L. hilgardii; (C,I) L. plantarum; (D,J) L. mesenteroides subsp. cremoris; (E,K) P. parvulus; (F,L) P. pentosaceus. Data represented correspond to means ± SD (error bars) of triplicate independent assays. Different letters located over the error bars indicate significantly different values (p < 0.05).

Author Contributions

P.B. and H.A., conceived and designed the research. P.B. conducted experiments. P.B., M.D. and H.A. analyzed data. P.B. and H.A. wrote, revised, and edited the manuscript. All authors have read and agreed to the published version of the manuscript.

Funding

This research was financed by national funds through Fundação para a Ciência eTecnologia (FCT), Portugal, in the scope of project PTDC/BII-BIO/31761/2017. Applied Molecular Biosciences Unit UCIBIO is financed by national funds from FCT (UIDP/04378/2020 and UIDB/04378/2020).

Institutional Review Board Statement

Not applicable.

Informed Consent Statement

Not applicable.

Data Availability Statement

All data reported in this study are included in the manuscript.

Acknowledgments

The authors thank to FCT for financial support of this work through the project PTDC/BII-BIO/31761/2017. Part of the research was carried out at the Biomass and Bioenergy Research Infrastructure (BBRI)-LISBOA-01-0145-FEDER-022059, supported by Operational Programme for Competitiveness and Internationalization (PORTUGAL2020), by Lisbon Portugal Regional Operational Programme (Lisboa 2020) and by North Portugal Regional Operational Programme (Norte 2020) under the Portugal 2020 Partnership Agreement, through the European Regional Development Fund (ERDF).

Conflicts of Interest

The authors declare no conflict of interest.

References

  1. Ramos, M.D.N.; Milessi, T.S.; Candido, R.G.; Mendes, A.A.; Aguiar, A. Enzymatic catalysis as a tool in biofuels production in Brazil: Current status and perspectives. Energy Sustain. Develop. 2022, 68, 103–119. [Google Scholar] [CrossRef]
  2. Manochio, C.; Andrade, B.R.; Rodriguez, R.P.; Moraes, B.S. Ethanol from biomass: A comparative overview. Renew. Sustain. Energy Rev. 2017, 80, 743–755. [Google Scholar] [CrossRef]
  3. Renewable Fuels Association (RFA). Ethanol Industry Statistics, Washington, DC, USA. 2015. Available online: www.ethanolrfa.org (accessed on 9 May 2022).
  4. Basílio, A.C.M.; Araújo, P.R.L.; Morais, J.O.F.; da Silva Filho, E.A.; de Morais, M.A., Jr.; Simões, D.A. Detection and identification of wild yeast contaminants of the industrial fuel ethanol fermentation process. Curr. Microbiol. 2008, 5, 322–326. [Google Scholar] [CrossRef] [PubMed]
  5. Brexó, R.P.; Sant’Ana, A.S. Microbial interactions during sugar cane must fermentation for bioethanol production: Does quorum sensing play a role? Crit. Rev. Biotechnol. 2018, 38, 231–244. [Google Scholar] [CrossRef]
  6. Beckner, M.; Ivey, M.; Phister, T. Microbial contamination of fuel ethanol fermentations. Lett. Appl. Microbiol. 2011, 53, 387–394. [Google Scholar] [CrossRef]
  7. Liberal, A.T.S.; Basílio, A.C.M.; Brasileiro, B.T.R.V.; da Silva Filho, E.A.; Simões, D.A.; de Morais, M.A., Jr. Identification of the yeast Dekkera bruxellensis as major contaminant in continuous fuel ethanol fermentation. J. Appl. Microbiol. 2007, 102, 538–547. [Google Scholar]
  8. Skinner, K.A.; Leathers, T.D. Bacterial contaminants of fuel ethanol production. J. Ind. Microbiol. Biotechnol. 2004, 31, 401–408. [Google Scholar] [CrossRef]
  9. Abbott, D.A.; Hynes, S.H.; Ingledew, W.M. Growth rates of Dekkera/Brettanomyces yeasts hinder their ability to compete with Saccharomyces cerevisiae in batch corn mash fermentations. Appl. Microbiol. Biotechnol. 2005, 66, 641–647. [Google Scholar] [CrossRef]
  10. Passoth, V.; Blomqvist, J.; Schnurer, J. Dekkera bruxellensis and Lactobacillus vini form a stable ethanol producing consortium in a commercial alcohol process. Appl. Environ. Microbiol. 2007, 73, 4354–4356. [Google Scholar] [CrossRef] [Green Version]
  11. Lucena, B.T.; dos Santos, B.M.; Moreira, J.L.; Moreira, A.P.; Nunes, A.C.; Azevedo, V.; Miyoshi, A.; Thompson, F.L.; de Morais, M.A., Jr. Diversity of lactic acid bacteria of the bioethanol process. BMC Microbiol. 2010, 10, 298. [Google Scholar] [CrossRef] [Green Version]
  12. Ngang, J.E.; Letourneau, F.; Wolniewicz, E.; Villa, P. Inhibition of beet molasses alcoholic fermentation by lactobacilli. Appl. Microbiol. Biotechnol. 2004, 33, 490–493. [Google Scholar]
  13. Neelakantam, V.; Narendranath, N.V.; Power, R. Relationship between pH and medium dissolved solids in terms of growth and metabolism of Lactobacilli and Saccharomyces cerevisiae during ethanol production. Appl. Microbiol. Biotechnol. 2005, 71, 2239–2243. [Google Scholar]
  14. Bayrock, D.P.; Ingledew, W.M. Inhibition of yeast by lactic acid bacteria in continuous culture: Nutrient depletion and/or acid toxicity? J. Ind. Microbiol. Biotechnol. 2004, 31, 362–368. [Google Scholar] [CrossRef] [PubMed]
  15. Lopes, M.L.; Paulillo, S.C.; Godoy, A.; Cherubin, R.A.; Lorenzi, M.S.; Giometti, F.H.C.; Bernardino, C.D.; Amorim Neto, H.B.D.; Amorim, H.V.D. Ethanol production in Brazil: A bridge between science and industry. Braz. J. Microbiol. 2016, 47, 64–76. [Google Scholar] [CrossRef] [Green Version]
  16. Simpson, W.J.; Hammond, J.R.M. The response of brewing yeasts to acid washing. J. Inst. Brew. 1989, 95, 347–354. [Google Scholar] [CrossRef]
  17. Seo, S.O.; Park, S.K.; Jung, S.C.; Ryu, C.M.; Kim, J.S. Anti-Contamination Strategies for Yeast Fermentations. Microorganisms 2020, 8, 274. [Google Scholar] [CrossRef] [Green Version]
  18. Cunningham, S.; Stewart, G.G. Effects of high-gravity brewing and acid washing on brewers’ yeast. J. Am. Soc. Brew. Chem. 1998, 56, 12–18. [Google Scholar] [CrossRef]
  19. Tang, Y.; An, M.; Zhong, Y.; Shigeru, M.; Wu, X.; Kida, K. Continuous ethanol fermentation from non-sulfuric acid-washed molasses using traditional stirred tank reactors and the flocculating yeast strain KF-7. J. Biosci. Bioeng. 2010, 109, 41–46. [Google Scholar] [CrossRef]
  20. Broda, M.; Narendranath, W. Ammonia disinfection of corn grains intended for ethanol fermentation. Acta Sci. Pol. Technol. Aliment. 2009, 8, 33–38. [Google Scholar]
  21. Narendranath, N.V.; Thomas, K.C.; Ingledew, W.M. Urea hydrogen peroxide reduces the numbers of lactobacilli, nourishes yeast, and leaves no residues in the ethanol fermentation. Appl. Environ. Microbiol. 2000, 66, 4187–4192. [Google Scholar] [CrossRef] [Green Version]
  22. McDonnell, G.; Russell, D. Antiseptics and desinfectants: Activity, action, and resistance. Clin. Microbiol. Rev. 1999, 12, 147–179. [Google Scholar] [CrossRef] [PubMed] [Green Version]
  23. Messik, C.R.; Pendland, S.L.; Moshirfar, M.; Fiscella, R.G.; Losnedahl, K.J.; Schriever, C.A.; Schreckenberger, P.C. In-vitro activity of polyheamethylene biguanide (PHMB) against fungal isolates associated with infective keratitis. J. Antimicrob. Chemother. 1999, 44, 297–298. [Google Scholar] [CrossRef] [PubMed] [Green Version]
  24. Allen, M.J.; White, G.F.; Morby, A.P. The response of Escherichia coli to exposure to the biocide polyhexamethylene biguanide. Microbiology 2006, 152, 989–1000. [Google Scholar] [CrossRef] [PubMed] [Green Version]
  25. Elsztein, C.; Scavuzzi de Menezes, J.A.; Morais, M.A., Jr. Polyhexamethyl biguanide can eliminate contaminant yeasts from fuel-ethanol fermentation process. J. Ind. Microbiol. 2008, 35, 967–973. [Google Scholar] [CrossRef] [PubMed]
  26. Aquarone, E. Penicillin and tetracycline as contamination control agents in alcoholic fermentation of sugarcane molasses. Appl. Environ. Microbiol. 1960, 8, 263–268. [Google Scholar] [CrossRef] [PubMed]
  27. Day, W.H.; Serjak, W.C.; Stratton, J.R.; Stone, L. Contamination inhibition, antibiotics as contamination-control agents in grain alcohol fermentations. J. Agric. Food. Chem. 1954, 2, 252–258. [Google Scholar] [CrossRef]
  28. Hynes, S.H.; Kjarsgaard, D.M.; Thomas, K.C.; Ingledew, W.M. Use of virginiamycin to control the growth of lactic acid bacteria during alcohol fermentation. J. Ind. Microbiol. Biotechnol. 1997, 18, 284–291. [Google Scholar] [CrossRef]
  29. Kumar, A.; Pal, D. Antibiotic resistance and wastewater: Correlation, impact and critical human health challenges. J. Environ. Chem. Eng. 2018, 6, 52–58. [Google Scholar] [CrossRef]
  30. Gil, G.; del Mónaco, S.; Cerrutti, P.; Galvagno, M. Selective antimicrobial activity of chitosan on beer spoilage bacteria and brewing yeasts. Biotechnol. Lett. 2004, 26, 569–574. [Google Scholar] [CrossRef]
  31. Radler, F. Possible use of nisin in winemaking. I. Action of nisin against lactic acid bacteria and wine yeasts in solid and liquid media. Am. J. Enol. Vitic. 1990, 41, 1–6. [Google Scholar]
  32. Conte, A.; Sinigaglia, M.; Del Nobile, M.A. Use of lemon extract to inhibit the growth of malolactic bacteria. J. Food Prot. 2007, 70, 114–118. [Google Scholar] [CrossRef] [PubMed]
  33. Aniche, G.N.; Uwakwe, G.U. Potential use of Garcinia kola as hop substitute in lager beer brewing. World J. Microbiol. Biotechnol. 1990, 6, 323–327. [Google Scholar] [CrossRef]
  34. Huan, Y.; Kong, Q.; Mou, H.; Yi, H. Antimicrobial Peptides: Classification, Design, Application and Research Progress in Multiple Fields. Front. Microbiol. 2020, 11, 582779. [Google Scholar] [CrossRef] [PubMed]
  35. Albergaria, H.; Francisco, D.; Gori, K.; Arneborg, N.; Gírio, F. Saccharomyces cerevisiae CCMI 885 secretes peptides that inhibit the growth of some non-Saccharomyces wine-related strains. Appl. Microbiol. Biotechnol. 2010, 86, 965–972. [Google Scholar] [CrossRef] [PubMed]
  36. Albergaria, H.; Branco, P.; Francisco, D.; Coutinho, R.; Monteiro, M.; Malfeito-Ferreira, M.; Arneborg, N.; Almeida, M.G.; Caldeira, J. Dominance of Saccharomyces cerevisiae in wine fermentations: Secretion of antimicrobial peptides and microbial interactions. In Proceedings of the 2nd International Conference on Microbial Diversity: Microbial Interactions in Complex Ecosystems, Turin, Italy, 23–25 October 2013. [Google Scholar]
  37. Branco, P.; Francisco, D.; Chambon, C.; Hébraud, M.; Arneborg, N.; Almeida, M.G.; Caldeira, J.; Albergaria, H. Identification of novel GAPDH-derived antimicrobial peptides secreted by Saccharomyces cerevisiae and involved in wine microbial interactions. Appl. Microbiol. Biotechnol. 2014, 98, 843–853. [Google Scholar] [CrossRef] [PubMed] [Green Version]
  38. Branco, P.; Francisco, D.; Monteiro, M.; Almeida, M.G.; Caldeira, J.; Arneborg, N.; Prista, C.; Albergaria, H. Antimicrobial properties and death-inducing mechanisms of saccharomycin, a biocide secreted by Saccharomyces cerevisiae. Appl. Microbiol. Biotechnol. 2017, 101, 159–171. [Google Scholar] [CrossRef] [PubMed]
  39. Livingstone, B.P.J.; Victor, P.A. Yeast for Fermentation. Patent WO/2011/035392, 31 March 2011. Available online: https://www.freepatentsonline.com/WO2011035392.html (accessed on 12 February 2021).
  40. Pérez-Nevado, F.; Albergaria, H.; Hogg, T.; Gírio, F. Cellular death of two non-Saccharomyces wine-related yeasts during mixed fermentations with Saccharomyces cerevisiae. Int. J. Food Microbiol. 2006, 108, 336–345. [Google Scholar]
  41. Fry, J.C. One-Way Analysis of Variance in Biological Data Analysis: A Practical Approach, 1st ed.; Oxford University Press: Oxford, UK, 1993; pp. 1–39. [Google Scholar]
  42. Branco, P.; Coutinho, R.; Malfeito-Ferreira, M.; Prista, C.; Albergaria, H. Wine Spoilage Control: Impact of Saccharomycin on Brettanomyces bruxellensis and Its Conjugated Effect with Sulfur Dioxide. Microorganisms 2021, 9, 2528. [Google Scholar] [CrossRef]
  43. Hnasko, R.; Lin, A.; McGarvey, J.A.; Stanker, L.H. A rapid method to improve protein detection by indirect ELISA. Biochem. Biophys. Res. 2011, 410, 726–731. [Google Scholar] [CrossRef]
  44. Branco, P.; Sabir, F.; Diniz, M.; Carvalho, L.; Albergaria, H.; Prista, C. Biocontrol of Brettanomyces/Dekkera bruxellensis in alcoholic fermentations using saccharomycin-overproducing Saccharomyces cerevisiae strains. Appl. Microbiol. Biotechnol. 2019, 103, 3073–3083. [Google Scholar] [CrossRef]
  45. Stanley, G.A.; Hobley, T.J.; Pamment, N.B. Effect of acetaldehyde on Saccharomyces cerevisiae and Zymomonas mobilis subjected to environmental shocks. Biotechnol. Bioeng. 1997, 53, 71–78. [Google Scholar] [CrossRef]
  46. Birch, R.M.; Walker, G.M. Influence of magnesium ions on heat shock and ethanol stress responses of Saccharomyces cerevisiae. Enzym. Microb. Technol. 2000, 26, 678–687. [Google Scholar] [CrossRef]
  47. Rozpędowska, E.; Hellborg, L.; Ishchuk, O.P.; Orhan, F.; Galafassi, S.; Merico, A.; Woolfit, M.; Compagno, C.; Piskur, J. Parallel evolution of the make-accumulate-consume strategy in Saccharomyces and Dekkera yeasts. Nat. Commun. 2011, 2, 302. [Google Scholar] [CrossRef] [PubMed]
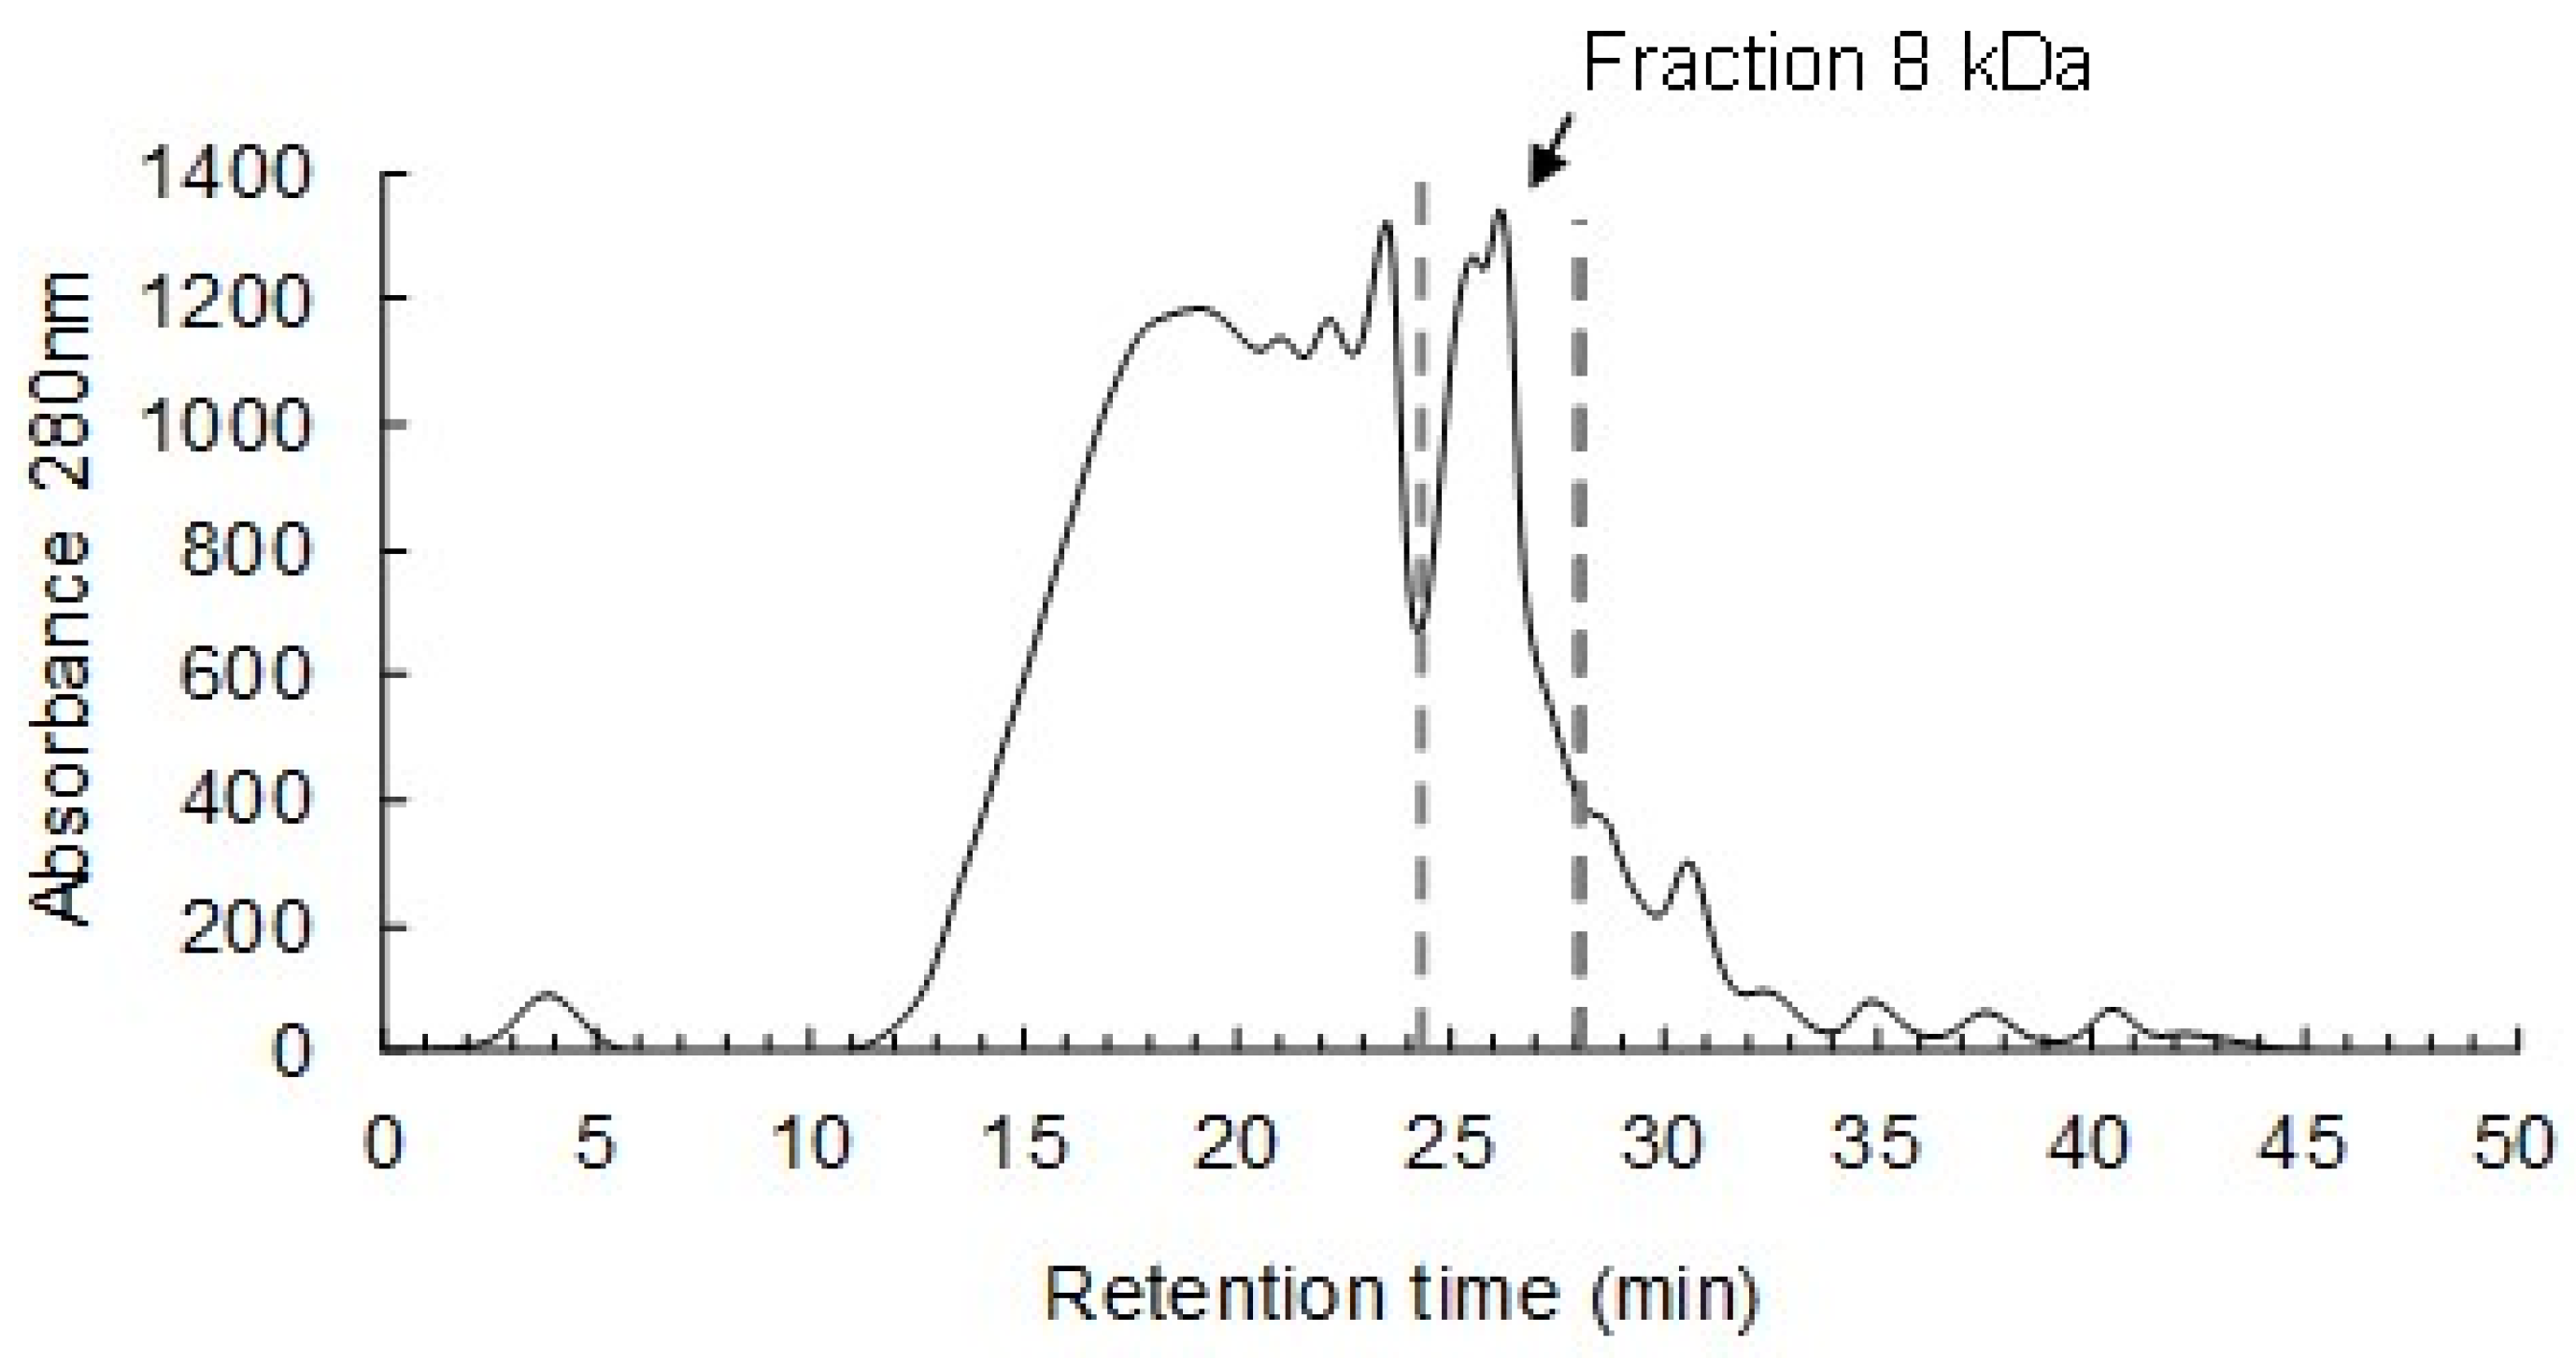
Figure 1. Gel filtration chromatographic profile of the 2–10 kDa peptidic fraction of the 7-day old supernatant from S. cerevisiae ER fermentation.
Fermentation 08 00233 g001
Figure 2. Culturability of S. cerevisiae ER and B. bruxellensis (Bb) during alcoholic fermentations performed with Bb strains ISA 1649 (A,B), ISA 1700 (C,D) and ISA 1791 (E,F) in mixed-culture with S. cerevisiae ER (A,C,E) and in single-culture (B,D,F). Data represented correspond to means ± SD (error bars) of two independent biological assays.
Fermentation 08 00233 g002
Figure 3. Culturability of S. cerevisiae ER and B. bruxellensis (Bb) during alcoholic fermentations performed with Bb strains ISA 2104 (A,B), ISA 2116 (C,D) and ISA 2211 (E,F) in mixed-culture with S. cerevisiae ER (A,C,E) and in single-culture (B,D,F). Data represented correspond to means ± SD (error bars) of two independent biological assays.
Fermentation 08 00233 g003
Figure 4. Culturability (A,C,E), glucose consumption and lactic acid production (B,D,F) during growth assays performed with L. brevis (A,B), L. hilgardii (C,D) and L. plantarum (E,F), inoculated in a cell-free supernatant pre-fermented by S. cerevisiae ER without any treatment (biocontrol assay) and after a pepsin treatment (pepsin assay). Data represented correspond to means ± SD (error bars) of two independent biological assays.
Fermentation 08 00233 g004
Figure 5. Culturability (A,C,D), glucose consumption and lactic acid production (B,D,F) during growth assays performed with L. mesenteroides subsp. cremoris (A,B), P. parvulus (C,D) and P. pentosaceus (E,F) inoculated in a cell-free supernatant pre-fermented by S. cerevisiae ER without any treatment (biocontrol assay) and after a pepsin treatment (pepsin assay). Data represented correspond to means ± SD (error bars) of two independent biological assays.
Fermentation 08 00233 g005
Figure 6. Tandem Mass Spectrometry spectra processed and analyzed using ProteinPilot™ software, of two Glyceraldehyde-3-phosphate dehydrogenase (GAPDH) derived peptides found in fraction 8 kDa obtained from S. cerevisiae ER fermentation supernatants. (a) peptide amino acids sequence ISWYDNEYGYSAR; (b) peptide amino acids sequence VSWYDNEYGYSTR.
Fermentation 08 00233 g006
Table 1. Sugars consumption during alcoholic fermentations performed with the B. bruxellensis strains ISA 1649, ISA 1700, ISA 1791, ISA 2101, ISA 2116 and ISA 2211 in single- and in mixed-culture with S. cerevisiae Ethanol Red (ER). Data presented correspond to means ± SD of two independent biological assays, each analyzed in triplicate.
Time (Days)Sugars Concentration (g/L) in Single- and in Mixed-Culture Fermentations
Single
ISA 1649
Mixed Sc/ISA 1649Single
ISA 1700
Mixed ER/ISA 1700Single
ISA 1791
Mixed ER/ISA 1791Single
ISA 2104
Mixed ER/ISA 2104Single
ISA 2116
Mixed ER/ISA 2116Single
ISA 2211
Mixed ER/ISA 2211
0219.40 ± 1.5222.5 ± 0.3228.9 ± 5.2222.5 ± 0.3218.2 ± 3.9222.5 ± 0.3235.3 ± 6.2222.5 ± 0.3225.9 ± 1.6222.5 ± 0.3243.3 ± 0.8222.5 ± 0.3
1216.5 ± 5.7162.9 ± 6.6222.2 ± 4.5180.8 ± 8.8212.1 ± 1.6197.8 ± 5.9221.3 ± 6.3198.9 ± 0.2215.0 ± 2.4195.8 ± 4.5221.8 ± 0.5189.5 ± 2.8
2209.5 ± 3.959.8 ± 1.6218.6 ± 0.758.8 ± 2.4209.5 ± 1.061.5 ± 4.4220.2 ± 0.751.3 ± 0.0210.8 ± 4.168.7 ± 6.6221.5 ± 0.558.9 ± 0.7
3208.9 ± 3.315.1 ± 2.2216.6 ± 3.210.8 ± 1.1210.0 ± 1.017.7 ± 1.2218.8 ± 0.319.5 ± 4.2199.4 ± 7.49.4 ± 0.3221.0 ± 0.414.2 ± 0.6
4-5.4 ± 0.2168.9 ± 5.88.2 ± 0.5-6.8 ± 0.5-8.0 ± 1.4-8.0 ± 0.0195.0 ± 9.07.9 ± 1.4
6163.0 ± 15.4---201.3 ± 6.9-210.6 ± 1.3-187.8 ± 7.1---
7144.3 ± 7.64.8 ± 0.4146.9 ± 4.87.9 ± 0.0157.0 ± 1.34.8 ± 0.3203.5 ± 9.24.2 ± 0.2148.9 ± 8.10.55 ± 0.1157.0 ± 9.20.3 ± 0.0
8123.3 ± 9.6-139.1 ± 2.9 139.3 ± 1.6-183.1 ± 0.4-139.3 ± 5.7-143.0 ± 10.9-
9--- 110.3 ± 4.0-177.2 ± 2.5-112.3 ± 9.6---
10107.9 ± 6.74.5 ± 1.6125.9 ± 3.92.0 ± 0.0102.5 ± 4.80.6 ± 0.2173.1 ± 1.90.6 ± 0.091.4 ± 1.70.27 ± 0.075.48 ± 4.40.2 ± 0.0
Table 2. Ethanol production during alcoholic fermentations performed with the B. bruxellensis strains ISA 1649, ISA 1700, ISA 1791, ISA 2101, ISA 2116 and ISA 2211 in single-culture and in mixed-culture with S. cerevisiae Ethanol Red (ER). Data presented correspond to means ± SD of two independent biological assays, each analyzed in triplicate.
Time (Days)Ethanol Concentration (g/L) in Single- and in Mixed-Culture Fermentations
Single
ISA 1649
Mixed
ER/ISA 1649
Single
ISA 1700
Mixed
ER/ISA 1700
Single
ISA 1791
Mixed
ER/ISA 1791
Single
ISA 2104
Mixed
ER/ISA 2104
Single
ISA 2116
Mixed
ER/ISA 2116
Single
ISA 2211
Mixed
ER/ISA 2211
0000000000000
1016.7 ± 1.00.9 ± 0.120.9 ± 1.2022.2 ± 3.2021.8 ± 0.4021.2 ± 1.8017.8 ± 0.5
2067.0 ± 11.52.9 ± 0.182.7 ± 16.4069.4 ± 15.6067.2 ± 0.0075.6 ± 2.4074.9 ± 0.6
3080.9 ± 17.23.0 ± 0.287.5 ± 13.2084.7 ± 14073.9 ± 2.6093.1 ± 11.41.2 ± 0.196.4 ± 9.9
4-93.0 ± 9.04.4 ± 0.199.8 ± 3.9-92.0 ± 7.4-85.0 ± 1.6-110.4 ± 0.02.9 ± 0.197.3 ± 8.1
613.7 ± 3.5---12.8 ± 2.3-6.2 ± 0.4-8.7 ± 2.1---
722.6 ± 3.296.4 ± 8.812.1 ± 0.6104.6 ± 5.822.6 ± 0.299.8 ± 1.29.0 ± 0.996.7 ± 2.214.0 ± 4.1103.4 ± 2.012.6 ± 0.797.8 ± 2.0
829.6 ± 1.896.9 ± 8.417.0 ± 0.2109.1 ± 1031.2 ± 1.5101.6 ± 3.08.8 ± 0.1101.5 ± 1.633.5 ± 2.0102.2 ± 2.432.2 ± 3.398.14 ± 3.2
946.6 ± 5.296.3 ± 7.0-109.6 ± 1036.3 ± 1.2100.7 ± 2.111.0 ± 0.5100.6 ± 0.643.2 ± 4.7102.1 ± 1.4-98.5 ± 2.3
1049.9 ± 2.396.2 ± 5.022.8 ± 3.5109.1 ± 1044.7 ± 2.5100.7 ± 2.014.9 ± 0.8101.9 ± 1.647.7 ± 2.098.9 ± 0.640.5 ± 7.799.9 ± 4.6
Table 3. Minimum inhibitory concentration (MIC), half-inhibitory concentration (IC50) and biocidal effect (determined as Log of [CFU/mL] reduction) of fraction 8 kDa determined against six B. bruxellensis strains.
B. bruxellensis StrainsMIC (mg/mL)IC50 (mg/mL)Log of [CFU/mL] Reduction
[Fraction 8 kDa]
1.50 mg/mL2.0 mg/mL
ISA 1649>2.00.450.000.56
ISA 1700>2.00.700.000.03
ISA 17912.00.280.000.06
ISA 21042.00.300.000.18
ISA 21161.500.301.001.50
ISA 22111.500.401.201.81
MIC was defined as the lowest concentration of the fraction 8 kDa that prevents any visible growth (measured by absorbance) of yeast culture; IC50 was defined as the lowest concentration of the fraction 8 kDa that induces a 50% reduction of yeast growth as compared with the control assay (measured by absorbance). Log of [CFU/mL] reduction corresponds to the number of logarithms (Log) that cell density [CFU/mL] decreased in the fraction 8 kDa assay, from an initial value of 105 CFU/mL to a final value determined when the respective control assay reached the stationary growth phase.
Table 4. Minimum inhibitory concentration (MIC), half-inhibitory concentration (IC50) and biocidal effect (Log of [CFU/mL] reduction) of fraction 8 kDa determined against six lactic acid bacteria species.
Lactic Acid BacteriaMIC (mg/mL)IC50 (mg/mL)LOG of [CFU/mL] Reduction
[Fraction 8 kDa]
2.0 mg/mL
L. brevis ISA 4385>2.01.71-
L. hilgardii ISA 43872.01.701.16
L plantarum ISA 43952.01.501.06
L. mesenteroides subsp. cremoris ISA 43832.01.170.67
P. parvulus ISA 44012.01.201.90
P. pentosaceus ISA 4379>2.01.580.22
MIC was defined as the lowest concentration of the fraction 8 kDa that prevents any visible growth (measured by absorbance) of yeast culture; IC50 was defined as the lowest concentration of the fraction 8 kDa that induces a 50% reduction of LAB growth as compared with the control assay (measured by absorbance). Log of [CFU/mL] reduction corresponds to the number of logarithms (Logs) that cell density [CFU/mL] decreased in the fraction 8 kDa assay, from an initial value of 105 CFU/mL to a final value determined when the respective control assay reached the stationary growth phase.
Publisher’s Note: MDPI stays neutral with regard to jurisdictional claims in published maps and institutional affiliations.