Article

Assessing Hydrolyzed Gluten Content in Dietary Enzyme Supplements Following Fermentation

1
Deerland Ireland R&D Ltd., Food Science Buiding, University College Cork, T12 YT20 Cork, Ireland
2
Deerland Probiotics and Enzymes, 3800 Cobb International Boulevard, Kennesaw, GA 30152, USA
3
Shannon Applied Biotechnology Centre, Munster Technological University, T12 P928 Cork, Ireland
*
Authors to whom correspondence should be addressed.
These authors contributed equally to this work.
Fermentation 2022, 8(5), 203; https://doi.org/10.3390/fermentation8050203
Submission received: 11 April 2022 / Revised: 26 April 2022 / Accepted: 27 April 2022 / Published: 29 April 2022
(This article belongs to the Special Issue Applied Microorganisms and Industrial/Food Enzymes)

Abstract

:
Partially digested gluten fragments from grains including wheat, rye, spelt and barley are responsible for triggering an inflammatory response in the intestinal tract of Celiac Disease (CD) and Non-Celiac Gluten Sensitive (NCGS) individuals. Fermentation is an effective method to metabolize gluten, with enzymes from bacterial or fungal species being released to help in this process. However, the levels of gluten in commercially available enzymes, including those involved in gluten fermentation, are unknown. In this study we investigated gluten levels in commercially available dietary enzymes combined with assessing their effect on inflammatory response in human cell culture assays. Using antibodies that recognize different gluten epitopes (G12, R5, 2D4, MloBS and Skerritt), we employed ELISA and immunoblotting methodologies to determine gluten content in crude gluten, crude gliadin, pepsin-trypsin digested gluten and a selection of commercially available enzymes. We further investigated the effect of these compounds on inflammatory response in immortalized immune and intestinal human cell lines, as well as in peripheral blood mononuclear cells (PBMCs) from coeliac individuals. All tested supplemental enzyme products reported a gluten concentration that was equivalent to or below 20 parts per million (ppm) as compared with an intact wheat reference standard and a pepsin-trypsin digested standard. Similarly, the inflammatory response to IL-8 and TNF-α inflammatory cytokines in mammalian cell lines and PBMCs from coeliac individuals to the commercial enzymes was not significantly different to 20 ppm of crude gluten, crude gliadin or pepsin-trypsin digested gluten. This combined approach provides insight into the extent of gluten breakdown in the fermentation process and the safety of these products to gluten-sensitive individuals.

1. Introduction

Various food products including breads, cereals, beer, pasta, sauces and beverages as well as cosmetic and skincare products utilize gluten-containing grains in their manufacturing processes [1]. For some of these products, gluten can be reduced using wheat starch or wheat that has had the gluten washed out with water. For others, the gluten either cannot be removed, or, like those derived from fermentation, the wheat is used as substrate and broken down by microorganisms to form the final product [1]. During fermentation, enzymes from bacterial or fungal species are released to help in this process, and it has been suggested that fermentation and enzymatic hydrolysis hold the most potential to create novel hypo-/nonallergenic wheat products [1]. Bacterial species have a broad capacity to catabolize different carbohydrates, proteins and lipids as sources of energy. Their ability to break down these source substrates is mediated by enzymes whose expression is under tight regulation by promoter sequences in its genome that are activated by the presence of the source substate and its degradation products [2]. Ironically, removing the target substrate (gluten) from the fermentation process dramatically reduces the yield of enzymes required for the catabolism of the substrate (gluten), as the promoter regions of the genome that are responsible for the enzyme production are not activated in the bacteria [3,4]. Furthermore, many more supplemental enzymes including lipases, cellulases, proteases, peptidases and enzymes involved in carbohydrate degradation similarly have promoter regions that are responsive to wheat to stimulate their production. These enzymes have demonstrated health benefits in a number of important disciplines across the lifespan including digestion [5,6,7,8], cardiovascular health [9,10], exercise [11] and food intolerances [12,13,14,15,16]. The ability to use wheat as a starting substrate in the fermentation process but to have minimal gluten content is paramount for making efficacious products that can be used by a wide variety of consumers.
Celiac disease (CD) is a chronic autoimmune disorder characterized by fatigue, nausea and a range of gastrointestinal discomfort and complications initiated by exposure to dietary gluten. While CD affects 1 in 141 people in the United States [17,18], non-coeliac gluten sensitivity (NCGS) is thought to be much more prevalent, varying between 1–13% of the population [19]. Gluten is a mixture of complex proteins called gliadins and glutenins, rich in prolines and glutamines that are difficult to digest by intestinal enzymes [20]. This leads to a partial digestion of gluten proteins, generating immunogenic peptides that trigger an inflammatory response in the intestinal tract of CD and NCGS individuals. This recurring immune response to partially digested gluten fragments causes weakening of the integrity of the intestinal lining and shrinking of intestinal villi, causing difficulties in nutrient absorption and allowing gluten fragments to penetrate further into the body [21,22,23,24], leading to the associated symptoms. Currently, the only effective treatment for the alleviation of the gastointestinal symptoms in CD and NCGS is a strict, gluten-free diet [19] whereby the absence of immunogenic gluten-derived peptides allows for the healing of the intestinal barrier [25,26] and the resolution of symptoms.
The FDA defines the term ‘gluten-free’ as products that are not made with any gluten-containing grains or that have been refined to remove the gluten. To meet this criteria, refined products must be tested to show they contain less than 20 ppm of gluten. However, the recent ruling on gluten-free labeling of fermented foods by the FDA states that, since no appropriate test currently exists to quantify gluten in hydrolyzed matrices, they may not be labeled as gluten-free. This decision was based on the difficulty of quantifying levels of gluten-derived immunogenic peptides at the end point of the fermentation process, highlighting the importance of developing better or complementary methods to accurately quantitate gluten peptides and their immunogenic properties in these products [27]. A potential, unintended effect of this ruling from the FDA is the elimination of the gluten-free labeling of supplemental enzymes, including those taken by gluten-sensitive individuals in order to reduce gluten content from food and reduce symptoms [15,28,29].
Current competitive ELISA quantification of fermented gluten needs to be adapted to accurately identify the range of gluten peptides produced during the fermentation of gluten, as it varies across different grains, fermentation organisms and fermentation processes [30]. Moreover, it has yet to be shown that these specific peptides from these fermentation processes can elicit an immune response below 20 ppm as specified by the FDA guidance. These differences in gluten peptide compositions cause a lack of correlation with the calibration methods used in competitive ELISA, leading to inaccurate quantitation and subsequent immunogenicity measurements [31]. Additionally, some small peptides may not interact with the individual antibody used in the competitive ELISA, remaining undetected and potentially causing the same physiological effects for a gluten-sensitive individual. Therefore, multiple antibody testing techniques and a complementary detection method based on cell culture response to digested gluten should be used to determine the effects of such molecules. In this study, the gluten concentration in supplemental enzymes preferentially synthesized during gluten fermentation was assessed using multiplex ELISA and immunoblots using antibodies targeting multiple epitopes to assess gluten digestion. A reference pepsin-trypsin hydrolyzed gluten was assessed alongside the supplemental enzymes using these methodologies to determine gluten content and peptide profile. Finally, the potential immune response elicited by pepsin-trypsin hydrolyzed gluten and supplemental enzymes was investigated in immortalized immune and intestinal human cell lines, as well as in peripheral blood mononuclear cells (PBMCs) from coeliac individuals and compared with crude gliadin or crude gluten at a concentration of 20 ppm. This study adapts a proactive approach to addressing the outlined concerns of the limitations of quantifying gluten-derived products as they pertain to supplemental enzymes by utilizing a multiplex ELISA approach first published by Panda et al., 2017, combined with human cell culture models to assess immunopathogenic response [32].

2. Materials and Methods

2.1. Materials

All materials, unless otherwise stated, were purchased from Sigma-Aldrich (Atlanta, GA, USA and Arklow, Wicklow, Ireland). All buffers and solutions were prepared with Milli-Q water (resistivity 18.2 MΩ, Merck Millipore, Saint-Quentin-Fallavier, France).

2.2. Preparation of Samples for Multiplex and Immunoblotting

To prepare samples for ELISA and Immunoblotting, stock solutions of 100 mg/mL were prepared in 60% ethanol to solubilize gliadins and boiled for 20 min to remove residual enzyme activity. Samples were cooled to room temperature in an ice bath and centrifuged for 10 min at 5000 rpm before being further diluted for analysis.

2.3. Hydrolysis of Gluten Using Pepsin and Trypsin Complex

Gluten hydrolysis using the sequential catalyzation of pepsin and trypsin was conducted based on the method of Rio et al. 2021 [33]. The pepsin and trypsin complexes were provided by Deerland Enzymes and Probiotics and used in the enzyme-to-substrate ratio, 1:20 (w/w), during the hydrolysis procedure. To acidify the gluten, powdered gluten from wheat was added to 0.1 M sodium phosphate buffer (pH 2.0) to a final concentration of 20 mg/mL and was incubated at 37 °C on a rotating rocker at 150 rpm for 30 min. Pepsin (10,000 FCC Units/mg) was added into the acidified gluten suspension (10 mg/mL), and the mixture was incubated at 37 °C on a rotating rocker at 150 rpm for 3 h. An equal volume of 0.1 M sodium phosphate buffer (pH 8.0) was added to pepsin-gluten mixture, and the pH was increased to 8.0 using 50% NaOH. The trypsin complex (2500 USP Units/mg) was then added at 0.5 mg/mL. The mixture was incubated at 37 °C on a rotating rocker at 80 rpm overnight and boiled for 30 min to denature both enzymes. A sample was taken during each step, diluted to a 5% or 10% concentration (v/v) in 60% ethanol (to a final concentration of gluten at 0.5 or 1 mg/mL) and boiled for 10 min for the further analysis in ELISA and immunoblot.
In parallel, the PT-digested gluten was prepared for cell culture work based on the above preparation with minor variation. After the sample was diluted to 10% concentration (v/v) in 60% ethanol, the precipitation and concentration of PT-digested gluten was conducted using acetone based on the protocol of Thermo Scientific (See Appendix A): 4 parts cold acetone (−20 °C) were added to 1 part sample, vortexed and incubated at −20 °C overnight. The samples were then centrifuged at 3000 rpm for 30 min, the supernatant was discarded and the acetone was evaporated for one hour at room temperature to leave a PT-digested gluten pellet.

2.4. Multiplex Competitive ELISA

The antibodies and dilutions used for multiplex ELISA and immunoblotting are found below in Table 1.
The multiplex competitive ELISA for gluten detection were performed based on a competitive ELISA protocol [32].
Microtiter plate wells were coated with either 10 µg/mL or 20 μg/mL gluten antigen. The ELISAs coated with 10 µg/mL antigen were used for Gtox-G12, A-G12, R5Comp, V10-R5, V80-GL, MI-GL or ALLSK, while the ELISAs with 20 μg/mL gluten antigen were for R5Sand or 2D4. To prepare the antigen, a solution of 1 mg/mL wheat gluten was prepared in phosphate buffer (PBS) containing 0.1% Tween®20, rotated overnight at room temperature and then diluted in 1× coating buffer (pH 9.6, Appendix A) to a final concentration of 10 or 20 µg/mL. The coated plates were incubated overnight at room temperature in the dark. The plates were washed three times with wash buffer (PBS containing 0.05% Tween®20) and then wells were blocked with 150 µL/well with blocking buffer (PBS containing 1% bovine serum albumin) at 37 °C for one hour. The plates were washed an additional four times with the wash buffer after blocking.
A gluten standard (1 mg/mL) from wheat standard was prepared following the same preparation listed above and then diluted in UD buffer (105 mM sodium phosphate, 75 mM NaCl, 2% BSA, 0.05% Tween 20, pH 7.4) to generate serial 1:3 dilutions starting at 10 mg/L (10, 3.33, 1.11, 0.37, 0.12, 0.041 and 0 ppm) for ELISA standards [6]. Antibodies were diluted using PBS buffer, as indicated in Table 1. A total of 110 μL of diluted antibody-HRP conjugates and 110 μL of either gluten standards or samples were mixed at 37 °C for one hour at 50 rpm on a rotating rocker. Then, 100 μL of each mixture was transferred to the coated wells in duplicate and incubated at 37 °C for one hour with 50 rpm on a shaker. After washing the plate four times with the wash buffer, 100 μL of the 3,3′,5,5′-tetramethylbenzidine (TMB) substrate was added in each well and incubated at RT for 30 min in the dark. The reaction was stopped by the addition of 50 µL of 0.2 M sulfuric acid to each well followed by the measurement of absorbance at 450 nm using a microplate reader (Bio-Rad model 680). The ELISA performance and measurements were conducted in triplicate with duplicated samples for each trial.

2.5. Immunoblot Using Automated Capillary Electrophoretic-Based Immunoassays

Immunoblotting was performed using the Wes™ (WS-2450), capillary electrophoretic immunoassay with 12–230 kDa pre-filled plates, capillary cartridges and reagents from ProteinSimple (San Jose, CA, USA). The procedure and preparation of reagents including sample buffer for diluents, 5× fluorescent master mix, biotinylated ladder and luminol-S in peroxide were based on the protocol of Wes™ and Nelson 2017 [34].
Two sets of standards were prepared by serial dilution of the extracted 1 mg/mL wheat gluten with the provided 0.1× sample buffer, generating 50, 25, 20, 5 and 0 and 10, 3.33, 1.11, 0.37, 0.12 and 0 mg/L to measure high or low gluten concentration in a sample. All test samples were diluted to a final concentration of 1:200 with 0.1× sample buffer. Additionally, 5× fluorescent master mix was added to each standard or sample and incubated at 75 °C for 10 min. The combinations were briefly vortexed and centrifuged after cooling down on an ice bath [34]. The HRP-conjugated antibodies were diluted with antibody diluent 2, as detailed in Table 1. All prepared reagents, serial standards, diluted samples and antibodies were dispensed into the assay plate into the corresponding well with the volume, as stated in the protocol [34]. The capillary cartridges and assay plates were inserted, and after approximately 3-h running in Wes™, the peak values of samples and standards were analyzed by Compass for SW (ver. 6.0) (see Appendix A). For both ELISA and immune assays, the standard curves were constructed, and the gluten concentration in samples was calculated using the four-parameter logistic curve of the online tool available at ATTBioquest (Sunnyvale, CA, USA) (see Appendix A).

2.6. Preparation of Gluten and Gliadin and PT-Digested Gluten for Cell Culture

Water-soluble fractions of crude gluten and gliadin were prepared by the salt-induced disaggregation method [35], with some modifications. Briefly, 2 g of gluten and gliadin (Sigma, Ronkonkoma, NY, USA) were suspended in 50 mL 2% NaCl solution and stirred using a magnetic stirrer for 5 min at 250 rpm. The liquid was discarded, and washing rounds in 50 mL 2% NaCl solution were repeated four more times. Residual salt was removed by one round of washing with 50 mL 0.2% NaCl followed by one round of washing with 50 mL dH2O (exposure time was reduced to 30 s). Ten milliliters of serum-free media (either MEM or RPMI) were added to the washed gluten and gliadin and stirred with a magnetic stirrer for four hours. The resulted suspensions were transferred to falcon tubes and centrifuged for 5 min at 6000× g. The supernatants were filter-sterilized using syringe-mounted filters with a 0.45 µm pore diameter (Thermo-Fisher, Dublin, Ireland). Total protein concentration was determined by a Bicinchoninic Acid Protein Assay Kit (Sigma), with serum-free MEM or RPMI media used as blank samples. Fetal bovine serum, glutamine, non-essential amino and antibiotics (as below for cell culture experiments) were added to gluten and gliadin dissolved in MEM or RPMI to obtain full culture media, containing 1 mg/mL of wheat storage proteins. The PT-Gluten was prepared as described earlier. Prior to use, the PT-digested gluten was prepared by suspending in serum-free culture media (either MEM for Caco-2 work or RPMI for THP-1 cells) to either 20 ppm (20 mg/L) or 500 ppm (500 mg/L).

2.7. Preparation of Supplemental Enzymes for Cell Culture

Freeze-dried samples of supplemental enzymes were weighed in 15 mL falcon tubes, prediluted in serum free RPMI medium to a concentration of 10,000 ppm (10 g/L) and boiled for 10 min at 100 °C to inactivate the enzymes. After that, the tubes were placed on ice for 20 min. Sediment formed during manipulations was removed by centrifugation (6000 rpm, 10 min). Enzymes preparations were immediately taken for THP-1 cells treatment and adjusted to 20 ppm (20 mg/L) prior to cell work, as described below.

2.8. Cell Culture

The human colorectal adenocarcinoma cell line Caco-2 and the human monocytic cell line THP-1 were obtained from the DSMZ-German Collection of Microorganisms and Cell Cultures. All Caco-2 cell line work was performed by Shannon ABC (Munster Technological University). Cells were propagated using the standard technique in a 5% CO2 atmosphere at 37 °C. Caco-2 were cultured in Minimum Essential Medium Eagle supplemented with 10% Fetal Bovine Serum, 2 mM glutamine, 1% non-essential amino acids, 100 U/mL penicillin and 100 µg/mL streptomycin (MEM and FBS—Sigma, additives—Lonza, Manchester, UK). THP-1 cells were grown in RPMI 1640 media supplemented with 2 mM L-glutamine, 10% Fetal Bovine Serum, 100 U/mL penicillin and 100 µg/mL streptomycin (full media).

2.9. Treatment Scheme

Prior to experiment, 5 × 10⁵ THP-1 cells were transferred into 1.5 mL Eppendorf tubes and centrifuged at 150× g for 15 min. The culture medium was discarded, and the cells were resuspended in full media containing 20 ppm and 500 ppm of gluten, gliadin and PT-digested gluten and 20 ppm supplemental enzyme preparations. Four hours after stimulation, the cells were harvested by centrifugation (8000× g for 5 min), lysed by adding 300 µL of Lysis buffer (Monarch Total RNA Miniprep Kit, New England Biolabs, NEB) and stored at −80 °C for further PCR analysis. In a parallel experiment, culture supernatants were collected 18 h after stimulation and stored at −80 °C until further analysis for protein concentrations.
Caco-2 cells were cultured on 48-well plates (Corning) at a density of 3 × 10⁴ cells/well. Prior to experiment, the cells were washed once with DPBS and subjected to 20 ppm and 500 ppm of gluten, gliadin and PT-digested gluten treatment. Four hours after stimulation, cell supernatants were removed and 300 µL of Lysis buffer (Monarch Total RNA Miniprep Kit, New England Biolabs, NEB) was added to the cells, which were then stored at −80 °C for further PCR analysis. In a parallel experiment, 18 h post-treatment, supernatants were collected and stored at −80 °C for subsequent protein determination.

2.10. PBMCs Culture Conditions and Treatment

Peripheral blood mononuclear cells (PBMCs) from the peripheral blood of a healthy donor and a celiac disease patient were purchased from AccuCell®, Bethesda, MA, United States. Upon receipt, the cells were thawed and resuspended in freshly made RPMI 1640 media containing 2 mM L-glutamine, 10% Fetal Bovine Serum, 100 U/mL penicillin, 100 µg/mL streptomycin and 2 µg/mL amphotericin. The cells were cultured for 48 h at a concentration of 1 × 10⁶ cell/mL.
The exposure experiment has been done in the same manner as the THP-1 treatment (see above). Briefly, the cells were centrifuged at 150× g for 15 min and culture media was replaced with media containing 20 ppm and 500 ppm of gluten, gliadin and PT-digested gluten. Forty-eight hours after treatment, cell suspensions were collected and cell culture supernatants were obtained by centrifugation and stored at −80 °C until analysis for IL-8 concentration.

2.11. Cell Viability Assays

The cell viability assays were done using the CyQUANT™ XTT Cell Viability kit (Invitrogen™, Thermo-Fisher, Dublin, Ireland). Twenty-four hours after applying crude gliadin, gluten or the PT-digested samples, THP-1 and Caco-2 cells were stained with 0.3 mg/mL solution of XTT (sodium 3′-[1-(phenylaminocarbonyl)-3,4-tetrazolium]-bis (4-methoxy6-nitro) benzene sulfonic acid hydrate) for 4 h according to the protocol. Absorbance was then measured at 450 and 595 nm.

2.12. RNA Isolation and Quantitative Real-Time PCR Analysis

Total RNA was extracted from cell lysates using the Monarch Total RNA Miniprep Kit (NEB). Reverse transcription reaction was performed using the Luna script RT Supermix kit (NEB). Real-time PCR reactions were set up using pre-made FastStart Universal SYBR Green Master mix and appropriate primer pairs (all primers Table 2 were tested for linearity and amplification efficiency) at a concentration of 200 nM using generated cDNA as a template. The reactions were performed using the following program: initial denaturation 95 °C 5 min, denaturation 94 °C 20 s, annealing 60 °C 20 s, extension 72 °C 20 s (40 cycles). The specificity of reaction products was confirmed by melting temperature analysis (from 70 °C to 95 °C in 0.5 °C/15 s increments). The quantification of target transcripts was done using RPL5 or GAPDH as a normalizing house-keeping gene.

2.13. ELISA Cytokine Determination

The concentrations of IL-8 in cell culture supernatants were determined by sandwich ELISA: Human IL-8/CXCL8 ELISA Kit (RAB0319, Sigma) according to the manufacturer’s instruction.

2.14. Statistical Analysis

All cell culture experiments were performed in two biological replicates and three technical replicates per experiment. The results are expressed as means ± SD. The values were compared using two-way ANOVA with Sidak post-hoc test for inflammatory markers and with one-way ANOVA followed by Dunnett’s post-hoc test for viability assay, and the differences were considered significant where p < 0.05.

3. Results

3.1. Multiplex ELISA and Immunoblotting of Enzyme Fermentation Products

A multiplex ELISA approach was utilized to measure the amount of fermented gluten peptides in the concentrated form of supplemental enzymes in a similar manner to previous publications [32]. All tested supplemental enzyme products reported a gluten concentration that was equivalent to or below 20 ppm (20 mg/L) as compared with an intact wheat reference standard—except for the bacterial protease (Table 3), which we previously showed can interfere with competitive ELISA assays [40]. The wheat input, fermentation broth and final concentrated enzyme products showed a pronounced reduction throughout the fermentation process when tested with the various antibodies from the commercially available gluten detection kits. The composite standard curves (from 0.04 ppm to 10 ppm) can be found in Supplementary Figure S2.
In order to determine if there were any false positives and to create additional data sets for the quantitation of gluten in supplemental enzyme products, a multiplex immunoblotting approach was used (Table 4). Intact gluten standards were again used for calibration, and the banding pattern was used to determine the maximum size in which peaks should be included for quantitation, as some off-target and non-specific banding did occur at higher molecular weights. Similar to the ELISA method, the immunoblotting clearly demonstrates that the concentration of gluten-derived peptides in these supplemental enzyme products is negligible or below 20 ppm, as determined by the pepsin-trypsin digested sample. The individual immunoblots are shown in Supplementary Figures S3 and S4.

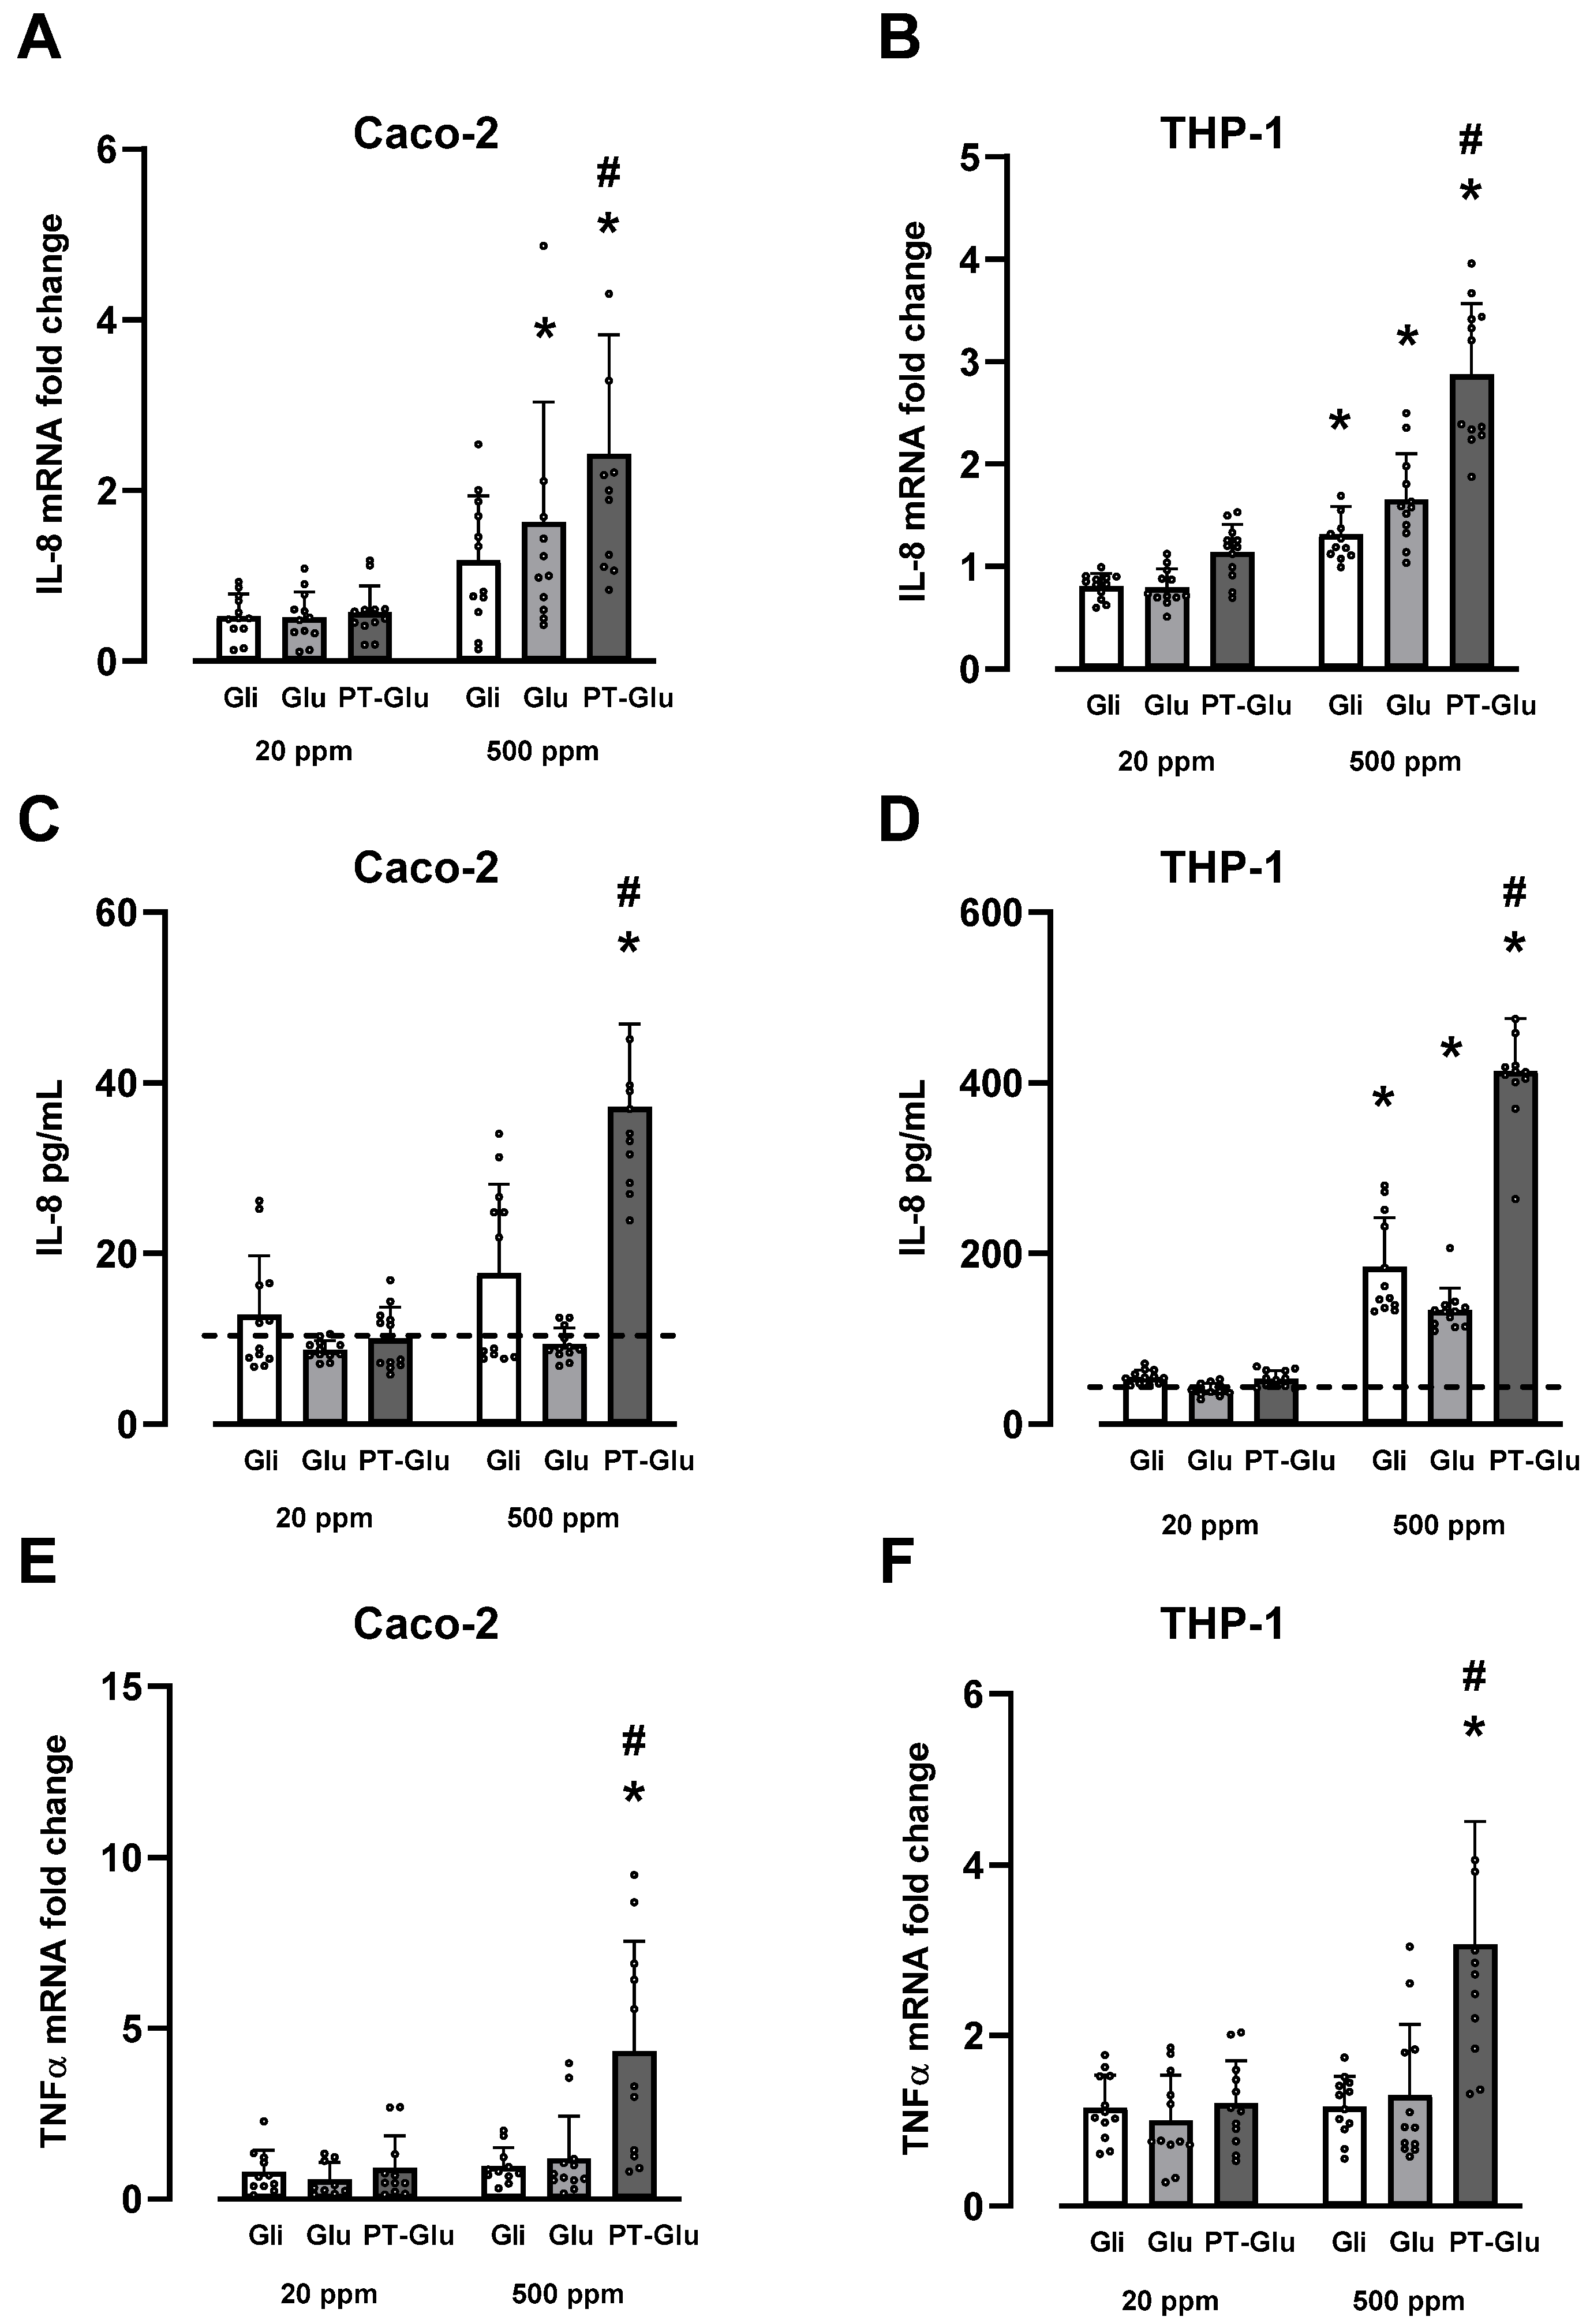
3.2. Effects of Gluten, Gliadin and Digested Gluten Standard on TNF-α and IL-8 Production in THP-1 and Caco-2 Cells

Prior to determining the effects of samples on inflammatory response, the viability of cells after exposure to crude gliadin, crude gluten or PT-digested gluten at 20 ppm (20 mg/L) and 500 ppm (500 mg/L) was assessed using the XTT method (Supplementary Figure S1). It was determined that cells from all groups were viable compared to media controls in Caco-2 (F(6, 47) = 1.742, p = 0.1322) and THP-1 (F(6, 35) = 1.574, p = 0.1839) cell lines.
To compare the pro-inflammatory potential of crude gliadin, crude gluten and pepsin-trypsin digested gluten standard, we assessed their effect on IL-8 and TNF-α production in THP-1 and Caco-2 cell lines (Figure 1). Stimulation with 20 ppm (20 mg/L) of the whole molecules and the digested gluten standard had no effect on the IL-8 mRNA level in either THP-1 or Caco-2 cells (Figure 1A,B). Challenging these mammalian cells with 500 ppm (500 mg/L) increased IL-8 gene expression in gluten and PT-digested gluten groups in Caco-2 and THP-1 cells and in the crude gliadin group in THP-1 cells. This increase in IL-8 mRNA expression was exacerbated in both Caco-2 and THP-1 cells in the PT-digested gluten group. [Dose F(1, 66) = 33.27, p ≤ 0.0001; Treatment F(2, 66) = 3.322, p = 0.0422; Interaction F(2, 66) = 2.830, p = 0.0662 for Caco-2] [Dose F(1, 66) = 132.2, p ≤ 0.0001; Treatment F(2, 66) = 42.62, p ≤ 0.0001; Interaction F(2, 66) = 16.53, p ≤ 0.0001 for THP-1].
Similarly, 20 ppm of crude gliadin, crude gluten and PT-digested gluten standard did not significantly increase IL-8 protein levels in cell culture supernatants (Figure 1C,D) as compared with the control in Caco-2 (F(3, 42) = 1.753, p = 0.171) or THP-1 cells (F(3, 44) = 3.56, p = 0.0715). In Caco-2 cells, there was no significant increase in IL-8 secretion in response to 500 ppm of crude gliadin or crude gluten; however, the increase in protein production was still apparent in the PT-digested gluten group. In THP-1 cells, 500 ppm increased IL-8 levels in in all treatment groups. The IL-8 increase was most prominent in the PT-digested gluten group. [Dose F(1, 66) = 47.58, p ≤ 0.0001; Treatment F(2, 66) = 28.77, p ≤ 0.0001; Interaction F(2, 66) = 27.06, p ≤ 0.0001 for Caco-2] and [Dose F(1, 66) = 511.3, p ≤ 0.0001; Treatment F(2, 66) = 106.4, p ≤ 0.0001; Interaction F(2, 66) = 95.27, p ≤ 0.0001 for THP-1].
There was no significant difference between the PT-digested gluten and crude gliadin or gluten in TNF-α gene expression in either Caco-2 or THP-1 cells at 20 ppm concentration (Figure 1E,F). At 500 ppm, there was no significant increase in TNF-α gene expression in Caco-2 or THP-1 cells in response to either crude gliadin or crude gluten. However, PT-digested gluten significantly increased TNF-α gene expression in both Caco-2 and THP-1 cells. [Dose F(1, 59) = 13.59, p = 0.0005; Treatment F(2, 59) = 9.480, p = 0.0003; Interaction F(2, 59) = 7.340, p = 0.0014 for Caco-2] and [Dose F(1, 66) = 15.95, p = 0.0002; Treatment F(2, 66) = 13.00, p ≤ 0.0001; Interaction F(2, 66) = 10.03, p = 0.0002 for THP-1].

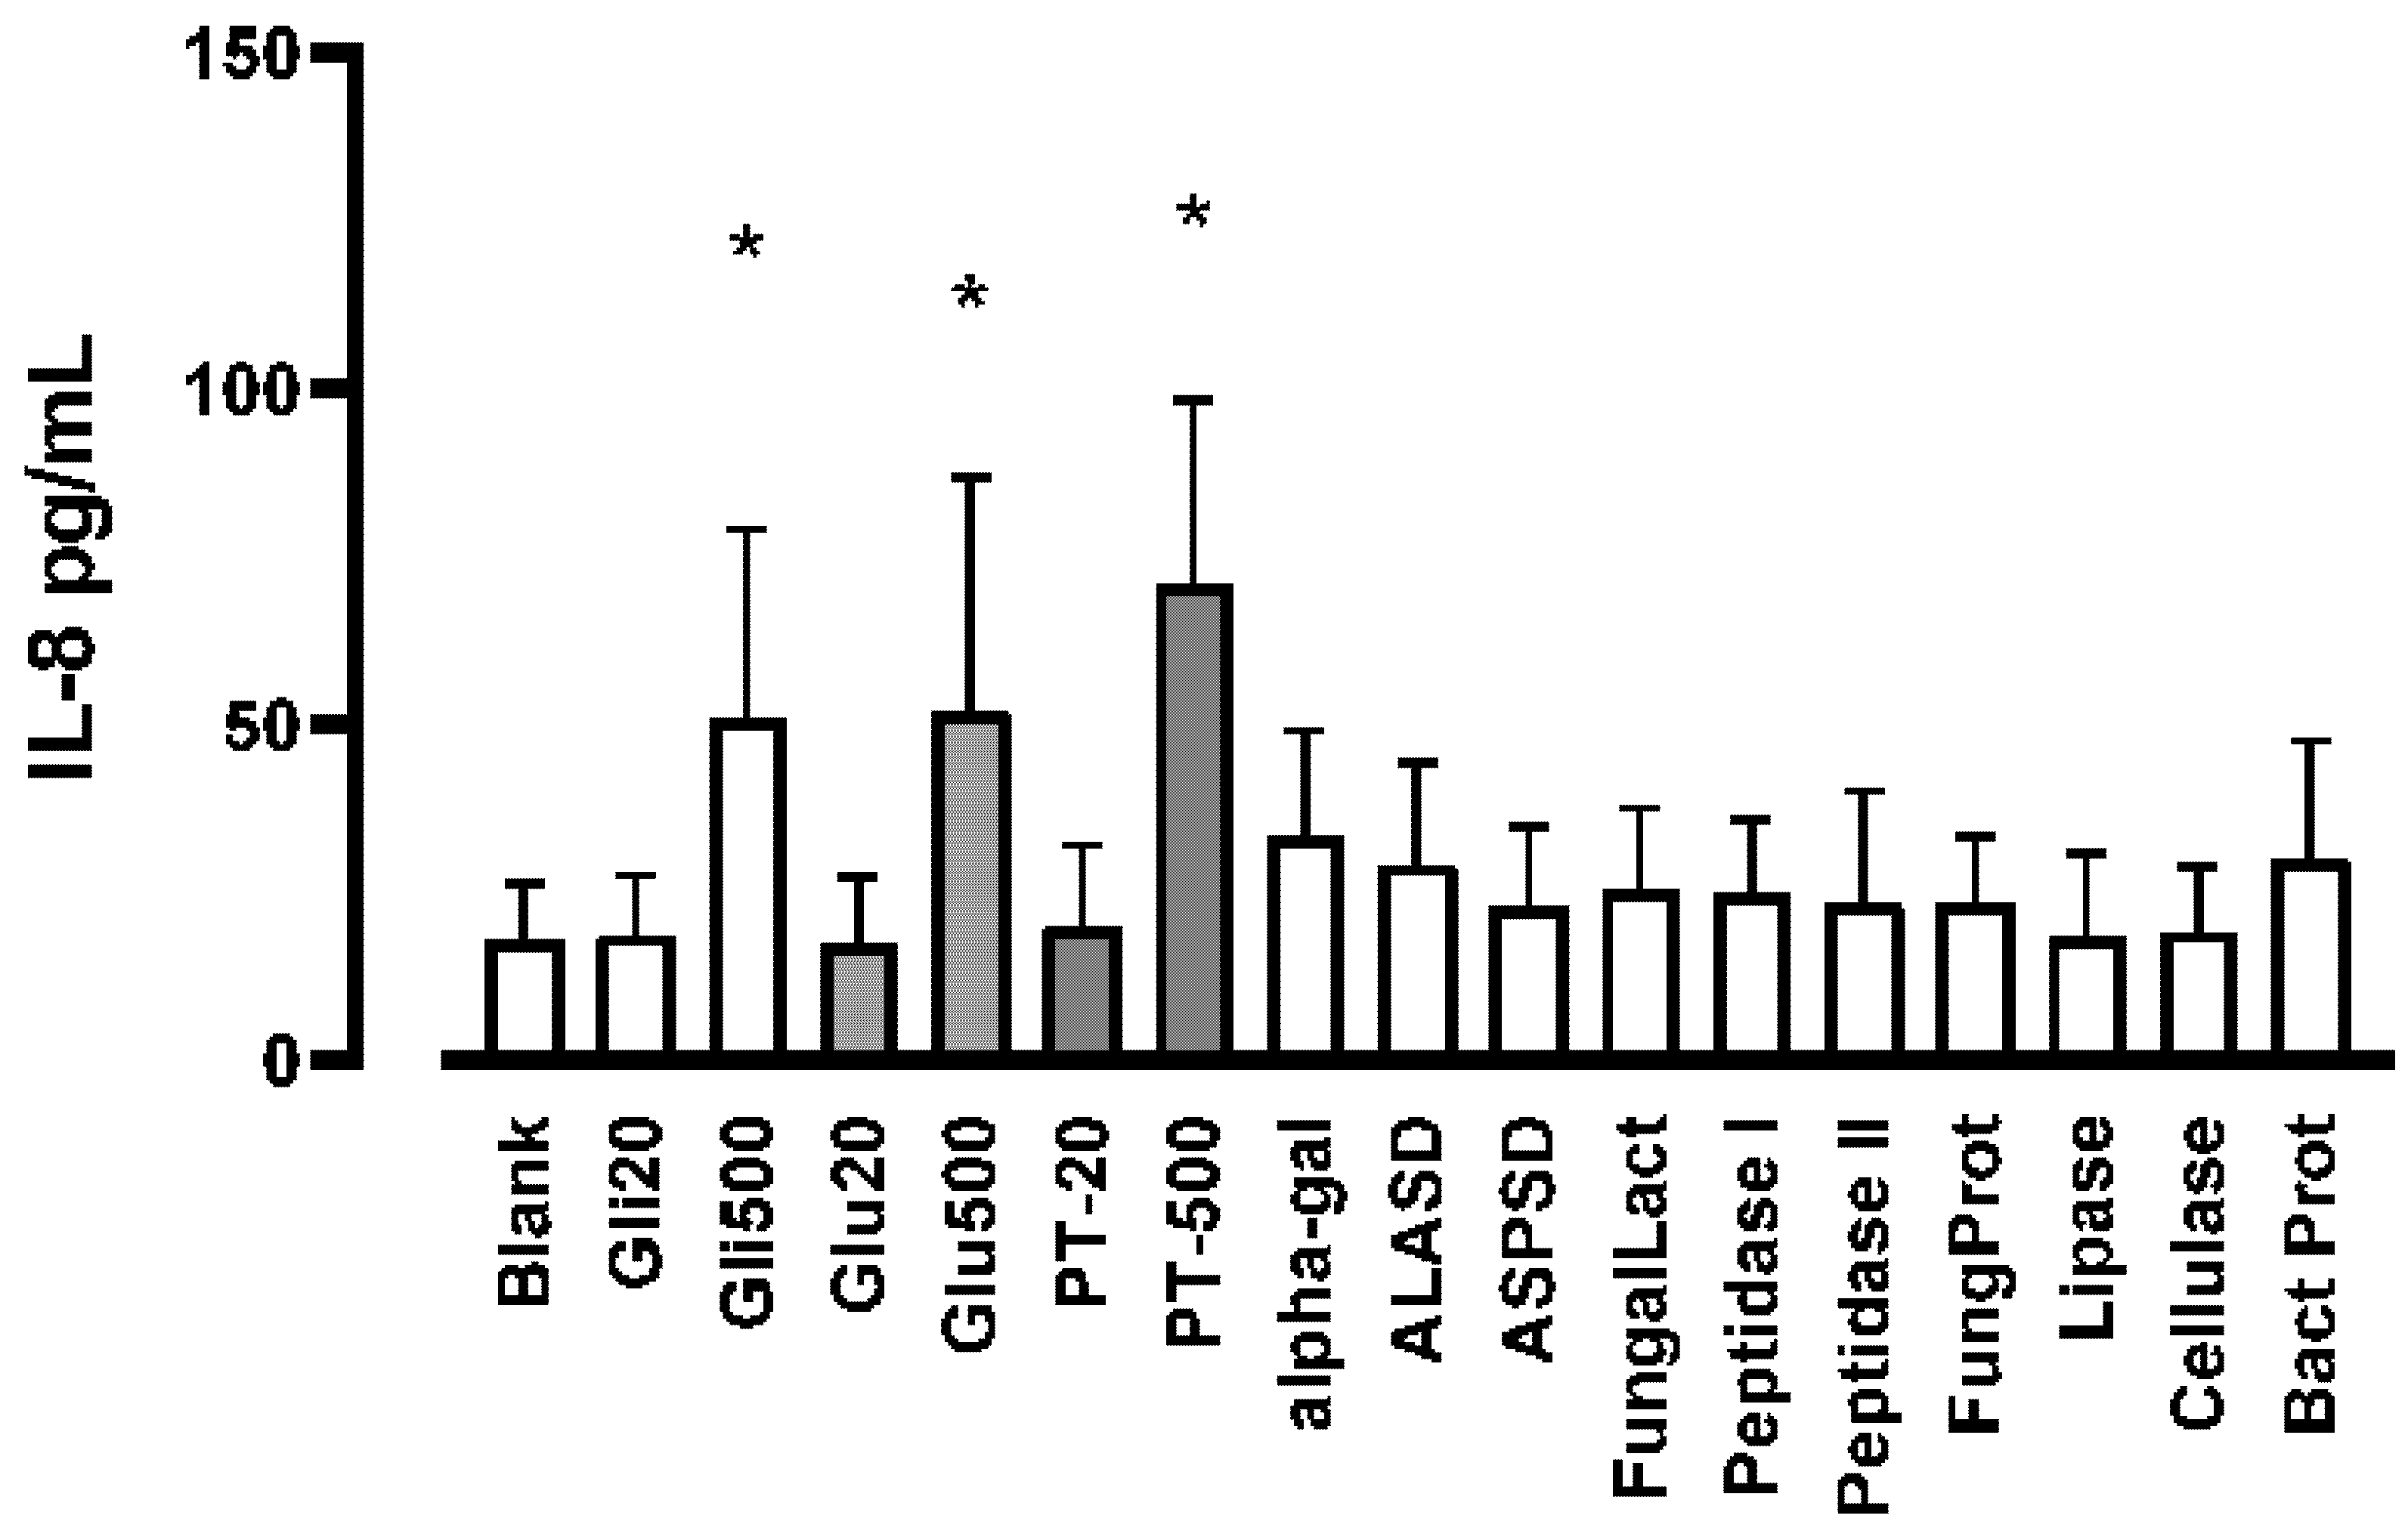
3.3. Effects of Gluten, Gliadin, Digested Gluten Standard and Supplemental Enzymes on IL-8 Production in THP-1 Cells

Given that a stronger effect was observed in THP-1 cells, in IL-8 response, we further examined the effect of commercially available enzyme supplements on immune response with a focus on IL-8 protein expression in this cell line (Figure 2). At 500 ppm (500 mg/L), the crude gliadin, gluten and the pepsin-trypsin digested gluten evoked a significant increase in IL-8 response in these THP-1 cells (F(16, 85) = 4.541, p < 0.0001), as determined by one-way ANOVA followed by Dunnet’s post-hoc test. There was no significant increase in IL-8 response with the administration of the commercially available enzyme supplements.

3.4. Effects of Gluten, Gliadin and Digested Gluten Standard on IL-8 Protein Production in Human Peripheral Blood Mononuclear Cells (PBMCs)

PBMCs from human healthy and coeliac individuals were assessed for their response to crude gluten, gliadin and pepsin-trypsin digested gluten at 20 ppm (20 mg/L) and 500 ppm (500 mg/L) (Figure 3). PBMCs were chosen, as they include lymphocytes (i.e., T cells, B cells and NK cells), monocytes and dendritic cells and so represent a collective immune response to sensitizing agents. In both healthy (F(1, 30) = 515.5, p < 0.0001) and coeliac (F(1, 30) = 455.3, p < 0.0001) PBMCs, 500 ppm of the respective treatments significantly increased IL-8 levels. In both the PBMCs from healthy individuals (F(2, 30) = 11.75, p = 0.0002) and from coeliac individuals (F(2, 30) = 84.22, p < 0.0001), the pepsin-trypsin digestion significantly decreased the inflammatory response as compared with the crude gluten or gliadin, and in healthy PBMCs, the response to crude gluten was lower than to crude gliadin.

4. Discussion

Herein, we clearly demonstrate that the tested commercially available supplemental enzymes that are derived from wheat digestion do not have detectable levels of gliadin-, deamidated gliadin- and glutenin-derived epitopes from gluten proteins or peptides. Although intact gluten may be absent in the enzyme samples, the presence of small or large gluten-derived peptides equivalent to more than 20 ppm intact gluten that are not identifiable with these various epitopes may still be present in these samples. In these studies, we utilized wheat gluten, the same source as for the commercially available enzyme supplements, and while intact gluten may not be the perfect calibrant for competitive ELISAs for fermented goods, it demonstrates that the epitopes are in the proper range for analysis. We further demonstrate that neither the pepsin-trypsin digested gluten standard nor the supplemental enzymes elicit an inflammatory response in immortalized immune and intestinal human cell lines, as well as in peripheral blood mononuclear cells (PBMCs) from coeliac individuals at the threshold concentration of 20 ppm, as compared with both crude gluten and gliadin. This complementary approach provides strong rationale for the idea that the fermentation process effectively removes gluten and immunogenic peptides and lends credence to the acceptance of a gluten-free declaration specifically for hydrolyzed gluten products, including supplemental enzymes, derived from fermentation processes.
Historically, several qualitative and quantitative analytical methods are available for the detection of gluten in foods and fermented products including ELISAs, Western blotting, Mass spectrometry, DNA-based methodology and aptamer-based assays—all of which have their limitations [41]. Sandwich and competitive ELISAs are the most used methodologies with monoclonal antibodies such as Skerritt, USDA, 2D4, R5 and G12, as well as polyclonal antibodies such as MloBS. The polycloncal antibody (MloBS) yielded the highest results on average for the commercial products (excluding the bacterial protease false-positive) and thus may be the most conservative estimation for residual gluten concentration in fermented dietary enzymes for use in safety determination. By combining these methodologies with physiologically relevant bioassays, a more comprehensive assessment of gluten detection and potential immunopathogenesis was determined.
Cytokines are important mediators of inflammation and contribute to the pathogenesis of many inflammatory diseases associated with the gut. Numerous studies have demonstrated a role for IL-8 and TNF-α as markers for innate immune activation by gluten products in vitro [42,43,44,45,46,47,48,49,50,51] and in human studies [52,53,54,55,56,57,58,59,60,61,62]. The ELISA and immunoblotting methodologies tested in this study using gluten-specific epitopes suggest that the supplemental enzymes and the PT digested gluten had less than 20 ppm (20 mg/L) gluten (Table 2 and Table 3). To compliment these findings, the digested gluten standard as a reference standard for the levels of gluten that would be in the supplemental enzyme groups was tested for the potential to elicit inflammatory response, using IL-8 and TNFα cytokines in Caco-2 intestinal cells and THP-1 human monocytes. We further assessed the response to commercially available supplemental enzymes to assess their effect on immune response. These samples were compared to crude gliadin or crude gluten preparations at the FDA denominated gluten-free concentration of 20 ppm and at a higher concentration of 500 ppm to validate the assays. The co-culturing of gliadin, gluten and PT-digested gluten did not affect cell viability in our cell lines (Supplementary Figure S1). Furthermore, the results from cell culture assays demonstrate that at 20 ppm concentration, the PT-digested gluten and the commercially available supplemental enzymes did not trigger any inflammatory response of IL-8 or TNF-α compared to the media itself or to crude gluten and crude gliadin (Figure 1 and Figure 2). Therefore, the inflammatory response elicited by the detectable and non-detectable peptides generated in the PT-digested gluten standard is no different to crude gliadin or gluten molecules at a concentration of 20 ppm.
At the higher dose of 500 ppm, PT-digested gluten increased the mRNA levels for TNF-α and IL-8 as compared to the crude gliadin and gluten (Figure 1 and Figure 2). This is in line with previous evidence in THP-1 cells where digested gliadin increased IL-8 and TNFα as compared to crude gliadin alone at 200 ppm [42]. In contrast, other studies in the Caco-2 cell line showed that PT-digested gluten did not exacerbate the effects of 1000 ppm crude gluten [63]. These observations suggest that there may be a threshold concentration of crude gliadin or gluten past which the effects of peptides from their hydrolyzation do not elicit further response. However, further dose response studies using crude and digested gliadin and gluten in these cell lines are required to confirm this observation. Regardless of this information, this PT-digested gluten and the supplemental enzymes elicit a similar negligible inflammatory response as 20 ppm crude gluten and crude gliadin.
PBMCs encompass a heterogeneous cell population with varying relative amounts of lymphocytes (T cells, B cells and NK cells), dendritic cells and monocytes. These cells are critical components of the innate and adaptive immune system that defends the body against infection and plays a role in sensitization to certain epitopes. Using human PBMCs we demonstrate that the hydrolyzation of gluten with pepsin-trypsin digest decreases the IL-8 protein response as compared with crude gliadin or gluten. During the fermentation process used in the synthesis of the commercial enzymes, the wheat undergoes a more extensive hydrolyzation process than that experienced by pepsin-trypsin digestion alone. Combining the data from the immunoblots and multiplex with the cell-based assays, and given that supplemental enzymes and fermentation by-products will be even further hydrolyzed, we did not further analyze the commercial enzymes in this assay. However, given that the fermentation process further hydrolyzes these commercially available enzymes and these ‘neat’ enzymes are further diluted before being commercially distributed, we can be confident that these compounds will have gluten content below 20 ppm or that any gluten-derived peptides not detectable by these antibody epitopes will not elicit an inflammatory response and thus can maintain their claim of being ‘gluten-free’.

5. Conclusions

This study demonstrates that, by using these specific antibody epitopes, there is little or no gluten products in the supplemental enzymes following fermentation. Furthermore, these samples that may contain non-detected gluten-derived peptides do not elicit an inflammatory response in immortalized immune and intestinal human cell lines, as well as in peripheral blood mononuclear cells (PBMCs) from coeliac individuals at the threshold dose of 20 ppm. This complementary approach using multiplex ELISA, immunoblotting and cell-based assays provides strong rationale for the acceptance of supplemental enzymes in a gluten-free declaration. This is of clinical relevance, as many commercially available enzymes that are marketed for the alleviation of gastric discomfort and the alleviation of food sensitivities do so through the degradation of proteins and peptides (including gluten) to reduce sensitivity. Future work investigating the detection of gluten-derived peptides should consider appropriate reference calibrants for the more accurate detection and quantification of peptides in combination with cell-based assays to assess the potential to modulate the inflammatory tone of non-detectable products of starting gluten source hydrolysis.

Supplementary Materials

The following supporting information can be downloaded at: https://www.mdpi.com/article/10.3390/fermentation8050203/s1. Figure S1. Viability of Caco-2 and THP-1 cells. Figure S2. Comparison of Standard Curves of the ELISA Antibodies. Figure S3. Immunoblots of Supplemental Enzymes. Figure S4. Immunoblots of PT-digested products: Immunoblots from Wes using antibodies.

Author Contributions

Conceptualization, J.C., J.D. and C.P.; methodology, E.K., P.K., S.B., J.C., A.M.C., N.J. and C.P.; software, P.K. and C.P.; validation, E.K., P.K., J.C., A.M.C., N.J. and C.P.; formal analysis, E.K., P.K., J.C., K.R., A.M.C., N.J. and C.P.; investigation, E.K., P.K., J.C., A.M.C., N.J. and C.P.; data curation, E.K., P.K., J.C., A.M.C., N.J. and C.P.; writing—original draft preparation, K.R., E.K., P.K., J.C., C.P. and J.D.; writing—review and editing, E.K., P.K., J.C., A.M.C., N.J. and C.P.; supervision, K.R., C.P. and J.D.; project administration, J.D. All authors have read and agreed to the published version of the manuscript.

Funding

This research was funded by Deerland Probiotic and Enzymes, with the cell work preparation being conducted by Munster Technical University.

Conflicts of Interest

Deerland Probiotic and Enzymes were involved in the funding and design of the study; in the collection, analyses, and interpretation of the data; in the writing of the manuscript; and in the decision to publish the results.

Appendix A

Bio-Rad. Protocol: Competitive ELISA: Competitive ELISA Protocol|Bio-Rad (bio-rad-antibodies.com, accessed on 6 September 2021).
ProteinSimple. Simple Western Size Assay Development Guide, Revision 1. (2014); Wes_manual.book (proteinsimple.com, accessed on 17 August 2021).
ProteinSimple, Compass for Simple Western User Guide Revision D. (2021); Compass.book (proteinsimple.com, accessed on 1 September 2021).
AAT Bioquest, Inc. (18 November 2021). Quest Graph™ Four Parameter Logistic (4PL) Curve Calculator. Retrieved from https://www.aatbio.com/tools/four-parameter-logistic-4pl-curve-regression-online-calculator, accessed on 26 April 2022.
Thermo scientific. Acetone precipitation of proteins: Microsoft Word—TR0049.1.doc (thermofisher.com, accessed on 4 June 2021).
Kolde R. (2013). pheatmap: Pretty Heatmaps. R package version 0.7.7. http://CRAN.R-project.org/package=pheatmap, accessed on 1 September 2021.
R Core Team. (2015). R: A Language and Environment for Statistical Computing. 620 R Foundation for Statistical Computing, Vienna. http://www.R-project.org/, accessed on 11 August 2021.

References

  1. Gao, H.; Jorgensen, R.; Raghunath, R.; Nagisetty, S.; Ng, P.K.W.; Gangur, V. Creating hypo-/nonallergenic wheat products using processing methods: Fact or fiction? Compr. Rev. Food Sci. Food Saf. 2021, 20, 6089–6115. [Google Scholar] [CrossRef] [PubMed]
  2. Vu, V.; Farkas, C.; Riyad, O.; Bujna, E.; Kilin, A.; Sipiczki, G.; Sharma, M.; Usmani, Z.; Gupta, V.K.; Nguyen, Q.D. Enhancement of the enzymatic hydrolysis efficiency of wheat bran using the Bacillus strains and their consortium. Bioresour. Technol. 2021, 343, 126092. [Google Scholar] [CrossRef] [PubMed]
  3. Dubos, R.J. The Adaptive Production of Enzymes by Bacteria. Bacteriol. Rev. 1940, 4, 1–16. [Google Scholar] [CrossRef]
  4. Cezairliyan, B.; Ausubel, F.M. Investment in secreted enzymes during nutrient-limited growth is utility dependent. Proc. Natl. Acad. Sci. USA 2017, 114, E7796–E7802. [Google Scholar] [CrossRef] [PubMed] [Green Version]
  5. Di Stefano, M.; Miceli, E.; Gotti, S.; Missanelli, A.; Mazzocchi, S.; Corazza, G.R. The effect of oral alpha-galactosidase on intestinal gas production and gas-related symptoms. Dig. Dis. Sci. 2007, 52, 78–83. [Google Scholar] [CrossRef] [PubMed]
  6. Oben, J.; Kothari, S.C.; Anderson, M.L. An open label study to determine the effects of an oral proteolytic enzyme system on whey protein concentrate metabolism in healthy males. J. Int. Soc. Sports Nutr. 2008, 5, 10. [Google Scholar] [CrossRef] [Green Version]
  7. Ianiro, G.; Pecere, S.; Giorgio, V.; Gasbarrini, A.; Cammarota, G. Digestive Enzyme Supplementation in Gastrointestinal Diseases. Curr. Drug Metab. 2016, 17, 187–193. [Google Scholar] [CrossRef] [Green Version]
  8. Swami, O.C.; Shah, N.J. Functional dyspepsia and the role of digestive enzymes supplement in its therapy. Int. J. Basic Clin. Pharmacol. 2017, 6, 1035–1041. [Google Scholar] [CrossRef] [Green Version]
  9. Wang, Y.H.; Li, S.A.; Huang, C.H.; Su, H.H.; Chen, Y.H.; Chang, J.T.; Huang, S.S. Sirt1 Activation by Post-ischemic Treatment with Lumbrokinase Protects Against Myocardial Ischemia-Reperfusion Injury. Front. Pharmacol. 2018, 9, 636. [Google Scholar] [CrossRef] [Green Version]
  10. Altaf, F.; Wu, S.; Kasim, V. Role of Fibrinolytic Enzymes in Anti-Thrombosis Therapy. Front. Mol. Biosci. 2021, 8, 680397. [Google Scholar] [CrossRef]
  11. Townsend, J.R.; Morimune, J.E.; Jones, M.D.; Beuning, C.N.; Haase, A.A.; Boot, C.M.; Heffington, S.H.; Littlefield, L.A.; Henry, R.N.; Marshall, A.C.; et al. The Effect of ProHydrolase((R)) on the Amino Acid and Intramuscular Anabolic Signaling Response to Resistance Exercise in Trained Males. Sports 2020, 8, 13. [Google Scholar] [CrossRef] [PubMed] [Green Version]
  12. Biller, J.A.; King, S.; Rosenthal, A.; Grand, R.J. Efficacy of lactase-treated milk for lactose-intolerant pediatric patients. J. Pediatr. 1987, 111, 91–94. [Google Scholar] [CrossRef]
  13. DiPalma, J.A.; Collins, M.S. Enzyme replacement for lactose malabsorption using a beta-D-galactosidase. J. Clin. Gastroenterol. 1989, 11, 290–293. [Google Scholar] [CrossRef] [PubMed]
  14. Rosado, J.L.; Solomons, N.W.; Lisker, R.; Bourges, H. Enzyme replacement therapy for primary adult lactase deficiency. Effective reduction of lactose malabsorption and milk intolerance by direct addition of beta-galactosidase to milk at mealtime. Gastroenterology 1984, 87, 1072–1082. [Google Scholar] [CrossRef]
  15. Wei, G.; Helmerhorst, E.J.; Darwish, G.; Blumenkranz, G.; Schuppan, D. Gluten Degrading Enzymes for Treatment of Celiac Disease. Nutrients 2020, 12, 2095. [Google Scholar] [CrossRef] [PubMed]
  16. Deaton, J.; Cuentas, A.; Starnes, J. Tolerance and Efficacy of Glutalytic™: A Randomized, Double-Blind, Placebo Controlled Study. J. Nutr. Food Sci. 2018, 8, 1–7. [Google Scholar] [CrossRef]
  17. Caio, G.; Volta, U.; Sapone, A.; Leffler, D.A.; De Giorgio, R.; Catassi, C.; Fasano, A. Celiac disease: A comprehensive current review. BMC Med. 2019, 17, 142. [Google Scholar] [CrossRef] [Green Version]
  18. Rubio-Tapia, A.; Ludvigsson, J.F.; Brantner, T.L.; Murray, J.A.; Everhart, J.E. The prevalence of celiac disease in the United States. Am. J. Gastroenterol. 2012, 107, 1538–1544. [Google Scholar] [CrossRef]
  19. Aziz, I.; Hadjivassiliou, M.; Sanders, D.S. The spectrum of noncoeliac gluten sensitivity. Nat. Rev. Gastroenterol. Hepatol. 2015, 12, 516–526. [Google Scholar] [CrossRef]
  20. Wieser, H. Chemistry of gluten proteins. Food Microbiol. 2007, 24, 115–119. [Google Scholar] [CrossRef]
  21. Clemente, M.G.; De Virgiliis, S.; Kang, J.S.; Macatagney, R.; Musu, M.P.; Di Pierro, M.R.; Drago, S.; Congia, M.; Fasano, A. Early effects of gliadin on enterocyte intracellular signalling involved in intestinal barrier function. Gut 2003, 52, 218–223. [Google Scholar] [CrossRef]
  22. Abadie, V.; Jabri, B. IL-15: A central regulator of celiac disease immunopathology. Immunol. Rev. 2014, 260, 221–234. [Google Scholar] [CrossRef] [Green Version]
  23. Leonard, M.M.; Sapone, A.; Catassi, C.; Fasano, A. Celiac Disease and Nonceliac Gluten Sensitivity: A Review. JAMA 2017, 318, 647–656. [Google Scholar] [CrossRef]
  24. Catassi, C.; Fabiani, E.; Iacono, G.; D’Agate, C.; Francavilla, R.; Biagi, F.; Volta, U.; Accomando, S.; Picarelli, A.; De Vitis, I.; et al. A prospective, double-blind, placebo-controlled trial to establish a safe gluten threshold for patients with celiac disease. Am. J. Clin. Nutr. 2007, 85, 160–166. [Google Scholar] [CrossRef]
  25. Halter, S.A.; Greene, H.L.; Helinek, G. Gluten-sensitive enteropathy: Sequence of villous regrowth as viewed by scanning electron microscopy. Hum. Pathol. 1982, 13, 811–818. [Google Scholar] [CrossRef]
  26. Halter, S.A.; Greene, H.L.; Helinek, G. Scanning electron microscopy of small intestinal repair following treatment for gluten sensitive enteropathy. Scan. Electron Microsc. 1980, 3, 155–161. [Google Scholar]
  27. Labeling, F.F. 21. CFR Part 101 [Docket No. FDA-2005-N-0404] RIN 0910-AG84. Federal Regist. 2013, 78, 47154–47179. [Google Scholar]
  28. Montserrat, V.; Bruins, M.J.; Edens, L.; Koning, F. Influence of dietary components on Aspergillus niger prolyl endoprotease mediated gluten degradation. Food Chem. 2015, 174, 440–445. [Google Scholar] [CrossRef]
  29. Scherf, K.A.; Wieser, H.; Koehler, P. Novel approaches for enzymatic gluten degradation to create high-quality gluten-free products. Food Res. Int. 2018, 110, 62–72. [Google Scholar] [CrossRef]
  30. Panda, R.; Garber, E.A.E. Western blot analysis of fermented-hydrolyzed foods utilizing gluten-specific antibodies employed in a novel multiplex competitive ELISA. Anal. Bioanal. Chem. 2019, 411, 5159–5174. [Google Scholar] [CrossRef]
  31. Rockendorf, N.; Meckelein, B.; Scherf, K.A.; Schalk, K.; Koehler, P.; Frey, A. Identification of novel antibody-reactive detection sites for comprehensive gluten monitoring. PLoS ONE 2017, 12, e0181566. [Google Scholar] [CrossRef] [Green Version]
  32. Panda, R.; Boyer, M.; Garber, E.A.E. A multiplex competitive ELISA for the detection and characterization of gluten in fermented-hydrolyzed foods. Anal. Bioanal. Chem. 2017, 409, 6959–6973. [Google Scholar] [CrossRef]
  33. Rivera Del Rio, A.; Keppler, J.K.; Boom, R.M.; Janssen, A.E.M. Protein acidification and hydrolysis by pepsin ensure efficient trypsin-catalyzed hydrolysis. Food Funct. 2021, 12, 4570–4581. [Google Scholar] [CrossRef]
  34. Nelson, G.M.; Guynn, J.M.; Chorley, B.N. Procedure and Key Optimization Strategies for an Automated Capillary Electrophoretic-based Immunoassay Method. J. Vis. Exp. 2017, 127, e55911. [Google Scholar] [CrossRef] [Green Version]
  35. Fu, B.X.; Sapirstein, H.D.; Bushuk, W. Salt-Induced Disaggregation/Solubilization of Gliadin and Glutenin Proteins in Water. J. Cereal Sci. 1996, 24, 241–246. [Google Scholar] [CrossRef]
  36. Tsuge, M.; Hiraga, N.; Zhang, Y.; Yamashita, M.; Sato, O.; Oka, N.; Shiraishi, K.; Izaki, Y.; Makokha, G.N.; Uchida, T.; et al. Endoplasmic reticulum-mediated induction of interleukin-8 occurs by hepatitis B virus infection and contributes to suppression of interferon responsiveness in human hepatocytes. Virology 2018, 525, 48–61. [Google Scholar] [CrossRef]
  37. Njock, M.S.; Cheng, H.S.; Dang, L.T.; Nazari-Jahantigh, M.; Lau, A.C.; Boudreau, E.; Roufaiel, M.; Cybulsky, M.I.; Schober, A.; Fish, J.E. Endothelial cells suppress monocyte activation through secretion of extracellular vesicles containing antiinflammatory microRNAs. Blood 2015, 125, 3202–3212. [Google Scholar] [CrossRef] [Green Version]
  38. Steinberg-Shemer, O.; Keel, S.; Dgany, O.; Walsh, T.; Noy-Lotan, S.; Krasnov, T.; Yacobovich, J.; Quarello, P.; Ramenghi, U.; King, M.C.; et al. Diamond Blackfan Anemia: A Nonclassical Patient with Diagnosis Assisted by Genomic Analysis. J. Pediatr. Hematol. Oncol. 2016, 38, e260–e262. [Google Scholar] [CrossRef] [Green Version]
  39. Chekhonin, V.P.; Lebedev, S.V.; Volkov, A.I.; Pavlov, K.A.; Ter-Arutyunyants, A.A.; Volgina, N.E.; Savchenko, E.A.; Grinenko, N.F.; Lazarenko, I.P. Activation of expression of brain-derived neurotrophic factor at the site of implantation of allogenic and xenogenic neural stem (progenitor) cells in rats with ischemic cortical stroke. Bull. Exp. Biol. Med. 2011, 150, 515–518. [Google Scholar] [CrossRef]
  40. Lacorn, M.; Lindeke, S.; Siebeneicher, S.; Weiss, T. Commercial ELISA Measurement of Allergens and Gluten: What We Can Learn from Case Studies. J. AOAC Int. 2018, 101, 102–107. [Google Scholar] [CrossRef]
  41. Panda, R.; Garber, E.A.E. Detection and Quantitation of Gluten in Fermented-Hydrolyzed Foods by Antibody-Based Methods: Challenges, Progress, and a Potential Path Forward. Front. Nutr. 2019, 6, 97. [Google Scholar] [CrossRef]
  42. Jelinkova, L.; Tuckova, L.; Cinova, J.; Flegelova, Z.; Tlaskalova-Hogenova, H. Gliadin stimulates human monocytes to production of IL-8 and TNF-alpha through a mechanism involving NF-kappaB. FEBS Lett. 2004, 571, 81–85. [Google Scholar] [CrossRef] [Green Version]
  43. Lammers, K.M.; Khandelwal, S.; Chaudhry, F.; Kryszak, D.; Puppa, E.L.; Casolaro, V.; Fasano, A. Identification of a novel immunomodulatory gliadin peptide that causes interleukin-8 release in a chemokine receptor CXCR3-dependent manner only in patients with coeliac disease. Immunology 2011, 132, 432–440. [Google Scholar] [CrossRef]
  44. Kumar, S.; Prenner, S. Dyspepsia and Increased Levels of Liver Enzymes in a 24-Year-Old Man. Gastroenterology 2019, 157, 27–28. [Google Scholar] [CrossRef] [Green Version]
  45. De Palma, G.; Nadal, I.; Collado, M.C.; Sanz, Y. Effects of a gluten-free diet on gut microbiota and immune function in healthy adult human subjects. Br. J. Nutr. 2009, 102, 1154–1160. [Google Scholar] [CrossRef] [Green Version]
  46. Cinova, J.; Palova-Jelinkova, L.; Smythies, L.E.; Cerna, M.; Pecharova, B.; Dvorak, M.; Fruhauf, P.; Tlaskalova-Hogenova, H.; Smith, P.D.; Tuckova, L. Gliadin peptides activate blood monocytes from patients with celiac disease. J. Clin. Immunol. 2007, 27, 201–209. [Google Scholar] [CrossRef]
  47. Capozzi, A.; Vincentini, O.; Gizzi, P.; Porzia, A.; Longo, A.; Felli, C.; Mattei, V.; Mainiero, F.; Silano, M.; Sorice, M.; et al. Modulatory Effect of Gliadin Peptide 10-mer on Epithelial Intestinal CACO-2 Cell Inflammatory Response. PLoS ONE 2013, 8, e66561. [Google Scholar] [CrossRef] [Green Version]
  48. Palova-Jelinkova, L.; Rozkova, D.; Pecharova, B.; Bartova, J.; Sediva, A.; Tlaskalova-Hogenova, H.; Spisek, R.; Tuckova, L. Gliadin fragments induce phenotypic and functional maturation of human dendritic cells. J. Immunol. 2005, 175, 7038–7045. [Google Scholar] [CrossRef] [Green Version]
  49. Grover, J.; Chhuneja, P.; Midha, V.; Ghia, J.E.; Deka, D.; Mukhopadhyay, C.S.; Sood, N.; Mahajan, R.; Singh, A.; Verma, R.; et al. Variable Immunogenic Potential of Wheat: Prospective for Selection of Innocuous Varieties for Celiac Disease Patients via in vitro Approach. Front. Immunol. 2019, 10, 84. [Google Scholar] [CrossRef] [Green Version]
  50. Tuckova, L.; Novotna, J.; Novak, P.; Flegelova, Z.; Kveton, T.; Jelinkova, L.; Zidek, Z.; Man, P.; Tlaskalova-Hogenova, H. Activation of macrophages by gliadin fragments: Isolation and characterization of active peptide. J. Leukoc. Biol. 2002, 71, 625–631. [Google Scholar]
  51. Vincentini, O.; Maialetti, F.; Gonnelli, E.; Silano, M. Gliadin-dependent cytokine production in a bidimensional cellular model of celiac intestinal mucosa. Clin. Exp. Med. 2015, 15, 447–454. [Google Scholar] [CrossRef]
  52. Goel, G.; Tye-Din, J.A.; Qiao, S.W.; Russell, A.K.; Mayassi, T.; Ciszewski, C.; Sarna, V.K.; Wang, S.; Goldstein, K.E.; Dzuris, J.L.; et al. Cytokine release and gastrointestinal symptoms after gluten challenge in celiac disease. Sci. Adv. 2019, 5, eaaw7756. [Google Scholar] [CrossRef] [Green Version]
  53. Goel, G.; Daveson, A.J.M.; Hooi, C.E.; Tye-Din, J.A.; Wang, S.; Szymczak, E.; Williams, L.J.; Dzuris, J.L.; Neff, K.M.; Truitt, K.E.; et al. Serum cytokines elevated during gluten-mediated cytokine release in coeliac disease. Clin. Exp. Immunol. 2020, 199, 68–78. [Google Scholar] [CrossRef]
  54. Tye-Din, J.A.; Skodje, G.I.; Sarna, V.K.; Dzuris, J.L.; Russell, A.K.; Goel, G.; Wang, S.; Goldstein, K.E.; Williams, L.J.; Sollid, L.M.; et al. Cytokine release after gluten ingestion differentiates coeliac disease from self-reported gluten sensitivity. United Eur. Gastroenterol. J. 2020, 8, 108–118. [Google Scholar] [CrossRef] [Green Version]
  55. Di Sabatino, A.; Giuffrida, P.; Fornasa, G.; Salvatore, C.; Vanoli, A.; Naviglio, S.; De Leo, L.; Pasini, A.; De Amici, M.; Alvisi, C.; et al. Innate and adaptive immunity in self-reported nonceliac gluten sensitivity versus celiac disease. Dig. Liver Dis. 2016, 48, 745–752. [Google Scholar] [CrossRef]
  56. Di Sabatino, A.; Corazza, G.R. True Nonceliac Gluten Sensitivity in Real Patients. Clin. Gastroenterol. Hepatol. 2016, 14, 168–169. [Google Scholar] [CrossRef]
  57. Brottveit, M.; Beitnes, A.C.; Tollefsen, S.; Bratlie, J.E.; Jahnsen, F.L.; Johansen, F.E.; Sollid, L.M.; Lundin, K.E. Mucosal cytokine response after short-term gluten challenge in celiac disease and non-celiac gluten sensitivity. Am. J. Gastroenterol. 2013, 108, 842–850. [Google Scholar] [CrossRef]
  58. Heydari, F.; Rostami-Nejad, M.; Moheb-Alian, A.; Mollahoseini, M.H.; Rostami, K.; Pourhoseingholi, M.A.; Aghamohammadi, E.; Zali, M.R. Serum cytokines profile in treated celiac disease compared with non-celiac gluten sensitivity and control: A marker for differentiation. J. Gastrointest. Liver Dis. 2018, 27, 241–247. [Google Scholar] [CrossRef]
  59. Manavalan, J.S.; Hernandez, L.; Shah, J.G.; Konikkara, J.; Naiyer, A.J.; Lee, A.R.; Ciaccio, E.; Minaya, M.T.; Green, P.H.; Bhagat, G. Serum cytokine elevations in celiac disease: Association with disease presentation. Hum. Immunol. 2010, 71, 50–57. [Google Scholar] [CrossRef]
  60. Chowers, Y.; Marsh, M.N.; De Grandpre, L.; Nyberg, A.; Theofilopoulos, A.N.; Kagnoff, M.F. Increased proinflammatory cytokine gene expression in the colonic mucosa of coeliac disease patients in the early period after gluten challenge. Clin. Exp. Immunol. 1997, 107, 141–147. [Google Scholar] [CrossRef]
  61. Street, M.E.; Volta, C.; Ziveri, M.A.; Zanacca, C.; Banchini, G.; Viani, I.; Rossi, M.; Virdis, R.; Bernasconi, S. Changes and relationships of IGFS and IGFBPS and cytokines in coeliac disease at diagnosis and on gluten-free diet. Clin. Endocrinol. 2008, 68, 22–28. [Google Scholar] [CrossRef]
  62. Lahat, N.; Shapiro, S.; Karban, A.; Gerstein, R.; Kinarty, A.; Lerner, A. Cytokine profile in coeliac disease. Scand J. Immunol. 1999, 49, 441–446. [Google Scholar] [CrossRef]
  63. Mohan Kumar, B.V.; Vijaykrishnaraj, M.; Kurrey, N.K.; Shinde, V.S.; Prabhasankar, P. Prolyl endopeptidase-degraded low immunoreactive wheat flour attenuates immune responses in Caco-2 intestinal cells and gluten-sensitized BALB/c mice. Food Chem. Toxicol. 2019, 129, 466–475. [Google Scholar] [CrossRef]
Figure 1. Differential effects of 20 ppm (20 mg/L) and 500 ppm (500 mg/L) of crude gliadin (Gli), crude gluten (Glu) or PT digested gluten (PT-Glu) on IL-8 gene expression (A,B), IL-8 protein secretion (C,D) and TNF-α gene expression (E,F) in Caco-2 and THP-1 cells, respectively. The dashed line represents effects of control media only for IL-8 protein expression. * represents significant difference as compared with the 20 ppm comparator group, p < 0.05. # represents significant difference as compared with other 500 ppm treatment groups, p < 0.05.
Fermentation 08 00203 g001
Figure 2. 500 ppm of crude gliadin, gluten and pepsin-trypsin digested gluten evoked an increase in IL-8 protein expression in THP-1 cells. There was no significant effect of commercially available enzyme supplements on IL-8 levels. * represents significant difference as compared with the 20 ppm comparator group, p < 0.05.
Fermentation 08 00203 g002
Figure 3. 500 ppm of crude gliadin, gluten and pepsin-trypsin digested gluten evoked an increase in IL-8 protein expression in PBMCs from both healthy and coeliac donors. Digestion by pepsin and trypsin significantly decreased IL-8 protein levels in both healthy and coeliac PBMCs. * represents significant difference as compared with the 20 ppm comparator group, p < 0.05; + represents significant difference as compared with all other groups, p < 0.05.
Fermentation 08 00203 g003
Table 1. HRP-conjugated antibodies from commercial ELISA kits in this study.
AntibodyELISA KitsManufacturerDilution
ELISAImmunoblot
Gtox-G12G12Gluten Tox ELISA Competitive G12Biomedal Diagnosticsto 30 ng/mL *to 200 ng/mL
A-G12G12AgraQuant Gluten G12Romer Labs1 to 31 to 1
R5SandR5RIDASCREEN GliadinR-BioPharm, AG1 to 351 to 5
R5CompR5RIDASCREEN Gliadin CompetitiveR-BioPharm, AG1 to 1001 to 15
V10-R5R5Veratox for Gliadin R5 (Cat # 8510)Neogen Corp.1 to 151 to 10
V80-GLUSDAVeratox for Gliadin (Cat # 8480)Neogen Corp.1 to 101 to 3
MI-GLMIoBSWheat/Gluten (Gliadin) MIoBSMorinaga Institution of Biological Sciences Inc1 to 31 to 1
AllSKSkerrittAllerTek GlutenELISA Technologies Inc.1 to 151 to 10
2D42D4Microbiologique Gluten SandwichPi BioScientific Inc.1 to 101 to 1
* The Gtox-G12 antibody was provided at a known concentration in mg/mL and diluted to 30 ng/mL for analyses in the ELISA and 200 ng/mL for the immunoblots. For the other antibodies, the optimized dilution factor is provided, similar to work performed in Panda et al., 2017 [32].
Table 2. Primer design for PCR targets.
TargetForward PrimerReverse PrimerReference
IL-8CAGTTTTGCCAAGGAGTGCTCAACCCTCTGCACCCAGTTT[36]
TNF-AGCCAGAGGGCTGATTAGAGATCTTCTGCCTGCTGCACTT[37]
RPL5GGTCTCTGTTCCGCAGGATGCAGTTTTACCCTCTCGTCGTCT[38]
GAPDHCTTTGACGCTGGGGCTGGCATTTTGTGCTCTTGCTGGGGCTGGT[39]
Table 3. Gluten levels for the supplemental enzyme samples were negligible or lower than the PT-digested gluten sample (N = 6). The multiplex ELISAs using antibodies from commercially available kits specific for gluten detection were used to detect gluten levels in supplemental enzyme preparations. ND = non-detectable. NA = not available, as only one replicate was above the limit of detection.
Fermentation ProductCommercial ELISA Kit
Gtox-G12A-G12R5SandR5CompV10-R5V80-GLMI-GLAllSK2D4
Antibody
G12G12R5R5R5USDAMIoBSSkerritt2D4
PT-GluPepsin-trypsin hydrolysis77.5 ± NA33.5 ± NA1.5 ± NA1.0 ± NA1.0 ± NA2.5 ± NA22.0 ± NA28.0 ± NA32 ± NA
Alpha-Gα-GalactosidaseND0.0 ± NA0.36 ± 0.13.2 ± 3.0NDND5.3 ± 0.8ND1.63 ± 1.43
ALAAcid LactaseND0.5 ± NAND1.7 ± 1.72.0 ± 0.2ND2.2 ± 1.2ND0.1 ± NA
ASPAcid Stable ProteaseND0.4 ± NA0.4 ± 0.12.9 ± 0.54.3 ± 0.22.4 ± NA1.6 ± 0.8ND3.8 ± 3.5
FLFungal LactaseND0.4 ± NA0.0 ± 0.02.3 ± 0.14.9 ± 0.2ND3.4 ± 1.81.42 ± NA3.4 ± 3.3
FLCFungal Lactase Conc.ND0.8 ± NA0.4 ± 0.41.1 ± 0.68.0 ± 3.30.2 ± NA6.7 ± 0.8ND2.2 ± 2.1
PIPeptidase IND1.8 ± 0.10.8 ± 0.63.1 ± 0.50.4 ± 0.30.6 ± NA2.9 ± 2.4ND3.4 ± 2.9
PICPeptidase I Conc.ND1.4 ± 0.60.3 ± 0.11.4 ± 0.20.7 ± NA2.4 ± 1.31.4 ± 2.5ND2.4 ± 1.5
PIIPeptidase IIND0.8 ± NA0.2 ± 0.12.3 ± 0.16.5 ± 4.6ND2.8 ± 0.1ND4.5 ± 4.1
PIICPeptidase II Conc.ND0.8 ± 0.23.9 ± 3.14.0 ± 0.11.4 ± 0.30.2 ± NA3.7 ± 2.8ND3.5 ± 2.56
Alpha-G-DEα-Galactosidase IIND0.8 ± NA0.5 ± NA2.3 ± 0.11.2 ± NA0.1 ± NA3.0 ± 1.4ND4.3 ± 3.4
FPAFungal Protease AND0.8 ± 0.21.0 ± 0.76.8 ± 8.04.6 ± 4.86.7 ± 2.03.2 ± 1.01.0 ± NA4.3 ± 4.0
BPBacterial Protease137 ± 4.085.5 ± 42.89.5 ± 4.13.1 ± 1.618.3 ± 1.014.9 ± 2.14.9 ± 2.11.8 ± 0.07.7 ± 2.9
LipANLipase ANND0.1 ± 0.14.1 ± 3.42.9 ± 0.23.2 ± 0.91.7 ± 1.73.0 ± 2.4ND4.8 ± 3.3
CellANCellulase ANND0.5 ± 0.40.4 ± 0.42.5 ± 0.31.2 ± 1.01.6 ± NA2.4 ± 2.1ND3.7 ± 3.7
Table 4. Gluten levels for the supplemental enzyme samples were negligible or lower than the PT-digested gluten standard (PT-Glu) for the majority of antibodies, as determined by immunoblotting (N = 6). ND = non-detectable.
Fermentation ProductCommercial ELISA Kit
Gtox-G12A-G12R5SandR5CompV10-R5V80-GLMI-GLAllSK2D4
Antibody
G12G12R5R5R5USDAMIoBSSkerritt2D4
PT-GluPepsin-trypsin hydrolysisNDNDNDND36.5NDNDND1.5
Alpha-Gα-GalactosidaseNDNDNDNDNDNDNDND677.08
ALAAcid LactaseNDNDNDNDNDNDNDNDND
ASPAcid Stable ProteaseNDNDNDND26.65NDNDNDND
FLFungal LactaseNDNDND95.86NDNDNDNDND
FLCFungal Lactase Conc.NDNDNDNDNDNDNDNDND
PIPeptidase INDNDNDNDNDNDND606.66ND
PICPeptidase I Conc.NDNDNDNDNDNDNDNDND
PIIPeptidase IINDNDNDNDNDNDNDND519.23
PIICPeptidase II Conc.NDNDNDNDNDNDNDNDND
Alpha-G-DEα-Galactosidase IINDND0.72NDNDNDNDNDND
FPAFungal Protease ANDNDNDNDNDNDNDNDND
BPBacterial ProteaseNDNDNDNDNDNDNDNDND
LipANLipase ANNDNDNDND29.53NDNDNDND
CellANCellulase ANNDNDNDNDNDNDNDNDND
Publisher’s Note: MDPI stays neutral with regard to jurisdictional claims in published maps and institutional affiliations.

