Article

Correlation Analysis of Microbiota and Volatile Flavor Compounds of Caishiji Soybean Paste

1
Key Laboratory for Agricultural Products Processing, School of Food and Biological Engineering, Hefei University of Technology, No.193 Tunxi Road, Hefei 230009, China
2
Anhui Caishiji Foods Co., Ltd., Ma’anshan 243000, China
*
Author to whom correspondence should be addressed.
These authors contributed equally to this work.
Fermentation 2022, 8(5), 196; https://doi.org/10.3390/fermentation8050196
Submission received: 8 April 2022 / Revised: 22 April 2022 / Accepted: 23 April 2022 / Published: 27 April 2022
(This article belongs to the Special Issue Applied Microorganisms and Industrial/Food Enzymes)

Abstract

:
Microbial diversity plays a crucial part in the fermentation of Caishiji soybean paste (CSP). In the current study, the microbiota and volatile flavor compounds (VFCs) in CSP were identified through Illumina MiSeq sequencing and headspace gas chromatography–mass spectrometry. Five bacterial (Bacillus, Tetragenococcus, Salinivibrio, Halomonas, and Staphylococcus) and four fungal genera (Aspergillus, Debaryomyces, Nigrospora, and Curvularia) were revealed as dominant among the entire microbiome of CSP. More than 70 VFCs, including 8 acids, 15 esters, 8 alcohols, 14 aldehydes, 4 ketones, 5 phenols, and 20 miscellaneous VFCs were detected during the fermentation process. A total of 12 kinds of VFCs were identified in the odor activity value (OAV) analysis. The results of the correlation analysis between microbiota and VFCs indicated that Bacillus, Tetragenococcus, Staphylococcus, and Aspergillus were the main microbiota affecting the flavor of CSP. These results may serve as a reference for enhancing the quality of CSP.

1. Introduction

Soybean paste [1,2], sufu [3,4,5], soy sauce [6,7,8], and douchi [9,10,11] are traditional bean products consumed in China and other East Asian countries. Among them, in China, soybean paste products are indispensable condiments with unique flavors and abundant nutriments [12,13,14]. Soybean paste can be produced using three fermentation methods: traditional spontaneous fermentation, low-salt, solid-state fermentation, and high-salt, diluted-state fermentation. Traditional spontaneous fermentation is the common fermentation method currently adopted by most enterprises. Caishiji soybean paste (CSP) from Ma’anshan, Anhui Province, has been famous for hundred years. High-quality soybeans, cinnamon, anise, licorice, sugar, salt, and other additives are used to make traditional fermented CSP. Volatile flavor compounds (VFCs) determine the unique flavors of soybean pastes. The nutrition and flavor in the soybean paste determine its quality [15]. Many studies have performed the flavor analysis in soybean pastes. Jo et al. [16] analyzed the VFCs of Korean doenjang and found that the VFCs in traditional doenjang were mostly acids, aldehydes, phenols, pyrazines, and furans, whereas the VFCs in commercial doenjang were mostly ethyl esters, maltol, and ethanol. Lin et al. [17] investigated the nonvolatile organic acids and amino acids in Pixian bean paste and concluded that citric acid, glutamic acid, methionine, and proline were the main flavor compounds in the paste. Zhao et al. [18] compared the VFCs of Chinese soybean pastes and identified that there were seven kinds of VFCs in the naturally fermented sample, and these were higher than that in the inoculated samples. Using a complicated biological chain and non-biological reactions, the macromolecular substances, such as protein, starch, and lipids, in soybean paste raw materials were decomposed to produce multifarious secondary metabolites and tiny molecules, including organic acids, amino acids, esters, alcohols, ketones, aldehydes, and acids.
The diversity of microorganisms plays a key role in soybean paste fermentation, especially in flavor formation. An analysis result of microbial proteins in dajiang revealed that the composition and variety of microbial proteins involved in the processes of protein synthesis, glycometabolism, and nucleic acid synthesis are different [19]. Hao et al. [20] studied the content of biogenic amines and the bacterial diversity in the naturally fermented farmhouse sauce as well as the interactions between biogenic amines and microorganisms during fermentation. The core microbiota, VFCs, and correlations between them were evaluated, and the analysis results may be used to improve the quality of doubanjiang [21]. Controlling the flavor is difficult due to the complexity of the microbial community throughout the fermenting procedure; thus, more attention should be paid to the correlation between the microbial community and VFCs [22].
There are few studies on the correlation between microorganisms and the flavor of soybean paste. Soybean paste types have distinct flavors, depending on the area in which they are produced and the technologies with which they are produced. In this work, in order to reveal the unique nutriment, flavors, and microbiota in CSP, the VFCs and microbiota in CSP at different fermentation stages were identified using headspace gas chromatography–mass spectrometry (HS-GC-MS) [23] and MiSeq sequencing [24], respectively. Additionally, the correlations between them were determined through correlation analysis.

2. Materials and Methods

2.1. Sample Preparation

The CSP samples were separated into six independent batches according to their fermentation stage: the beginning or the first, second, third, sixth, or eighth month of fermentation (CG0, CG1, CG2, CG3, CG6, and CG8, respectively). The samples were obtained from Anhui Ma’anshan Caishiji Foods, China. A multipoint sampling method was utilized (Figure S1), and the samples were kept at 4 °C for further analysis.

2.2. Identification of VFCs through HS-GC-MS

The fiber (50/30 µm DVB/CAR/PDMS) (Supelco, Inc., Bellefonte, PA, USA) was inserted into the headspace of a 20 mL glass vial containing a 2.0 g sample of CSP and 20 µL of 2,4,6-trimethylpyridine; the vial was sealed with a Teflon cover, and the sample was incubated at 70 °C for 60 min [25]. The GC-MS system (HP6890/5975C; Agilent, CA, USA) was used to analyze the VFCs according to previously reported methods with some modifications [26]. The initial oven temperature was 40 °C, which was retained for 5 min, raised by 5 °C/min to 60 °C, retained for 5 min, raised by 2 °C/min to 120 °C, retained for 5 min, raised by 10 °C/min to 250 °C, and retained for 3 min. The split ratio was 5:1. The temperature of the quadrupoles and transfer line was 150 °C and 250 °C, respectively. The energy of the electron hit was 70 eV, and the scanning range was 45–450 m/z.

2.3. Qualitative and Quantitative Analysis of VFCs

The retention index (RI) of C7-C40 normal paraffin under the same GC-MS conditions was used to ascertain the RIs of all the VFCs, and they were compared with relevant reference values. Each RI was calculated as follows:
R I = 100 n + 100 × t R t R n t R n + 1 t R n
where n and n + 1 are the numbers of normal paraffin carbon atoms before and after the addition of the VFCs, respectively. tRn and tRn+1 are n-alkane retention times, and tR is the retention time of the unknown in the chromatography (min; tRn < tR < tRn+1).
According to the internal standard content, the VFC content of each sample was computed as follows:
C = A x × C 0 × V A 0 × m × 1000
where C is the VFC content (μg/kg), Ax is the peak area of the VFCs (AU·min), C0 is the mass concentration of the internal standard (0.996 μg/μL), A0 is the peak area of the internal standard (AU·min), V is the injection amount of internal standard (μL), and m is the quality of the sample (g).
To evaluate the contribution of the VFCs to the flavor in CSP, the odor activity value (OAV) was computed as follows:
O A V = C T
where C is the VFC content (μg/kg), and T is the VFC detection threshold (μg/kg).

2.4. DNA Extraction, PCR Amplification, and Illumina MiSeq Sequencing Analysis

DNA extraction, PCR amplification, and Illumina MiSeq sequencing experiments were conducted on the basis of the previous work [27] with minor modifications (Omega Bio-tek, Norcross, GA, USA). The V4–V5 regions of bacterial 16S rRNA genes were amplified using the universal primers, 338 F and 806 R (GeneAmp 9700, Applied Biosystems, Foster City, CA, USA).
For each reaction, the following were used: a 20 µL mixture containing 4 µL of 5 × FastPfu Buffer, 2 µL of 2.5-mM deoxynucleotide triphosphate, 0.8 µL of forward primer (5 µM), 0.8 µL of reverse primer (5 µM), 0.4 µL of FastPfu Polymerase, 0.2 µL of bovine serum albumin, 20 µL of ddH2O, and 10 ng of template DNA. The response conditions were as follows: initial denaturation 95 °C for 3 min; for bacteria, 35 amplification cycles of 95 °C for 15 s; for fungus, 35 amplification cycles of 95 °C for 15 s; the last 55 °C for 30 s, 72 °C for 45 s, 72 °C for 10 min (Majorbio, Shanghai, China). The PCR products were extracted from 2% agarose gel, and amplicons were quantified using a QuantiFluor-ST fluorometer (Promega, Beijing, China). After amplification, the PCR products were sequenced on the Illumina MiSeq platform (Illumina, San Diego, CA, USA).

2.5. Data Analysis

The aligned sequences were clustered into operational taxonomic units (OTUs) at a 97% similarity threshold using the USERCH sequence analysis tool. The taxonomic classifications of the OTUs were studied by comparing the sequences with those in the SILVA and UNITE databases. The Sobs index and Circos data were calculated using Mothur software. R values were used to determine the Pearson correlation coefficients, and correlations of microbiota and VFCs were visualized by heat map. All the data are presented as the averages (±SD) of three repeated tests. The SPSS software package (version 22.0; SPSS, IBM, Armonk, NY, USA) and the Origin software package (version 7.0; OriginLab, Northampton, MA, USA) were used for all statistical analyses.

3. Results

3.1. VFC Changes during CSP Fermentation

More than 70 VFCs (including 8 acids, 15 esters, 8 alcohols, 14 aldehydes, 4 ketones, 5 phenols, and 20 miscellaneous VFCs) were detected during the CSP fermentation process (Table 1). As indicated in the Venn diagram in Figure 1a, 17 of the VFCs were common in CSP at all stages, and there were also their own unique VFCs in each stage samples (the quantity and composition of the VFCs are presented in Figures S1 and S2). Among the VFCs identified, esters, aldehydes, and alcohols were the main VFCs in CSP. All eight acids were detected in CG1, and there were only octanoic acid and nonanoic acid in CG6 and CG8. Esters, including amyl acetate, α-pentyl-γ-butyrolactone, ethyl palmitate, and diethyl phthalate, were the most abundant VFCs throughout the CSP fermentation process, whereas in the late stages of CSP fermentation, the relative abundance of the alcohols and aldehydes was the highest. Furthermore, the analyzed VFC results revealed that aldehydes of which isovaleraldehyde, 2-methylbutyraldehyde, benzaldehyde, and phenylacetaldehyde were common in all fermentation stages, and they obviously contributed to the flavor of the CSP. In summary, all the VFCs identified in the CSP fermentation process exhibited distinct qualitative and quantitative characteristics, which may lead to diverse flavors of CSP.
To assess the contribution of characteristic VFCs to the overall flavor of CSP, the OAV analysis was conducted according to the odor threshold values of the VFCs. The results revealed that CSP contains 12 kinds of VFCs: one acid, three esters, one alcohol, and seven aldehydes (OAV ≥ 1, Table 2). Based on the OAV analysis results, the principal component analysis (PCA) was used to investigate the contribution rates of the characteristic VFCs to CSP flavor (Figure 1b). The two-dimension PCA model (F1 and F2) described 77.2% of the total variance, while the first and second principal components (F1 and F2) explained 57.8% and 19.4%, respectively. Isovaleraldehyde, 2-methylbutyraldehyde, and 3-methylthiopropionaldehyde greatly contributed to the flavor of CSP and were, therefore, included in the later correlation analysis.

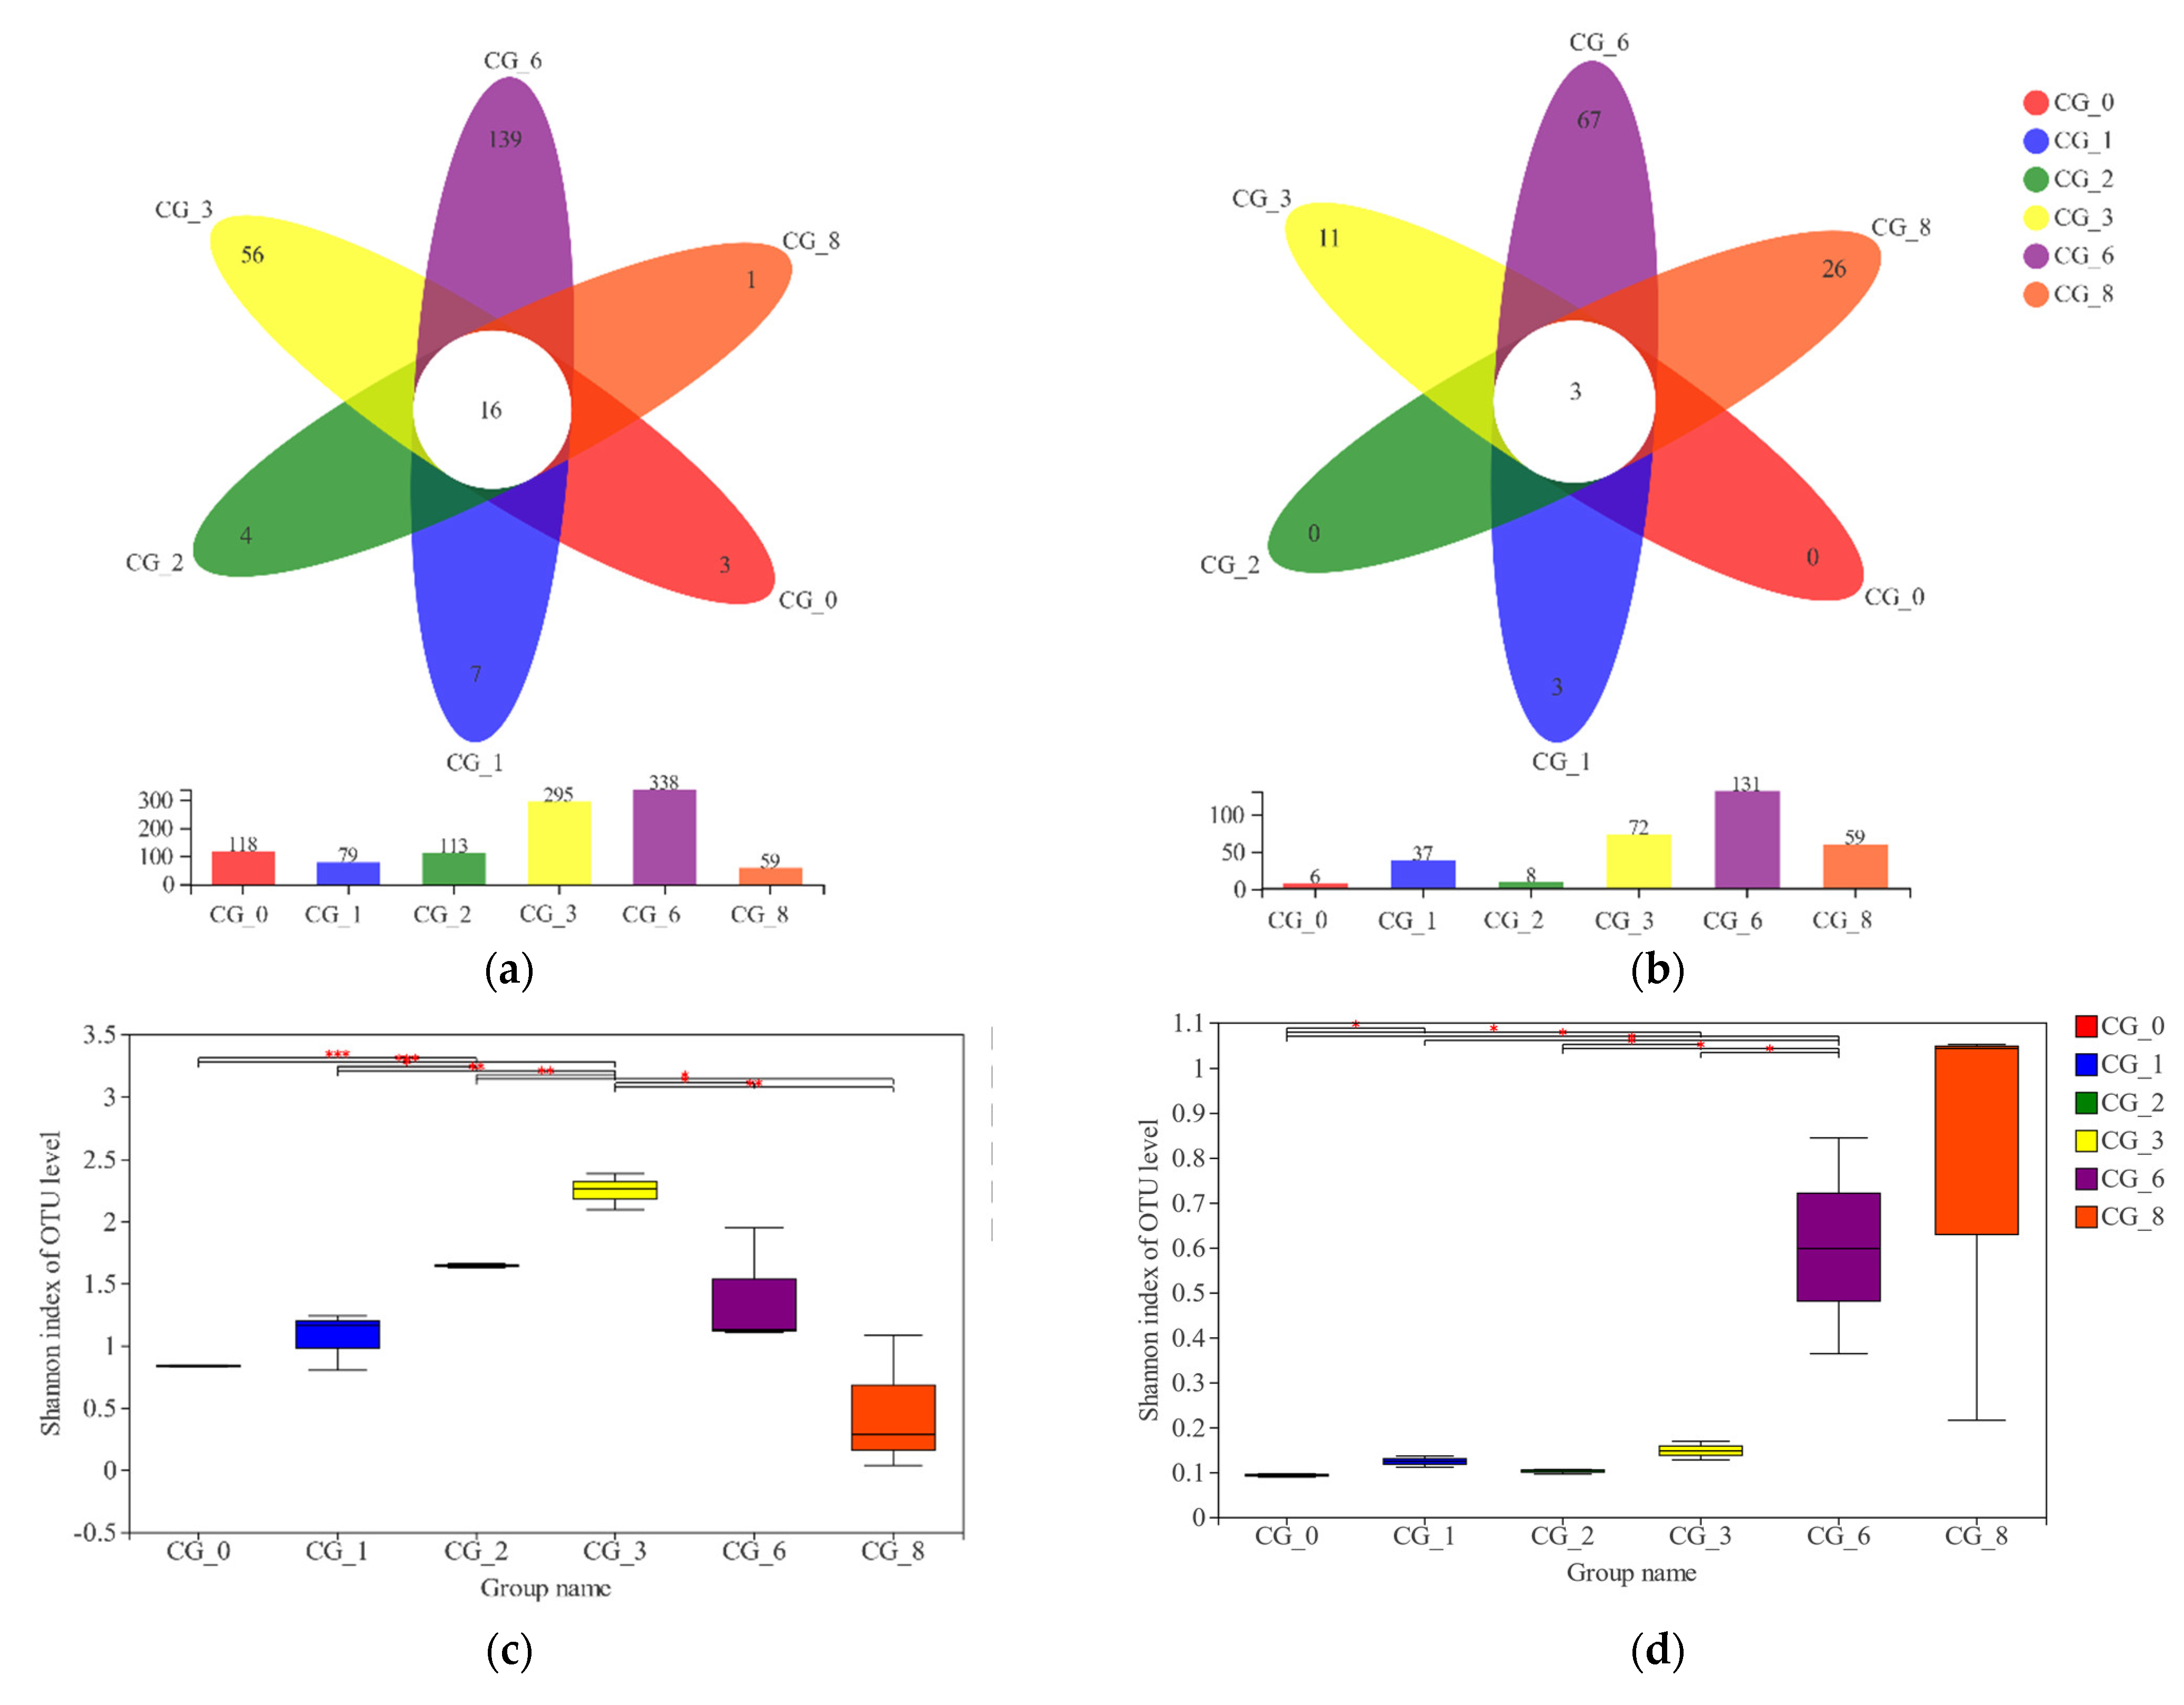
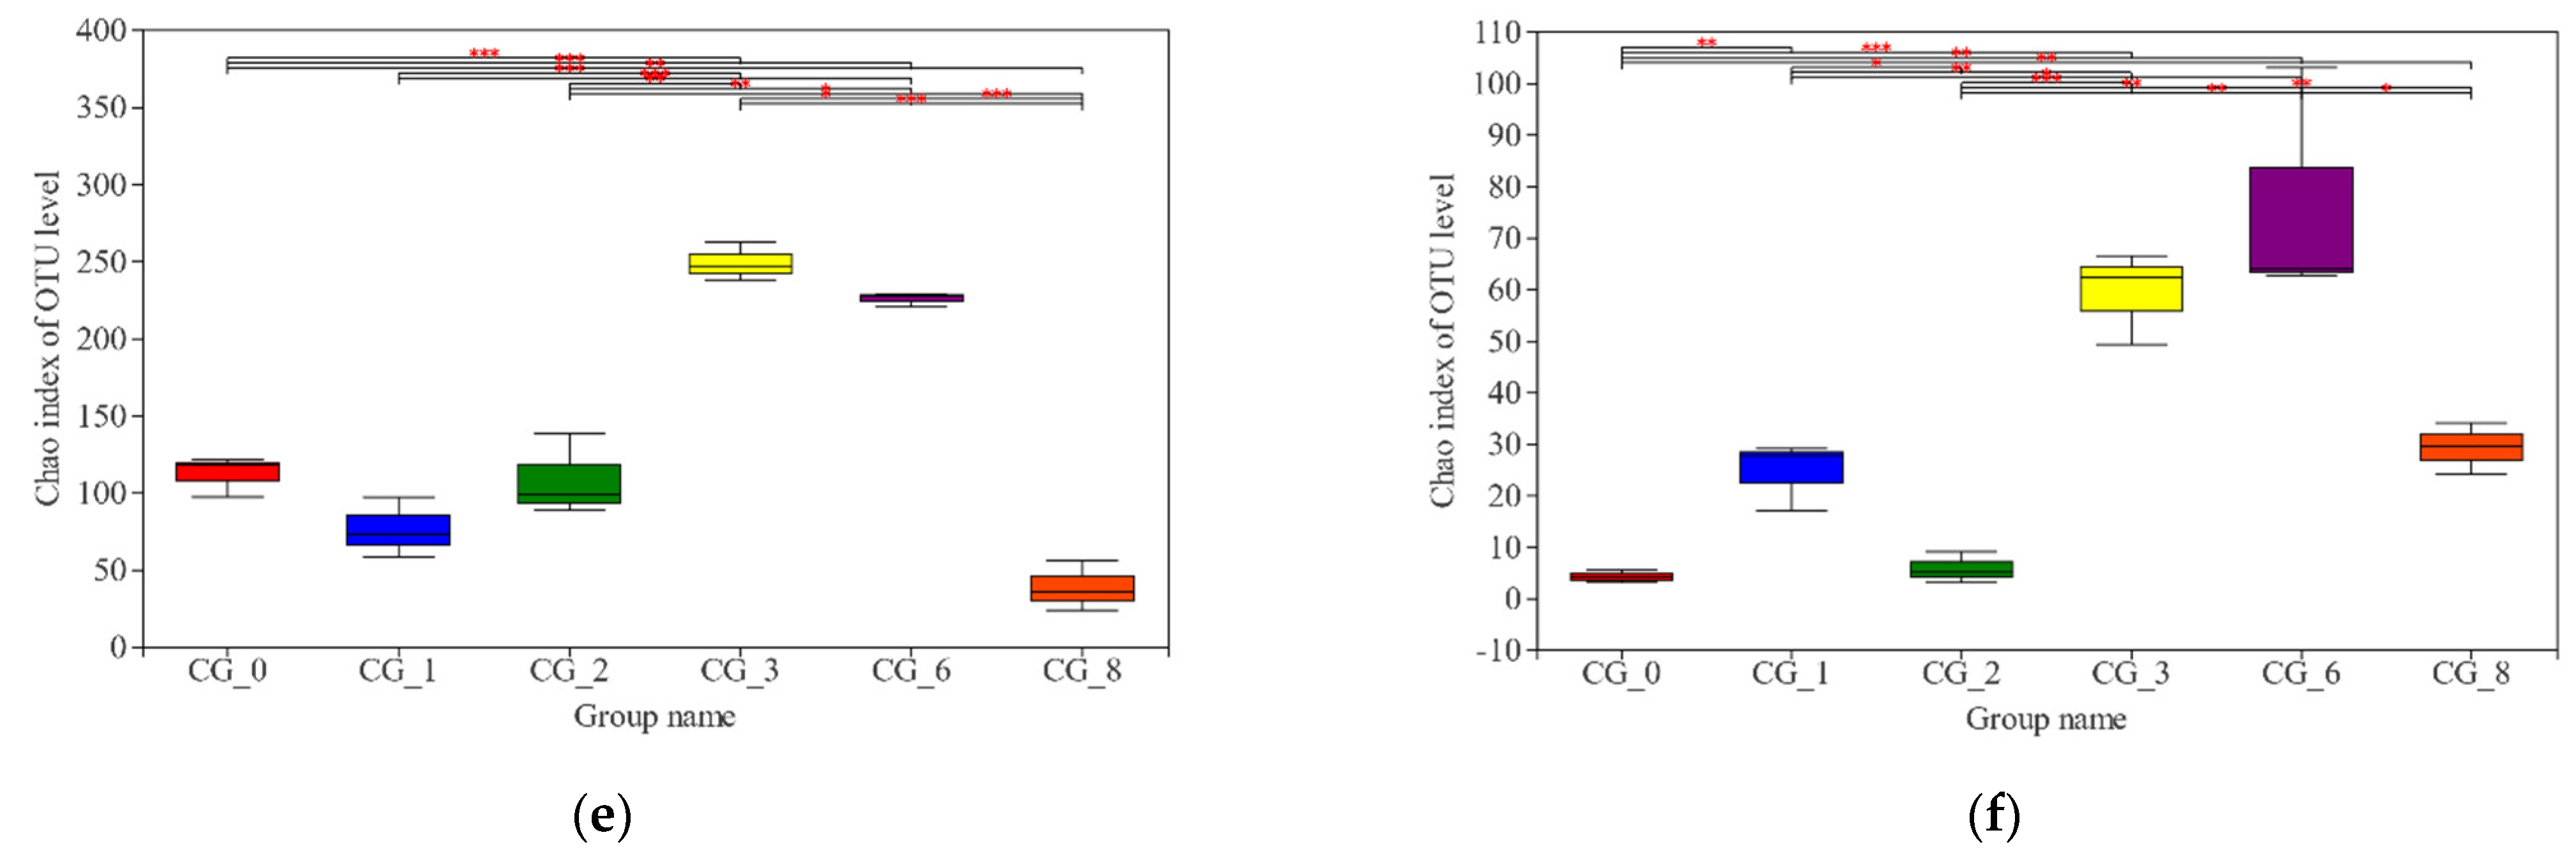
3.2. Dynamics of Microbiota during CSP Fermentation

Illumina MiSeq sequencing was conducted to investigate the microbial diversity during the CSP fermentation. The aligned sequences were clustered into OTUs at a 97% similarity threshold. In total, 16 and 3 species of bacteria and fungi, respectively, were common to all stages during the CSP fermentation, and the species were most abundant in CG3 and CG6 (Figure 2 and Figure S3). Regarding the α-diversity indices employed in this study, the Chao index and the Shannon index were used to quantify microbial richness and diversity, respectively. The red mark (Figure 2) indicates significant similarities and differences among the microbiota present at different stages of CSP fermentation. The samples exhibited higher microbial diversity at later stages of fermentation: bacterial diversity increased sharply in the CG3, CG6, and CG8 phases, and fungi diversity increased sharply in the CG6 and CG8 phases; the increasing trends in the other stages were relatively gently (Figure 2). Consistent with the dynamic changes in microbiota at different stages of CSP fermentation, the diversity of the bacteria was higher than that of the fungi (Tables S1 and S2).
Circos was used to construct a circle graph to visualize the distribution of dominant species in each sample and among the different samples. The bacterial and fungal genera with the 20 highest abundances were obtained. Genera with a relative abundance higher than 4% were classified as dominant. There were five dominant bacterial genera (Bacillus, Tetragenococcus, Salinivibrio, Halomonas, and Staphylococcus) and four dominant fungal genera (Aspergillus, Debaryomyces, Nigrospora, and Curvularia), which were detected during the CSP fermentation process (Figure 3b). In CG0, Tetragenococcus (83.72%) and Staphylococcus (5.48%) were the dominant bacterial genera, and Aspergillus (≥99.9%) was the dominant fungal genus. The relative abundances of Tetragenococcus, Staphylococcus, and Aspergillus in CG1 and CG2 were 29.9–67.34%, 5.32–7.38%, and 99.9%, respectively. Some emerging bacterial genera, such as Klebsiella (5.47%) and unclassified Bacillus (5.06%), were also detected in these samples. The dominant bacterial genera in CG3 and CG6 were Bacillus (24.97–66.79%), Salinivibrio (9.53–39.55%), Halomonas (6.36–10.50%), and Tetragenococcus (7.24%), while the dominant fungal genera were Aspergillus (≥90.0%) and Debaryomyces (5.37%). The relative abundance of Bacillus, Salinivibrio, and Aspergillus in CG8 were 88.51%, 9.99%, and 88.58%, respectively. Orenia (9.55%), an emerging bacterial genus, was also identified in CG8. All the results suggested that the composition and species of microbiome in CSP were changing during the fermentation process, which may affect the quality and flavor of CSP.

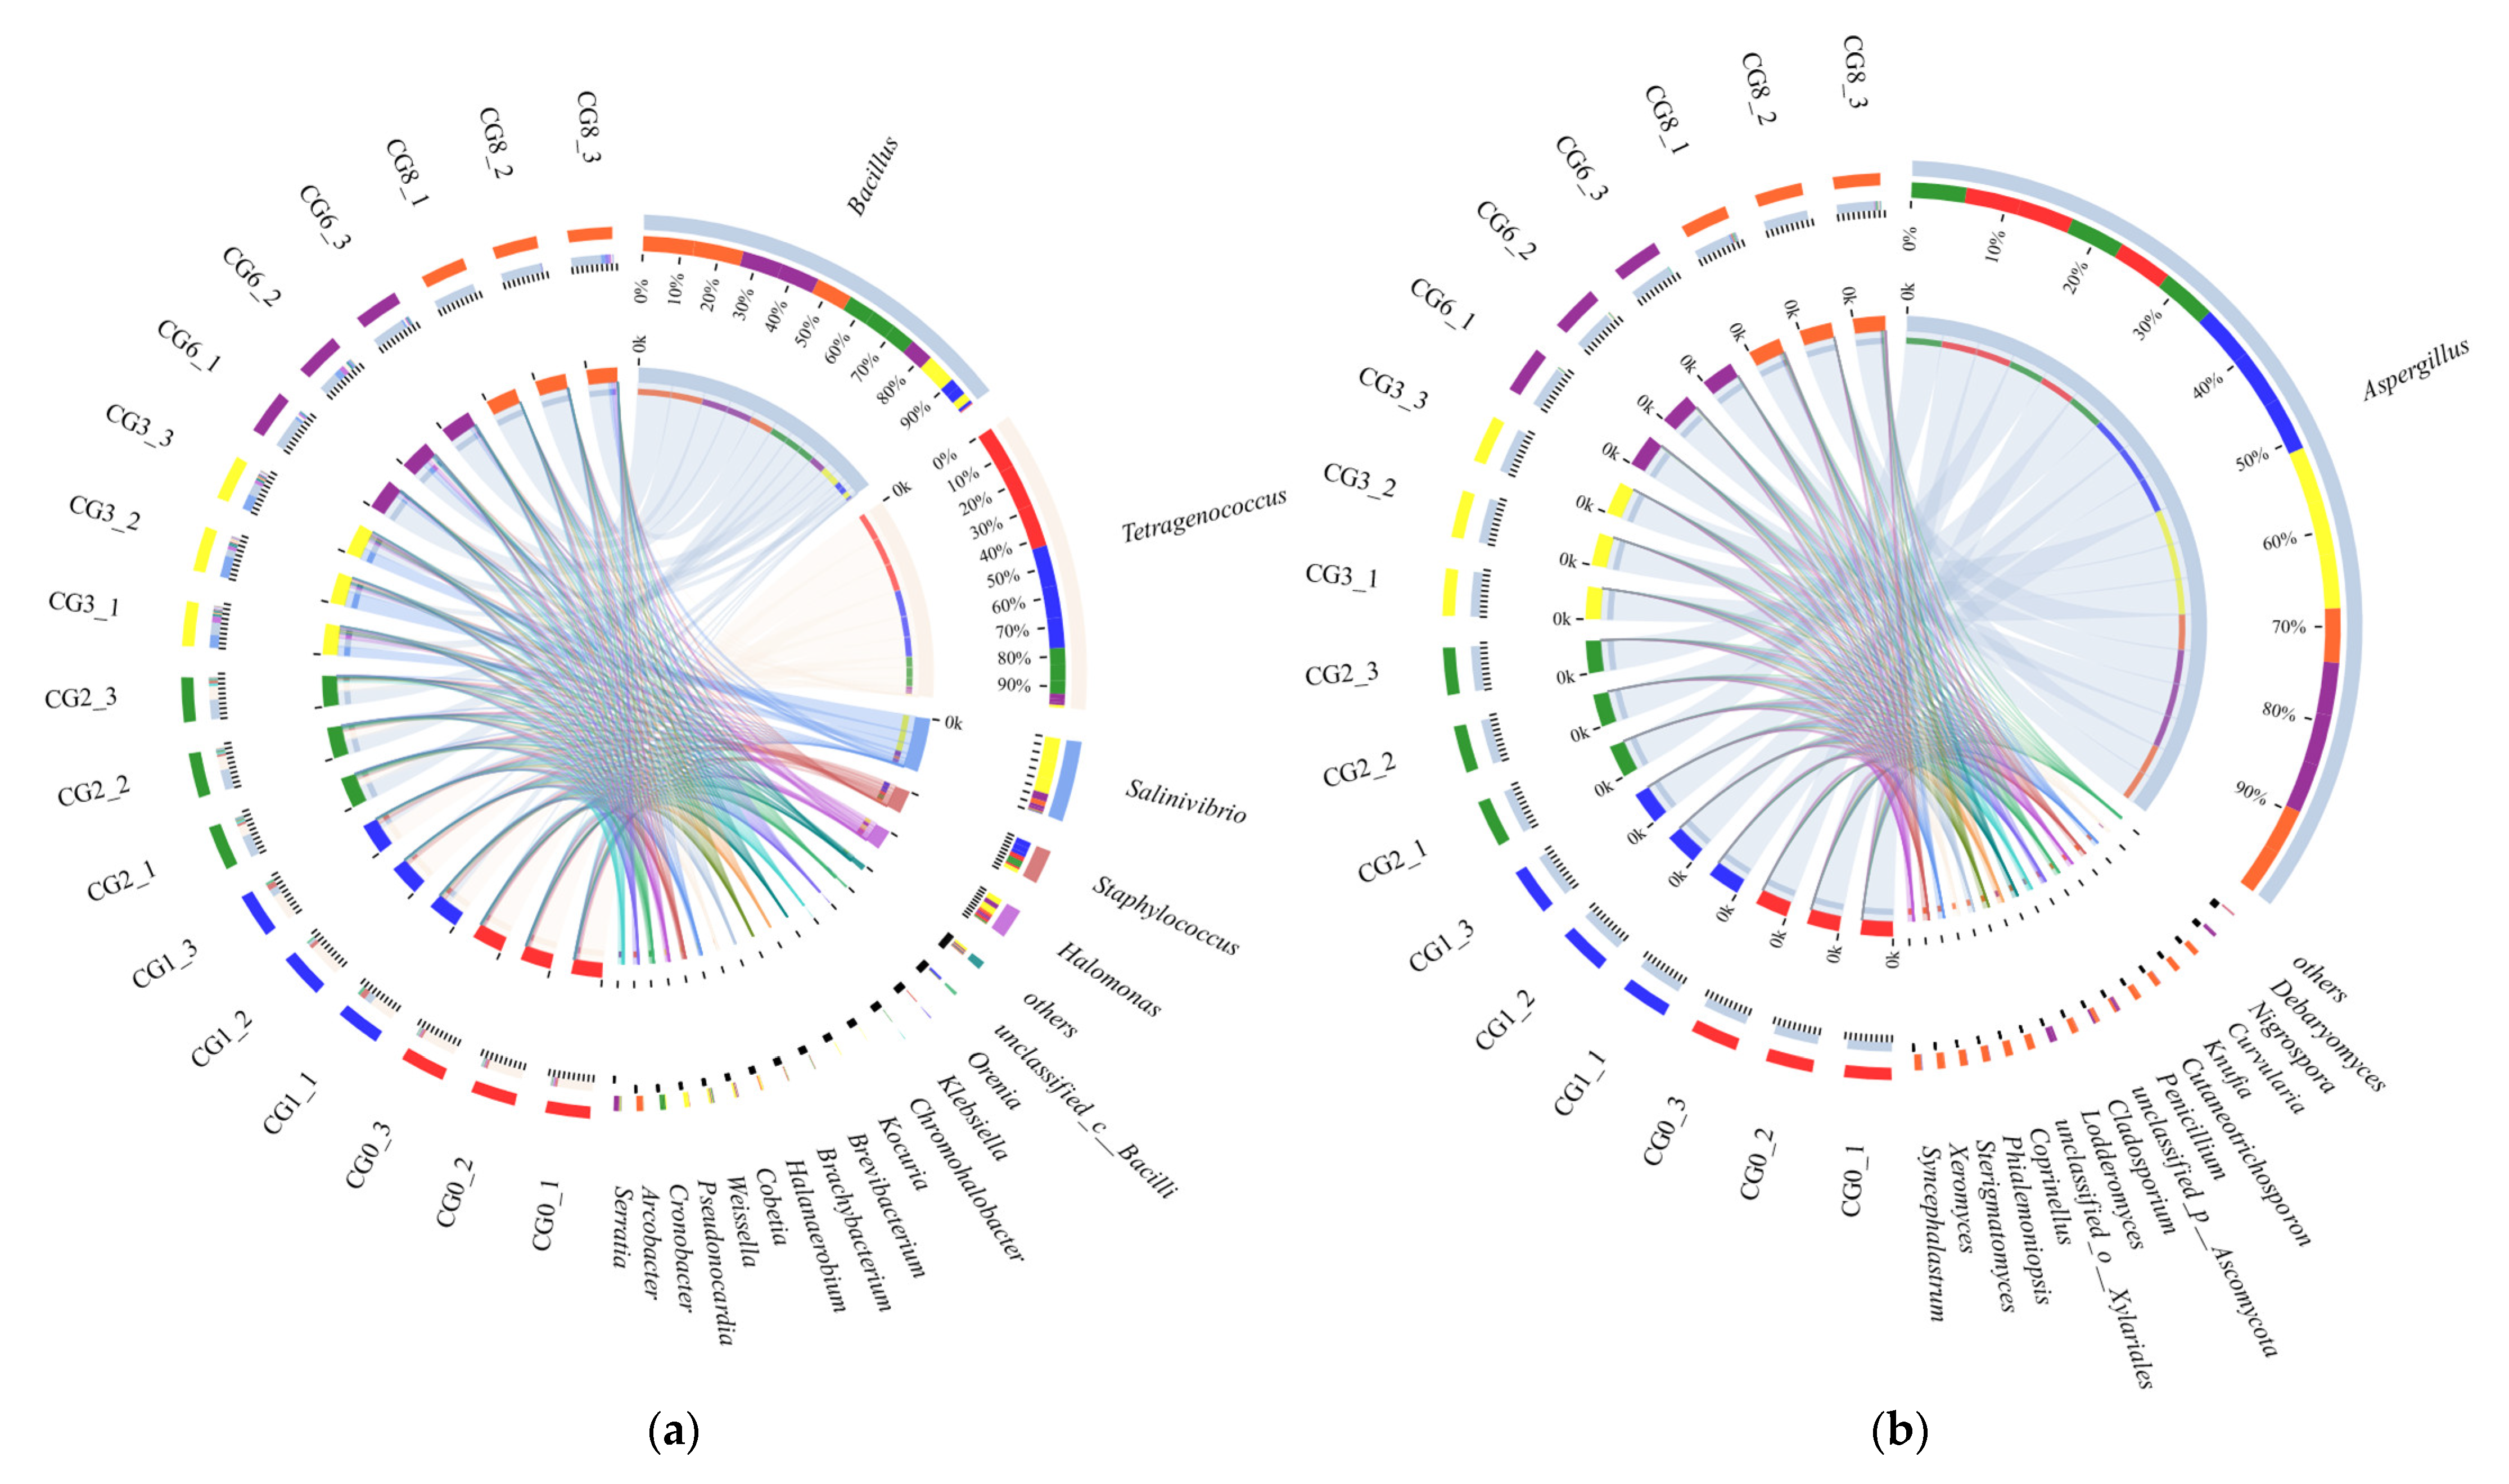
3.3. Correlation Analysis of Microbiota and Characteristic VFCs

In this study, R values and Pearson correlation coefficients were calculated to analyze the connections between microbiota and characteristic VFCs in CSP. The bacterial and fungal genera with the 10 highest abundances were included in the correlation analysis. Redundancy analysis (RDA) was conducted to evaluate the complex relationships among the microbiota, VFCs, and CSP fermentation stages. On the basis of the PCA results, isovaleraldehyde, 2-methylbutyraldehyde, and 3-methylthiopropionaldehyde were selected for the RDA. The results revealed that compared with isovaleraldehyde and 3-methylthiopropionaldehyde, the microorganisms exerted a greater effect on 2-methylbutyraldehyde in CG3, CG6, and CG8. These three characteristic VFCs were positively correlated (Figure 4c,d).

4. Discussion

VFCs and microbiota strongly affect the flavor of soybean paste. In this study, VFCs and microbiota in CSP at different fermentation stages (CG0, CG1, CG2, CG3, CG6, CG8) were detected to identify potential correlations between them. More than 70 types of VFCs, including 12 types of characteristic VFCs (based on OAV), were detected. Among them, esters, alcohols, and aldehydes were the most prevalent in the CSP fermentation process.
The contributions of VFCs to CSP flavor depend not only on their concentrations but also on their odor threshold values [22]. Esters (especially short-chain esters), which are formed by a series of esterification reactions, are vital aromatic compounds in fermented foods, and it can endow fermented foods with sweetness and fruitiness. In the present study, 15 esters were detected during the CSP fermentation process. Among them, amyl acetate, α-pentyl-γ-butyrolactone, and ethyl palmitate, which have also been identified in other fermented soybean products, were common to CSP at differing fermentation stages. Based on the results of OAV analysis, ethyl butyrate, ethyl caproate, and hexyl caproate were the esters that most strongly affected the flavor of CSP. Ethyl butyrate, which produces a beany flavor [28], was detected only in CG3, and ethyl hexanoate and hexyl caprylate, which produce fruity flavors [28], were detected in CG1 and CG3. Most of the alcohols, which can endow CSP with pleasantly sweet and floral flavors, were formed in the later fermentation period. Isoamyl alcohol, 2-methyl-1-butanol, 1-pentanol, 2,3-butanediol, and 1-nonyl-3-ol were detected in CG6 and CG8. Phenethyl alcohol, which produces aromatic flavors [29], most strongly affected the flavor of CG3 according to the results of the OAV analysis. Aldehydes, including monoolefinic aldehyde, dialdehyde, and saturated aldehyde, which are mainly produced by the lipoxygenase-catalyzed decomposition of linoleic and linolenic acids, can endow fermented foods with sweet, fruity, nutty, and caramel flavors [30]. Fourteen aldehydes were detected in CSP, most of which were formed during the late stages of the fermentation process. The results of the OAV analysis indicated that seven characteristic aldehydes affected the flavor of CSP. Isovaleraldehyde, 2-methylbutyraldehyde, and benzaldehyde, which produce fruity flavors, stimulating odors, and cherry like flavors, respectively [29], were detected in each fermentation stage; 3-methylthiopropionaldehyde, which had the highest OAV value, can endow CSP with a strong roasted-potato flavor [29]. Although the other VFCs had lower thresholds, they may also endow CSP with strong flavors.
Microbiotas are the main contributors to soybean paste fermentation [31,32]. The fermentation of soybean paste involves a variety of bacteria and fungi. In addition, soybean pastes with distinct microbiota exhibit distinct flavors and qualities. In some previous studies, Bacillus, Aspergillus, Tetragenococcus, Salinivibrio, Halomonas, and Staphylococcus were the most abundant genera in CSP (Figure 3). During the fermentation process, the relative abundance of Bacillus increased, while that of Staphylococcus decreased or even disappeared completely. Tetragenococcus is closely related to the production of biogenic amines, which directly affect the flavor and safety of soybean paste; therefore, regulation of Tetragenococcus content is essential [1]. Aspergillus was the predominant fungal genus in CSP samples; it is found in soy sauce, douchi, and vinegar [33]. Compared with the other genera identified in this study, Aspergillus exhibits a higher tolerance to dryness. The analysis of microbial dynamics revealed that bacteria were involved in the decomposition of materials in the CSP fermentation, whereas most of the fungi were presented in the late stages of fermentation. The fermentation of soybean paste takes place mostly in anaerobic and high-humidity environments. Compared with bacteria, fungi may disrupt metabolic activity under dry and aerobic conditions; thus, fungal communities play a more important role in fermented bean paste.
The relationships between microbiota and VFCs in traditional fermented foods have been researched; however, such studies have produced limited relevant data. In the present study, we analyzed the complex connections between the microbiota and 12 characteristic VFCs during the CSP fermentation. As indicated in Figure 4, the Pearson’s correlation coefficients (r) and significance (p) were calculated, and the bacteria and fungi with the 10 highest abundances were obtained. The 2-Methylbutyraldehyde was significantly positively correlated with Bacillus and Orenia (r > 0.7) but significantly negatively correlated with Tetragenococcus and Staphylococcus. Kocuria had a positive correlation with vanillin, and Halomonas was negatively correlated with isobutyric acid and ethyl butyrate (Figure 3a). The 2-Methylbutyraldehyde, 3-methylthiopropionaldehyde, nonanaldehyde, and decyl aldehyde were significantly negatively correlated with Aspergillus, but they were positively correlated with other fungi, such as Debaryomyces, Nigrospora, Curvularia, and Penicillium. Vanillin was positively correlated with Aspergillus but negatively correlated with Cladosporium, Curvularia, and Cutaneotrichosporon (Figure 3b). Through correlation analysis, microbiotas were determined to be the main factors affecting the generation of flavor compounds during the CSP fermentation. For example, Bacillus and Orenia may produce undesirable flavor compounds during CSP fermentation, whereas Aspergillus, Etragenococcus, and Staphylococcus may produce flavor-enhancing compounds. Through detection and analysis, the connections between microbiota and characteristic VFCs were determined. In follow-up studies, these correlations should be verified in application and potentially used to further advancements in “omics” technologies.

5. Conclusions

MiSeq sequencing technology is widely used, and correlation analysis of microbiota and VFCs has attracted considerable attention. In the present study, the complex influences of microbiota on the formation of VFCs during CSP fermentation were analyzed. The results indicated that Bacillus, Tetragenococcus, Staphylococcus, and Aspergillus were the main microbiota affecting the flavor of CSP. Although correlation studies involving many fermented foods have been conducted, the results of such studies still lack practical applicability. Therefore, follow-up research should focus on such practical applications to improve the sensory features of fermented soybean paste, and the pastes with consistent flavor profiles may be produced.

Supplementary Materials

The following supporting information can be downloaded at: https://www.mdpi.com/article/10.3390/fermentation8050196/s1, Table S1: Alpha diversity index of bacteria of Caishiji soybean paste in different fermentation stages, Table S2: Alpha diversity index of fungi of Caishiji soybean paste in different fermentation stages, Figure S1: Multi-point sampling (a) and numbers of different VFCs (b) of Caishiji soybean paste in different fermentation stages, Figure S2: Contents of main volatile components of Caishiji soybean paste in different fermentation stages (a: alcohols, b: esters, c: aldehydes, d: miscellaneous), Figure S3: Simpson curves of the bacteria (a) and fungi (b) of Caishiji soybean paste in different fermentation stages.

Author Contributions

Conceptualization: X.L.; methodology: Y.H. and W.W.; software: J.C.; formal analysis: J.C. and Y.H.; investigation: J.C. and Y.H.; resources: X.L.; data curation: D.M.; writing (original draft preparation): J.C. and Y.H.; writing (review and editing): X.L. and X.W.; visualization: X.W. and D.M.; supervision: X.L. and S.J.; project administration: X.L.; funding acquisition: X.L. All authors have read and agreed to the published version of the manuscript.

Funding

This research was funded by [the Project of Anhui Province] grant number [201903a06020034, 201903a06020007, 2108085MC123], and [the Fundamental Research Funds for the Central Universities of China] grant number [PA2021KCPY0048].

Institutional Review Board Statement

Not applicable.

Informed Consent Statement

Not applicable.

Data Availability Statement

The sequences from this study were deposited into the NCBI Sequence Read Archive (SRA) database (accession number:SRP255336; NCBI BioProject PRJNA623258).

Acknowledgments

This work was supported by the Project of Anhui Province [grant numbers 201903a06020034, 201903a06020007, 2108085MC123], and the Fundamental Research Funds for the Central Universities of China [grant number PA2021KCPY0048].

Conflicts of Interest

This manuscript has not been published or presented elsewhere in part or in entirety and is not under consideration by another journal. The authors declare no conflict of interest.

References

  1. Byun, B.Y.; Mah, J.H. Occurrence of Biogenic Amines in Miso, Japanese Traditional Fermented Soybean Paste. J. Food Sci. 2012, 77, T216–T223. [Google Scholar] [CrossRef] [PubMed]
  2. Kim, T.W.; Lee, J.H.; Kim, S.E.; Park, M.H.; Chang, H.C.; Kim, H.Y. Analysis of Microbial Communities in Doenjang, a Korean Fermented Soybean Paste, Using Nested PCR-Denaturing Gradient Gel Electrophoresis. Int. J. Food Microbiol. 2009, 131, 265–271. [Google Scholar] [CrossRef] [PubMed]
  3. Chung, H.Y.; Fung, P.K.; Kim, J.S. Aroma Impact Components in Commercial Plain Sufu. J. Agric. Food Chem. 2005, 53, 1684–1691. [Google Scholar] [CrossRef]
  4. Feng, Z.; Gao, W.; Ren, D.; Chen, X.; Li, J.J. Evaluation of Bacterial Flora during the Ripening of Kedong Sufu, a Typical Chinese Traditional Bacteria-Fermented Soybean Product. J. Sci. Food Agric. 2013, 93, 1471–1478. [Google Scholar] [CrossRef] [PubMed]
  5. Han, B.Z.; Rombouts, F.M.; Robert Nout, M.J. A Chinese Fermented Soybean Food. Int. J. Food Microbiol. 2001, 65, 1–10. [Google Scholar] [CrossRef]
  6. Lioe, H.N.; Selamat, J.; Yasuda, M. Soy Sauce and Its Umami Taste: A Link from the Past to Current Situation. J. Food Sci. 2010, 75, R71–R76. [Google Scholar] [CrossRef]
  7. Wei, Q.Z.; Wang, H.B.; Chen, Z.X.; Lv, Z.J.; Xie, Y.F.; Lu, F.P. Profiling of Dynamic Changes in the Microbial Community during the Soy Sauce Fermentation Process. Appl. Microbiol. Biotechnol. 2013, 97, 9111–9119. [Google Scholar] [CrossRef]
  8. Yang, Y.; Deng, Y.; Jin, Y.L.; Liu, Y.X.; Xia, B.X.; Sun, Q. Dynamics of Microbial Community during the Extremely Long-Term Fermentation Process of A Traditional Soy Sauce. J. Sci. Food Agric. 2017, 97, 3220–3227. [Google Scholar] [CrossRef]
  9. Chen, T.T.; Wang, M.J.; Jiang, S.Y.; Xiong, S.Q.; Zhu, D.C.; Wei, H. Investigation of the Microbial Changes during Koji-Making Process of Douchi by Culture-Dependent Techniques and PCR-DGGE. Int. J. Food Sci. Technol. 2011, 46, 1878–1883. [Google Scholar] [CrossRef]
  10. Chen, T.T.; Wang, M.J.; Li, S.J.; Wu, Q.L.; Wei, H. Molecular Identification of Microbial Community in Surface and Undersurface Douchi during Postfermentation. J. Food Sci. 2014, 79, M653–M658. [Google Scholar] [CrossRef]
  11. Wang, H.; Yin, L.J.; Cheng, Y.Q.; Li, L.T. Effect of Sodium Chloride on the Color, Texture, and Sensory Attributes of Douchi during Post-Fermentation. Int. J. Food Eng. 2012, 8, 22. [Google Scholar] [CrossRef]
  12. Jung, K.O.; Park, S.Y.; Park, K.Y. Longer Aging Time Increases the Anticancer and Antimetastatic Properties of Doenjang. Nutrition 2006, 22, 539–545. [Google Scholar] [CrossRef] [PubMed]
  13. Park, K.Y.; Jung, K.O.; Rhee, S.H.; Choi, Y.H. Antimutagenic Effects of Doenjang (Korean Fermented Soypaste) and Its Active Compounds. Mutat. Res. Lett. 2003, 523, 43–53. [Google Scholar] [CrossRef]
  14. Shin, Z.I.; Yu, R.; Park, S.A.; Chung, D.K.; Ahn, C.W.; Nam, H.S.; Kim, K.S.; Lee, H.J. His-His-Leu, An Angiotensin I Converting Enzyme Inhibitory Peptide Derived from Korean Soybean Paste, Exerts Antihypertensive Activity in Vivo. J. Agric. Food Chem. 2001, 49, 3004–3009. [Google Scholar] [CrossRef]
  15. Liu, J.J.; Han, B.Z.; Deng, S.H.; Sun, S.P.; Chen, J.Y. Changes in Proteases and Chemical Compounds in the Exterior and Interior of Sufu, a Chinese Fermented Soybean Food, during Manufacture. LWT Food Sci. Technol. 2018, 87, 210–216. [Google Scholar] [CrossRef]
  16. Jo, Y.J.; Cho, I.H.; Song, C.K.; Shin, H.W.; Kim, Y.S. Comparison of Fermented Soybean Paste (Doenjang) Prepared by Different Methods Based on Profiling of Volatile Compounds. J. Food Sci. 2011, 76, C368–C379. [Google Scholar] [CrossRef]
  17. Lin, H.B.; Yu, X.Y.; Fang, J.X.; Lu, Y.H.; Liu, P.; Xing, Y.G.; Wang, Q.; Che, Z.M.; He, Q. Flavor Compounds in Pixian Broad-Bean Paste: Non-Volatile Organic Acids and Amino Acids. Molecules 2018, 23, 1299. [Google Scholar] [CrossRef] [Green Version]
  18. Zhao, J.X.; Dai, X.J.; Liu, X.M.; Zhang, H.; Tang, J.; Chen, W. Comparison of Aroma Compounds in Naturally Fermented and Inoculated Chinese Soybean Pastes by GC-MS and GC-Olfactometry Analysis. Food Control 2011, 22, 1008–1013. [Google Scholar] [CrossRef]
  19. Zhang, P.; Zhang, P.F.; Xie, M.X.; An, F.Y.; Qiu, B.S.; Wu, R. Metaproteomics of Microbiota in Naturally Fermented Soybean Paste, Da-Jiang. J. Food Sci. 2018, 83, 1342–1349. [Google Scholar] [CrossRef] [PubMed]
  20. Hao, Y.; Sun, B. Analysis of Bacterial Diversity and Biogenic Amines Content during Fermentation of Farmhouse Sauce from Northeast China. Food Control. 2020, 108, 106861. [Google Scholar] [CrossRef]
  21. Li, Z.; Dong, L.; Huang, Q.; Wang, X. Bacterial Communities and Volatile Compounds in Doubanjiang, a Chinese Traditional Red Pepper Paste. J. Appl. Microbiol. 2016, 120, 1585–1594. [Google Scholar] [CrossRef] [PubMed]
  22. Xie, C.Z.; Zeng, H.Y.; Wang, C.X.; Xu, Z.M.; Qin, L.K. Volatile Flavour Components, Microbiota and Their Correlations in Different Sufu, a Chinese Fermented Soybean Food. J. Appl. Microbiol. 2018, 125, 1761–1773. [Google Scholar] [CrossRef] [PubMed]
  23. Cocolin, L.; Alessandria, V.; Dolci, P.; Gorra, R.; Rantsiou, K. Culture Independent Methods to Assess the Diversity and Dynamics of Microbiota during Food Fermentation. Int. J. Food Microbiol. 2013, 167, 29–43. [Google Scholar] [CrossRef] [PubMed]
  24. Rodriguez-Burruezo, A.; Kollmannsberger, H.; Carmen Gonzalez-Mas, M.; Nitz, S.; Nuez, F. HS-SPME Comparative Analysis of Genotypic Diversity in the Volatile Fraction and Aroma-Contributing Compounds of Capsicum Fruits from the Annuum-Chinense-Frutescens Complex. J. Agric. Food Chem. 2010, 58, 4388–4400. [Google Scholar] [CrossRef]
  25. Li, X.Y.; Zhao, C.S.; Zheng, C.; Liu, J.; Vu, V.H.; Wang, X.D.; Sun, Q. Characteristics of Microbial Community and Aroma Compounds in Traditional Fermentation of Pixian Broad Bean Paste as Compared to Industrial Fermentation. Int. J. Food Prop. 2018, 20, S2520–S2531. [Google Scholar] [CrossRef]
  26. Kang, K.M.; Baek, H.H. Aroma Quality Assessment of Korean Fermented Red Pepper Paste (Gochujang) by Aroma Extract Dilution Analysis and Headspace Solid-Phase Microextraction-Gas Chromatography-Olfactometry. Food Chem. 2014, 145, 488–495. [Google Scholar] [CrossRef]
  27. Ye, J.B.; Yan, J.; Zhang, Z.; Yang, Z.C.; Liu, X.Z.; Zhou, H.; Wang, G.F.; Hao, H.; Ma, K.; Ma, Y.P.; et al. The Effects of Threshing and Redrying on Bacterial Communities that Inhabit the Surface of Tobacco Leaves. Appl. Microbiol. Biotechnol. 2017, 101, 4279–4287. [Google Scholar] [CrossRef]
  28. Moy, Y.S.; Lu, T.J.; Chou, C.C. Volatile Components of the Enzyme-Ripened Sufu, a Chinese Traditional Fermented Product of Soy Bean. J. Biosci. Bioeng. 2012, 113, 196–201. [Google Scholar] [CrossRef]
  29. Beaulieu, J.C.; Stein-Chisholm, R.E. HS-GC-MS Volatile Compounds Recovered in Freshly Pressed ‘Wonderful’ Cultivar and Commercial Pomegranate Juices. Food Chem. 2016, 190, 643–656. [Google Scholar] [CrossRef]
  30. Zhao, J.; Wang, M.; Xie, J.C.; Zhao, M.Y.; Hou, L.; Liang, J.J.; Wang, S.; Cheng, J. Volatile Flavor Constituents in the Pork Broth of Black-Pig. Food Chem. 2017, 226, 51–60. [Google Scholar] [CrossRef]
  31. Jung, J.Y.; Lee, S.H.; Jeon, C.O. Microbial Community Dynamics during Fermentation of Doenjang-Meju, Traditional Korean Fermented Soybean. Int. J. Food Microbiol. 2014, 185, 112–120. [Google Scholar] [CrossRef] [PubMed]
  32. Lee, J.H.; Kim, T.W.; Lee, H.; Chang, H.C.; Kim, H.Y. Determination of Microbial Diversity in Meju, Fermented Cooked Soya Beans, Using Nested PCR-Denaturing Gradient Gel Electrophoresis. Lett. Appl. Microbiol. 2010, 51, 388–394. [Google Scholar] [CrossRef] [PubMed]
  33. Wang, Z.M.; Lu, Z.M.; Shi, J.S.; Xu, Z.H. Exploring Flavour-Producing Core Microbiota in Multispecies Solid-State Fermentation of Traditional Chinese Vinegar. Sci. Rep. 2016, 6, 26818. [Google Scholar] [CrossRef] [PubMed] [Green Version]
Figure 1. Venn (a) and PCA (b) analysis of characteristic VFCs of Caishiji soybean paste in different fermentation stages. The samples were coded according to Section 2.
Fermentation 08 00196 g001
Figure 2. α- diversity analysis of bacterial (a,c,e) and fungi (b,d,f) of Caishiji soybean paste at different fermentation stages. (0.01 < p ≤ 0.05 marked as *, 0.001 < p ≤ 0.01 marked as **, p ≤ 0.001 marked as ***).
Fermentation 08 00196 g002aFermentation 08 00196 g002b
Figure 3. Circos of bacteria (a) and fungi (b) of Caishiji soybean paste in different fermentation stages. The right half circle represents the distribution of the species in different samples at the taxonomic level, the outer ribbon represents the species, the inner ribbon color represents the different groups, and the length represents the distribution of the sample in a species.
Fermentation 08 00196 g003
Figure 4. Heat-map (a,b) and RDA (c,d) correlation analysis of microbiota and characteristic VFCs of Caishiji bean paste in different fermentation stages. (R value was displayed in different colors in the heat-map. If the p value was less than 0.05, it is marked with *, the legend on the right side was the color range of different R values. * 0.01 < p ≤ 0.05, ** 0.001 < p ≤ 0.01, *** p ≤ 0.001. In RDA, the red arrow indicates the flavor substance, and the length of the arrow indicates the impact degree of the flavor substance on the species; the angle between the environmental factors arrows represents positive and negative correlation (acute angle: positive correlation; obtuse angle: negative correlation; right angle: no correlation); the distance from the projection point to the origin represents the relative impact of the flavor substance on the distribution of the sample community).
Fermentation 08 00196 g004
Table 1. Volatile flavor compounds of Caishiji soybean paste in different fermentation stages by GC-MS.
TR (s)CompoundsRIRI*Content (μg/kg)
CG-0CG-1CG-2CG-3CG-6CG-8
Acids (8)
3.223Acetic acid -ND14.50 ± 1.83NDNDNDND
10.340Isobutyric acid -ND2.78 ± 1.67NDNDNDND
18.196Isovaleric acid839.57841ND3.89 ± 0.82NDNDNDND
28.196Hexanoic acid972.62967ND4.81 ± 0.55NDNDNDND
40.684Benzoic acid1153.64-ND0.70 ± 0.06NDNDNDND
40.901Octanoic acid1176.251167ND2.40 ± 0.30NDND1.68 ± 0.307.51 ± 0.78
43.442Phenylacetic acid1247.63-ND0.31 ± 0.08NDNDNDND
43.859Nonanoic acid1275.31280ND0.57 ± 0.16NDND0.82 ± 0.271.19 ± 0.15
Esters (15)
4.6465Ethyl acetate--1.65 ± 2.00NDND7.24 ± 8.23NDND
15.778Ethyl butyrate782.65803NDND4.92 ± 1.61NDNDND
24.001Amyl acetate884.36-9.41 ± 1.580.86 ± 0.1919.15 ± 8.75103.82 ± 2.1869.30 ± 33.7222.37 ± 8.07
30.496Ethyl hexanoate984.831001ND6.97 ± 1.56ND7.45 ± 4.59NDND
41.529Ethyl benzoate1161.2511700.73 ± 0.16NDNDNDNDND
41.929Butyl hexanoate1375.85-ND26.72 ± 13.98ND2.00 ± 0.130.99 ± 0.3410.70 ± 3.64
42.096Ethyl octoate1203.45-ND26.72 ± 13.98ND3.74 ± 0.500.99 ± 0.3410.70 ± 3.64
46.328α-pentyl-γ-butyrolactone1284.99-1.65 ± 0.314.31 ± 0.580.67 ± 0.020.76 ± 0.132.76 ± 0.573.53 ± 0.43
46.535Hexyl hexanoate1373.1113900.41 ± 0.117.12 ± 2.13ND5.77 ± 1.270.56 ± 0.194.66 ± 1.45
46.679Ethyl caprate--NDNDND0.54 ± 0.13NDND
47.174Ethyl linoleate1772.96-14.29 ± 0.6714.15 ± 4.3612.09 ± 0.99NDNDND
47.417Ethyl tridecanoate1930.57-7.60 ± 0.89NDNDNDNDND
48.672Ethyl palmitate1367.58192445.12 ± 1.589.23 ± 6.2733.39 ± 1.0736.32 ± 5.2141.30 ± 2.9636.22 ± 3.62
49.614Hexyl Caprylate--ND2.78 ± 0.91ND0.92 ± 0.82NDND
49.892Diethyl phthalate1647.27-10.42 ± 3.062.11 ± 0.781.07 ± 0.2114.30 ± 0.7124.23 ± 8.840.80 ± 0.26
Alcohols (8)
11.519Isoamyl alcohol693.31734NDNDND4.09 ± 1.371.32 ± 0.130.88 ± 0.31
11.7822-Methyl-1-butanol695.63-NDNDND0.73 ± 0.240.49 ± 0.072.77 ± 0.25
13.5521-Pentanol765.98820NDNDND16.83 ± 5.690.97 ± 0.1013.19 ± 2.75
14.7032,3-Butanediol746.31-6.91 ± 1.95NDNDND32.20 ± 6.141.03 ± 0.36
29.5501-nonen-3-ol1054.76-NDNDNDND8.01 ± 3.360.64 ± 0.12
38.819Maltitol1060.48-NDNDNDND5.85 ± 0.44ND
39.113Phenethyl alcohol1130.981121NDNDND5.86 ± 2.090.95 ± 0.20ND
46.6761-Tetradecanol1550.62-ND10.5 ± 0.337.56 ± 2.344.94 ± 0.655.81 ± 0.496.50 ± 4.42
Aldehydes (14)
7.102Isovaleraldehyde643.516562.32 ± 0.114.13 ± 0.235.28 ± 0.2315.48 ± 0.6725.29 ± 1.771.22 ± 0.15
7.5662-Methylbutyraldehyde645.276651.24 ± 0.052.31 ± 0.123.22 ± 1.1712.46 ± 0.3623.33 ± 1.5816.29 ± 1.83
15.894Hexanal804.15800NDND0.88 ± 0.100.70 ± 0.231.17 ± 0.403.26 ± 1.58
18.216Furfural--NDND4.30 ± 0.82NDNDND
23.8413-methylthiopropionaldehyd-e857.39-NDND2.05 ± 0.572.24 ± 0.802.67 ± 0.221.76 ± 0.59
28.292Benzaldehyde975.419617.84 ± 0.222.16 ± 1.0438.45 ± 4.60106.11 ± 40.0015.04 ± 5.0024.29 ± 3.67
34.439Phenylacetaldehyde1032.39104510.79 ± 3.7013.27 ± 0.3812.18 ± 1.1626.54 ± 9.6018.02 ± 4.9923.03 ± 1.08
36.693Phenylglyoxal monohydrate1217.09-NDNDNDND4.87 ± 1.066.35 ± 1.88
38.419Nonaldehyde1101.971107NDND2.85 ± 0.314.64 ± 1.532.12 ± 0.239.87 ± 2.26
42.528Decyl aldehyde1179.841206NDND1.90 ± 0.249.30 ± 6.350.89 ± 0.193.19 ± 0.79
43.1362,4-Dimethylbenzaldehyde1208.59-NDND1.18 ± 0.2060.17 ± 15.071.09 ± 0.18ND
47.087Vanillin1392.6314181.34 ± 0.641.62 ± 0.540.81 ± 0.1019.15 ± 0.96NDND
48.0355-methyl-2-phenyl-2-hexena-l1505.88-NDNDND4.84 ± 1.5712.00 ± 1.2712.72 ± 4.26
50.017FEMA 27631601.291611NDNDNDND0.74 ± 0.260.69 ± 0.23
Ketones (4)
3.7752-Butanone--ND0.50 ± 1.34NDNDNDND
23.154(E)-hex-3-en-2-one760.36-2.09 ± 0.22ND1.29 ± 0.421.00 ± 0.35NDND
33.9961-(1-Ethyl-2,3-dimethyl-cyclopent-2-enyl)-ethanone--NDND36.85 ± 12.8551.16 ± 9.2450.10 ± 16.5729.37 ± 3.87
45.3404′-Hydroxy-3′-methylacetophenone1363.58-128.97 ± 2.7744.44 ± 8.6543.07 ± 5.9726.40 ± 12.0915.64 ± 5.776.88 ± 1.95
Phenols (5)
43.2952-Naphthol1454.96-NDNDNDND0.90 ± 0.322.66 ± 0.83
44.4794-Hydroxy-3-methoxystyren-e1302.59-ND413.18 ± 1.54NDNDND36.27 ± 1.80
46.0212,6-Dimethoxyphenol1276.32-ND1.57 ± 0.13NDNDND15.94 ± 3.88
46.175Eugenol1380.171374ND0.39 ± 0.10NDNDNDND
48.6652,4-Di-tert-butylphenol1555.651513ND1.28 ± 0.20NDNDNDND
Miscellaneous (20)
4.0422-Methylfuran604.13604NDNDNDND1.84 ± 0.62ND
25.3893,4-Lutidine901.478821.39 ± 0.481.93 ± 0.151.55 ± 0.510.76 ± 0.086.68 ± 0.123.77 ± 1.47
28.651Mesitylene1020.211013195.72 ± 54.493.78 ± 0.98146.68 ± 23.1483.90 ± 7.92231.64 ± 30.575.72 ± 0.77
29.892cis-Anethol--6.53 ± 0.859.71 ± 1.188.28 ± 0.969.69 ± 1.034.87 ± 0.343.71 ± 0.29
30.1611,2-Dimethyl-5-vinylpyrrole945.18-422.06 ± 6.32382.18 ± 14.58465.86 ± 17.94472.03 ± 52.02367.79 ± 15.75385.85 ± 15.45
30.5352-propylpyridine984.11-25.12 ± 2.41NDNDND19.33 ± 0.31ND
30.6711,2,4-Trimethylenecyclohex-ane921.39-NDND575.54 ± 202.11304.60 ± 64.54908.03 ± 72.36607.52 ± 55.99
31.0024-Isopropylaniline--NDND9.72 ± 3.23NDNDND
32.2651-Isopentyl-1-cyclohexene--6.24 ± 2.58ND33.27 ± 5.30NDNDND
32.4592-Isopropyltoluene1040.66102112.85 ± 4.52ND7.66 ± 2.51164.24 ± 30.3112.17 ± 3.4459.24 ± 17.58
33.9871-decylcyclohexene1680.32-39.30 ± 12.457.86 ± 0.0672.66 ± 24.5742.54 ± 12.45ND5.34 ± 3.01
35.4962-Acetyl pyrrole1032.69-NDNDNDND4.72 ± 0.5299.31 ± 32.57
39.4751,2,3,4-Tetramethylbenzene1129.47-1.57 ± 0.10NDND8.02 ± 2.651.22 ± 0.312.73 ± 0.61
42.000Cyclododecane1422.4-ND0.54 ± 0.12NDND0.97 ± 0.220.47 ± 0.16
42.361Naphthalene1178.731191ND0.72 ± 0.22NDNDNDND
42.8462,3-Dihydrobenzofuran1043.32-45.55 ± 0.9896.94 ± 9.1821.19 ± 0.5118.09 ± 4.247.40 ± 2.384.80 ± 1.90
45.081Indole1294.5112941.40 ± 0.192.06 ± 0.12NDNDNDND
46.800Tetradecane--6.62 ± 1.270.69 ± 0.09ND16.59 ± 4.93NDND
47.667Hexadecane--3.33 ± 1.06NDNDNDNDND
48.419Pentadecane1515.2215005.42 ± 0.235.25 ± 0.112.93 ± 1.397.14 ± 4.885.86 ± 1.206.46 ± 0.22
Values represent means ± SD. RI is the retention index obtained in this study, RI* is the literature value; ND means the compound is not detected.
Table 2. Odor activity values (OAVs) of Caishiji soybean paste in different fermentation stages.
TR (s)CompoundsThreshold (μg/kg)Content (μg/kg)
CG-0CG-1CG-2CG-3CG-6CG-8
10.340Isobutyric acid1.00-2.78 ± 1.68----
15.778Ethyl butyrate1.00---4.92 ± 1.61--
30.496Ethyl hexanoate0.50-13.93 ± 3.12-14.90 ± 9.18--
49.614Hexyl Caprylate0.10-27.77 ± 9.07-9.24 ± 0.82--
39.113Phenethyl alcohol0.10- -58.63 ± 20.889.49 ± 2.01-
7.102Isovaleraldehyde2.001.30 ± 0.052.07 ± 0.122.64 ± 0.127.74 ± 0.3412.65 ± 0.890.62 ± 0.07
7.5662-Methylbutyraldehyde1.001.24 ± 0.052.31 ± 0.123.22 ± 1.1712.46 ± 0.3723.33 ± 1.5816.29 ± 1.83
23.8413-methylthiopropionaldehyde0.04--51.25 ± 14.2556.00 ± 19.8166.75 ± 5.5043.67 ± 14.25
28.292Benzaldehyde50.000.16 ± 0.010.04 ± 0.020.77 ± 0.092.12 ± 0.800.40 ± 0.100.49 ± 0.08
38.419Nonaldehyde3.50--0.81 ± 0.091.02 ± 0.180.61 ± 0.072.82 ± 0.65
42.528Decyl aldehyde5.00--0.38 ± 0.052.53 ± 0.640.18 ± 0.040.64 ± 0.16
47.087Vanillin10.000.13 ± 0.070.16 ± 0.060.08 ± 0.012.25 ± 0.61--
Publisher’s Note: MDPI stays neutral with regard to jurisdictional claims in published maps and institutional affiliations.

