Communication

The Dynamics of Single-Cell Nanomotion Behaviour of Saccharomyces cerevisiae in a Microfluidic Chip for Rapid Antifungal Susceptibility Testing

by
Vjera Radonicic
1,2,*,
Charlotte Yvanoff
1,2,
Maria Ines Villalba
2,3,
Sandor Kasas
2,3,4,† and
Ronnie G. Willaert
1,2,†
1
Research Group Structural Biology Brussels, Alliance Research Group VUB-UGent NanoMicrobiology (NAMI) Vrije Universiteit Brussel, 1050 Brussels, Belgium
2
International Joint Research Group VUB-EPFL NanoBiotechnology & NanoMedicine (NANO), Vrije Universiteit Brussel, 1050 Brussels, Belgium
3
Laboratory of Biological Electron Microscopy, Ecole Polytechnique Fédérale de Lausanne (EPFL), 1015 Lausanne, Switzerland
4
Centre Universitaire Romand de Médecine Légale, UFAM, Université de Lausanne, 1015 Lausanne, Switzerland
*
Author to whom correspondence should be addressed.
These authors contributed equally to this work.
Fermentation 2022, 8(5), 195; https://doi.org/10.3390/fermentation8050195
Submission received: 2 March 2022 / Revised: 8 April 2022 / Accepted: 20 April 2022 / Published: 26 April 2022
(This article belongs to the Special Issue Yeast Biotechnology 5.0)

Abstract

:
The fast emergence of multi-resistant pathogenic yeasts is caused by the extensive—and sometimes unnecessary—use of broad-spectrum antimicrobial drugs. To rationalise the use of broad-spectrum antifungals, it is essential to have a rapid and sensitive system to identify the most appropriate drug. Here, we developed a microfluidic chip to apply the recently developed optical nanomotion detection (ONMD) method as a rapid antifungal susceptibility test. The microfluidic chip contains no-flow yeast imaging chambers in which the growth medium can be replaced by an antifungal solution without disturbing the nanomotion of the cells in the imaging chamber. This allows for recording the cellular nanomotion of the same cells at regular time intervals of a few minutes before and throughout the treatment with an antifungal. Hence, the real-time response of individual cells to a killing compound can be quantified. In this way, this killing rate provides a new measure to rapidly assess the susceptibility of a specific antifungal. It also permits the determination of the ratio of antifungal resistant versus sensitive cells in a population.

1. Introduction

Fungal infections are an important growing health problem due to a high mortality rate, which is currently more than 1.6 million people worldwide per year [1,2,3]. It is becoming increasingly difficult to cure these infections as the microorganisms become more and more resistant to the existing antimicrobial drugs [4]. These resistant microorganisms induce an increase in hospital stays and medical costs. Options to control their proliferation consist of the development of novel molecules or a more targeted use of antimicrobial drugs. However, the choice of available antifungal drugs to treat invasive fungal infections is limited, since only three structural classes of compounds (i.e., polyenes, azoles, and echinocandins) are available [5]. Furthermore, these current antifungal drug compounds can show significant limitations such as toxicity (e.g., amphotericin B displays considerable toxicity and undesirable side effects [6,7]), issues with pharmacokinetic properties and the activity spectrum, a small number of targets [8,9], and a risk of interacting with other drugs, such as chemotherapy agents and immunosuppressants [10,11]. Due to this urgent problem, there is an increasing interest in developing new means to fight fungal infections, one of which is the development of new antifungal compounds. Today, multiple compounds are in the clinical development stage [12,13,14,15,16,17,18].
An alternative way to reduce the spread of pathogenic fungi is the development of rapid antifungal sensitivity tests. Such tests should permit the quick identification of the most appropriate drug to fight a specific fungus (ideally in a timeframe of 1–3 h), and they should drastically reduce the use of large-spectrum antifungals that are documented to induce resistance. Standard antifungal susceptibility testing (AFST) methods rely on measuring fungal growth in the presence of antifungals over a few days [19]. Among them, commercially available tests, such as Sensititre YeastOne, Etest, and the fully automated Vitek 2 yeast susceptibility system, which are all easy-to-use modifications from CLSI/EUCAST reference methods, are widely used for testing the antifungal susceptibility of relevant Candida and Aspergillus species [8]. New diagnostic approaches, based on technologies such as flow cytometry, MALDI-TOF mass spectroscopy, and isothermal microcalorimetry, have been developed to expand, and potentially improve, the capability of the clinical microbiology laboratory to yield AFST results [19]. However, most of these techniques are expensive, time-consuming (up to 7 days), or deliver limited information on microbial phenotypes. Since microfluidics provides several advantages over existing macro-scale methods, several microfluidic platforms have been developed recently to perform rapid antimicrobial susceptibility tests [20]. These platforms are mainly based on the microscopic transmission or fluorescence observation of cells to quantify the effect of the antimicrobial on cell growth or viability. Unfortunately, most of the newly developed devices are focused on antibiotic susceptibility testing (AST), and much less on AFST.
A couple of years ago, atomic force microscope (AFM)-based sensitivity tests were developed to assess the sensitivity of microorganisms to a given drug in a timeframe of minutes [21,22]. The test consisted in attaching the organism of interest onto an AFM cantilever and monitoring its oscillations (referred to as cellular nanomotion since the displacements are of the nanometre order) as a function of time and the presence of antimicrobial drugs. Numerous studies demonstrated that living organisms attached to AFM cantilevers induce oscillations of the lever that immediately stop when the organism dies [23,24]. Hence, this newly developed technology, called cellular nanomotion detection (NMD), detects living organisms in a chemistry-independent manner and offers a clear advantage in terms of test velocity [25,26], but possesses several drawbacks too. AFMs, unfortunately, are expensive and relatively complex devices that require some expertise to operate. In a typical AFM, the cantilever oscillations are detected by monitoring the deflections of a laser beam that is reflected off the very end of the lever. This requires a precise adjustment of the laser as well as of the detector (four-segment photodiode) before each measurement. Finally, such nanomotion detectors are relatively complex to scale up and can only monitor a single bacterial/fungal species at a time.
Other methods have also been used to detect the nanomotion of living microorganisms that are attached to a surface. These include plasmonic imaging of the z motion of attached bacteria [27], sensing of the attached bacterial vibrations with the phase noise of a resonant crystal [28], tracking the x-y motion of attached uropathogenic Escherichia coli [29], and subcellular fluctuation imaging, which is based on total internal reflection microscopy (TIRM) [30], as well as optically tracking bacterial responses on micropillar architectures using intrinsic phase-shift spectroscopy [31]. Recently, we found that a simple optical microscope equipped with a video camera can also detect living cells’ nanometric scale oscillations at a subpixel resolution using dedicated software [32]. We designated this method as “optical nanomotion detection” (ONMD). The technique does not require attaching the cells to a surface or a cantilever, nor must the cells be labelled, which are major advantages. The measurement is fast, simple, and inexpensive.
Here, we developed a microfluidic chip for the rapid determination of drug susceptibilities in fungal isolates and tested its functionality. The microfluidic chip contains no-flow imaging chambers, enabling us to determine the optical nanomotion of single yeast cells before, during, and after the treatment with a chemical compound. A non-pathogenic yeast, i.e., Saccharomyces cerevisiae, was used as a model yeast to evaluate its ONMD in the imaging chambers. The cells are pumped into the chambers, and next, exposed to a medium containing the antimicrobial drug or compound. In this study, the cells were killed with ethanol and the antifungal amphotericin B. The effect of these chemical compounds on individual yeast cells was successfully assessed by monitoring their nanomotion pattern as a function of time.

2. Materials and Methods

2.1. Yeast Cultivation

In these experiments, we used the S. cerevisiae BY4742 strain. Yeast cells were cultured by inoculating 10 mL of YPD medium (10 g/L yeast extract, 20 g/L peptone, 20 g/L dextrose) with a colony from a YPD agar (YPD containing 20 g/L agar) plate. The cultures were grown overnight in 100 mL Erlenmeyer flasks at 30 °C and 200 revolutions per minute (rpm) (Innova 4400, New Brunswick, Edison, NJ, USA). The overnight cultures were diluted in a YPD medium to obtain an optical density at 600 nm (OD600 nm) of 0.5 and were then grown in Erlenmeyer flasks for 1 h at 30 °C and 200 rpm. The cultures were further diluted afterward, depending on the cell concentration (OD600 nm value), to obtain an optimal number of cells and allowing for single-cell visualisation in each imaging chamber.

2.2. Microfluidic Chip Construction

The microfluidic chip was fabricated in polydimethylsiloxane (PDMS) by soft lithography. First, the design of the microfluidic chip was created in DesignSpark Mechanical (www.rs-online.com, accessed on 10 September 2021), and then printed onto a film photomask (0.18 mm polyester with photo emulsion layer) using a laser-photoplotter (Selba S.A., Versoix, Switzerland). The mould of the PDMS chip was then made on a silicon wafer (4-inch Test CZ-Si wafer, Microchemicals GmbH, Ulm, Germany), using multi-layer photolithography. The wafer was cleaned in acetone (Carl Roth, Karlsruhe, Germany) and 2-propanol (Carl Roth, Karlsruhe, Germany) for 5 min each, then rinsed with ultrapure water and, finally, air blow-dried. The wafer was then heated on a hot plate (Torrey Pines Scientific, Carlsbad, CA, USA) at 100 °C to ensure that all the residual solvents were evaporated. The wafer was then exposed to air plasma at 100 W, 50 kHz, for 1 min (Plasma System Cute, Femto Science, Dongtangiheung-Ro, Korea). Two different resists were used to make the imaging chambers and the channels of different heights. First, the imaging chambers were created using the negative photoresist GM1050 (Gersteltec Engineering Solutions, Pully, Switzerland). The resist was spin-coated onto the wafer at 940 rpm for 40 s and soft-baked on a hot plate at 120 °C for 2 min to reach an approximative thickness of 8 µm. The wafer and the chambers’ photomask were brought into hard contact in the mask aligner UV-KUB3 (Kloé, Saint-Mathieu-de-Tréviers, France) and illuminated at 365 nm ultraviolet (UV) light (intensity of 35 mW/cm2) for 3 s. Following UV exposure, the wafer was post-baked for 2 min at 65 °C in an oven, and then for 10 min at 95 °C on a hot plate. For the channels, the second layer of SU-8 3050 (Kayaku Advanced Materials, Westborough, MA, USA) was spin-coated onto the wafer at 3500 rpm for 30 s and soft-baked for 6 min at 95°C on a hot plate, to reach an approximative thickness of 60 µm. The wafer was then aligned and brought into hard contact with the channels’ photomask and illuminated with 365 nm UV light (intensity of 35 mW/cm2) for 9 s. Next, the wafer was post-baked for 5 min at 95 °C on a hot plate. Finally, the wafer was immersed in SU-8 developer (Kayaku Advanced Materials, Westborough, MA, USA) for 6 min and then washed with 2-propanol and blow-dried. The dimensions of the channels and imaging chambers were measured with a 3-D profilometer (Profilm 3 D, Filmetrics, San Diego, CA, USA).
The SU-8 mould was cleaned from (in-)organic residue by rinsing it with acetone, 2-propanol, and ultrapure water, and blow-dried with air. The mould was then silanised in a glass bell with TMS (chlorotrimethylsilane, Sigma Aldrich, Overijse, Belgium) for 15 min to reduce the adhesion of PDMS to the SU-8 mould. PDMS (Sylgard 184 Silicone Elastomer Kit, Dow Inc., Midland, MI, USA) was prepared by mixing the base and the curing agent at a 10:1 ratio. After casting the PDMS onto the mould, it was degassed in a glass bell with an applied vacuum for 30 min to 1 h. The PDMS was then cured for 1 h at 100 °C on a hot plate or overnight at 60 °C in an oven. After curing, the PDMS was peeled off the mould and the holes for inlets and outlets were punctured with a 1 mm rapid core sampling tool (Electron Microscopy Sciences, Hatfield, PA, USA). Finally, the microfluidic chip was assembled by bonding the PDMS to a glass coverslip (170 µm thickness, Carl Roth, Karlsruhe, Germany), after plasma-treating them both at 100 W, 50 kHz for 1 min.

2.3. Computational Simulation of Fluid Flow in the Microfluidic Chip

To evaluate the absence of fluid flow in the designed imaging chambers, fluid flow simulations were performed using COMSOL Multiphysics 4.4 (COMSOL, Stockholm, Sweden) by selecting “fluid flow” (single-phase flow, laminar flow) physics. Water at 20 °C was selected as the working liquid. Laminar fluid flow through the channels was simulated with laminar inflow as a boundary condition at the inlet. The inlet flow rate was set at 0.5 µL/min, which corresponds to the inlet flow rate that was used during the actual experiments. Pressure (atmospheric pressure) was selected as the boundary condition at the outlet and backflow was suppressed. The physics-controlled mesh was selected as the mesh setting with a normal element size.

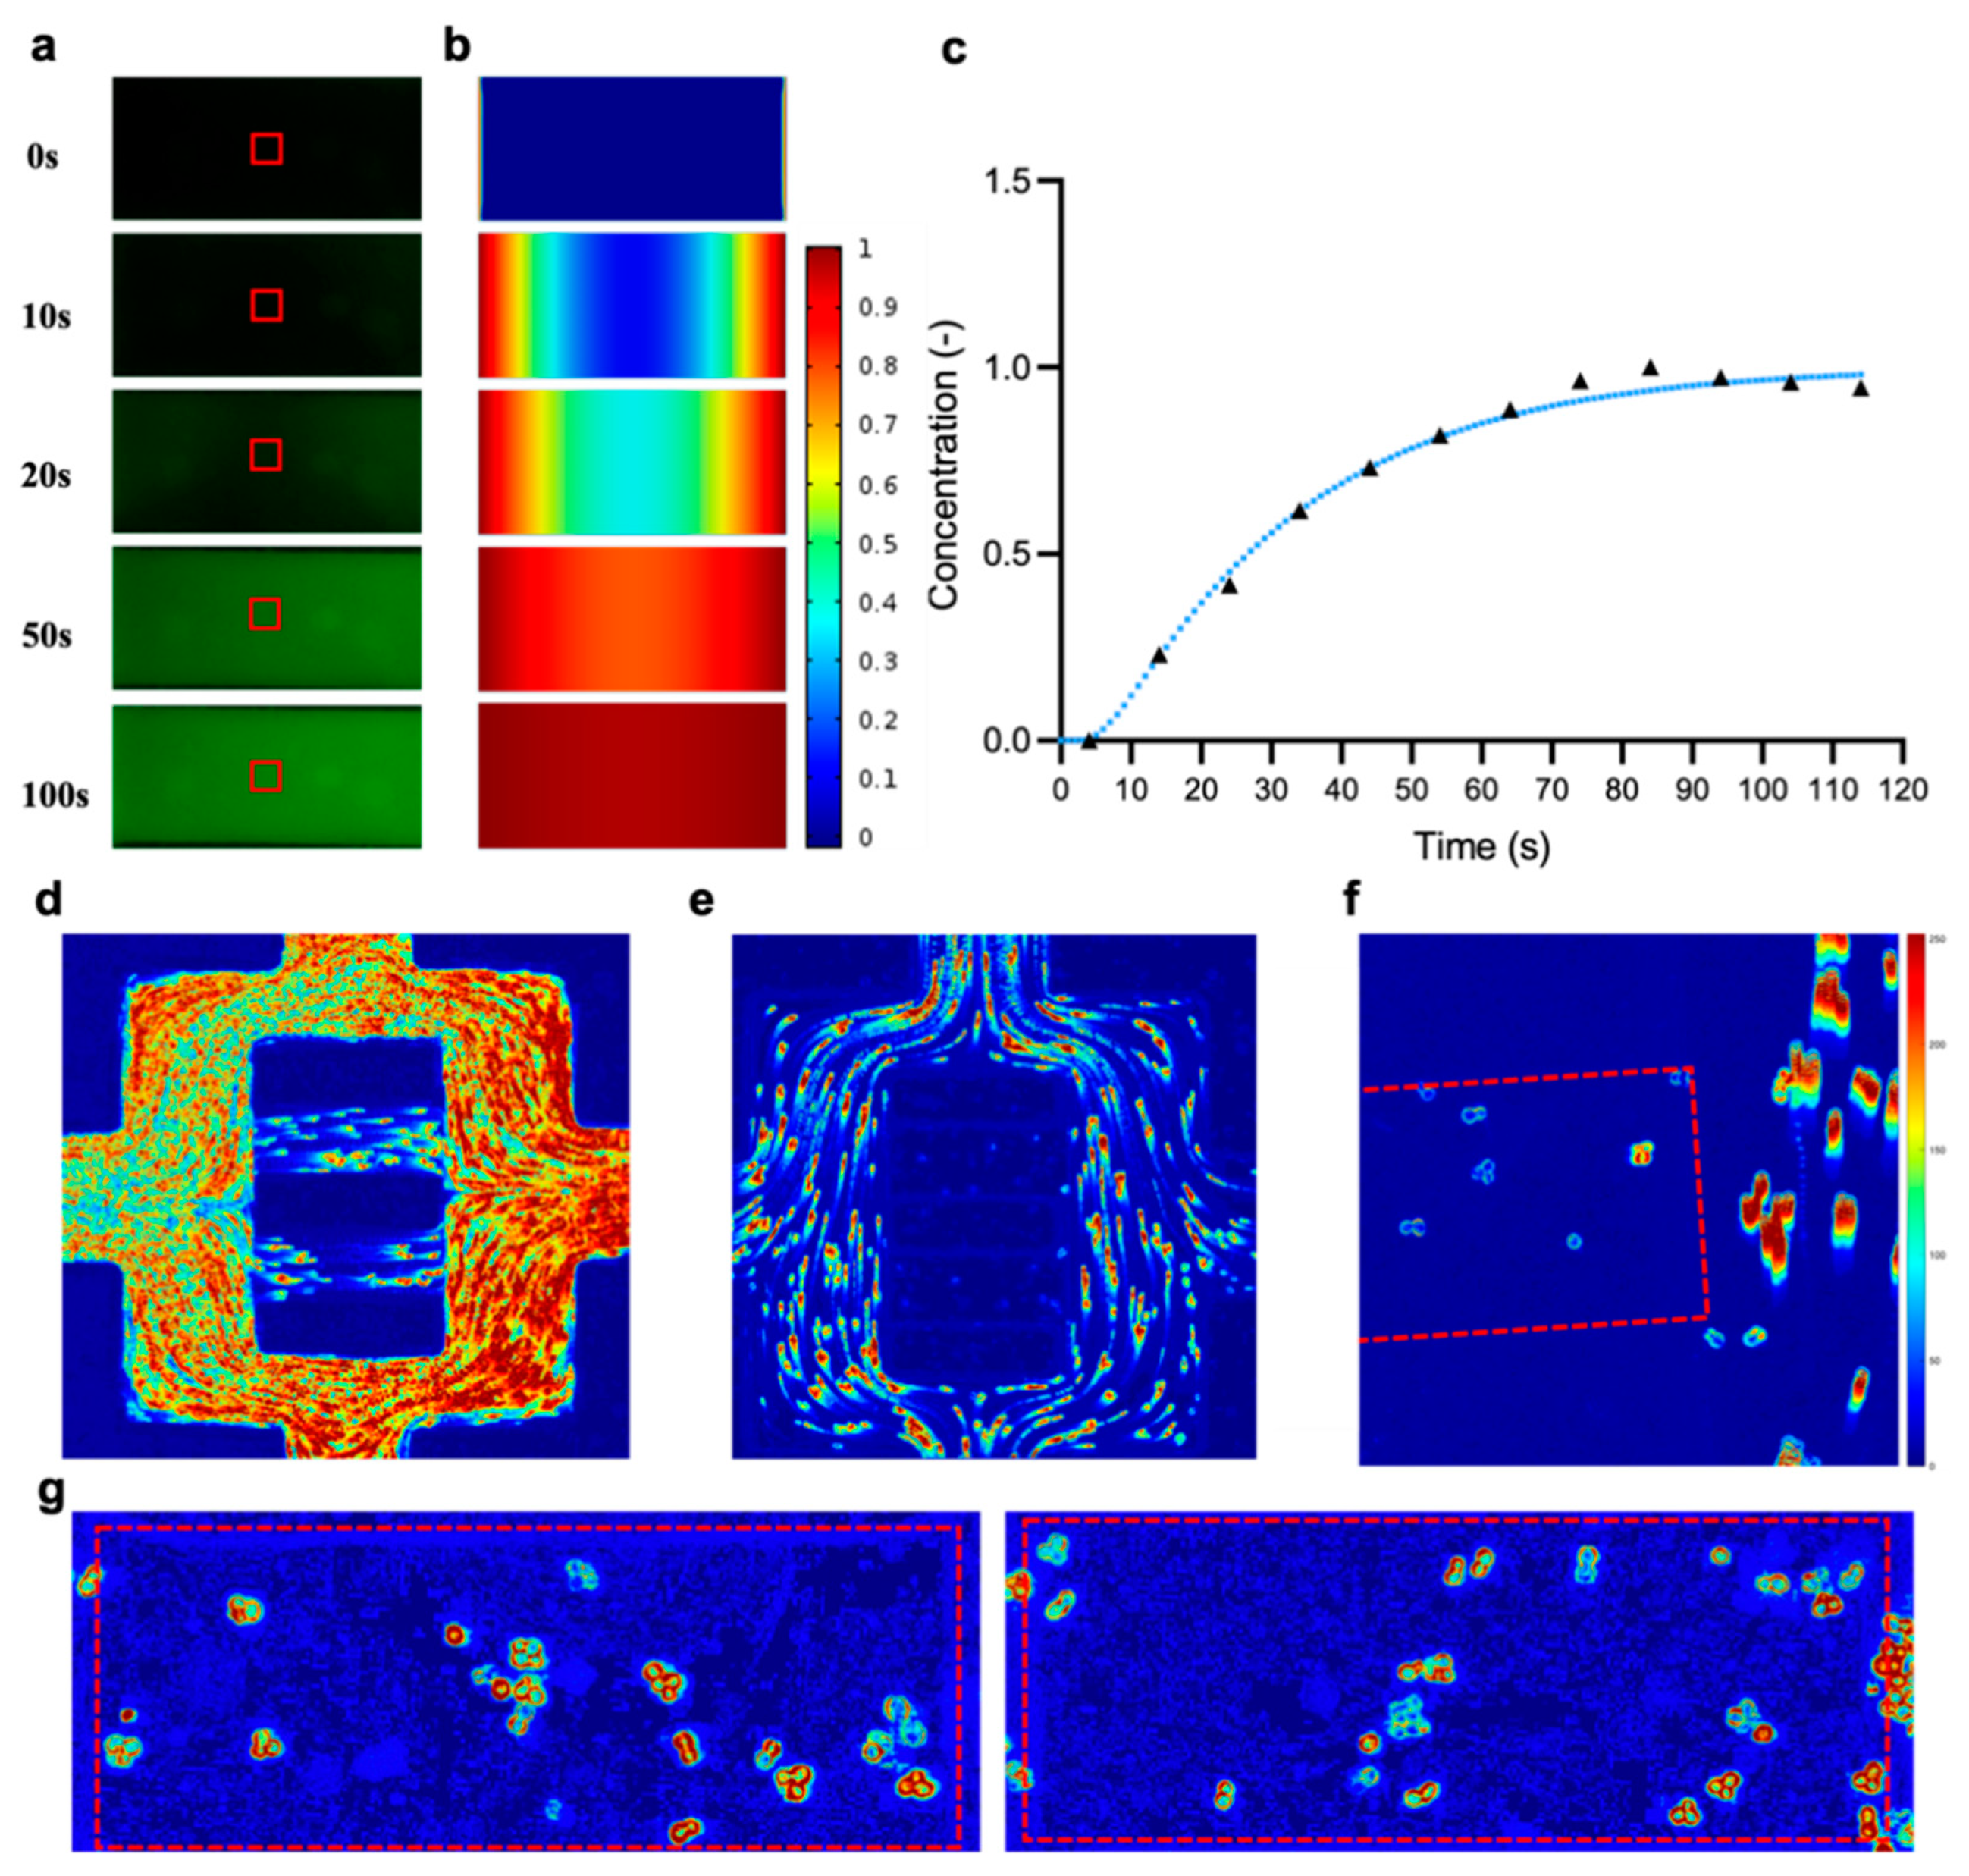
2.4. Determination of the Diffusion Coefficient in the Imaging Chamber

To determine that the mass transport in the imaging chamber occurs only by diffusion, and to estimate the time it takes to obtain a homogeneous concentration in the chamber, a diffusion experiment using 100 μM fluorescein (Agar Scientific Ltd., Stansted, Essex, UK) as a tracer compound was performed. The fluorescent dye was pumped in the flow cell from inlet A to outlet A using a syringe pump (KDS 260, Kd Scientific Inc, Holliston, MA, USA) at a flow rate of 0.5 μL/min. When the dye reached the chip, the flow was stopped, and every 10 s, images were recorded with a PCO Edge 4.2 sCMOS camera (Excelitas PCO GmbH, Kelheim, Germany). The mean grey values of a small area in the centre of the imaging chamber were calculated (ImageJ Fiji, [33]) and normalised to the maximal mean value.
A 3-D finite element model was set up to simulate the diffusion of fluorescein in the imaging chamber (COMSOL Multiphysics 4.4, Stockholm, Sweden) by selecting “transport of diluted species” (time-dependent study) physics. Water at 20 °C was selected as the working liquid. At the entrances of the chamber, the concentration boundary was set at a normalised concentration of 1. The physics-controlled mesh was selected as the mesh setting with an extremely fine element size. The increase of the concentration in the centre of the channel was calculated as a function of time, and the diffusion coefficient was estimated by fitting the calculated curve on the experimentally determined profile.

2.5. Microfluidic Chip Setup

The inlet and outlet of the imaging chambers (inlet/outlet B, Figure 1a) were connected to a pressure-driven pump (LineUp™ Push-Pull, Fluigent, Le Kremlin-Bicêtre, France), and the inlet and outlet of the channels (inlet/outlet A, Figure 1a) were connected to a syringe pump (KDS 260, Kd Scientific Inc, Holliston, MA, USA) via fluorinated ethylene propylene (FEP) tubing with an internal diameter of 0.51 mm. The microfluidic chip setup was then mounted onto an inverted Nikon Eclipse Ti2 epifluorescence microscope (Nikon, Tokyo, Japan) to perform ONMD with bright-field microscopy. The microfluidic chip and tubing were firstly flushed with 2-propanol and then ultrapure water to eliminate and remove air bubbles. Next, the yeast liquid culture in YPD was filled into the imaging chambers from inlet B (Figure 1a) at a flow rate of 5 μL/min using the pressure-driven pump. Both the inlet and outlet B tubings were clamped, and the first ONMD movie was acquired (see Section 2.6). The solution containing the killing compound 70% (v/v) ethanol or 500 μg/mL amphotericin B (Merck, Darmstadt, Germany) was then filled in from inlet A to outlet A using the syringe pump at a flow rate of 0.5 μL/min. As a control, a second chip was filled with YPD growth medium only, and all the inlets and outlets were closed. The time required for the compounds to be pumped in, to replace the liquid in the inlet channel and the flow cell channels around the imaging chambers, to diffuse into the imaging chamber, and to reach the maximum concentration in the centre was estimated at 10 min. This estimate is based on the time it takes to pump the compound through the tubing to the flow cell at a flow rate of 0.5 µL/min, which is 8 min (volume of the internal volume of the tubing was 4 µL); the time to replace the liquid in the inlet channel and flow cell chamber, which is 20 s (volume of 0.15 µL); and the time to reach a maximum concentration in the centre of the imaging chamber by diffusion, which is 75 s (Figure 2c).

2.6. Nanomotion Measurement and Analysis

Cellular oscillations were monitored by recording bright-field movies of 500 frames at a framerate of 35 fps with a PCO Edge 4.2 back-illuminated sCMOS camera (Excelitas PCO GmbH, Kelheim, Germany) using a 40× objective. The movies were analysed using a cross-correlation analysis method [34] described previously [32]. The ONMD algorithm (MATLAB, MathWorks) calculates the x-y displacement of individual cells for each frame, and saves the trajectories of the tracked cells, as well as the root mean square of the displacement, to an MS Excel file. The distribution of the displacements per frame was represented as violin and box-and-whisker (10th to 90th percentile) plots, whereas the total displacements for all cells were represented as box-and-whisker plots (Prism8, GraphPad). The software also allows for highlighting pixels that change from frame to frame (differential image) using a colour scale: the pixels that changed the most are indicated in red, whereas the ones that changed the least are shown in blue.

3. Results

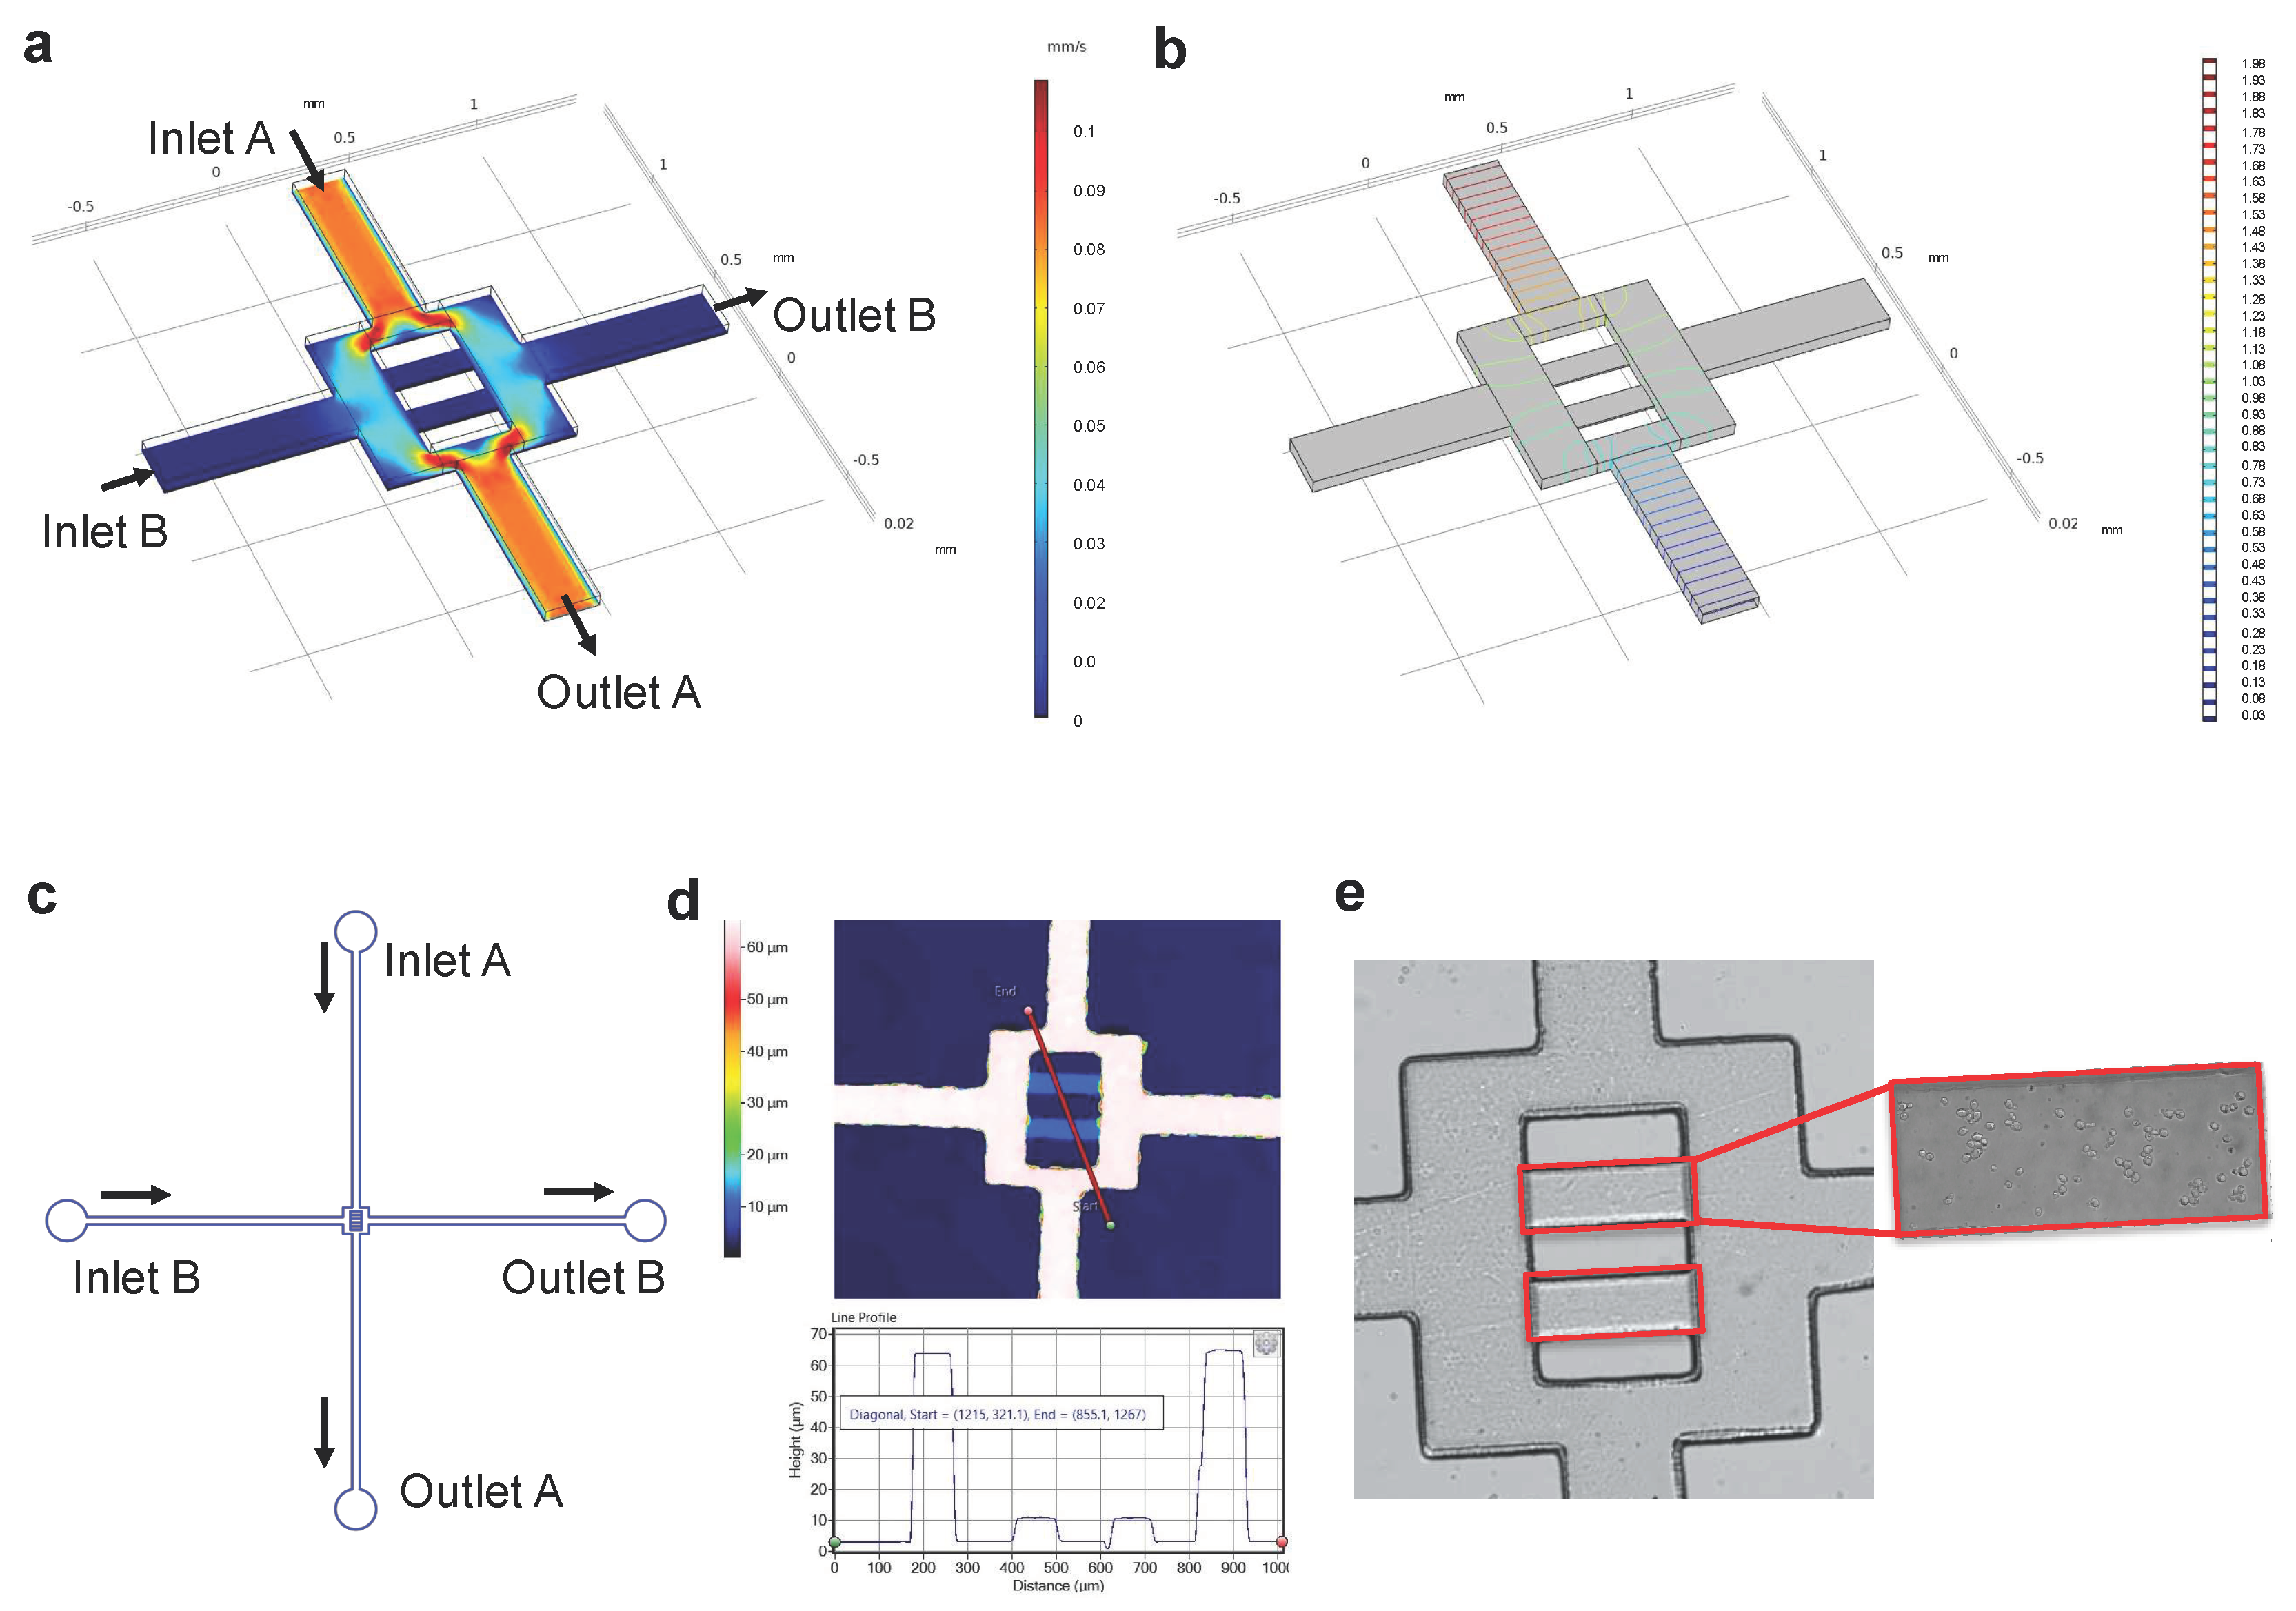
3.1. Design and Construction of the Microfluidic Chip

3.1.1. Modelling Fluid Flow and Mass Transport in the Microfluidic Chip

Fluid flow was simulated in the design using finite element modelling. The magnitude of the velocity at a slice positioned at the mid-plane of the imaging chamber (which is at a height of 4 µm) was calculated (Figure 1a). The pressure distribution over the channels and the imaging chambers was also calculated, showing no pressure difference over the chambers (Figure 1b). To experimentally demonstrate that the mass transport in the imaging chambers did occur solely by diffusion, a diffusion experiment was performed using the fluorescent compound fluorescein as a molecular tracer (Figure 2a,c). By comparing the experimentally determined evolution of the concentration in the centre of the imaging chamber to the simulated evolution (Figure 2b,c), a diffusion coefficient of 3.2 × 10⁻¹⁰ m2/s was estimated. This value corresponds to the range of values, i.e., 4.0 × 10⁻¹⁰ to 6.0 × 10⁻¹⁰ m2/s, that has been reported using other methods [35,36,37,38].
As an additional experimental proof to demonstrate that there is no convective flow in the imaging chambers, the differential image analysis in the ONMD software was used. The software allows for distinguishing cells that are pushed by the convective flow. Figure 2d shows the flow of the cells during the filling process of the imaging chambers and Figure 2e shows the movement of the cells during liquid flow from inlet A. We showed that there is no flow or convection movement of the cells inside the chamber (Figure 2e,f). The cells that are surrounded by a defined highlighted ring are moving in a diffusive environment, whereas cells that have a smear of red colour are affected by fluid flow (such as the cells that are in the channel). Furthermore, these images show that there is no correlation between the cell position and the movement of the cells since the fluid flow through the channels does not seem to affect the movements of cells that are relatively closely located at the channel side (as compared to the more centrally located cells) (Figure 2g and Figure S1).
All these results show that there is no fluid flow in the imaging chambers when a solution containing a killing compound is flown through the channels, and that it is possible to image the same selected cells before and after the treatment.

3.1.2. Microfluidic Chip Construction

The microfluidic chip design consisted of an inlet (B) and an outlet (B) that were used to fill the cells into the imaging chambers (Figure 1a,c and Figure 2d), and an inlet (A) and an outlet (A) that were used to pump in the killing agent (Figure 1a,c and Figure 2e). The fabricated in- and outlet channels had a width of 200 µm, a height of 60 µm, and a length of 7 mm. The vertical channels in the flow cell had a width of 200 µm and a height of 60 µm. The two no-flow imaging chambers had a width of 300 µm, a depth of 100 µm, and a height of 8 µm (Figure 1d,e). The mould for the microfluidic chip was made on a Si wafer in the epoxy-based photoresist SU-8 through a standard photolithography protocol. Using 3-D profilometer imaging, it was shown that the dimensions of the no-flow chamber matched the design specifications (Figure 1d). After casting the PDMS over the mould and curing the PDMS layer, the chip was assembled by pressing it onto a glass coverslip after plasma treatment of both surfaces. The plasma treatment guaranteed that the bonding was leak-free.

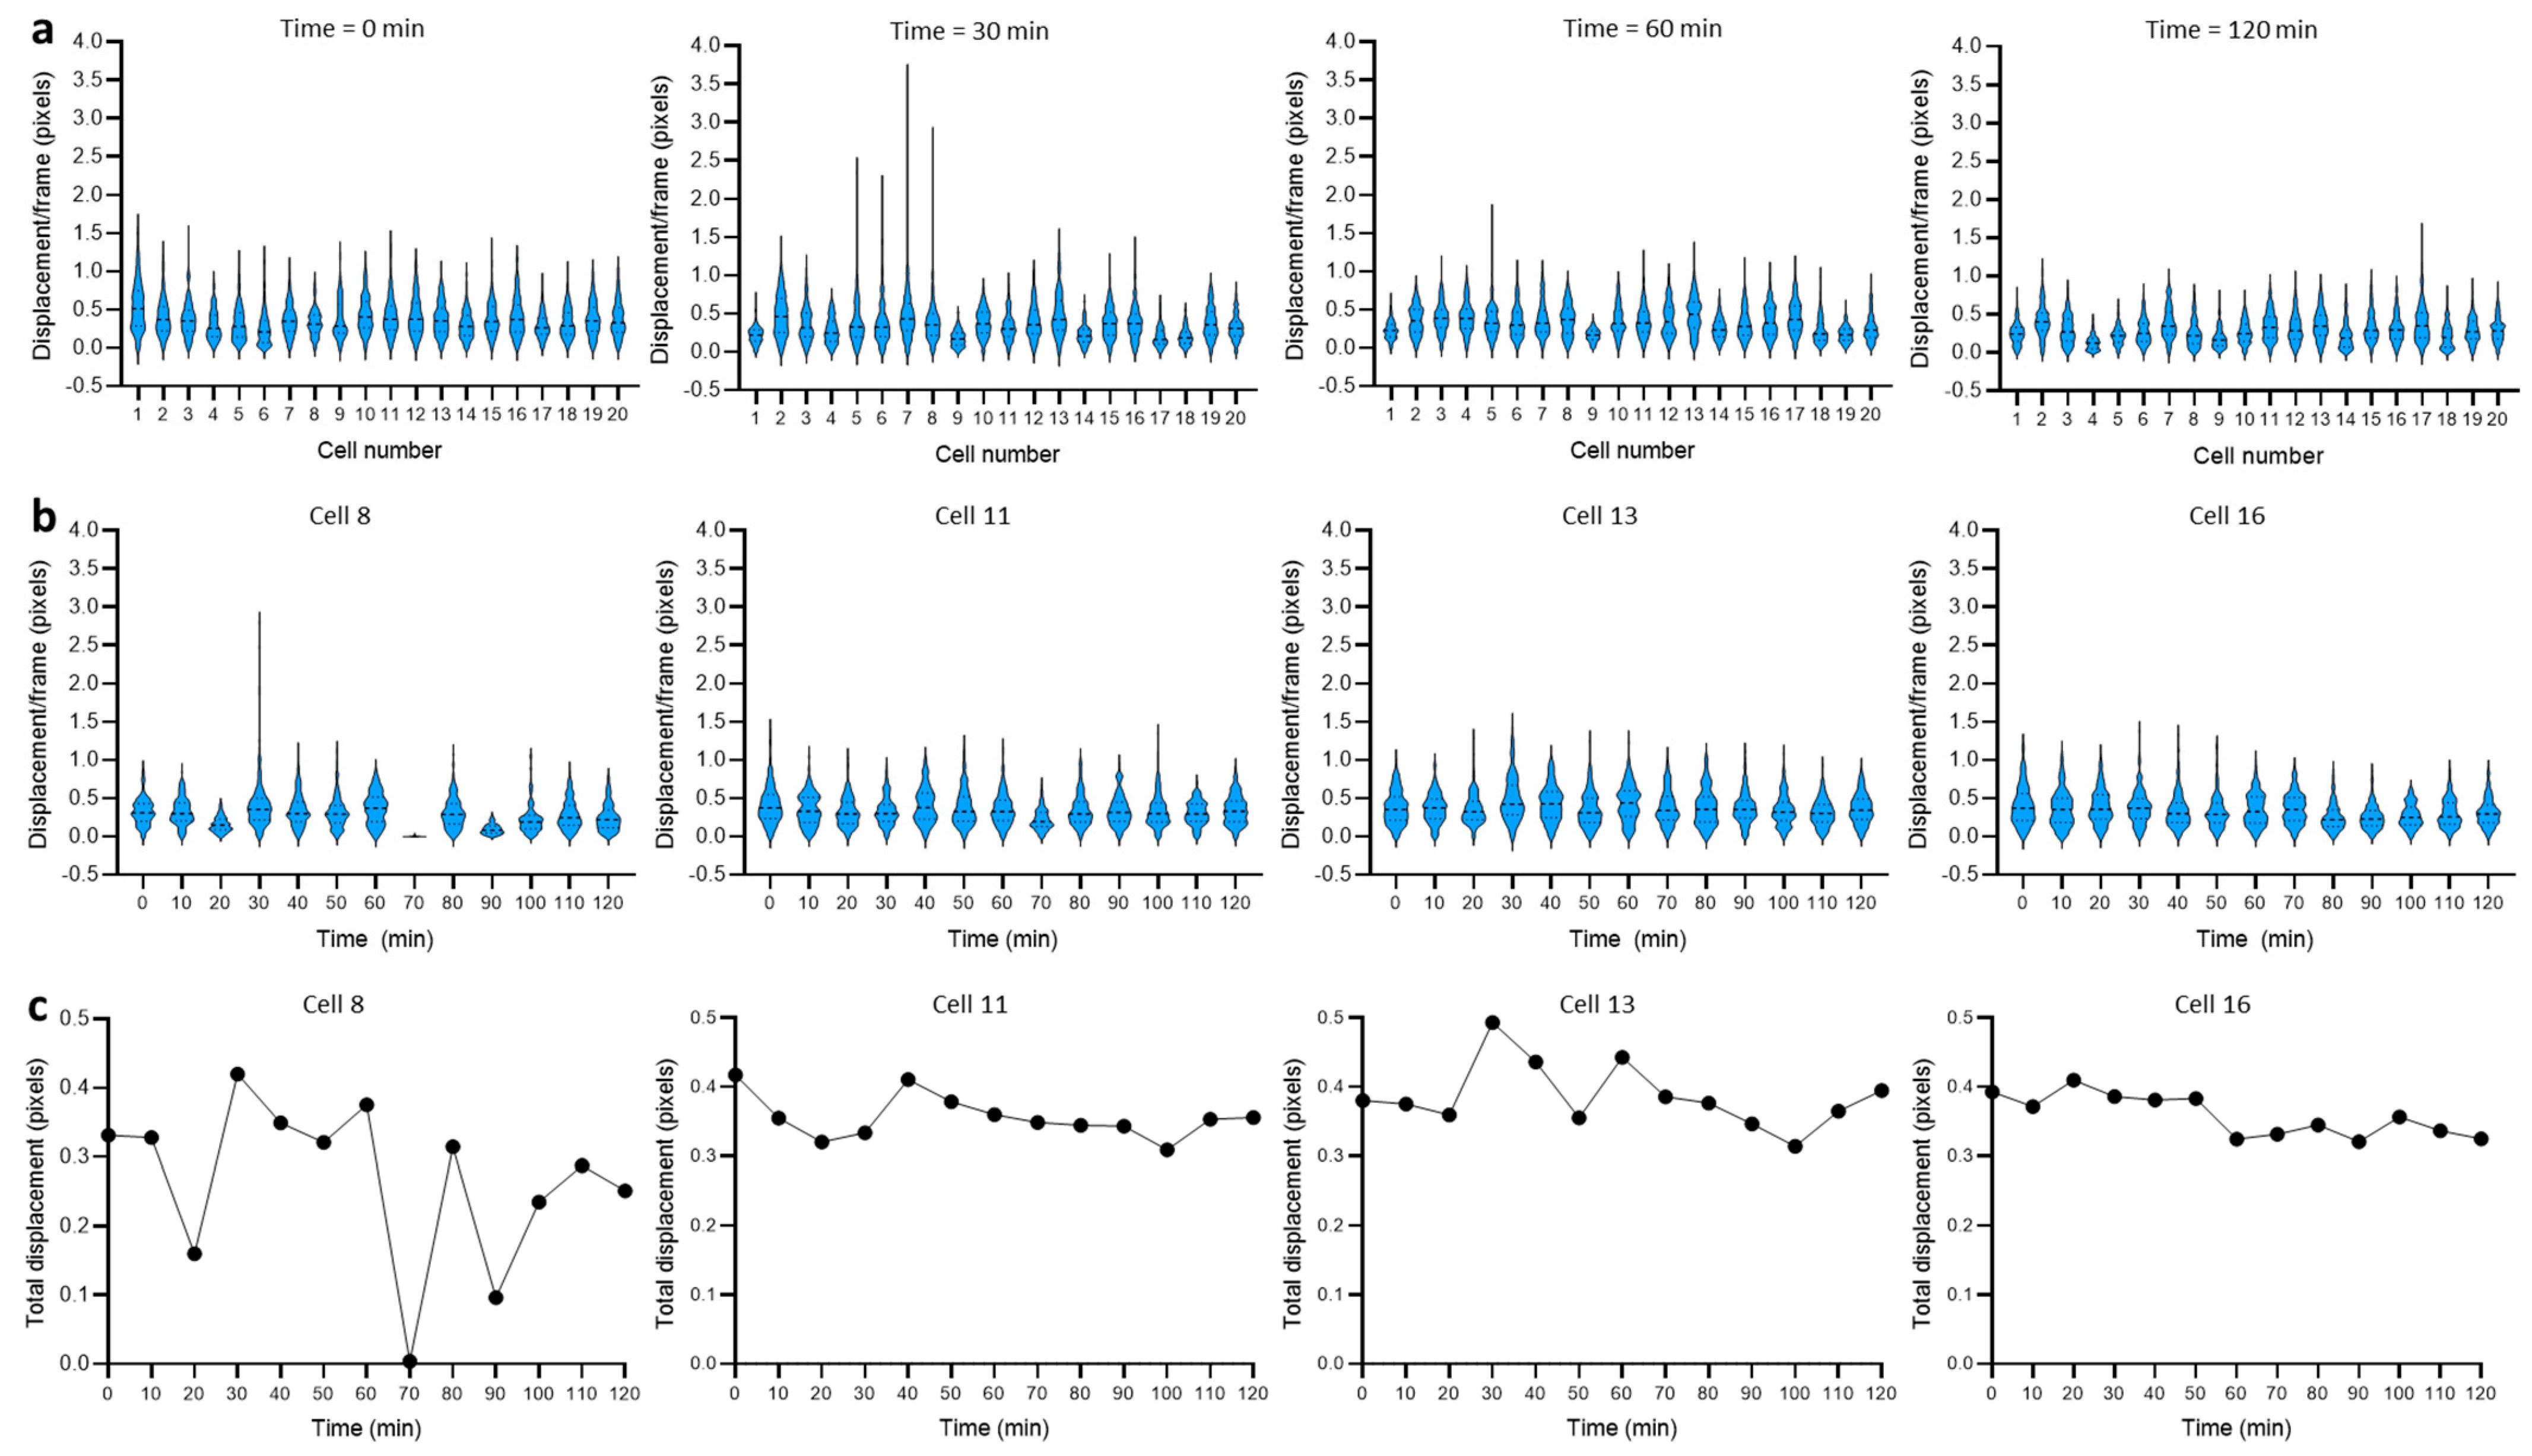
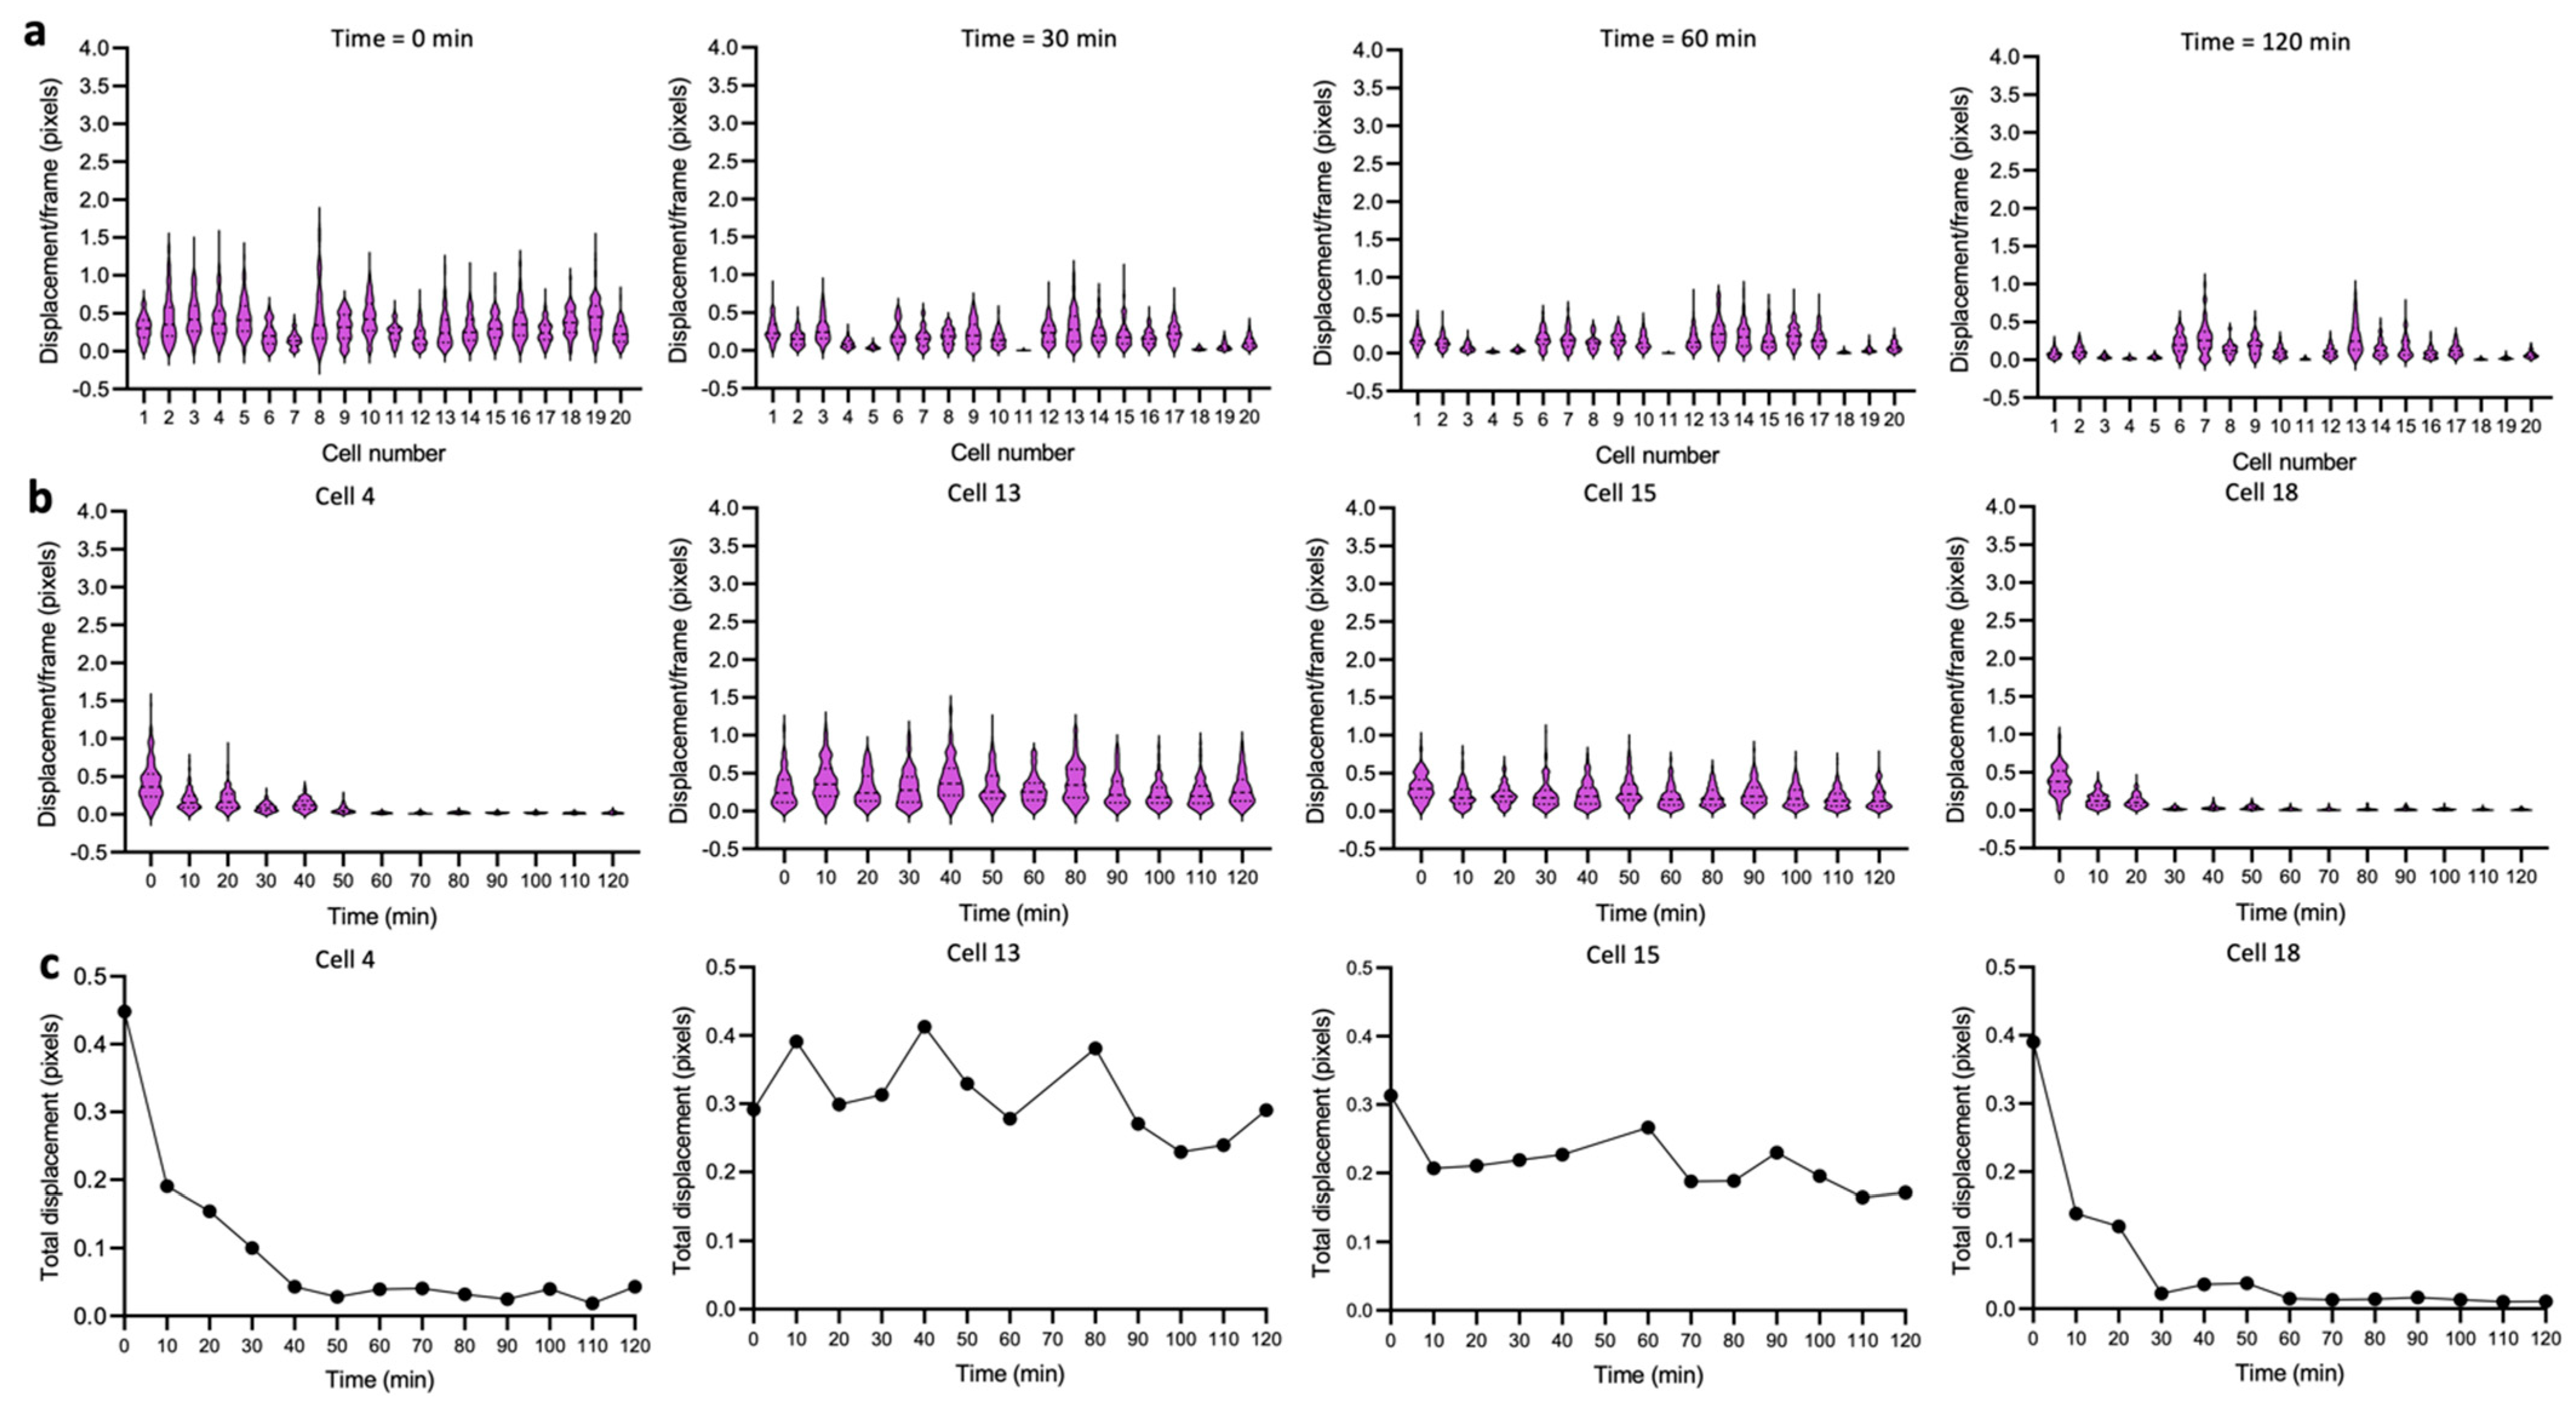
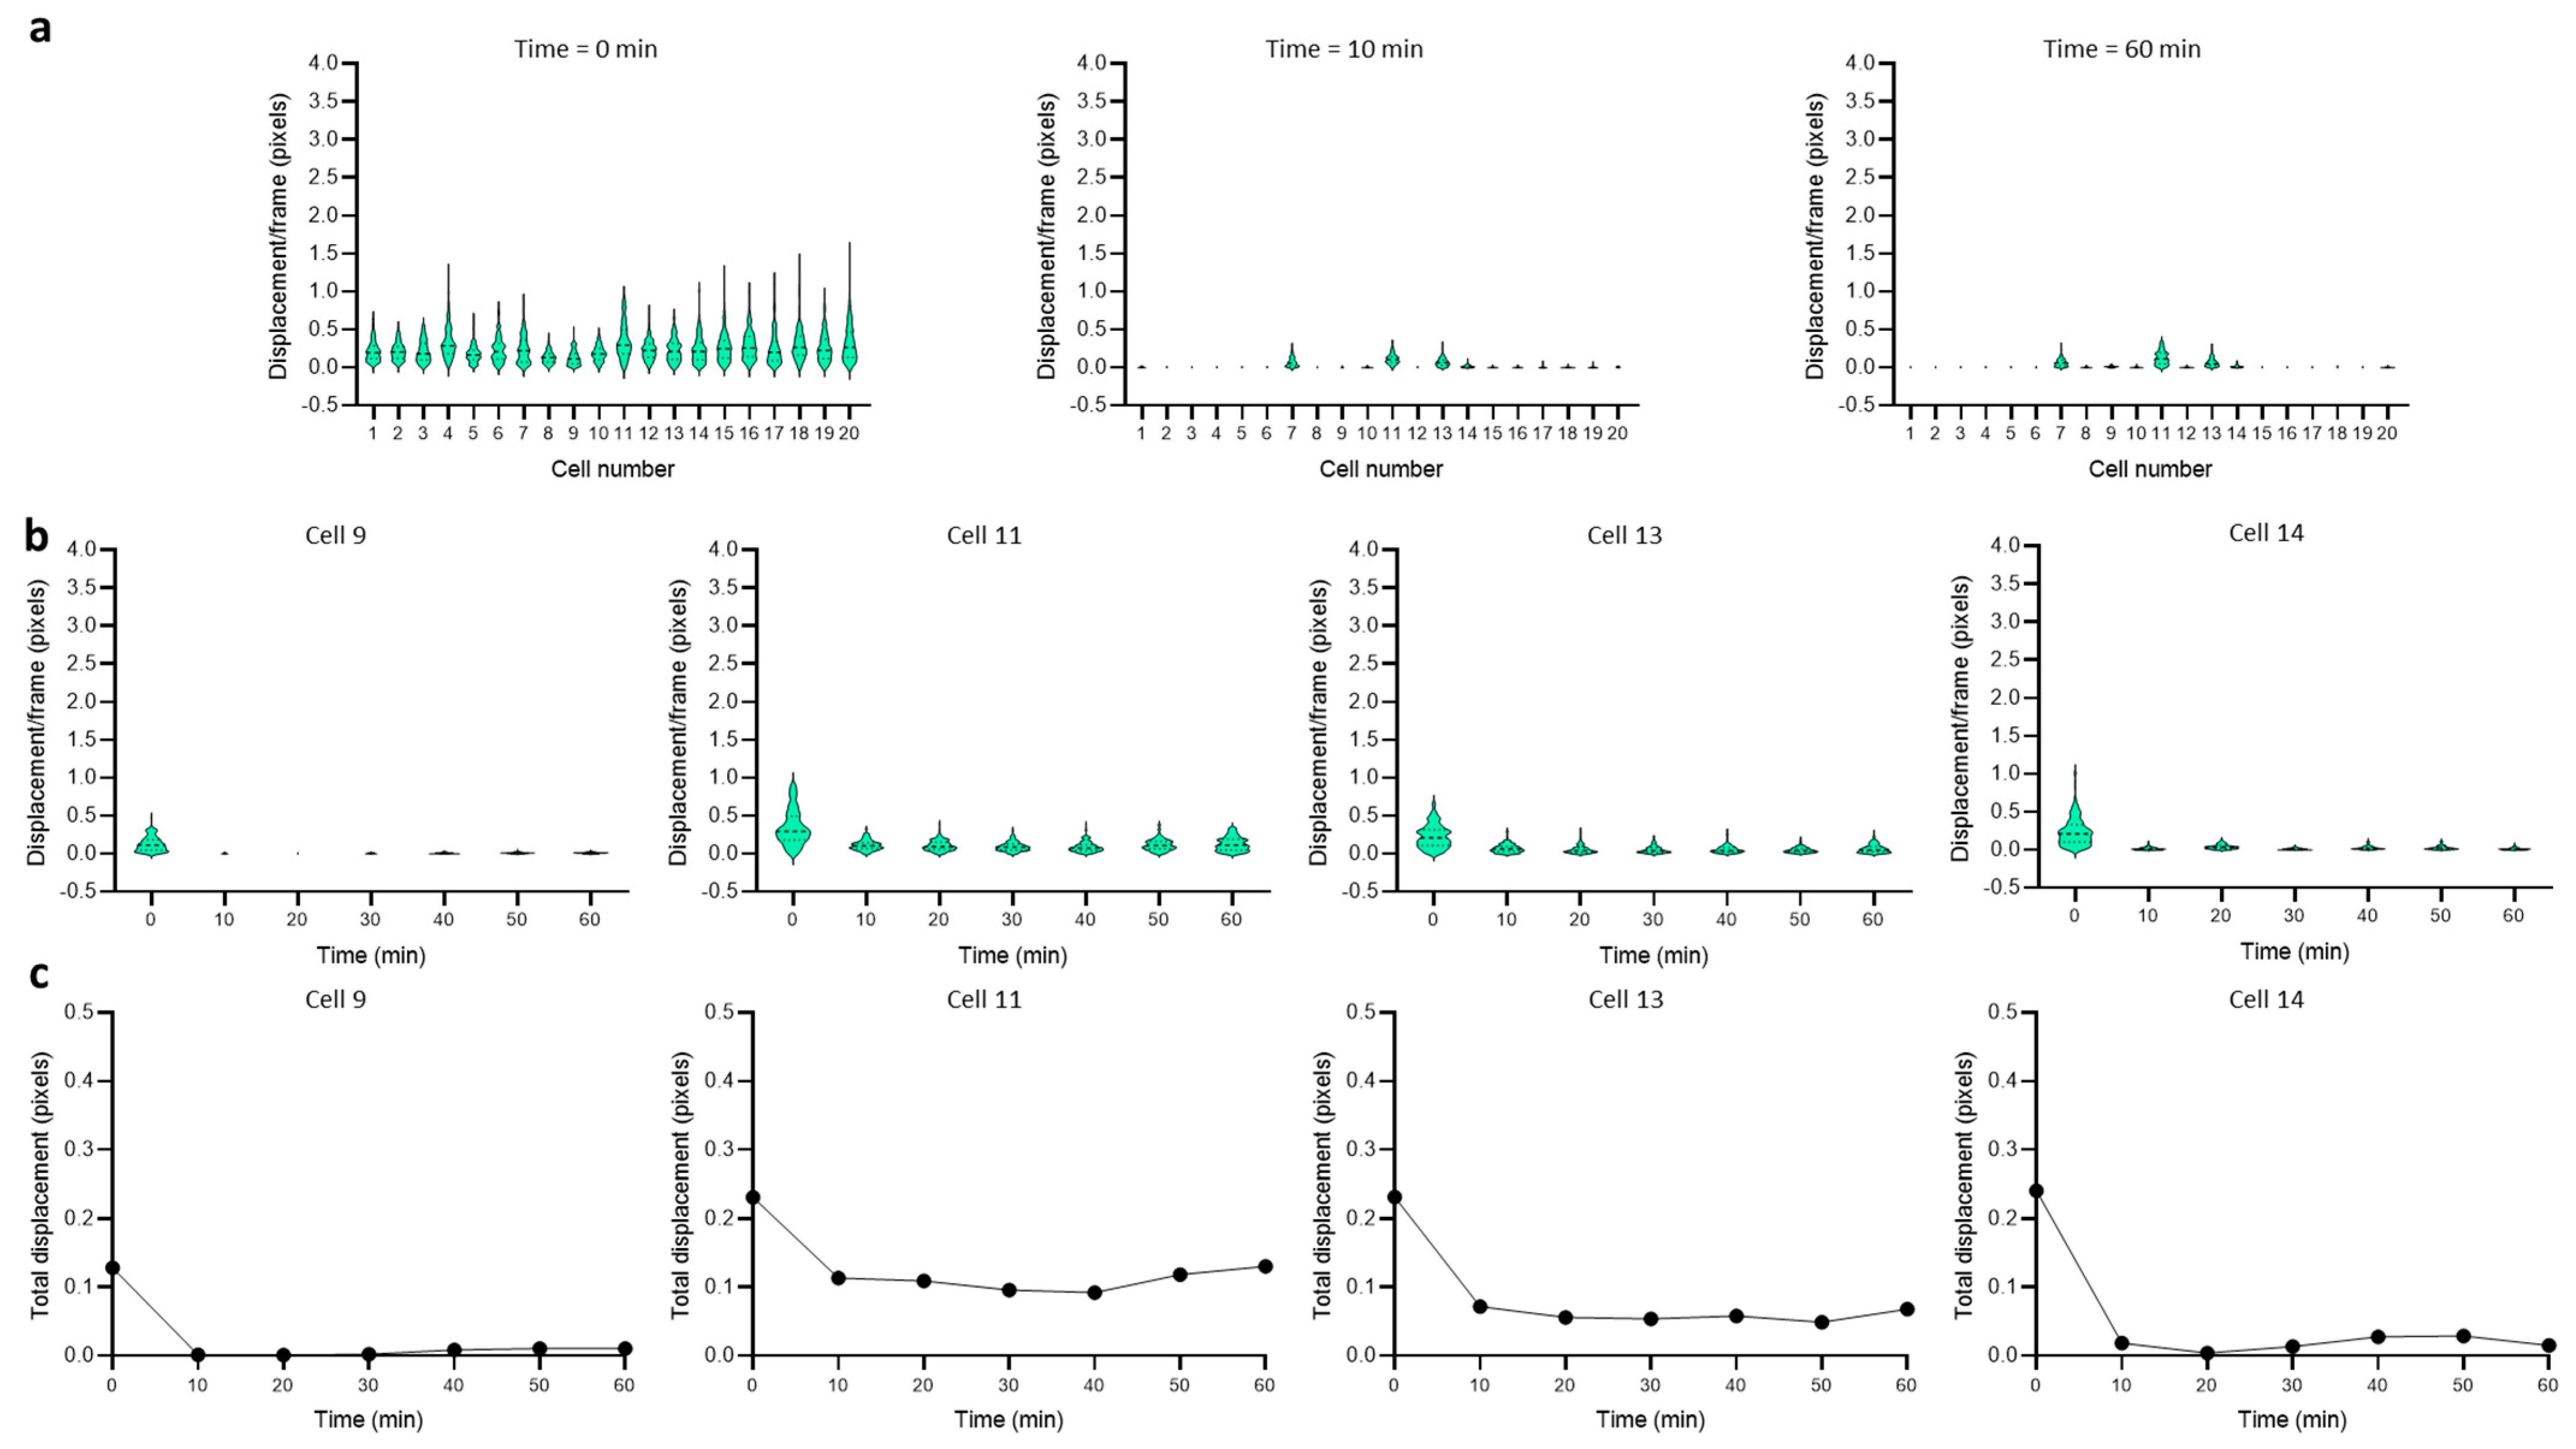
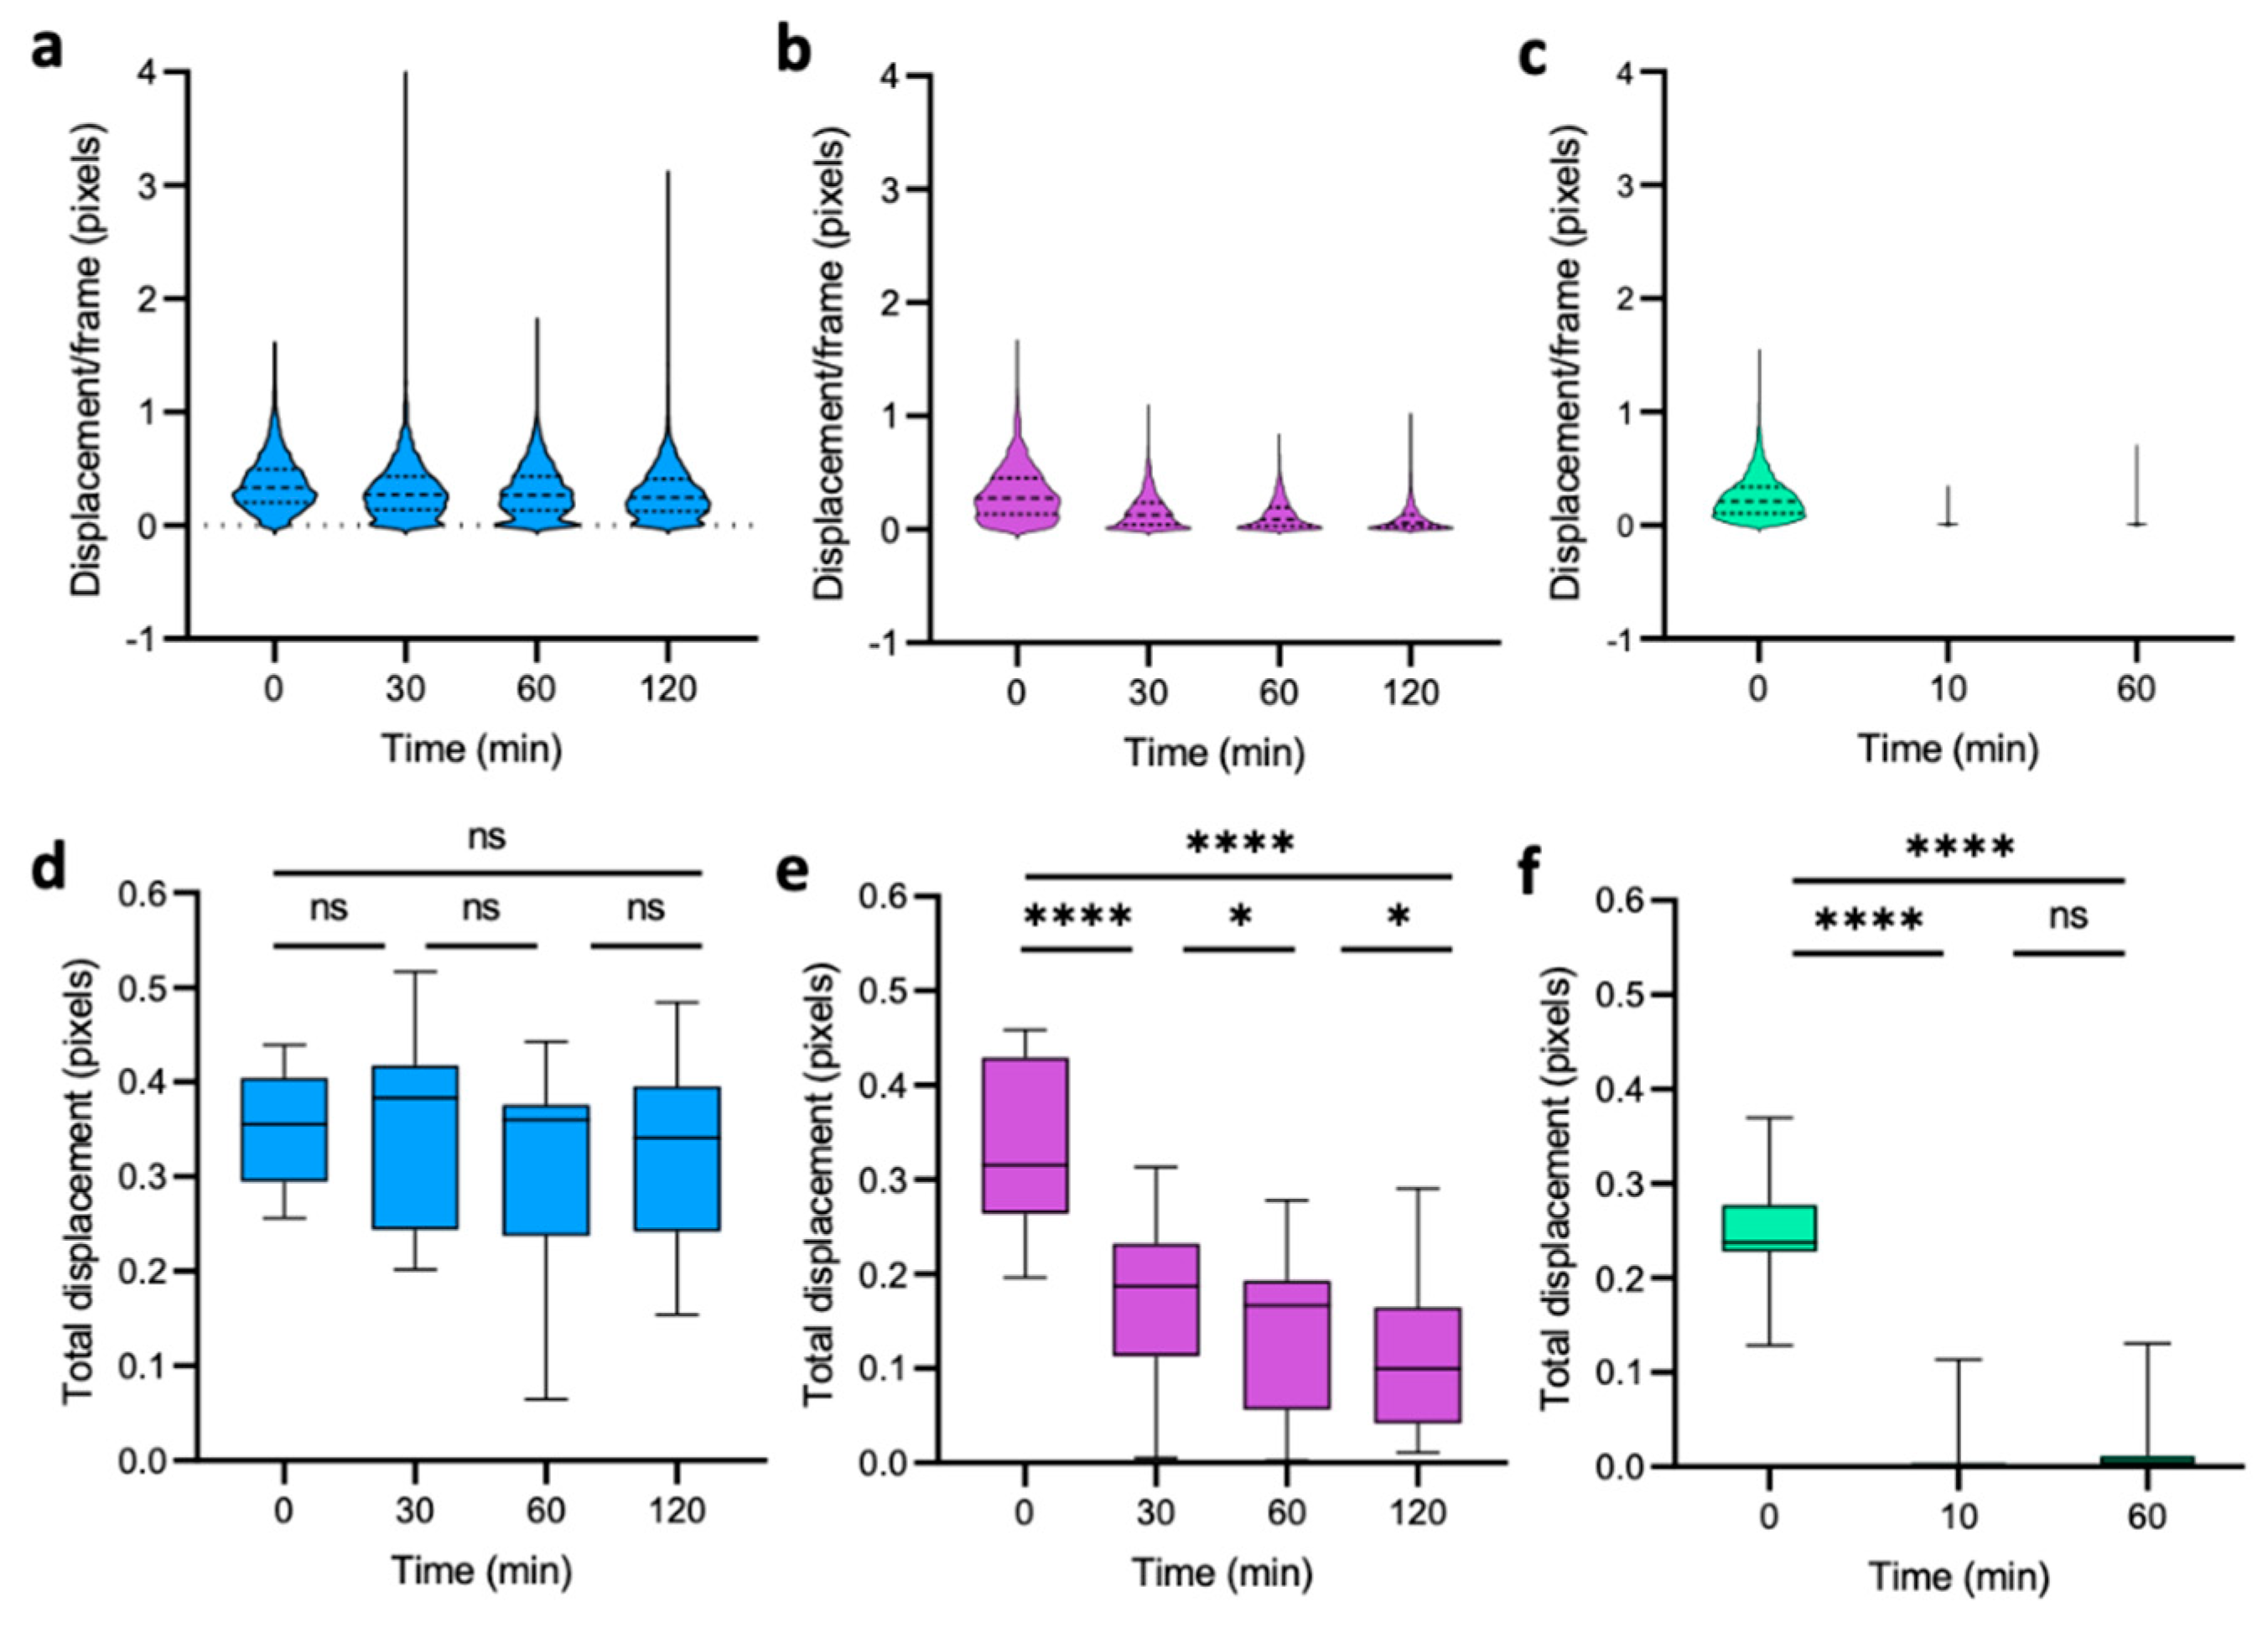
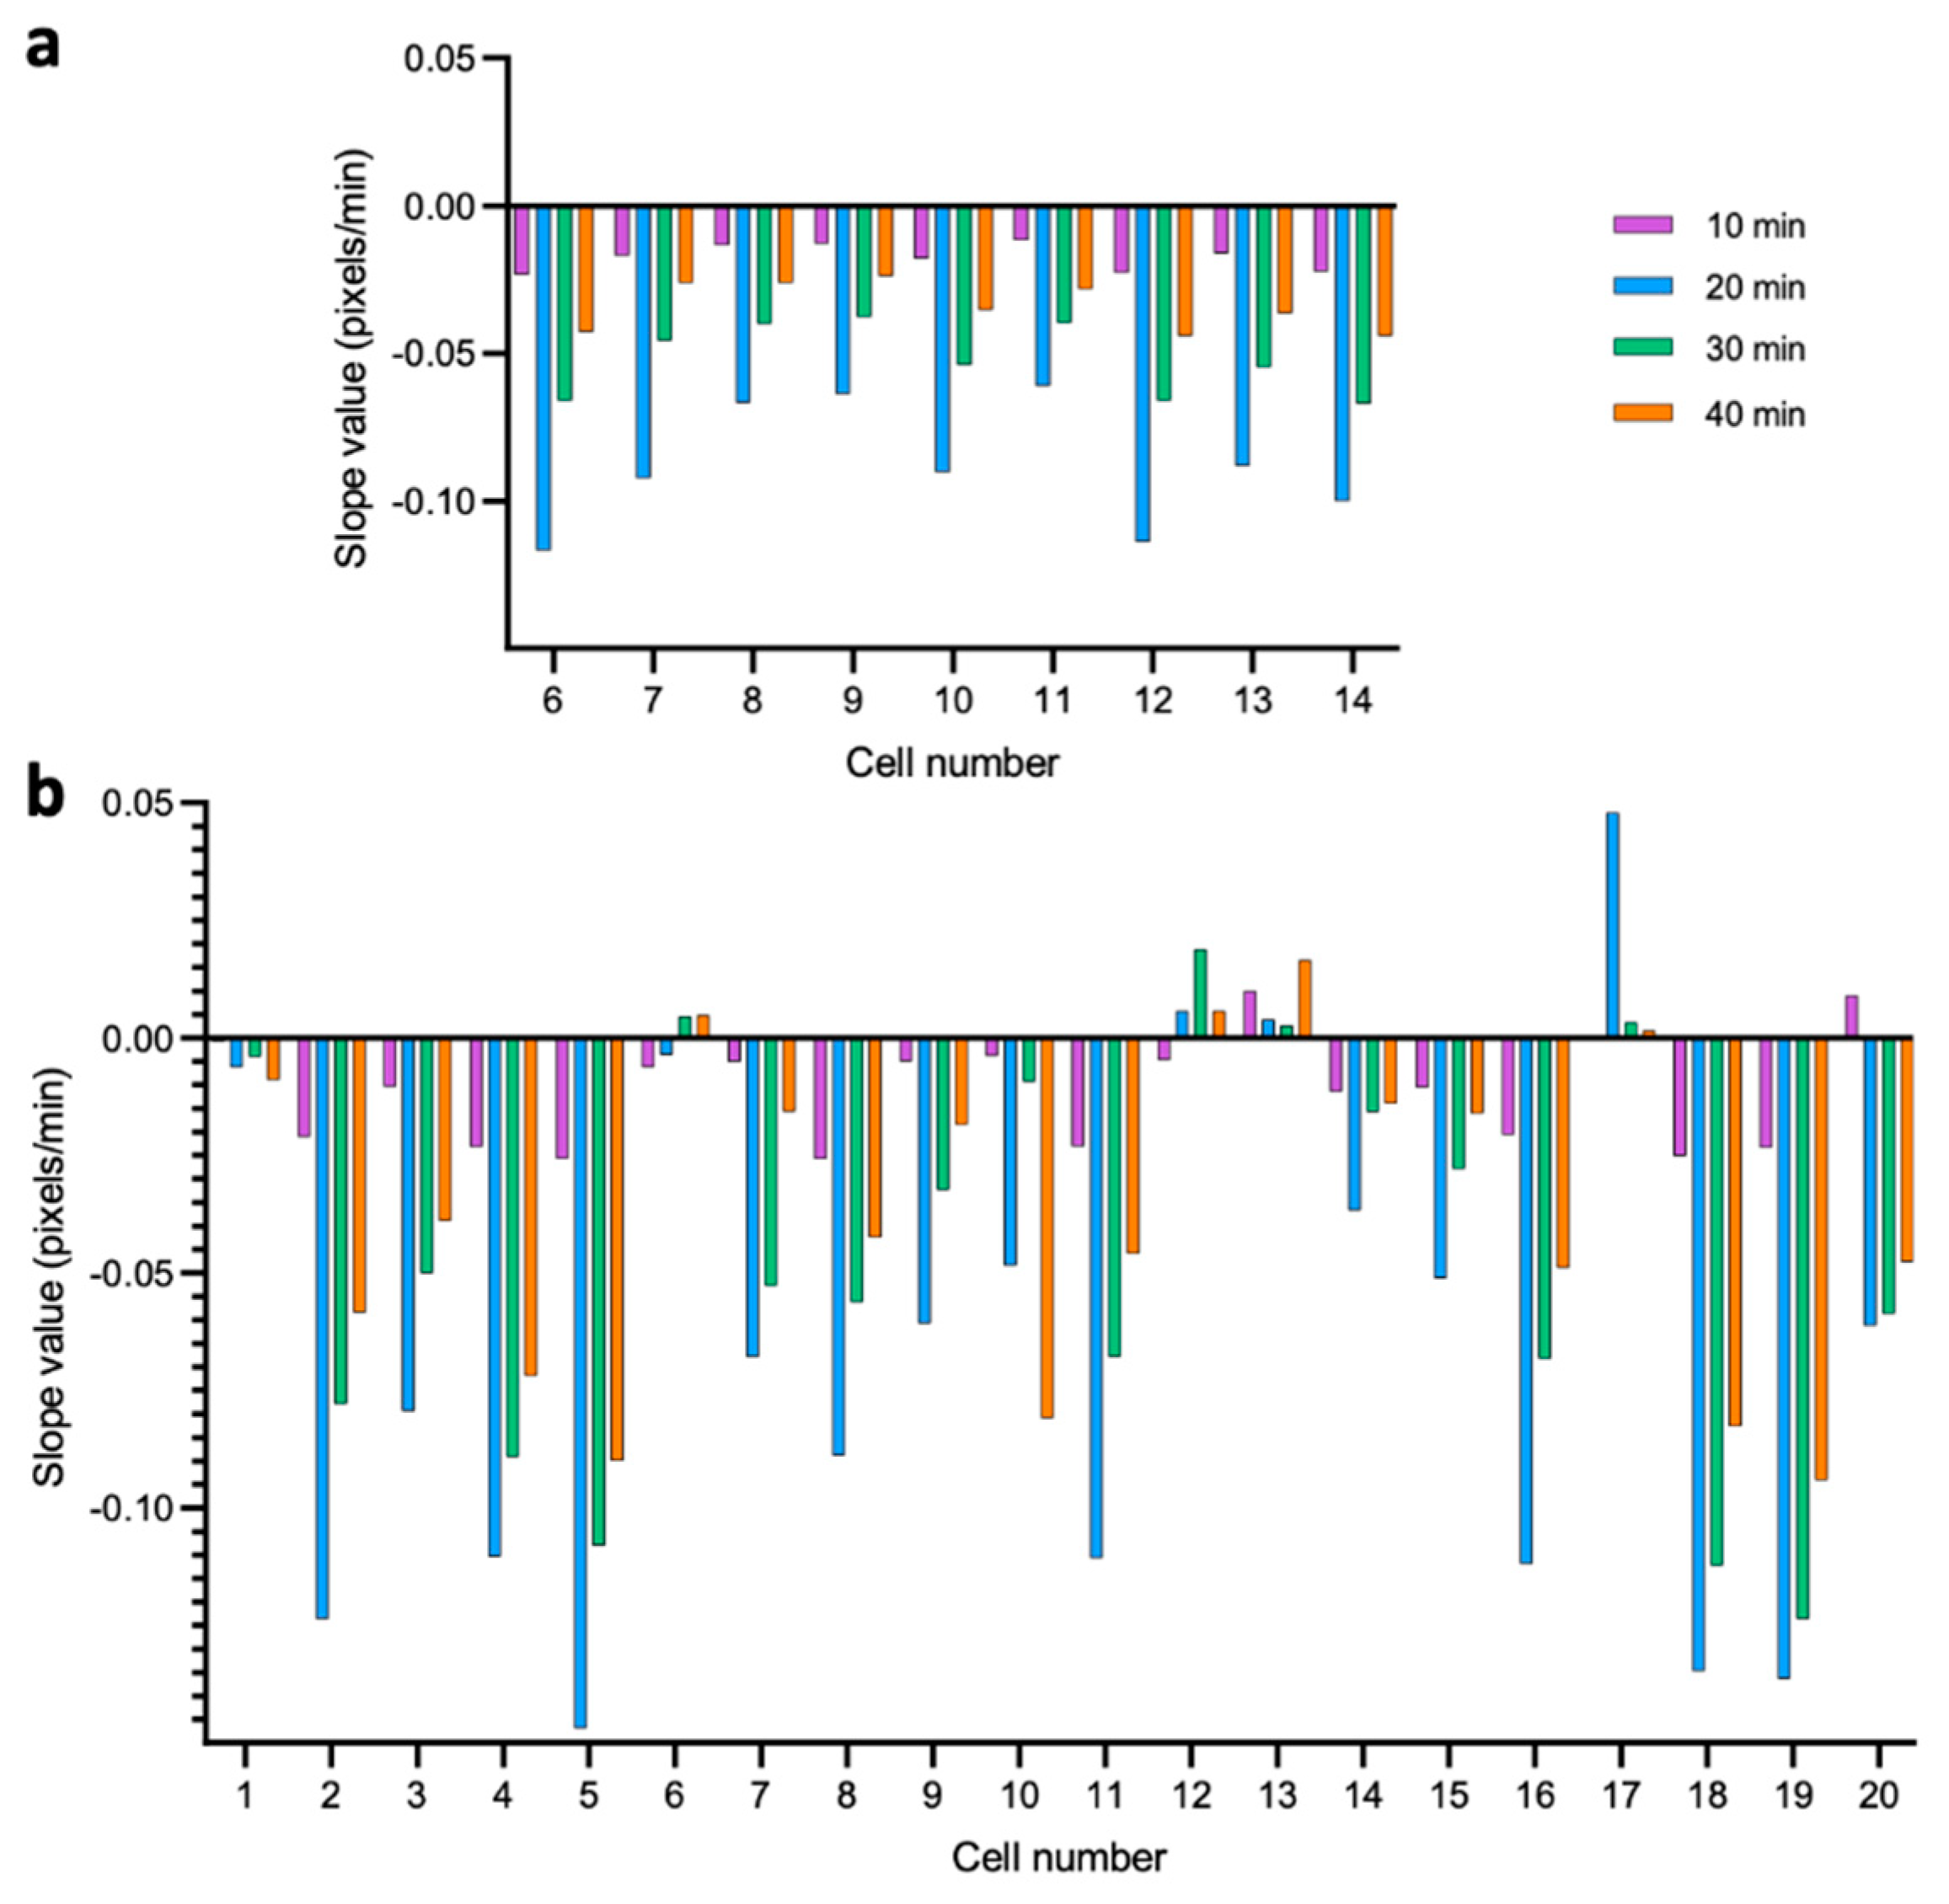
3.2. Dynamics of Single-Cell Nanomotion upon Treatment by a Killing Compound

A method was optimised to follow the nanomotion of several cells before and during treatment with a killing compound. After assembling the chip, the in- and outlets were connected by FEP tubing to a pressure-driven pump and a syringe pump. Firstly, the tubing and the chip were rinsed with isopropanol and then water to remove air bubbles.
Secondly, the imaging chambers were then filled with the yeast solution. The filling was ended by stopping the flow and clamping the inlet and outlet tubes. Then, the first movie of the nanomotion of single yeast cells was recorded in the no-flow chambers (time point zero min). The first movie was acquired right after stopping the flow to obtain nanomotion of cells without treatment. Thirdly, the chip was filled with the compound solution from inlet A, using a syringe pump with a low flow rate of 0.5 μL/min for approximately 20 min. Next, the nanomotion of the same individual yeasts was followed as a function of time, with a second movie taken 10 min (±1 min) after the compound reached its maximum concentration in the middle of the chamber. Each subsequent movie was taken at 10 min time intervals.
The first experiment was a control experiment, where the cellular nanomotion of 20 individual yeast cells (Figure S1c) during growth in YPD medium was recorded over a period of 120 min (Figure 3 and Figure S1c). The nanomotion data show that actively growing cells were characterised by an asymmetric distribution of displacement per frame (Figure 3a), which can vary from cell to cell as well as in time. Cells 8 and 13 (Figure 3b,c), and cells 2, 3, 5, and 6 (Figure S2) are characterised by a relatively large variation as a function of time, in contrast to cells 11 and 16 (Figure 3b,c), and cell 12 (Figure S2). Although variations could be seen between individual cells, at the population level (20 cells), no major differences between the distribution of the displacements/frames for all 20 cells and the average total displacements could be observed during the 2 h of growth (Figure 6a,d).
In the next experiments, we evaluated the effect of a killing compound on the variation of the cellular nanomotion of 20 individual yeast cells as a function of time. We evaluated 70% (v/v) ethanol and the antifungal amphotericin B as killing agents (Figure S1b). Since S. cerevisiae cells are quickly killed by ethanol [32], we followed the cellular nanomotion with a time interval of 10 min for only 1 h (Figure 4). The total displacements and the distribution of the displacements/frames showed a reduction already after 10 min of exposure, and stayed low up to the 1 h mark. Most cells died very quickly, as illustrated well by cells 9, 14 (Figure 4b,c), 6, 8, 10, and 12 (Figure S3). Three cells, i.e., cells 11 and 13 (Figure 4b,c), and cell 7 (Figure S3), still showed some nanomotion after 1 h exposure, which indicates that these cells were more ethanol-tolerant than the other cells. The overall susceptibility of the cell population to ethanol is confirmed by the distribution of the displacements/frames graph for all 20 cells, as well the average total displacements graph (Figure 6c,f).
Next, we evaluated the effect of amphotericin B on S. cerevisiae cells. Single-cell displacements were recorded every 10 min for 120 min (Figure S1c). We used a high concentration of the antifungal compound to obtain a fast response [39]. The total displacements and the distribution of the displacements/frames showed a reduction, which was less drastic than in the case of ethanol. Many cells, such as cells 4, 18 (Figure 5b,c), 3, 5, and 19 (Figure S4), were dead after 120 min of treatment. Nevertheless, some cells, i.e., cells 13, 15 (Figure 5b,c), 7, and 16 (Figure S4) still showed some nanomotion after 2 h exposure, which indicates that these cells were less sensitive to the antifungal. At the population level, the dynamics of the killing of the cells by amphotericin B is also demonstrated by the distribution of the displacements/frame graph for all 20 cells, as well the average total displacements graph (Figure 6b,e).
Finally, the sensitivity of the individual yeast cells to ethanol and amphotericin was characterised by analysing the slope of their decrease in nanomotion activity as a function of time. The more sensitive the cells are to the killing compound, the faster they stop moving, and so the more negative the slope of their nanomotion curve is. We calculated the slopes of the total displacement as a function of time for 10, 20, 30, and 40 min during the treatment with ethanol (Figure 7a) and amphotericin (Figure 7b). For the amphotericin treatment, the slopes calculated after 10, 20 and 30 min provide the necessary information to conclude that a cell is sensitive or more resistant (cells 1, 6, 12, 13, and 17 in Figure 7). Since the response to 70% ethanol is very fast, the slope calculated at the 10 min time points already indicates that the cell is sensitive. Based on these results, we can conclude that values of these slopes enable quantifying the effect of a killing compound in a short time frame (10 to 30 min).

4. Discussion

We developed a microfluidic chip for the optical nanomotion detection (ONMD) method [32]. The microfluidic chip contains no-flow imaging chambers, and the growth medium can be replaced by a treatment solution without disturbing the nanomotion of the cells. The cellular nanomotion of the same cells can be recorded before and during the treatment. Hence, by acquiring ONMD data at regular time intervals of a few minutes, the response of the cells to a chemical compound can be quantified as a function of time.
As a control, we observed the cellular nanomotion for 2 h. The results indicate that the cellular nanomotion reflects the “metabolic state” of the cell and that, in a population of 20 cells, some cells are more metabolically active. Previously, we found that ONMD was sensitive enough to detect differences between the metabolic state of S. cerevisiae cells that were grown in a growth medium, compared to cells in a buffer without nutrients [32]. Additionally, the cellular nanomotion of S. cerevisiae showed maximal nanomotion at its optimal growth temperature [32]. The variation of the nanomotion as a function of time for each cell could be influenced by the cell cycle. A hypothesis that can explain why the cell displacements are changing over time is that some molecular processes in the cell—such as cytoskeleton rearrangements and organelle transport—are more active at specific phases in the cell cycle. Moreover, major morphogenetic events that could influence the cellular nanomotion occur during the cell cycle, such as the polarisation of the cytoskeleton in late G1, leading to bud emergence, a depolarisation of growth within the bud, leading to uniform bud expansion in early G2, a breakdown of the mother-bud asymmetry in growth in late mitosis, and a refocusing of growth towards the neck upon mitotic exit [40].
We evaluated the sensitivity of the model yeast S. cerevisiae to the disinfectant ethanol and the antifungal amphotericin B. The killing of the cells by ethanol was very rapid, as a significant decrease in the cellular nanomotion could be observed within 10 min. A few cells still showed some activity after 60 min. Ethanol tolerance is strain-dependent [41], affects the growth rate, and impairs the cell membrane integrity [42], which results in ionic species permeability and the leakage of metabolites [43], and it freely diffuses inside the cell, where it directly perturbs and denatures intracellular proteins. Additionally, ethanol tolerance is influenced by the cell age [44]. All this could explain the variation that we observed in a population of 20 cells.
Amphotericin B is a polyene antifungal that selectively binds to ergosterol in the cell membrane and causes the formation of pores, which ultimately results in cell death [45]. It is a broad-spectrum fungicidal with activity against many fungi, including S. cerevisiae [5]. Most cells were killed within 2 h by treatment with a high concentration of amphotericin B. However, we could detect significant nanomotion of a few cells even after 2 h. These results indicate that there is a significant variation in the sensitivity of the cells in a population. Since ONMD is single-cell-sensitive, the ratio of resistant versus sensitive cells in a population could also be determined. This means that ONMD allows for the detection of one resistant cell in a population. Therefore, this ONMD method is superior to ensemble AFST methods for selecting the optimal antifungal agent.
The slope of the decrease in the nanomotion activity (as measured by the total displacement of the cell) as a function of time provides information on how fast the cell is killed by a specific compound. This “killing rate” is a new measure to rapidly assess AFST.
We selected the model yeast S. cerevisiae to evaluate the newly developed microfluidic chip. This chip could also be used to perform AFST on other yeasts such as the pathogenic yeasts Candida albicans, C. glabrata, and C. lusitaniae, since ONMD, as a method to perform rapid AFST, was previously demonstrated on these yeasts [32]. By extension, also AST on bacteria could be performed if the design of the no-flow chamber would be adapted, i.e., by reducing the height of the chamber.
In the future, the number of no-flow chambers could be increased and integrated into a chip with various compartments to assess different concentrations and different antifungals. Alternatively, an antimicrobial concentration gradient over the no-flow chamber could be implemented, which will allow for direct determinations of the minimal inhibitory concentration (MIC). In addition, we will study the variation of the nanomotion of cells during the cell cycle in more detail to find how the cellular nanomotion is influenced by each cell cycle phase.

Supplementary Materials

The following supporting information can be downloaded at: https://www.mdpi.com/article/10.3390/fermentation8050195/s1: Figure S1: Location of the selected cells in the imaging chambers: (a) amphotericin B treatment, (b) ethanol treatment, and (c) control experiment; Figure S2: Cellular nanomotion of S. cerevisiae cells grown in YPD medium during 2 h. Distribution of the displacement/frame as a function of time for additional selected cells; Figure S3: Effect of ethanol (70%) on the cellular nanomotion of S. cerevisiae. Distribution of the displacement/frame as a function of time for additional selected cells; Figure S4: Effect of the antifungal amphotericin B (500 µg/mL) on the cellular nanomotion of S. cerevisiae. Distribution of the displacement/frame as a function of time for additional selected cells.

Author Contributions

Conceptualisation, R.G.W. and S.K.; methodology, R.G.W., V.R., C.Y., M.I.V. and S.K.; software, S.K. and M.I.V.; validation, V.R., C.Y. and R.G.W.; formal analysis, V.R.; resources, R.G.W. and S.K.; data curation, V.R.; writing—original draft preparation, R.G.W., V.R., C.Y., M.I.V. and S.K.; writing—review and editing, R.G.W., V.R., C.Y., M.I.V. and S.K.; visualisation, V.R. and R.G.W.; supervision, R.G.W. and S.K.; project administration, R.G.W. and S.K.; funding acquisition, R.G.W. and S.K. All authors have read and agreed to the published version of the manuscript.

Funding

This research was funded by the Belgian Federal Science Policy Office (Belspo) and the European Space Agency (ESA), grant number PRODEX projects: Yeast Bioreactor and Flumias Nanomotion; FWO, grant numbers AUGE/13/19 and I002620; FWO-SNSF, grant number 310030 L_197946; The FWO-SB-FDW Ph.D. grant of VR. IV and SK were supported by SNSF grants, CRSII5_173863.

Institutional Review Board Statement

Not applicable.

Informed Consent Statement

Not applicable.

Data Availability Statement

All data needed to evaluate the conclusions in the paper are present in the paper and/or the Supplementary Materials. Additional data related to this paper may be requested from the authors.

Acknowledgments

The Research Council of the Vrije Universiteit Brussel (Belgium) and the University of Ghent (Belgium) are acknowledged to support the Alliance Research Group VUB-UGhent NanoMicrobiology (NAMI), and the International Joint Research Group (IJRG) VUBEPFL BioNanotechnology and NanoMedicine (NANO).

Conflicts of Interest

The authors declare no conflict of interest.

References

  1. Bongomin, F.; Gago, S.; Oladele, R.O.; Denning, D.W. Global and multi-national prevalence of fungal diseases—Estimate precision. J. Fungi 2017, 3, 57. [Google Scholar] [CrossRef] [PubMed]
  2. Denning, D.W. Calling upon all public health mycologists: To accompany the country burden papers from 14 countries. Eur. J. Clin. Microbiol. Infect. Dis. 2017, 36, 923–924. [Google Scholar] [CrossRef] [PubMed]
  3. Geddes-McAlister, J.; Shapiro, R.S. New pathogens, new tricks: Emerging, drug-resistant fungal pathogens and future prospects for antifungal therapeutics. Ann. N. Y. Acad. Sci. 2019, 1435, 57–78. [Google Scholar] [CrossRef] [PubMed]
  4. Beardsley, J.; Halliday, C.L.; Chen, S.C.-A.; Sorrell, T.C. Responding to the emergence of antifungal drug resistance: Perspectives from the bench and the bedside. Future Microbiol. 2018, 13, 1175–1191. [Google Scholar] [CrossRef] [Green Version]
  5. Willaert, R. Micro- and Nanoscale Approaches in Antifungal Drug Discovery. Fermentation 2018, 4, 43. [Google Scholar] [CrossRef] [Green Version]
  6. Lemke, A.; Kiderlen, A.F.; Kayser, O. Amphotericin B. Appl. Microbiol. Biotechnol. 2005, 68, 151–162. [Google Scholar] [CrossRef]
  7. Bellmann, R. Pharmacodynamics and Pharmacokinetics of Antifungals for Treatment of Invasive Aspergillosis. Curr. Pharm. Des. 2013, 19, 3629–3647. [Google Scholar] [CrossRef]
  8. Pfaller, M.A. Antifungal Drug Resistance: Mechanisms, Epidemiology, and Consequences for Treatment. Am. J. Med. 2012, 125, S3–S13. [Google Scholar] [CrossRef]
  9. Pianalto, K.M.; Alspaugh, J.A. New horizons in antifungal therapy. J. Fungi 2016, 2, 26. [Google Scholar] [CrossRef]
  10. Nivoix, Y.; Ubeaud-Sequier, G.; Engel, P.; Leveque, D.; Herbrecht, R. Drug-Drug Interactions of Triazole Antifungal Agents in Multimorbid Patients and Implications for Patient Care. Curr. Drug Metab. 2009, 10, 395–409. [Google Scholar] [CrossRef]
  11. Lewis, R.E. Current concepts in antifungal pharmacology. In Mayo Clinic Proceedings; Elsevier Ltd.: Amsterdam, The Netherlands, 2011; Volume 86, pp. 805–817. [Google Scholar]
  12. McCarthy, M.W.; Walsh, T.J. Drugs currently under investigation for the treatment of invasive candidiasis. Expert Opin. Investig. Drugs 2017, 26, 825–831. [Google Scholar] [CrossRef] [PubMed]
  13. Perfect, J.R. The antifungal pipeline: A reality check. Nat. Rev. Drug Discov. 2017, 16, 603–616. [Google Scholar] [CrossRef] [PubMed] [Green Version]
  14. Fuentefria, A.M.; Pippi, B.; Dalla Lana, D.F.; Donato, K.K.; de Andrade, S.F. Antifungals discovery: An insight into new strategies to combat antifungal resistance. Lett. Appl. Microbiol. 2018, 66, 2–13. [Google Scholar] [CrossRef] [PubMed] [Green Version]
  15. Silva, L.N.; de Mello, T.P.; de Souza Ramos, L.; Branquinha, M.H.; dos Santos, A.L.S. New and Promising Chemotherapeutics for Emerging Infections Involving Drug-resistant Non-albicans Candida Species. Curr. Top. Med. Chem. 2019, 19, 2527–2553. [Google Scholar] [CrossRef] [PubMed]
  16. Sousa, F.; Ferreira, D.; Reis, S.; Costa, P. Current insights on antifungal therapy: Novel nanotechnology approaches for drug delivery systems and new drugs from natural sources. Pharmaceuticals 2020, 13, 248. [Google Scholar] [CrossRef] [PubMed]
  17. Mota Fernandes, C.; Dasilva, D.; Haranahalli, K.; McCarthy, J.B.; Mallamo, J.; Ojima, I.; Del Poeta, M. The Future of Antifungal Drug Therapy: Novel Compounds and Targets. Antimicrob. Agents Chemother. 2021, 65, 65. [Google Scholar] [CrossRef] [PubMed]
  18. Scorzoni, L.; Fuchs, B.B.; Junqueira, J.C.; Mylonakis, E. Current and promising pharmacotherapeutic options for candidiasis. Expert Opin. Pharmacother. 2021, 22, 867–887. [Google Scholar] [CrossRef]
  19. Posteraro, B.; Torelli, R.; De Carolis, E.; Posteraro, P.; Sanguinetti, M. Antifungal susceptibility testing: Current role from the clinical laboratory perspective. Mediterr. J. Hematol. Infect. Dis. 2014, 6, e2014030. [Google Scholar] [CrossRef] [Green Version]
  20. Campbell, J.; McBeth, C.; Kalashnikov, M.; Boardman, A.K.; Sharon, A.; Sauer-Budge, A.F. Microfluidic advances in phenotypic antibiotic susceptibility testing. Biomed. Microdevices 2016, 18, 103. [Google Scholar] [CrossRef] [Green Version]
  21. Kohler, A.C.; Venturelli, L.; Longo, G.; Dietler, G.; Kasas, S. Nanomotion detection based on atomic force microscopy cantilevers. Cell Surf. 2019, 5, 100021. [Google Scholar] [CrossRef]
  22. Longo, G.; Alonso-Sarduy, L.; Rio, L.M.; Bizzini, A.; Trampuz, A.; Notz, J.; Dietler, G.; Kasas, S. Rapid detection of bacterial resistance to antibiotics using AFM cantilevers as nanomechanical sensors. Nat. Nanotechnol. 2013, 8, 522–526. [Google Scholar] [CrossRef] [PubMed]
  23. Kasas, S.; Ruggeri, F.S.; Benadiba, C.; Maillard, C.; Stupar, P.; Tournu, H.; Dietler, G.; Longo, G. Detecting nanoscale vibrations as signature of life. Proc. Natl. Acad. Sci. USA 2015, 112, 378–381. [Google Scholar] [CrossRef] [PubMed] [Green Version]
  24. Villalba, M.I.; Stupar, P.; Chomicki, W.; Bertacchi, M.; Dietler, G.; Arnal, L.; Vela, M.E.; Yantorno, O.; Kasas, S. Nanomotion Detection Method for Testing Antibiotic Resistance and Susceptibility of Slow-Growing Bacteria. Small 2018, 14, 1702671. [Google Scholar] [CrossRef] [PubMed]
  25. Venturelli, L.; Kohler, A.C.; Stupar, P.; Villalba, M.I.; Kalauzi, A.; Radotic, K.; Bertacchi, M.; Dinarelli, S.; Girasole, M.; Pešić, M.; et al. A perspective view on the nanomotion detection of living organisms and its features. J. Mol. Recognit. 2020, 33, e2849. [Google Scholar] [CrossRef]
  26. Kasas, S.; Malovichko, A.; Villalba, M.I.; Vela, M.E.; Yantorno, O.; Willaert, R.G. Nanomotion Detection-Based Rapid Antibiotic Susceptibility Testing. Antibiotics 2021, 10, 287. [Google Scholar] [CrossRef]
  27. Syal, K.; Iriya, R.; Yang, Y.; Yu, H.; Wang, S.; Haydel, S.E.; Chen, H.-Y.; Tao, N. Antimicrobial Susceptibility Test with Plasmonic Imaging and Tracking of Single Bacterial Motions on Nanometer Scale. ACS Nano 2016, 10, 845–852. [Google Scholar] [CrossRef]
  28. Johnson, W.L.; France, D.C.; Rentz, N.S.; Cordell, W.T.; Walls, F.L. Sensing bacterial vibrations and early response to antibiotics with phase noise of a resonant crystal. Sci. Rep. 2017, 7, 12138. [Google Scholar] [CrossRef] [Green Version]
  29. Syal, K.; Shen, S.; Yang, Y.; Wang, S.; Haydel, S.E.; Tao, N. Rapid Antibiotic Susceptibility Testing of Uropathogenic E. coli by Tracking Submicron Scale Motion of Single Bacterial Cells. ACS Sens. 2017, 2, 1231–1239. [Google Scholar] [CrossRef]
  30. Bermingham, C.R.; Murillo, I.; Payot, A.D.J.; Balram, K.C.; Kloucek, M.B.; Hanna, S.; Redmond, N.M.; Baxter, H.; Oulton, R.; Avison, M.B.; et al. Imaging of sub-cellular fluctuations provides a rapid way to observe bacterial viability and response to antibiotics. bioRxiv 2018, 460139. [Google Scholar] [CrossRef] [Green Version]
  31. Leonard, H.; Halachmi, S.; Ben-Dov, N.; Nativ, O.; Segal, E. Unraveling Antimicrobial Susceptibility of Bacterial Networks on Micropillar Architectures Using Intrinsic Phase-Shift Spectroscopy. ACS Nano 2017, 11, 6167–6177. [Google Scholar] [CrossRef]
  32. Willaert, R.G.; Vanden Boer, P.; Malovichko, A.; Alioscha-Perez, M.; Radotić, K.; Bartolić, D.; Kalauzi, A.; Villalba, M.I.; Sanglard, D.; Dietler, G.; et al. Single yeast cell nanomotions correlate with cellular activity. Sci. Adv. 2020, 6, eaba3139. [Google Scholar] [CrossRef] [PubMed]
  33. Schindelin, J.; Arganda-Carreras, I.; Frise, E.; Kaynig, V.; Longair, M.; Pietzsch, T.; Preibisch, S.; Rueden, C.; Saalfeld, S.; Schmid, B.; et al. Fiji: An open-source platform for biological-image analysis. Nat. Methods 2012, 9, 676–682. [Google Scholar] [CrossRef] [PubMed] [Green Version]
  34. Guizar-Sicairos, M.; Thurman, S.T.; Fienup, J.R. Efficient subpixel image registration algorithms. Opt. Lett. 2008, 33, 156. [Google Scholar] [CrossRef] [PubMed] [Green Version]
  35. Radomsky, M.L.; Whaley, K.J.; Cone, R.A.; Saltzman, W.M. Macromolecules released from polymers: Diffusion into unstirred fluids. Biomaterials 1990, 11, 619–624. [Google Scholar] [CrossRef]
  36. Saltzman, W.M.; Radomsky, M.L.; Whaley, K.J.; Cone, R.A. Antibody diffusion in human cervical mucus. Biophys. J. 1994, 66, 508–515. [Google Scholar] [CrossRef] [Green Version]
  37. Soeller, C.; Jacobs, M.D.; Donaldson, P.J.; Cannell, M.B.; Jones, K.T.; Ellis-Davies, G.C.R. Application of two-photon flash photolysis to reveal intercellular communication and intracellular Ca2+ movements. J. Biomed. Opt. 2003, 8, 418. [Google Scholar] [CrossRef]
  38. Casalini, T.; Salvalaglio, M.; Perale, G.; Masi, M.; Cavallotti, C. Diffusion and aggregation of sodium fluorescein in aqueous solutions. J. Phys. Chem. B 2011, 115, 12896–12904. [Google Scholar] [CrossRef] [Green Version]
  39. Rosłoń, I.E.; Japaridze, A.; Steeneken, P.G.; Dekker, C.; Alijani, F. Probing nanomotion of single bacteria with graphene drums. bioRxiv 2021, 2021.09.21.461186. [Google Scholar] [CrossRef]
  40. Howell, A.S.; Lew, D.J. Morphogenesis and the Cell Cycle. Genetics 2012, 190, 51–77. [Google Scholar] [CrossRef] [Green Version]
  41. Pandey, A.K.; Kumar, M.; Kumari, S.; Kumari, P.; Yusuf, F.; Jakeer, S.; Naz, S.; Chandna, P.; Bhatnagar, I.; Gaur, N.A. Evaluation of divergent yeast genera for fermentation-associated stresses and identification of a robust sugarcane distillery waste isolate Saccharomyces cerevisiae NGY10 for lignocellulosic ethanol production in SHF and SSF. Biotechnol. Biofuels 2019, 12, 40. [Google Scholar] [CrossRef] [Green Version]
  42. Schiavone, M.; Formosa-Dague, C.; Elsztein, C.; Teste, M.-A.; Martin-Yken, H.; De Morais, M.A.; Dague, E.; François, J.M. Evidence for a Role for the Plasma Membrane in the Nanomechanical Properties of the Cell Wall as Revealed by an Atomic Force Microscopy Study of the Response of Saccharomyces cerevisiae to Ethanol Stress. Appl. Environ. Microbiol. 2016, 82, 4789–4801. [Google Scholar] [CrossRef] [PubMed] [Green Version]
  43. Stanley, D.; Bandara, A.; Fraser, S.; Chambers, P.J.; Stanley, G.A. The ethanol stress response and ethanol tolerance of Saccharomyces cerevisiae. J. Appl. Microbiol. 2010, 109, 13–24. [Google Scholar] [CrossRef] [PubMed]
  44. Eigenfeld, M.; Kerpes, R.; Becker, T. Understanding the Impact of Industrial Stress Conditions on Replicative Aging in Saccharomyces cerevisiae. Front. Fungal Biol. 2021, 2, 665490. [Google Scholar] [CrossRef]
  45. Kristanc, L.; Božič, B.; Jokhadar, Š.Z.; Dolenc, M.S.; Gomišček, G. The pore-forming action of polyenes: From model membranes to living organisms. Biochim. Biophys. Acta-Biomembr. 2019, 1861, 418–430. [Google Scholar] [CrossRef] [PubMed]
Figure 1. (a) Mathematical modelling of the fluid flow velocity at the mid-plane of the imaging chambers (4 µm). (b) Pressure distribution over the design. (c) Mask design of the flow cell with inlet and outlet channels. (d) Dimensions of a cross-section of the 2 imaging chambers and channels (3-D profilometer). (e) Constructed flow cell showing the imaging chambers (red rectangles) containing yeast cells.
Fermentation 08 00195 g001
Figure 2. (a) Diffusion of fluorescein in the imaging chambers: fluorescent images at different time points; red squares represent the analysed area. (b) Simulation of the diffusion in the chamber: evolution of the normalised fluorescein concentration at the same time points as in (a). (c) Evolution of the experimentally determined fluorescein concentration (black triangles) overlaid with the simulated evolution of the concentration (with a diffusion coefficient of 3.2 × 10⁻¹⁰ m2/s) (blue dots). (d) Differential image of flowing yeast cells in the channels and the chamber during filling the imaging chambers from inlet B. (e) Differential image of flowing yeast cells during ethanol flow from inlet A. (f) Higher magnification differential image during ethanol flow from inlet A (the imaging chamber edges are indicated with a dashed line). (g) Typical differential image of cell positions in the no-flow imaging chamber during cellular nanomotion measurements.
Fermentation 08 00195 g002
Figure 3. Cellular nanomotion of S. cerevisiae cells grown in YPD medium during 2 h. (a) Distribution of the displacements per frame for each of the 20 analysed cells at times 0, 30 min, 60 min, and 120 min. (b) Distribution of the displacement/frame as a function of time for 4 selected cells: cells 8, 11, 13, and 16. (c) Total displacement as a function of time for the selected cells.
Fermentation 08 00195 g003
Figure 4. Effect of ethanol (70%) on the cellular nanomotion of S. cerevisiae. (a) Distribution of the displacements per frame for each of the 20 analysed cells before treatment and after 10 min and 60 min. (b) Distribution of the displacements/frames as a function of time for 4 selected cells: cells 9, 11, 13, and 14. (c) Total displacements as a function of time for the selected cells.
Fermentation 08 00195 g004
Figure 5. Effect of the antifungal amphotericin B (500 µg/mL) on the cellular nanomotion of S. cerevisiae. (a) Distribution of the displacements per frame before treatment and after 30 min, 60 min, and 120 min. (b) Distribution of the displacements/frames as a function of time for 4 selected cells: cells 4, 13, 15, and 18. (c) Total displacements as a function of time for the selected cells.
Fermentation 08 00195 g005
Figure 6. Averaged cellular nanomotion for 20 cells. (a) Distribution of the displacements/frames during 2 h growth (control). (b) Distribution of the displacements/frames during amphotericin treatment. (c) Distribution of the displacements/frames during ethanol treatment. (d) The total displacement during 2 h growth (control). (e) The total displacement during amphotericin treatment. (f) The total displacement during ethanol treatment. Wilcoxon test: **** p < 0.0001; * p < 0.1; ns: not significant.
Fermentation 08 00195 g006
Figure 7. The slopes of the decrease in the total displacement as a function of time are calculated based on the time points 10, 20, 30, and 40 min during (a) ethanol and (b) amphotericin B trea-ment.
Fermentation 08 00195 g007
Publisher’s Note: MDPI stays neutral with regard to jurisdictional claims in published maps and institutional affiliations.

