Article

Removal of Nutrients by Using Green Microalgae from Lab-Scale Treated Palm Oil Mill Effluent

1
Environmental Technology Division, School of Industrial Technology, Universiti Sains Malaysia, Penang 11800, Malaysia
2
Green Biopolymer, Coating & Packaging Cluster, School of Industrial Technology, Universiti Sains Malaysia, Penang 11800, Malaysia
3
Regional Centre of Expertise, Centre for Global Sustainability Studies, Universiti Sains Malaysia, Penang 11800, Malaysia
4
School of Biological Sciences, Universiti Sains Malaysia, Penang 11800, Malaysia
5
Chemistry Department, College of Science, King Saud University, Riyadh 11451, Saudi Arabia
6
Division of Chemistry and Biotechnology, Dongguk University, 123 Dongdaero, Gyeongju-si 780714, Republic of Korea
*
Authors to whom correspondence should be addressed.
Fermentation 2022, 8(11), 658; https://doi.org/10.3390/fermentation8110658
Submission received: 17 October 2022 / Revised: 17 November 2022 / Accepted: 18 November 2022 / Published: 20 November 2022
(This article belongs to the Special Issue Research Progress of Microorganisms in Wastewater Treatment)

Abstract

:
The use of microalgae for the removal of contaminants such as total phosphorus (TP), total nitrogen (TN), chemical oxygen demand (COD), and other pollutants from palm oil mill effluent (POME) has recently received much attention. This study aimed to investigate the impact of POME as a nutrient on microalgal growth and the rate at which nutrients were removed. Three green microalgae species were isolated from Penang, Malaysia’s palm oil mill. The polyphasic approach, which combines morphological and molecular observations, was used for species identification. The three green microalgae were identified as Chlorella sorokiniana, Scenedesmus quadricauda, and Chlorococcum oleofaciens. All three green microalgae were cultivated in 25%, 50%, and 75% (v/v) of lab-scale palm oil mill effluent (LABT-POME) to investigate the growth of these three green microalgae in 100 mL of BBM. Under a light microscope and a scanning electron microscope (SEM), the morphological changes of those three green microalgae (before and after cultivation in 25%, 50%, and 75% dilution of (LABT-POME)) were observed. When cultivated in LABT-POME, C. oleofaciens showed the highest growth rate compared to the other two species of green microalgae. C. oleofaciens was able to remove more than 90% of total phosphorus (TP), total nitrogen (TN), and ammonia nitrogen from LABT-POME, as well as minimise soluble chemical oxygen demand (SCOD) by about 65%. The growth of C. oleofaciens was well fitted to the Verhulst growth kinetic model with an R2 value of 0.99 and a growth rate of 0.3195 day−1 (d−1). The results of this study show the ability of newly isolated green microalgae to remove nutrients (TP, TN, NH3–N, and SCOD) from POME, which could be used as an effective and environmentally friendly method to remove pollutants.

1. Introduction

Palm oil trees originated in West Africa and were first introduced in Malaysia in the early twentieth century as a stimulus for socio-economic development [1]. The palm oil industry predicts that production will reach up to 25 Mt in 2035 [2]. Although the palm oil industry has aided Malaysia’s economic development, it has also caused environmental issues because of the large amount of waste it generates [3]. As part of the green initiative by the palm oil mill industry, the raw POME is anaerobically digested to produce biogas as a renewable energy resource and further treatmed with aerobic digestion [4]. The effluent from anaerobic-aerobic treatment contains various suspended components such as carbohydrates (from hemicellulose to simple sugar), free organic acids, and nitrogenous compounds (from protein to amino acids) [5]. Due to the presence of these properties in anaerobically digested POME, it could be used as a potential medium for the cultivation of microalgae, as reported in earlier studies [6,7,8].
High-level nitrate pollutants in water supplies can result in several health issues in humans, such as methemoglobinemia, which is a condition of elevated methemoglobin in the blood, and even cancer [9]. Like nitrogen, phosphorus can be found naturally on surfaces and in groundwater. Naturally, phosphorus in bodies of water is not harmful to human health, but it does cause digestive problems at extremely high levels [10,11]. POME is typically high in total nitrogen (180–1400 mg/L) [12], total phosphorus (75–1500 mg/L) [13], and other organic matter [14]. Microalgae growth can be assisted by these organic and inorganic substances. The potential of microalgae to use the organic and inorganic substances in POME as nutrients has attracted interest in their use in POME treatment in recent years [15].
Microalgae-based treatment is a promising, safe, and efficient method for wastewater treatment [16]. Many species of green microalgae, such as Chlorella sp. [17], Chlorococcum sp. [18], Scenedesmus sp. [19], etc. have been used in the wastewater treatment system. The use of microalgae in POME treatment has a range of advantages. It effectively reduces nutrient loads while being environmentally friendly and relatively safe because no secondary pollution is generated [20]. However, one of the most significant obstacles is the POME’s cloudy and dark color, which reduces light penetration and, as a result, inhibits microalgae growth [21]. In addition, microalgae growth would be inhibited by other microorganisms that coexist in the POME. As a result, understanding the properties of the microalgae species is crucial before using the strain in palm oil mill effluent treatment.
Although POME treatment with microalgae is one of the most promising and eco-friendly methods that has been well-known for a long time, it has received little attention from palm oil millers in Malaysia as current practises focus on applying anaerobic-aerobic ponding treatment systems [3]. Up until 2019, there has been limited research work done on isolating and defining native microalgae from POME. The microalgae in previous studies [3,22,23], were obtained from existing strains cultured in the lab or purchased directly from suppliers to be used in POME treatment. This would influence the effectiveness of microalgae-based treatments since not all microalgae can withstand POME. However, since 2020, some work has been published on removing POME nutrients by strains isolated from POME. For example, [5,12,24], the current trend shows the potential of using POME-isolated strains to treat it.
Therefore, this present study was conducted to cultivate the native microalgae isolated from POME and subsequently characterise the species, especially their trophic mode and biokinetic performance. The weather would influence the physicochemical characteristic of POME temperature because the palm oil mills in Malaysia use an open ponding treatment system. The POME sample would be diluted during the rainy season but concentrated during droughts. The fluctuating physiochemical characteristics of the POME sample would also influence the growth of microalgae and, hence, affect the efficiency of the treatment process. Therefore, a raw POME sample was collected and underwent lab-scale pre-treatment processes before being used to cultivate the microalgae. Microalgal culture is an unquestionably superior alternative to current conventional technologies for removing chemical oxygen demand (COD), biochemical oxygen demand (BOD), ammonia nitrogen (NH3–N), and total phosphorus (TP) from POME and other wastewaters. This study focused on the removal of nutrients, total phosphorus (TP), total nitrogen (TN), ammonia nitrogen (NH3–N), and soluble chemical oxygen demand (SCOD) through microalgae.

2. Materials and Methods

2.1. Sample Collection

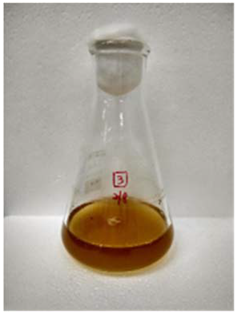
Palm oil mill effluent was taken from a palm oil mill in Penang, Malaysia (5.1785° N, 100.4845° E). The hydraulic retention times were 16 days and 50 days, and the collected raw palm oil mill effluent was pre-treated based on our previous research [25]. Figure 1 depicts the laboratory pre-treatment process. Table 1 lists the physiochemical characteristics of lab-scale treated POME (LABT-POME).

2.2. Preparation of Microalgae Growth Media

The microalgae in this study were produced and cultivated in Bold’s Basal Medium (BBM), which is successful for many different kinds of algae. In brief, 1 L of BBM contained 25 g/L of NaNO3, 7.5 g/L of MgSO4·7H2O, 7.5 g/L of K2HPO4, 2.5 g/L of CaCl2·H2O, 2.5 g/L of NaCl, 11.42 g/L of H3BO3, 50 g/L EDTA·Na2, 31 g/L of KOH, 4.98 g/L FeSO4·7H2O, 1 mL of concentrated HCl, and 1 mL of a trace elements solution. The trace elements solution comprised of 8.82 g/L of ZnSO4, 1.44 g/L of MnCl2·4H2O, 1.59 g/L of CuSO4·5H2O, 0.71 g/L of MoO3, and 0.49 g/L of Co(NO3)·4H2O. The ingredients were diluted with 1 L of distilled water and autoclaved for 15 min at 121 °C [26,27].

2.3. Green Microalgae Isolation and Culture

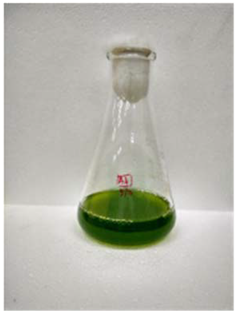
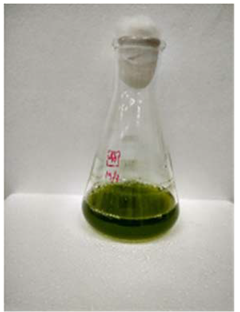
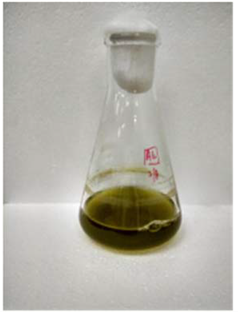
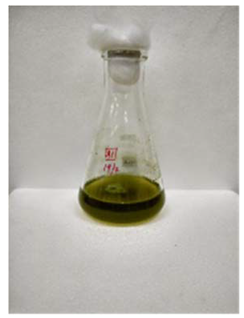
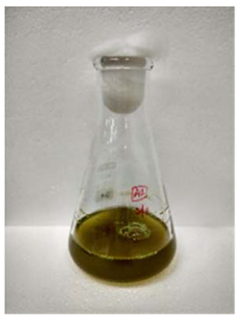
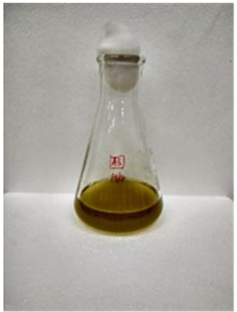
The procedure for isolation and culturing of the microalgal species has been described in our previous study [25]. A few freshwater green microalgae strains were isolated from the palm oil mill’s polishing pond. All the samples obtained from the polishing pond were first examined under a light microscope to ensure the presence of microalgae. A 50 mL sample of green microalgae was inoculated into a 250 mL Erlenmeyer flask for each sample, as shown in Figure 1. A 50 mL sample of autoclaved liquid BBM was added to each Erlenmeyer flask to provide nutrients for the green microalgae. To allow the green microalgae to adapt and grow, all the samples were incubated for 14 d at room temperature (35 ± 3 °C) with 100 rpm agitation and illumination at 32.4 ± 2.7 μmol m−2 s−1. All the single species of green microalgae were transferred to grow in liquid BBM at ambient temperature (35 ± 3 °C) with continuous agitation of 100 rpm and illumination of 32.4 ± 2.7 μmol m−2 s−1 (light/dark period: 12 h:12 h). To maintain the cells’ development and nimbleness, each strain was regularly transferred to a fresh batch of BBM liquid every 28 days.

2.4. Morphological Identification

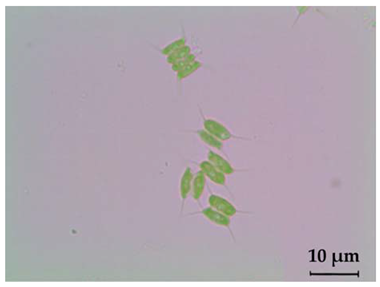
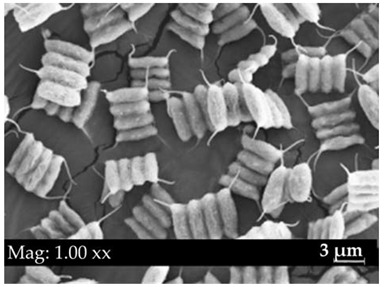
All isolated green microalgal species were examined by light microscopy at a magnification of 40×. The visual characteristics of green microalgae cells were characterised and compared to the available literature [28,29,30]. In addition, scanning electron microscopy (SEM) was used to determine the three-dimensional structure and size of isolated green microalgae (before and after inoculation into the POME sample). Green microalgae samples were thoroughly prepared for SEM examination. Before being treated with hexamethyldisilazane, they were dried.

2.5. Molecular Identification

The microalgae strain was collected from a 1 mL stock culture and centrifuged at 10,000 rpm for 2 min. The supernatant from all the samples of green microalgae was thrown away, and the remaining algal cells were put through molecular testing. Plant DNA Extraction Kits were used to remove genomic DNA from the microalgae cells (Vivantis Technologies, Selangor Darul Ehsan, Malaysia). All extraction processes followed the manufacturer’s guidelines. Using the polymerase chain reaction, we were able to amplify the desired sequences from the isolated DNA. Different primers and PCR methods were used to amplify each of the targeted genes [31,32,33]. All PCR amplifications were performed using a Mastercycler® ep PCR (United Kingdom) machine at the Center for Chemical Biology, Universiti Sains Malaysia. The 18 S rRNA sequences were analysed with a programme called Basic Local Alignment Search Tool (BLAST). The National Center for Biological Information (NCBI) database was searched for similar sequences.

2.6. Experimental Setup

The acclimation of green microalgae was studied using different concentrations of LABT-POME. LABT-POME samples were first autoclaved and then mixed with sterile liquid BBM to get a 25% (v/v) dilution. Every green microalga was added to the LABT-POME samples at a rate of 10% (v/v), and they were grown with a light intensity of 32.4 ± 2.7 μmol m−2 s−1 for 12 h and 12 h dark cycles. All samples were moved around on an orbital shaker set to 100 rpm at room temperature. To find out how much chlorophyll-a was in each sample, a 10 mL sample was taken every two days. After 10 days of growth, 10 mL of microalgae were moved to a different dilution of LABT-POME (50% v/v and 75% v/v). All of the experiments were performed three times. For subsequent analyses, we chose the green microalgae strains that grew the fastest in LABT-POME.
In a 200 mL Erlenmeyer flask with LABT-POME, a 10% (v/v) solution of the chosen green microalgae with an optical density (OD) of less than 1.0 was added. There were three types of control runs in this experiment: blank control, autoclaved blank control, and actual control. The LABT-POME sample was used to make a “blank control” but no green microalgae were added. Auto blank control was conducted without adding green microalgae to the sterilised LABT-POME sample, while the actual control was conducted by adding green microalgae to the sterilised LABT-POME sample. All experiments were done in cycles of 12 h of darkness and 12 h of light. The light intensity was 32.4 ± 2.7 μmol m−2 s−1, and the orbital shaker moved at 100 rpm. Every two days, a 10 mL sample was taken from the flask to measure the removal of nutrients and the concentrations of TN, TP, NH3–H, SCOD, and chlorophyll-a. When the growth of green microalgae reached a plateau, all experimental work stopped (because the concentration of chlorophyll-a doesn’t change for 4–5 days). All the graphs in this study were made using the SIGMAPLOT® 12.5, United Kingdom, software. Each experiment was performed three times.

2.7. Analytical Methods

2.7.1. Analysis of Chlorophyll

The approach used in this study to analyse chlorophyll, as well as the comprehensive discussion of each individual work, refers to the research conducted by [34]. The chlorophyll-a content of each sample of green microalgae was determined by Equation (1).
C h l o r o p h y l l = 5.2007   A 649 + 13.5275   A 665

2.7.2. Nutrients Removal Analysis

The procedure of those nutrients (TP, TN, NH3–H, and SCOD) analysis was carried out in compliance with the HACH standard procedures. Equation (2) below illustrates the method used to determine the nutrient elimination percentage.
R p e r c e n t = S i S e S i × 100 p e r c e n t
where R indicates the percentage of nutrients removed; S i represents the initial concentration of nutrients (mg/L); and S e represents the equilibrium concentration of nutrients (mg/L).

2.7.3. Specific Rate of Growth

The specific growth rate is a calculation of the ability of a green microalgae to grow under specific environmental circumstances [35]. Equation (3) was utilised to calculate the specific growth rate of every green microalga [36].
μ = l n x 2 l n x 1 t 2 t 1
where µ indicates the specific growth rate (d−1), x 1 and x 2 represent the chlorophyll a concentration (µg/L), and t 1 and t 2 represent the duration within the exponential phase (d).
Using Equation (4), the doubling time of each green microalgae was determined [36].
t d = ln 2 μ
where t d stands for the doubling time of microalgae ( d ) and µ stands for the particular growth rate of microalgae (d−1).

2.7.4. Kinetic Study

The dynamic of green microalgae growth was calculated using the Verhulst logistical model (Equation (5)) [37].
X = X o e μ t 1 X o X m 1 e μ t
where X is the time-course biomass concentration of green microalgae (g/L), X o is the initial biomass concentration (g/L), X m is the equilibrium biomass concentration (g/L), t is the cultivation length (d), and µ is the maximum specific growth rate of green microalgae (d−1).

2.8. Quality Control

For the overall analysis, chemicals and reagents of analytical grade were used. For reagent preparation and dilution, the deionized water was used. The chemicals and reagents were purchased from Merck, Selangor Darul Ehsan, Malaysia. Three replicates of each sample were investigated to eliminate error during sample collection and data preparation.

3. Results and Discussion

3.1. Morphological Identification

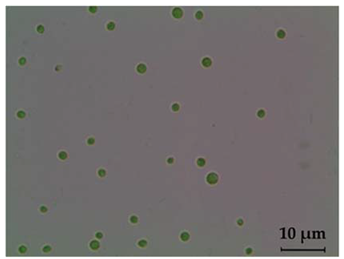
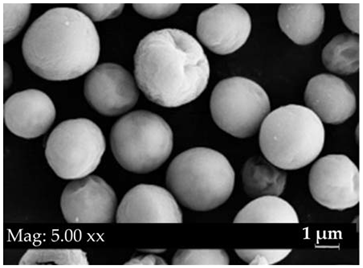
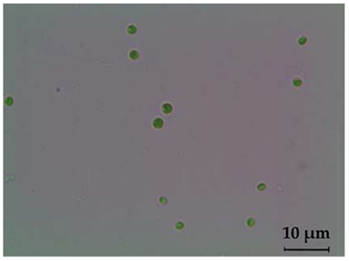
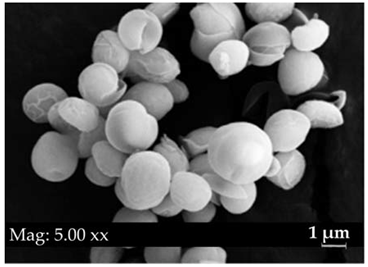
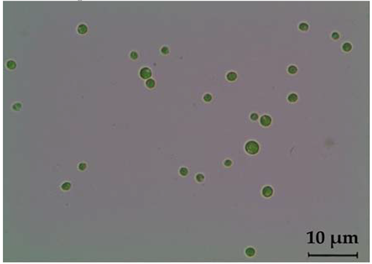
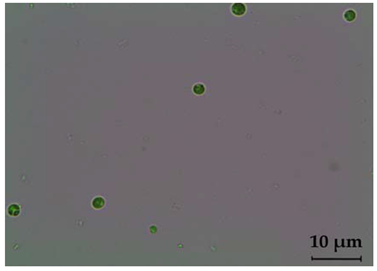
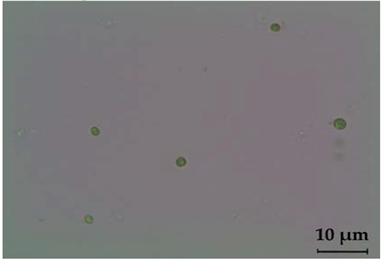
Three major green microalgal species were isolated from the pond. On BBM agar plates, colonies of all three strains were grass-green in colour. Under a light microscope, the morphological traits of these three strains were observed. Table 1 displays the images and morphological parameters of the three green microalgae. These three species of microalgae had green, unicellular cells. Thus, they are all Chlorophytes. Using the description and taxonomy key presented in Janse van Vuuren et al. (2006) [28], Huynh and Serediak (2006) [29], and Bellinger and Sigee (2005) [30], the microscopic properties of green microalgae cells were used to identify the organisms. The strains have been identified as Chlorococcum sp., Chlorella sp., and Scenedesmus sp., as summarised in Table 2.

3.2. Molecular Identification

DNA sequencing of 18 rRNA revealed 99–100% similarity of Chlorococcum sp., Chlorella sp., and Scenedesmus sp. with Chlorococcum oleofaciens, Chlorella sorokiniana, and Scenedesmus quadricauda, respectively. The obtained results showed that the polyphasic approach (combining morphological and molecular identifications) is a reliable tool for species confirmation.

3.3. Selection of Green Microalgae

In distinct dilutions of LABT-POME, the three main green microalgal species were acclimatised. Figure 2a–c illustrate the growth of Chlorococcum oleofaciens, Chlorella sorokiniana, and Scenedesmus quadricauda in 25%, 50%, and 75% dilutions of LABT-POME, respectively. In the culture sample containing 25% LABT-POME, all three green microalgae (C. oleofaciens, C. sorokiniana, and S. quadricauda) were able to grow. Prior to entering the stationary phase, the three green microalgae had maximum chlorophyll-a concentrations of 1717.17 µg/mL, 14.92 µg/mL, and 10.93 µg/mL, respectively. The specific growth rates of C. oleofaciens, C. sorokiniana, and S. quadricauda were 0.2720 d−1, 0.2160 d−1, and 0.2041 d−1, respectively.
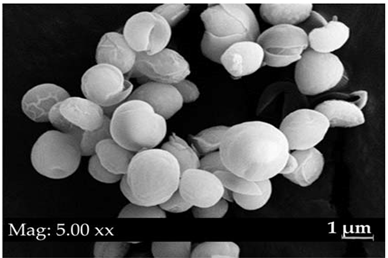
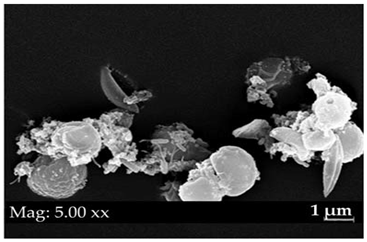
The specific growth rate of C. oleofaciens, C. sorokiniana, and S. quadricaudatus reduced when the amount of LABT-POME in the culture sample rose from 50% to 75%. C. oleofaciens exhibited the highest growth rate among the three microalgae in all POME sample dilutions. The results presented in Table 3 confirm this conclusion. Table 3 displays the surface morphology of green microalgae before and after growing in 75% of LABT-POME using a light microscope and a scanning electron microscope. Many dead cells were identified in C. sorokiniana and S. quadricauda samples after cultivation in LABT-POME. This suggests that their growth decreased as the LABT-POME dilution was decreased. As demonstrated in Table 4, the morphologies of green microalgae, particularly S. quadricauda, were altered after cultivation in LABT-POME.
Table 4 shows the 3-dimensional morphology of all three green microalgae observed under SEM, showing that the cells ruptured after cultivation in LABT-POME, particularly C. sorokiniana and S. quadricauda. The shape of C. oleofaciens, on the other hand, remained nearly unchanged from its original morphology. This indicates that it could withstand the harsh conditions in LABT-POME, as it grew at the fastest rate in all three POME dilutions when compared to the other two species. As a result, C. oleofaciens was chosen for further LABT-POME treatment without dilution.

3.4. Total Phosphorus (TP) Removal by Choloroccus oleofaciens from LABT-POME

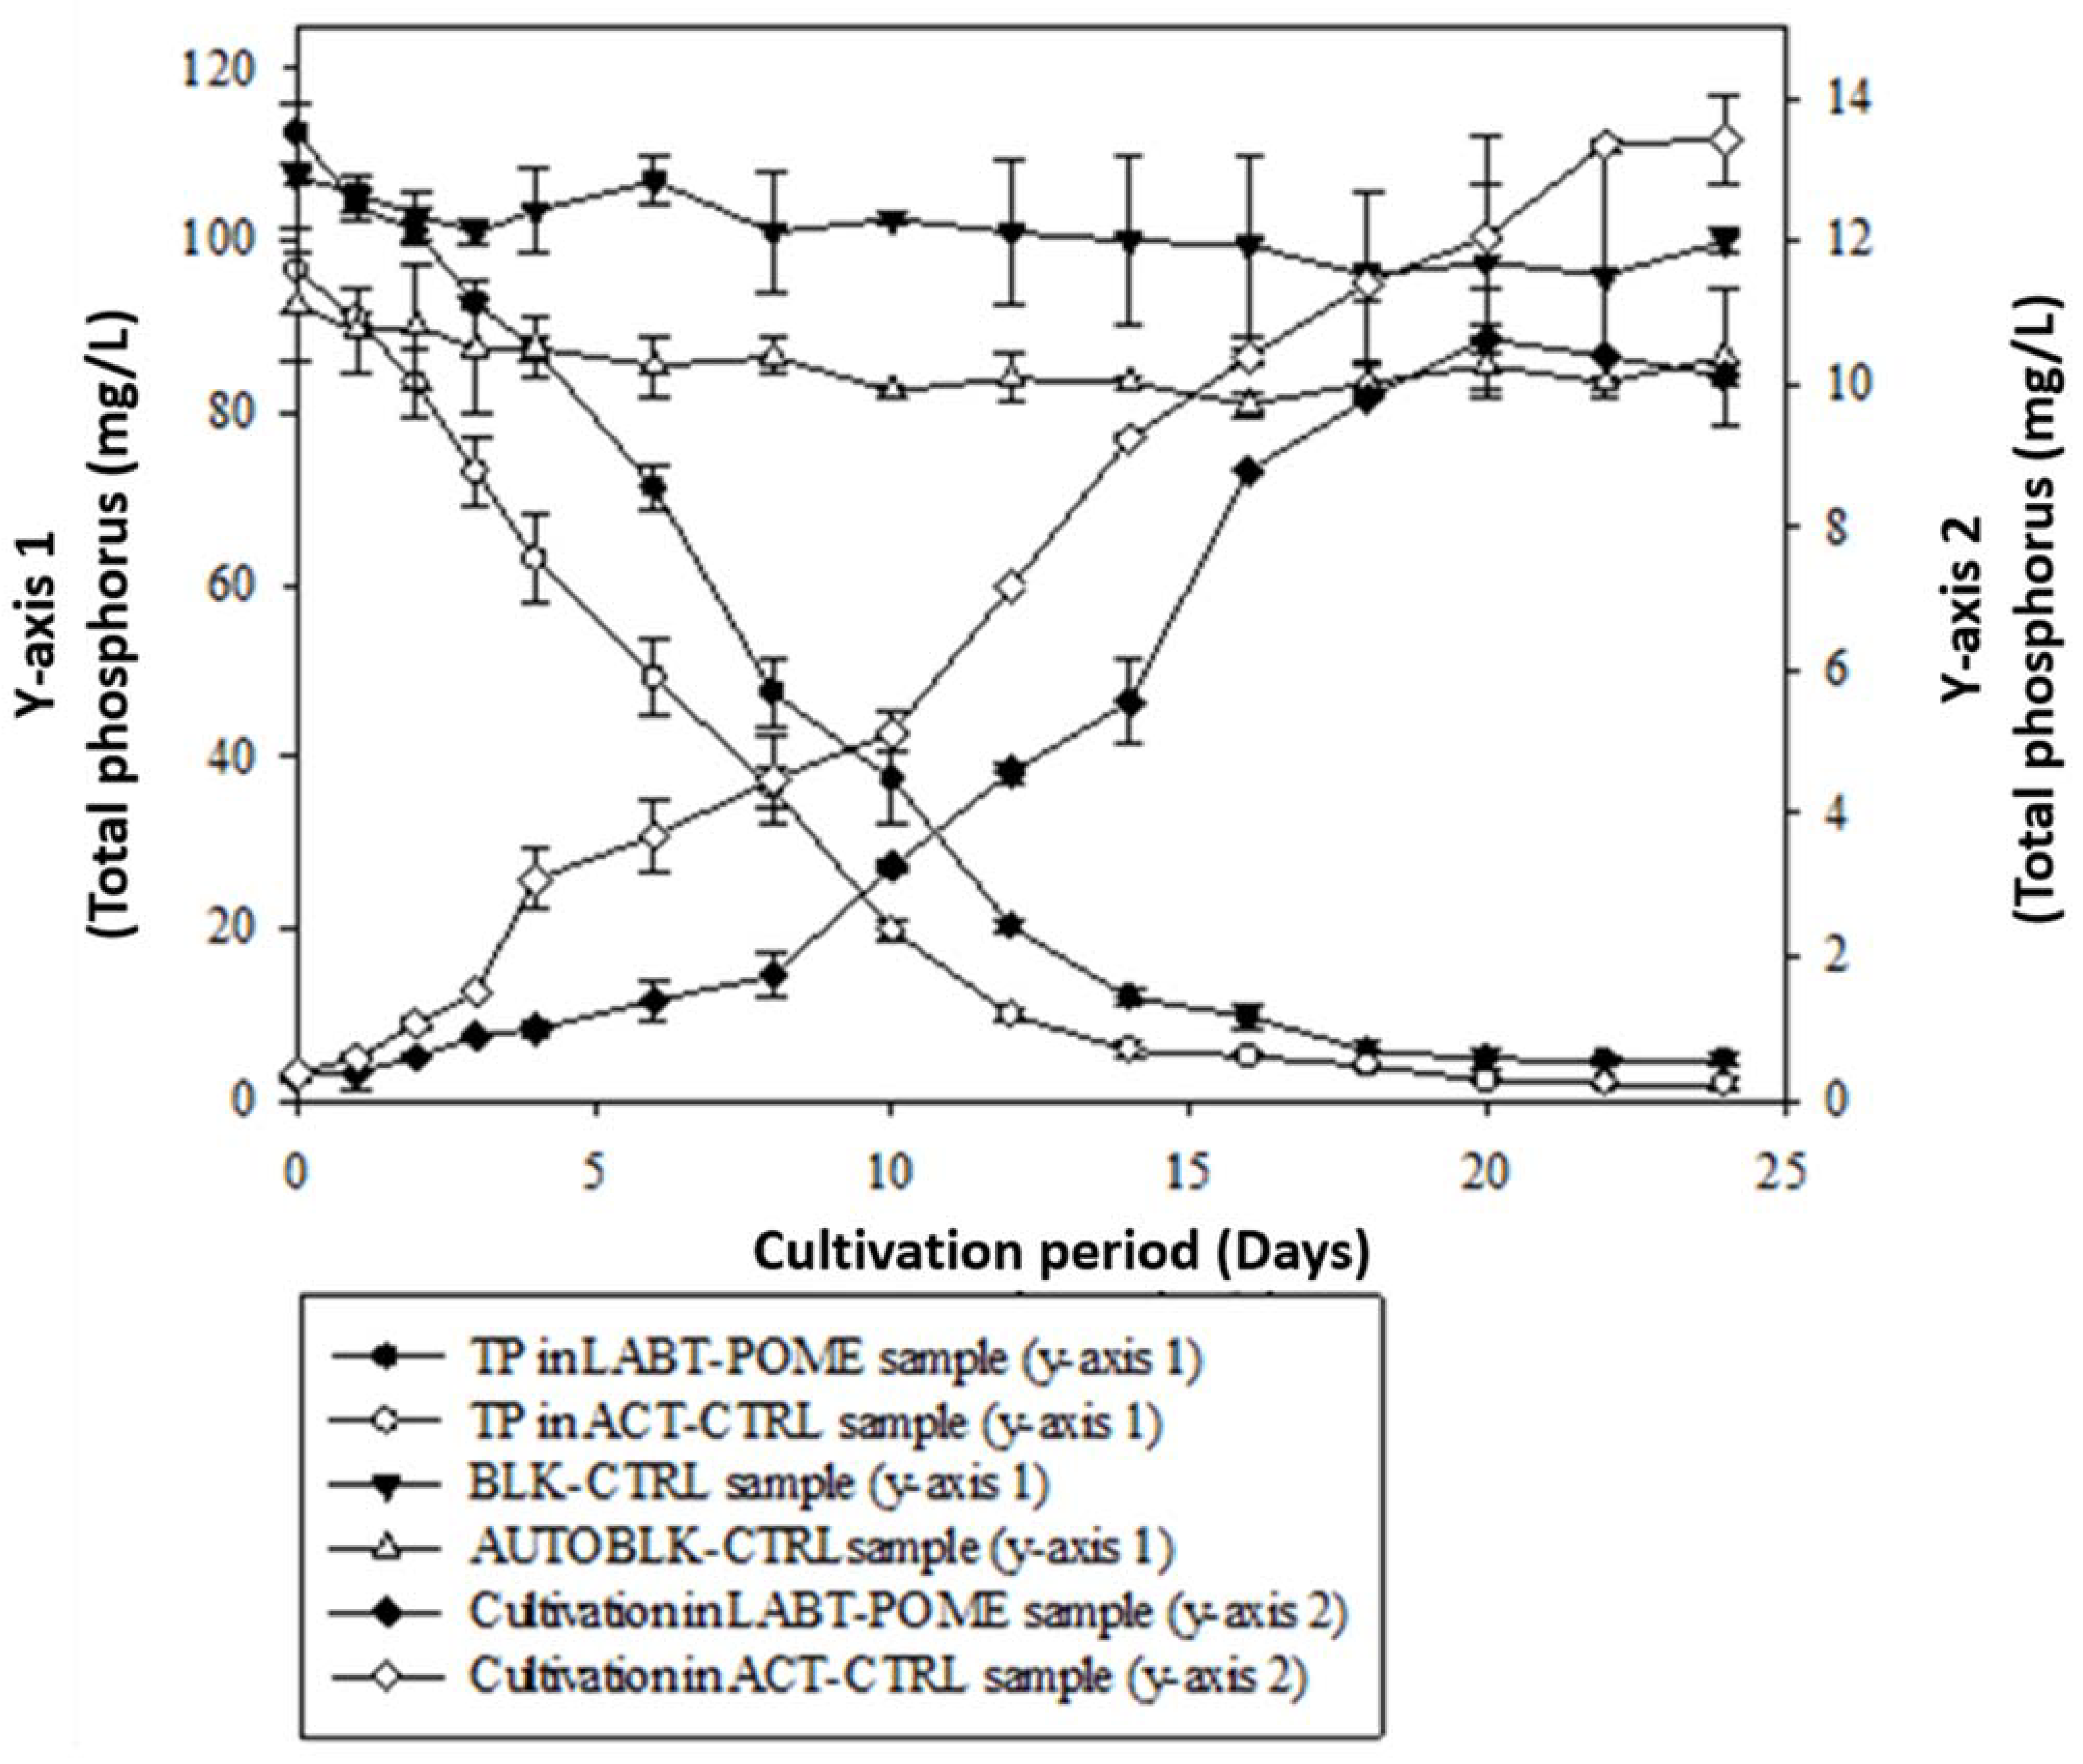
In the present study, the growth of microalgae was measured by chlorophyll-a concentration as opposed to cell number. The cell count was tried (data not shown), but it was not achievable due to the presence of suspended particulates in the POME. Throughout the next 24 days, Figure 3 depicts the average chlorophyll-a content of C. oleofaciens as well as the elimination of TP from LABT-POME. As shown in Figure 3, as the average chlorophyll-a content of C. oleofaciens increased, the TP of both LABT-POME and true control samples declined. Throughout the initial stages of cultivation, the TP concentration in both the actual control and LABT-POME samples declined steadily.
The average chlorophyll-a concentration curve demonstrated that C. oleofaciens grew slowly in the early stages of cultivation, which corresponded to a higher concentration of TP in the medium, indicating that TP uptake was slow. Between days 4 and 14, the concentration of TP decreased considerably in both the actual control and LABT-POME samples. During this period, C. oleofaciens grew exponentially. Consequently, the rate of TP absorption increased. The TP reached equilibrium after 14 days, when its stationary period commenced. C. oleofaciens eliminated 90–95% of TP from LABT-POME and actual control samples within the first 24 days of growth, which was close to the previous study on culture in dairy effluent on an outdoor bench scale, which eliminated 97.5% of TP [38]. Ding et al. [39] similarly reported 89.92 to 91.97 percent TP in an 8-day indoor lab-scale experiment employing microalgae and dairy effluent. Phosphorus is a critical ingredient for microalgal development and metabolism [40]. It is the skeletal structure of DNA. Its deficiency is one of the limiting variables of algal growth, and its abundance can lead to eutrophication; therefore, it is vital to remove the element from the water column of an ecosystem. At high pH levels, the elimination of TP could be triggered by the assimilation of algae or precipitation [41]. In this investigation, LABT-POME with a high pH value (8.5 to 9.5) removed the most TP.

3.5. Total Nitrogen (TN) Removal by Choloroccus oleofaciens from LABT-POME

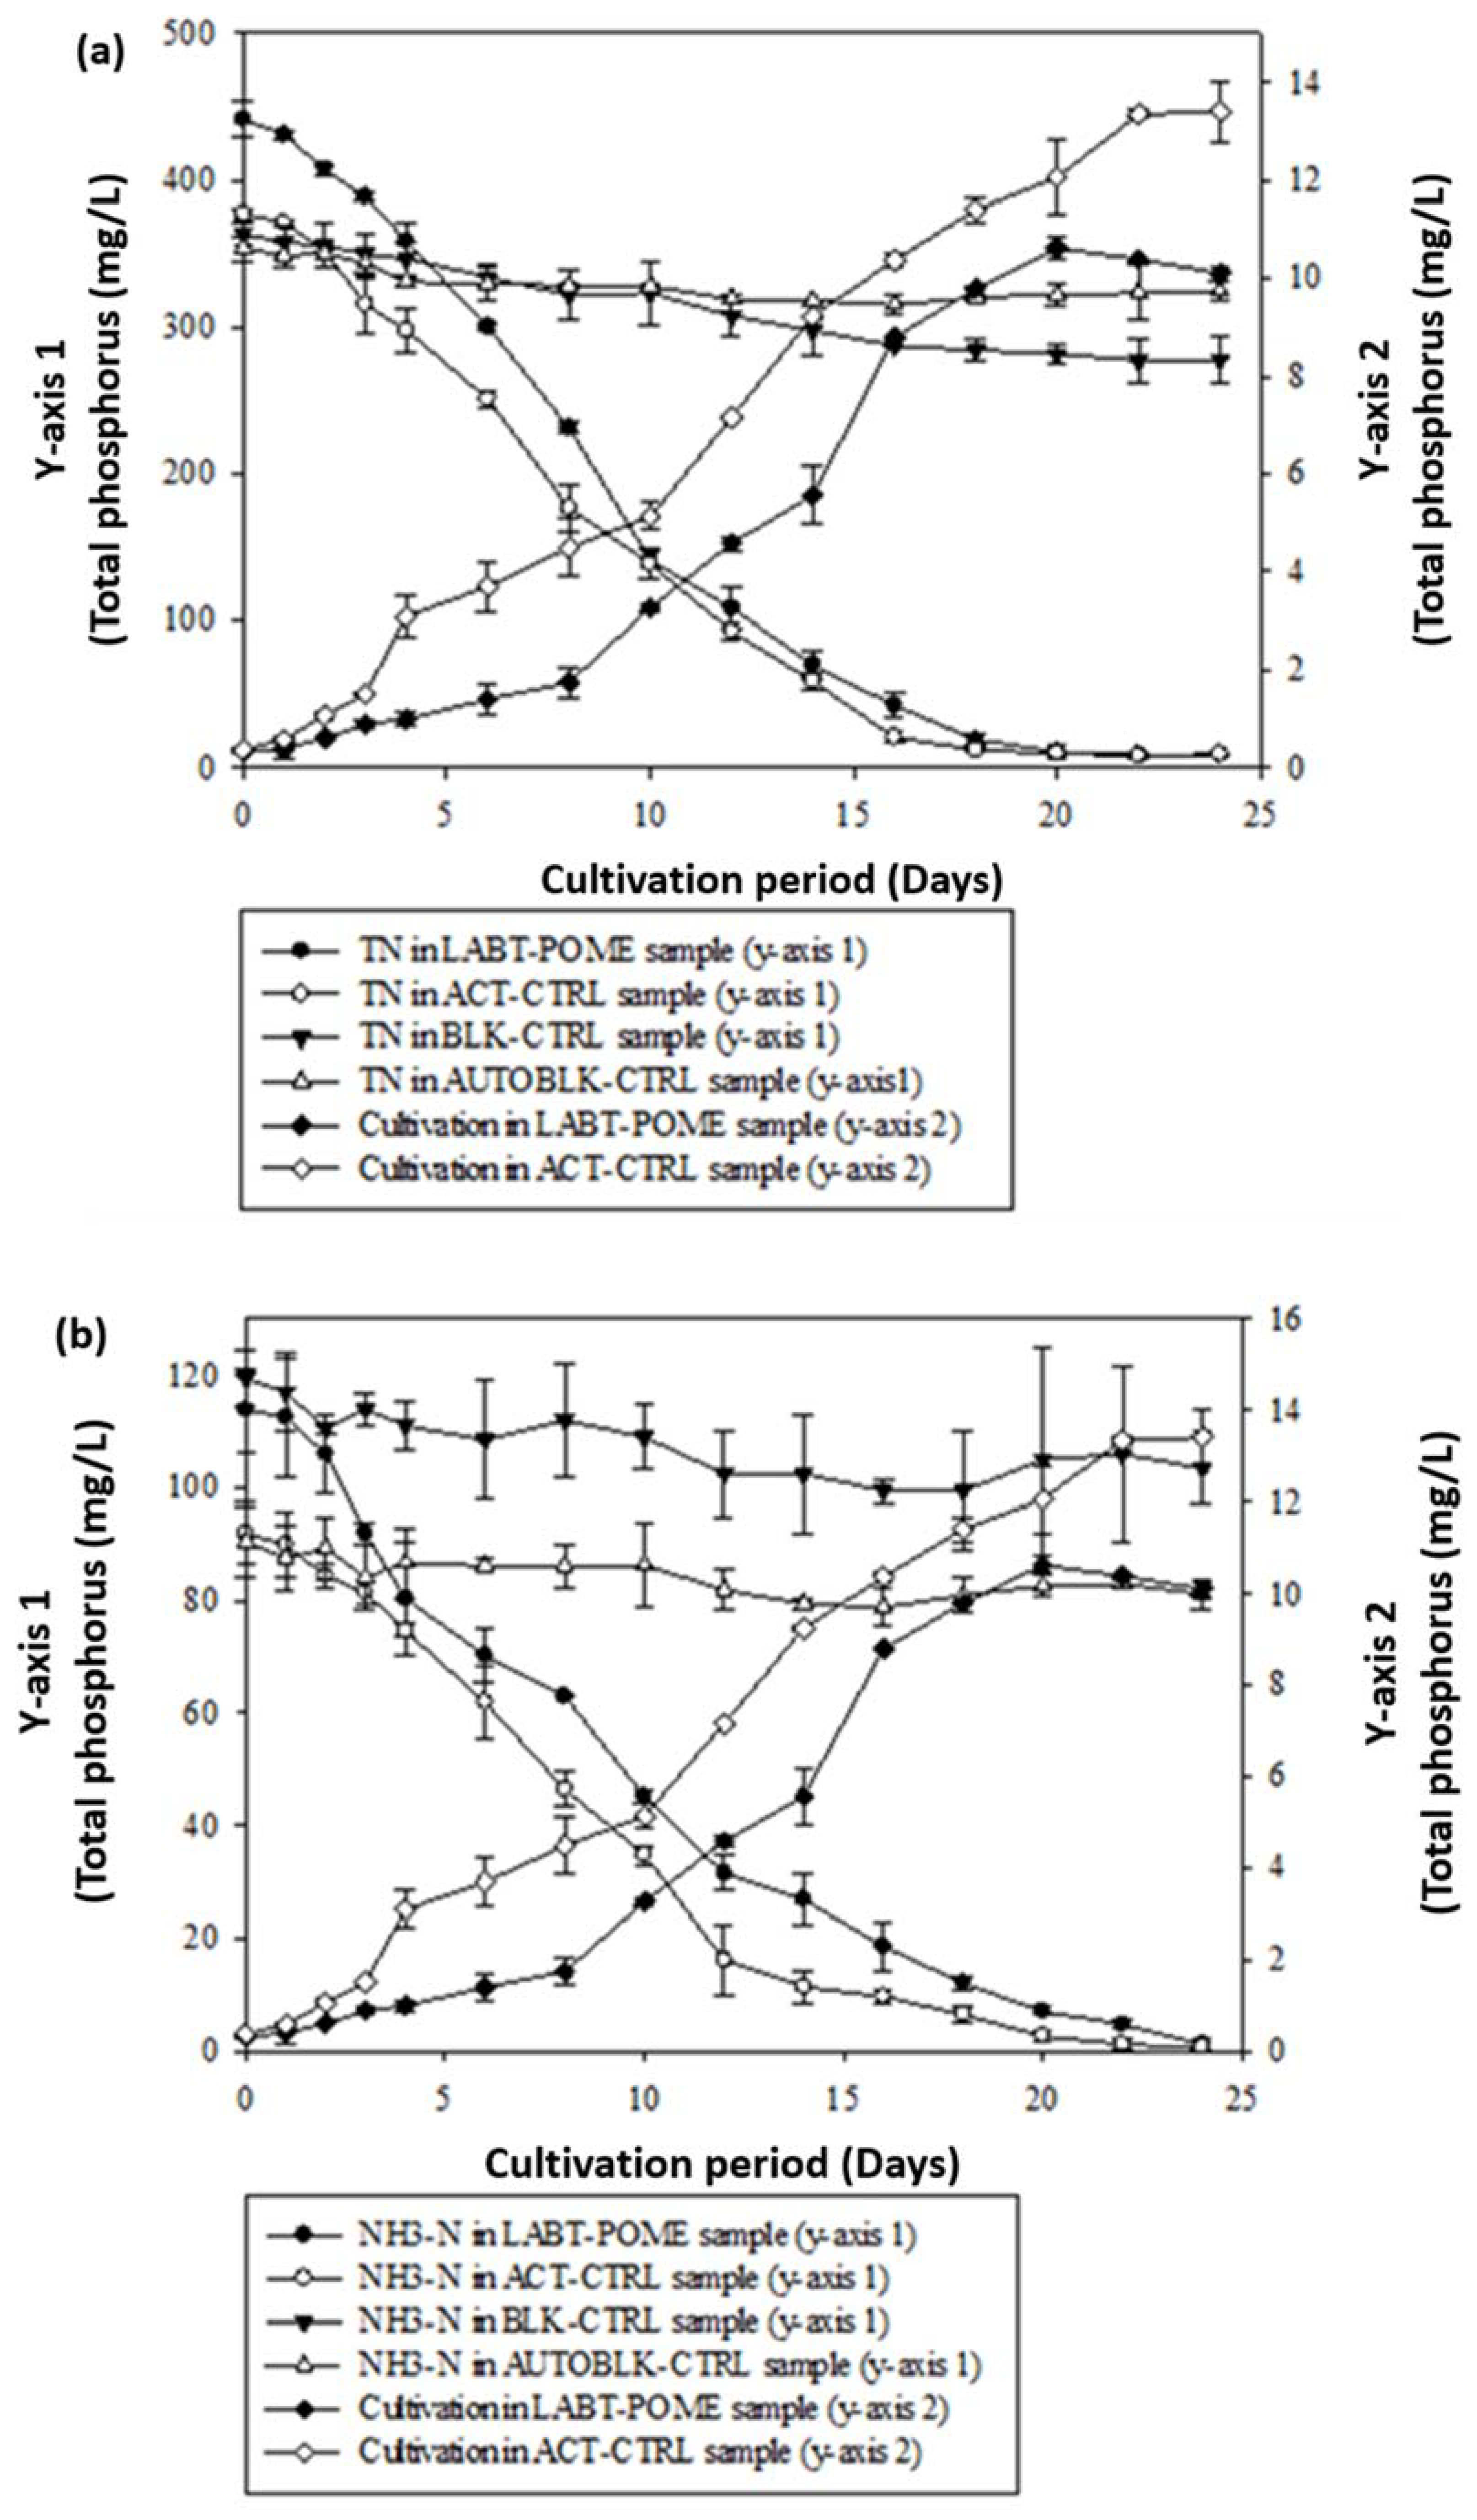
The TN removal curves in Figure 4a for C. oleofaciens exhibited a similar pattern as the ammonia nitrogen removal curves in Figure 4b. Within the first several days of cultivation, TN and ammonia nitrogen levels in the actual control and LABT-POME samples gradually fell, paralleling the growth of C. oleofaciens. TN and ammonia nitrogen declined significantly during the exponential growth phase of C. oleofaciens but remained constant on days 16 and 12, respectively. After 24 days of cultivation, C. oleofaciens eliminated more than 98% of TN and ammonia nitrogen from the LABT-POME. According to Ding et al. [39], Chlamydomonas sp. was also capable of removing 100 percent of the ammonia nitrogen from dairy farm wastewater. POME’s nitrogen sources consist of ammonia nitrogen and other organic materials that have not been digested by microbes during the anaerobic treatment procedure [42].
As demonstrated in Figure 4, the ammonia nitrogen removal in the LABT-POME sample required less time to attain equilibrium than the TN removal. Green microalgae can only assimilate inorganic nitrogen sources such as nitrite, nitrate, and ammonia, which require the least amount of energy for assimilation [12,40]. Nitrogen, one of the most critical elements for the digestion and metabolism of green microalgae, is present as both TN and ammonia [42]. It is the principal constituent of amino acids. It is typically removed from the water column because its presence can contribute to eutrophication.

3.6. Soluble Chemical Oxygen Demand (SCOD) Reduction from LABT-POME

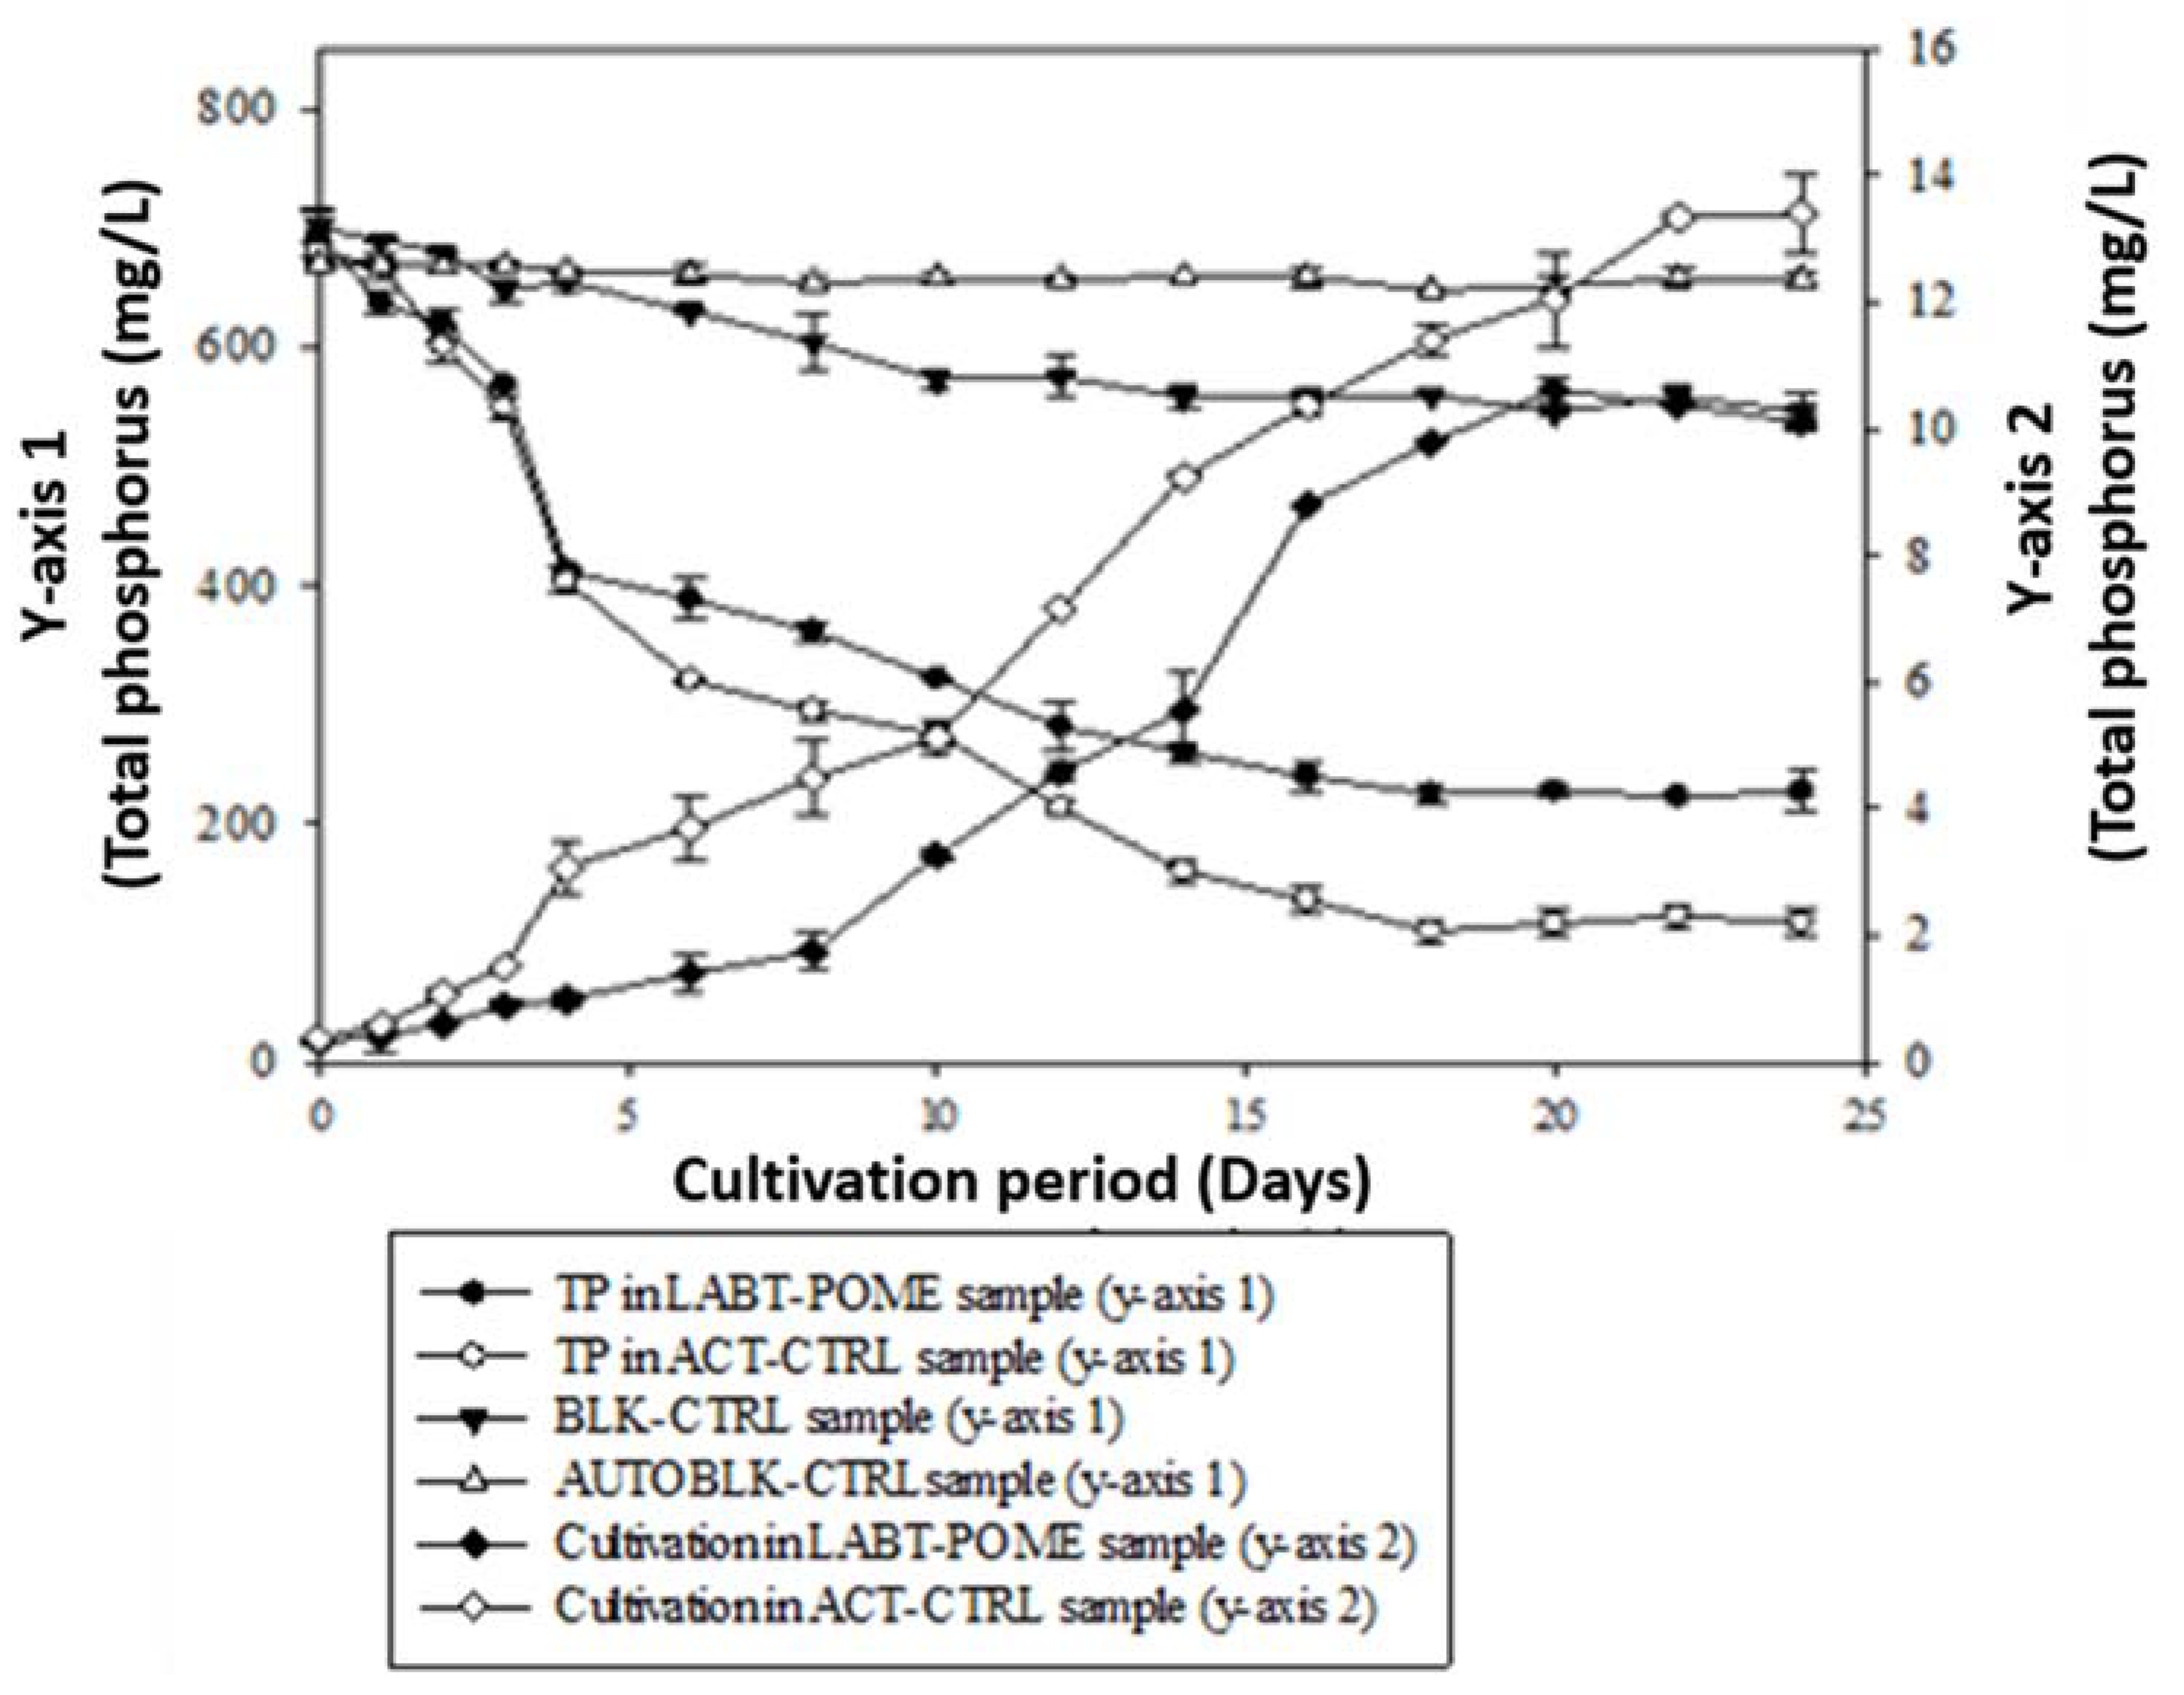
C. oleofaciens ability to remove SCOD from LABT-POME is depicted in Figure 5. When C. oleofaciens was cultivated, SCOD in both the control and LABT-POME samples dropped. On day 12, the curves stabilised for both the control and experimental samples. C. oleofaciens was able to lower SCOD by roughly 65% during 24 days of cultivation. This consumption of the organic material is indicative of LABT-heterotrophic POME’s growth. These results provide credence to the idea that C. oleofaciens is a mixotrophic green microalgae, capable of growth in both heterotrophic and photoautotrophic conditions. Microalgae have been demonstrated in numerous experiments to be capable of assimilating the organic carbons in POME, including acetate, that are left behind after anaerobic digestion. Studies show that COD can be reduced by 11–56.1 percent using C. sorokiniana in various POME dilutions, confirming these claims [22]. Chlamydomonas sp. UKM 06 was also employed by [12] to reduce COD by 8.59–29.13 percentage points from POME solutions of 12.5% and 16.7–25% in just 9 days of incubation.

3.7. Microalgae Growth Kinetic Study

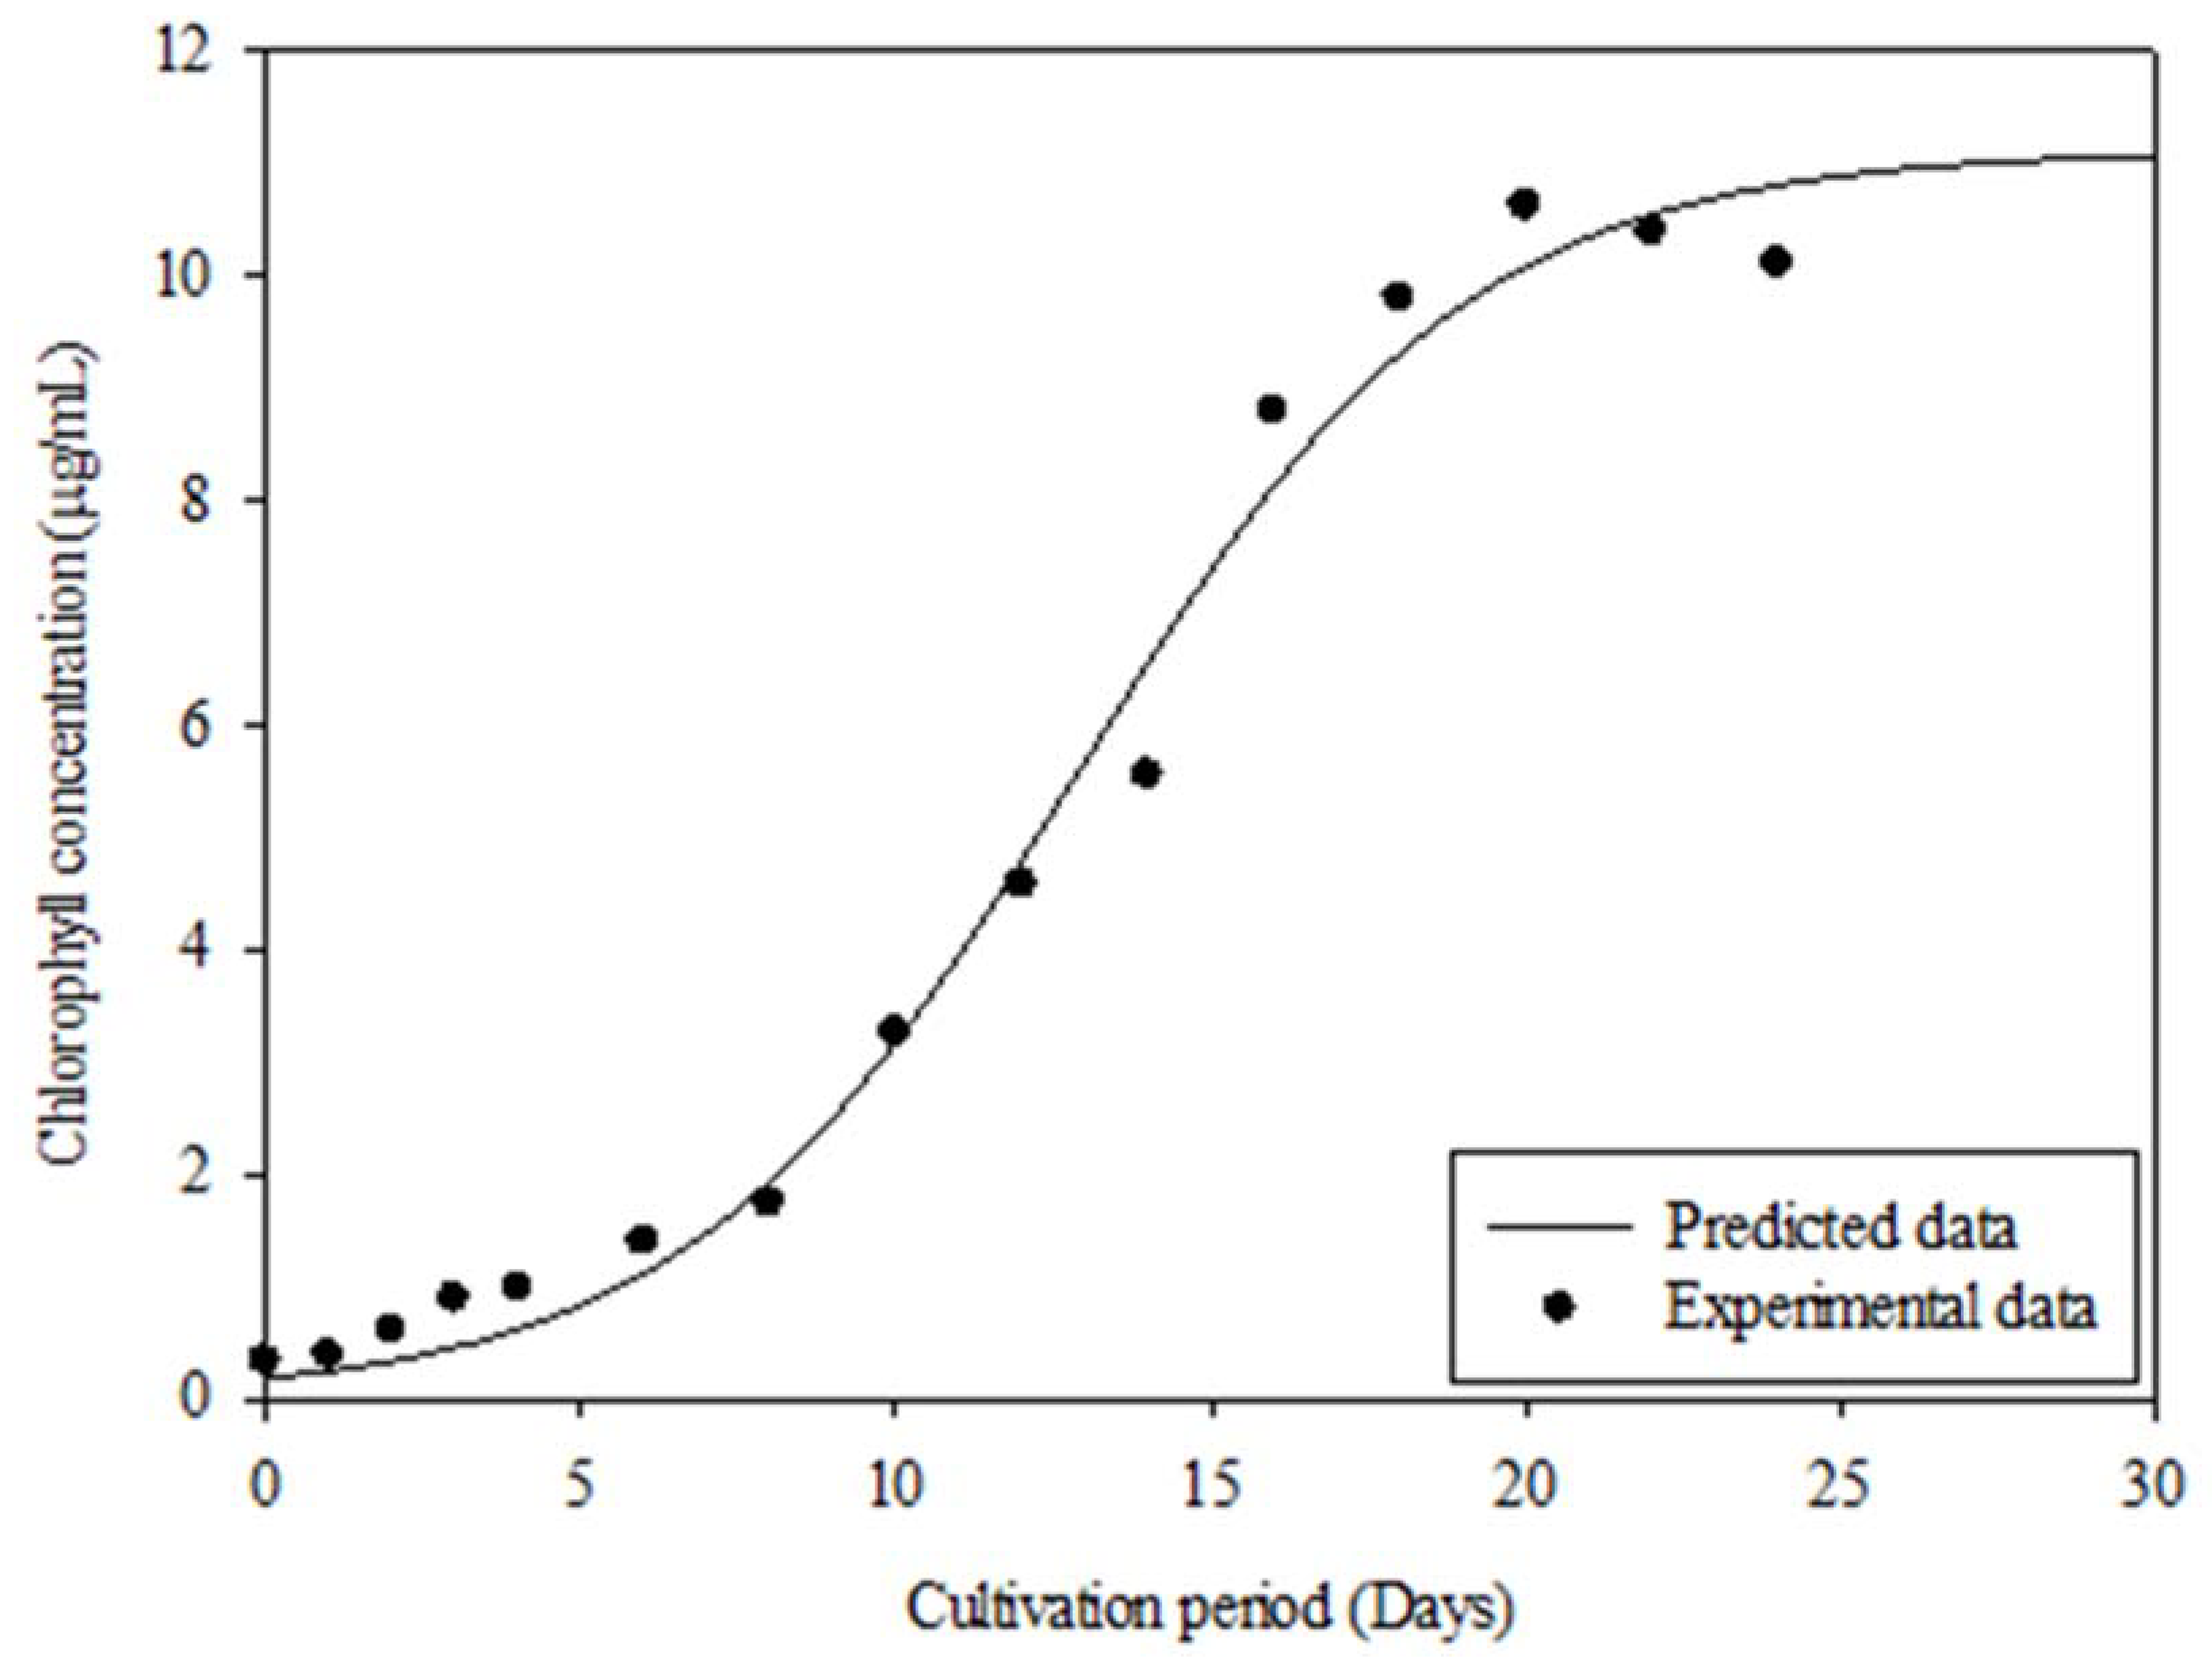
C. oleofaciens growth was modelled using a Verhulst logistic equation and the data was visualised using SIGMAPLOT® 12.5. Table 5 displays the obtained coefficients for the kinetic model. In Figure 6, we see the curves that result from applying the Verhulst logistic model to the data. A p-value of less than 0.05 and an R2 value of 0.99 were found to be associated with C. oleofaciens’ expansion. Consequently, the Verhulst logistic model was validated as a good fit for characterising C. oleofaciens development. The growth of the microalgae is similarly well-fitted with the Verhulst logistic model, which is consistent with previous findings [43]. C. oleofaciens in LABT-POME grew at a rate of 0.32 d−1, and its highest chlorophyll-a concentration was Xm (11.11 µg/mL) when the culture was at rest.

4. Conclusions

Compared to the C. sorokiniana and S. quadricauda strains, C. oleofaciens adapted well in LABT-POME. The growth of C. oleofaciens was well fitted with the Verhulst kinetics model with an R2 value of 0.99 and obtained the highest growth rate of 0.32 d−1. It can be used in industry for more POME treatment because it performed well in the removal of nutrients TP, TN, and ammonia nitrogen and reduced SCOD by 90–95%, 98%, 98%, and 65%, respectively. The current studies findings indicate that C. oleofaciens can be used to remove nutrients and organic matter from POME. Cultivation of this strain in POME treatment ponds is easy, straightforward, and can be used as an environmentally friendly method to solve the issue of greenhouse gas emissions. In addition, research highlights the low-cost treatment potential of green microalgae for POME and other wastewaters, and the biomass of microalgae growth in POME has the potential to be a significant source of biofuel. Another benefit of microalgae is that they can be grown on non-agricultural soil. Using microalgae to cure POME can also aid in reducing BOD and COD, which can aid in pollution prevention.

Author Contributions

Conceptualisation, K.A.T., J.L., N.I. and W.M.W.O.; writing—original draft preparation, K.A.T.; writing—review and editing, J.L., D.W., S.M.W., M.R.S., M.A. and M.R.; supervision, J.L., N.I., W.M.W.O. and M.R.; funding acquisition, J.L. and M.R. All authors have read and agreed to the published version of the manuscript.

Funding

The authors are grateful to the Researchers Supporting Project Number (RSP2022R448), King Saud University, Riyadh, Saudi Arabia.

Institutional Review Board Statement

Not applicable.

Informed Consent Statement

Not applicable.

Data Availability Statement

The authors confirm that the data supporting the findings of this research are available within the article.

Acknowledgments

The authors gratefully acknowledge financial support from Universiti Sains Malaysia in the form of Research University Grant No. 1001/PTEKIND/811291. The authors are grateful to the Researchers Supporting Project Number (RSP2022R448), King Saud University, Riyadh, Saudi Arabia.

Conflicts of Interest

The authors declare no conflict of interest.

References

  1. Ng, F.L.; Phang, S.-M.; Thong, C.-H.; Periasamy, V.; Pindah, J.; Yunus, K.; Fisher, A.C. Integration of bioelectricity generation from algal biophotovoltaic (BPV) devices with remediation of palm oil mill effluent (POME) as substrate for algal growth. Environ. Technol. Innov. 2021, 21, 101280. [Google Scholar] [CrossRef]
  2. Hariz, H.B.; Takriff, M.S.; Yasin, N.H.M.; Ba-Abbad, M.M.; Hakimi, N.I.N.M. Potential of the microalgae-based integrated wastewater treatment and CO2 fixation system to treat Palm Oil Mill Effluent (POME) by indigenous microalgae; Scenedesmus sp. and Chlorella sp. J. Water Process Eng. 2019, 32, 100907. [Google Scholar] [CrossRef]
  3. Udaiyappan, A.F.M.; Hasan, H.A.; Takriff, M.S.; Abdullah, S.R.S.; Maeda, T.; Mustapha, N.A.; Mohd Yasin, N.; Nazashida Mohd Hakimi, N.I. Microalgae-bacteria interaction in palm oil mill effluent treatment. J. Water Process Eng. 2020, 35, 101203. [Google Scholar] [CrossRef]
  4. Muzzammil, N.; Loh, S.K. Pilot scale integrated anaerobic-aerobic treatment of palm oil mill effluent. J. Oil Palm Res. 2020, 32, 286–293. [Google Scholar] [CrossRef]
  5. Japar, A.S.; Takriff, M.S.; Yasin, N.H.M. Microalgae acclimatization in industrial wastewater and its effect on growth and primary metabolite composition. Algal Res. 2021, 53, 102163. [Google Scholar] [CrossRef]
  6. Yeesang, C.; Cheirsilp, B. Effect of nitrogen, salt, and iron content in the growth medium and light intensity on lipid production by microalgae isolated from freshwater sources in Thailand. Bioresour. Technol. 2011, 102, 3034–3040. [Google Scholar] [CrossRef]
  7. Kumar, K.; Dasgupta, C.N.; Das, D. Cell growth kinetics of Chlorella sorokiniana and nutritional values of its biomass. Bioresour. Technol. 2014, 167, 358–366. [Google Scholar] [CrossRef]
  8. Kamyab, H.; Chelliapan, S.; Lee, C.T.; Khademi, T.; Kumar, A.; Yadav, K.K.; Rezania, S.; Kumar, S.; Ebrahimi, S.S. Improved production of lipid contents by cultivating Chlorella pyrenoidosa in heterogeneous organic substrates. Clean Technol. Environ. Policy 2019, 21, 1969–1978. [Google Scholar] [CrossRef]
  9. Gómez, M.A.; González-López, J.; Hontoria-García, E. Influence of carbon source on nitrate removal of contaminated groundwater in a denitrifying submerged filter. J. Hazard. Mater. 2000, 80, 69–80. [Google Scholar] [CrossRef]
  10. Fadiran, A.O.; Dlamini, S.C.; Mavuso, A. A comparative study of the phosphate levels in some surface and ground water bodies of Swaziland. Bull. Chem. Soc. Ethiop. 2008, 22, 197–206. [Google Scholar] [CrossRef]
  11. Yadav, K.K.; Gupta, N.; Kumar, A.; Reece, L.M.; Singh, N.; Rezania, S.; Khan, S.A. Mechanistic understanding and holistic approach of phytoremediation: A review on application and future prospects. Ecol. Eng. 2018, 120, 274–298. [Google Scholar] [CrossRef]
  12. Ding, G.T.; Yasin, N.H.M.; Takriff, M.S.; Kamarudin, K.F.; Salihon, J.; Yaakob, Z.; Hakimi, N.I.N.M. Phycoremediation of palm oil mill effluent (POME) and CO2 fixation by locally isolated microalgae: Chlorella sorokiniana UKM2, Coelastrella sp. UKM4 and Chlorella pyrenoidosa UKM7. J. Water Process Eng. 2020, 35, 101202. [Google Scholar] [CrossRef]
  13. Low, S.S.; Bong, K.; Mubashir, M.; Cheng, C.; Lam, M.; Lim, J.; Ho, Y.; Lee, K.; Munawaroh, H.; Show, P. Microalgae cultivation in palm oil mill effluent (Pome) treatment and biofuel production. Sustainability 2021, 13, 3247. [Google Scholar] [CrossRef]
  14. Cheng, Y.W.; Chong, C.C.; Lam, M.K.; Ayoub, M.; Cheng, C.K.; Lim, J.W.; Yusup, S.; Tang, Y.; Bai, J. Holistic process evaluation of non-conventional palm oil mill effluent (POME) treatment technologies: A conceptual and comparative review. J. Hazard. Mater. 2021, 409, 124964. [Google Scholar] [CrossRef] [PubMed]
  15. Saidu, H.; Salau, O. Investigating the effect of several Palm Oil Mill Effluent (POME) dilutions on biomass and specific growth rate of C. sorokiniana. Int. J. Life Sci. Biotechnol. 2021, 4, 192–203. [Google Scholar] [CrossRef]
  16. Shahid, A.; Malik, S.; Zhu, H.; Xu, J.; Nawaz, M.Z.; Nawaz, S.; Alam, A.; Mehmood, M.A. Cultivating microalgae in wastewater for biomass production, pollutant removal, and atmospheric carbon mitigation; a review. Sci. Total Environ. 2020, 704, 135303. [Google Scholar] [CrossRef]
  17. Qiu, Y.; Zu, Y.; Song, C.; Xie, M.; Qi, Y.; Kansha, Y.; Kitamura, Y. Soybean processing wastewater purification via Chlorella L166 and L38 with potential value-added ingredients production. Bioresour. Technol. Rep. 2019, 7, 100195. [Google Scholar] [CrossRef]
  18. Liyanage, L.M.M.; Lakmali, W.G.M.; Athukorala, S.N.P.; Jayasundera, K.B. Application of live Chlorococcum aquaticum biomass for the removal of Pb(II) from aqueous solutions. J. Appl. Phycol. 2020, 32, 4069–4080. [Google Scholar] [CrossRef]
  19. Apandi, N.; Mohamed, R.M.S.R.; Al-Gheethi, A.; Gani, P.; Ibrahim, A.; Kassim, A.H.M. Scenedesmus Biomass Productivity and Nutrient Removal from Wet Market Wastewater, A Bio-kinetic Study. Waste Biomass Valorization 2019, 10, 2783–2800. [Google Scholar] [CrossRef]
  20. Emparan, Q.; Harun, R.; Kodiappan, J.A. Effect of microalgae-to-palm oil mill effluent (POME) ratio for rapid effective pollutants removal and biomass production. Desalin. Water Treat. 2020, 198, 119–125. [Google Scholar] [CrossRef]
  21. Lee, Z.S.; Chin, S.Y.; Lim, J.W.; Witoon, T.; Cheng, C.K. Treatment technologies of palm oil mill effluent (POME)and olive mill wastewater (OMW): A brief review. Environ. Technol. Innov. 2019, 15, 100377. [Google Scholar] [CrossRef]
  22. Saidu, H.; Jamaluddin, H.; Mohamad, S.E. Nutrient Removal and Biokinetic Study of Freshwater Microalgae in Palm Oil Mill Effluent (POME). Indian J. Sci. Technol. 2017, 10, 1–10. [Google Scholar] [CrossRef] [Green Version]
  23. Cheah, W.Y.; Show, P.L.; Juan, J.C.; Chang, J.; Ling, T.C. Microalgae cultivation in palm oil mill effluent (POME) for lipid production and pollutants removal. Energy Convers. Manag. 2018, 174, 430–438. [Google Scholar] [CrossRef]
  24. Jasni, J.; Arisht, S.N.; Yasin, N.H.M.; Abdul, P.M.; Lin, S.-K.; Liu, C.-M.; Wu, S.-Y.; Jahim, J.; Takriff, M.S. Comparative toxicity effect of organic and inorganic substances in palm oil mill effluent (POME) using native microalgae species. J. Water Process Eng. 2020, 34, 101165. [Google Scholar] [CrossRef]
  25. Tan, K.A.; Lalung, J.; Morad, N.; Ismail, N.; Wan Omar, W.M.; Khan, M.A.; Sillanpää, M.; Rafatullah, M. Post-Treatment of Palm Oil Mill Effluent Using Immobilised Green Microalgae Chlorococcum oleofaciens. Sustainability 2021, 13, 11562. [Google Scholar] [CrossRef]
  26. Barsanti, L.; Gualtieri, P. Algae: Anatomy Biochemistry, and Biotechnology; CRC Press: Boca Raton, FL, USA, 2006. [Google Scholar]
  27. Nichols, H.W.; Bold, H.C. Trichosarcinapolymorpha Gen. et sp. nov. J. Phycol. 1965, 1, 34–38. [Google Scholar] [CrossRef]
  28. van Vuuren, S.J.; Taylor, J.; van Ginkel, C.; Gerber, A. A Guide for the Identification of Algae in South African Freshwaters; no. November; North-West University: Potchefstroom, South Africa, 2006. [Google Scholar]
  29. Huynh, M.; Serediak, N. Algae Identification Field Guid; Agriculture and Agri-food: Ottawa, ON, Canada, 2006. [Google Scholar]
  30. Bellinger, E.G.; Sigee, D.C. Freshwater Algae: Identification, Enumeration and Use as Bioindicators; Wiley-Blackwell: Hoboken, NJ, USA, 2015. [Google Scholar]
  31. Fiera, C. Detection of food in the gut content of Heteromurusnitidus (Hexapoda:Collembola) by DNA/PCR-based molecular analysis. North-West. J. Zool. 2014, 10, 67–73. [Google Scholar]
  32. Flores, E.; Herrero, A. Nitrogen assimilation and nitrogen control in cyanobacteria. Biochem. Soc. Trans. 2005, 33, 164–167. [Google Scholar] [CrossRef]
  33. Gour, R.S.; Chawla, A.; Singh, H.; Chauhan, R.S.; Kant, A. Characterisation and Screening of Native Scenedesmus sp. Isolates Suitable for Biofuel Feedstock. PLoS ONE 2016, 11, e0155321. [Google Scholar] [CrossRef]
  34. Ritchie, R.J. Consistent sets of spectrophotometric chlorophyll equations for acetone, methanol and ethanol solvents. Photosynth. Res. 2006, 89, 27–41. [Google Scholar] [CrossRef]
  35. Delgadillo-Mirquez, L.; Lopes, F.; Taidi, B.; Pareau, D. Nitrogen and phosphate removal from wastewater with a mixed microalgae and bacteria culture. Biotechnol. Rep. 2016, 11, 18–26. [Google Scholar] [CrossRef] [PubMed]
  36. Ermis, H.; Altinbas, M. Determination of biokinetic coefficients for nutrient removal from anaerobic liquid digestate by mixed microalgae. J. Appl. Phycol. 2019, 31, 1773–1781. [Google Scholar] [CrossRef]
  37. Peleg, M.; Corradini, M.G.; Normand, M.D. The logistic (Verhulst) model for sigmoid microbial growth curves revisited. Food Res. Int. 2007, 40, 808–818. [Google Scholar] [CrossRef]
  38. Huo, S.; Wang, Z.; Zhu, S.; Zhou, W.; Dong, R.; Yuan, Z. Cultivation of Chlorella zofingiensis in bench-scale outdoor ponds by regulation of pH using dairy wastewater in winter, South China. Bioresour. Technol. 2012, 121, 76–82. [Google Scholar] [CrossRef]
  39. Ding, J.; Zhao, F.; Cao, Y.; Xing, L.; Liu, W.; Mei, S.; Li, S. Cultivation of Microalgae in Dairy Farm Wastewater without Sterilisation. Int. J. Phytoremediation 2015, 17, 222–227. [Google Scholar] [CrossRef]
  40. Cai, T.; Park, S.Y.; Li, Y. Nutrient recovery from wastewater streams by microalgae: Status and prospects. Renew. Sustain. Energy Rev. 2013, 19, 360–369. [Google Scholar] [CrossRef]
  41. Zhou, W.; Li, Y.; Min, M.; Hu, B.; Zhang, H.; Ma, X.; Li, L.; Cheng, Y.; Chen, P.; Ruan, R. Growing wastewater-born microalga Auxenochlorella protothecoides UMN280 on concentrated municipal wastewater for simultaneous nutrient removal and energy feedstock production. Appl. Energy 2012, 98, 433–440. [Google Scholar] [CrossRef]
  42. Jin, H.F.; Lim, B.R.; Lee, K. Influence of nitrate feeding on carbon dioxide fixation by microalgae. J. Environ. Sci. Health-Part A Toxic/Hazard. Subst. Environ. Eng. 2006, 41, 2813–2824. [Google Scholar] [CrossRef]
  43. Azmi, A.S.; Aziz, N.A.C.; Puad, N.I.M.; Halim, A.A.; Yusof, F.; Yusup, S. Chlorella vulgaris logistic growth kinetics model in high concentrations of aqueous ammonia. IIUM Eng. J. 2018, 19, 1–9. [Google Scholar] [CrossRef]
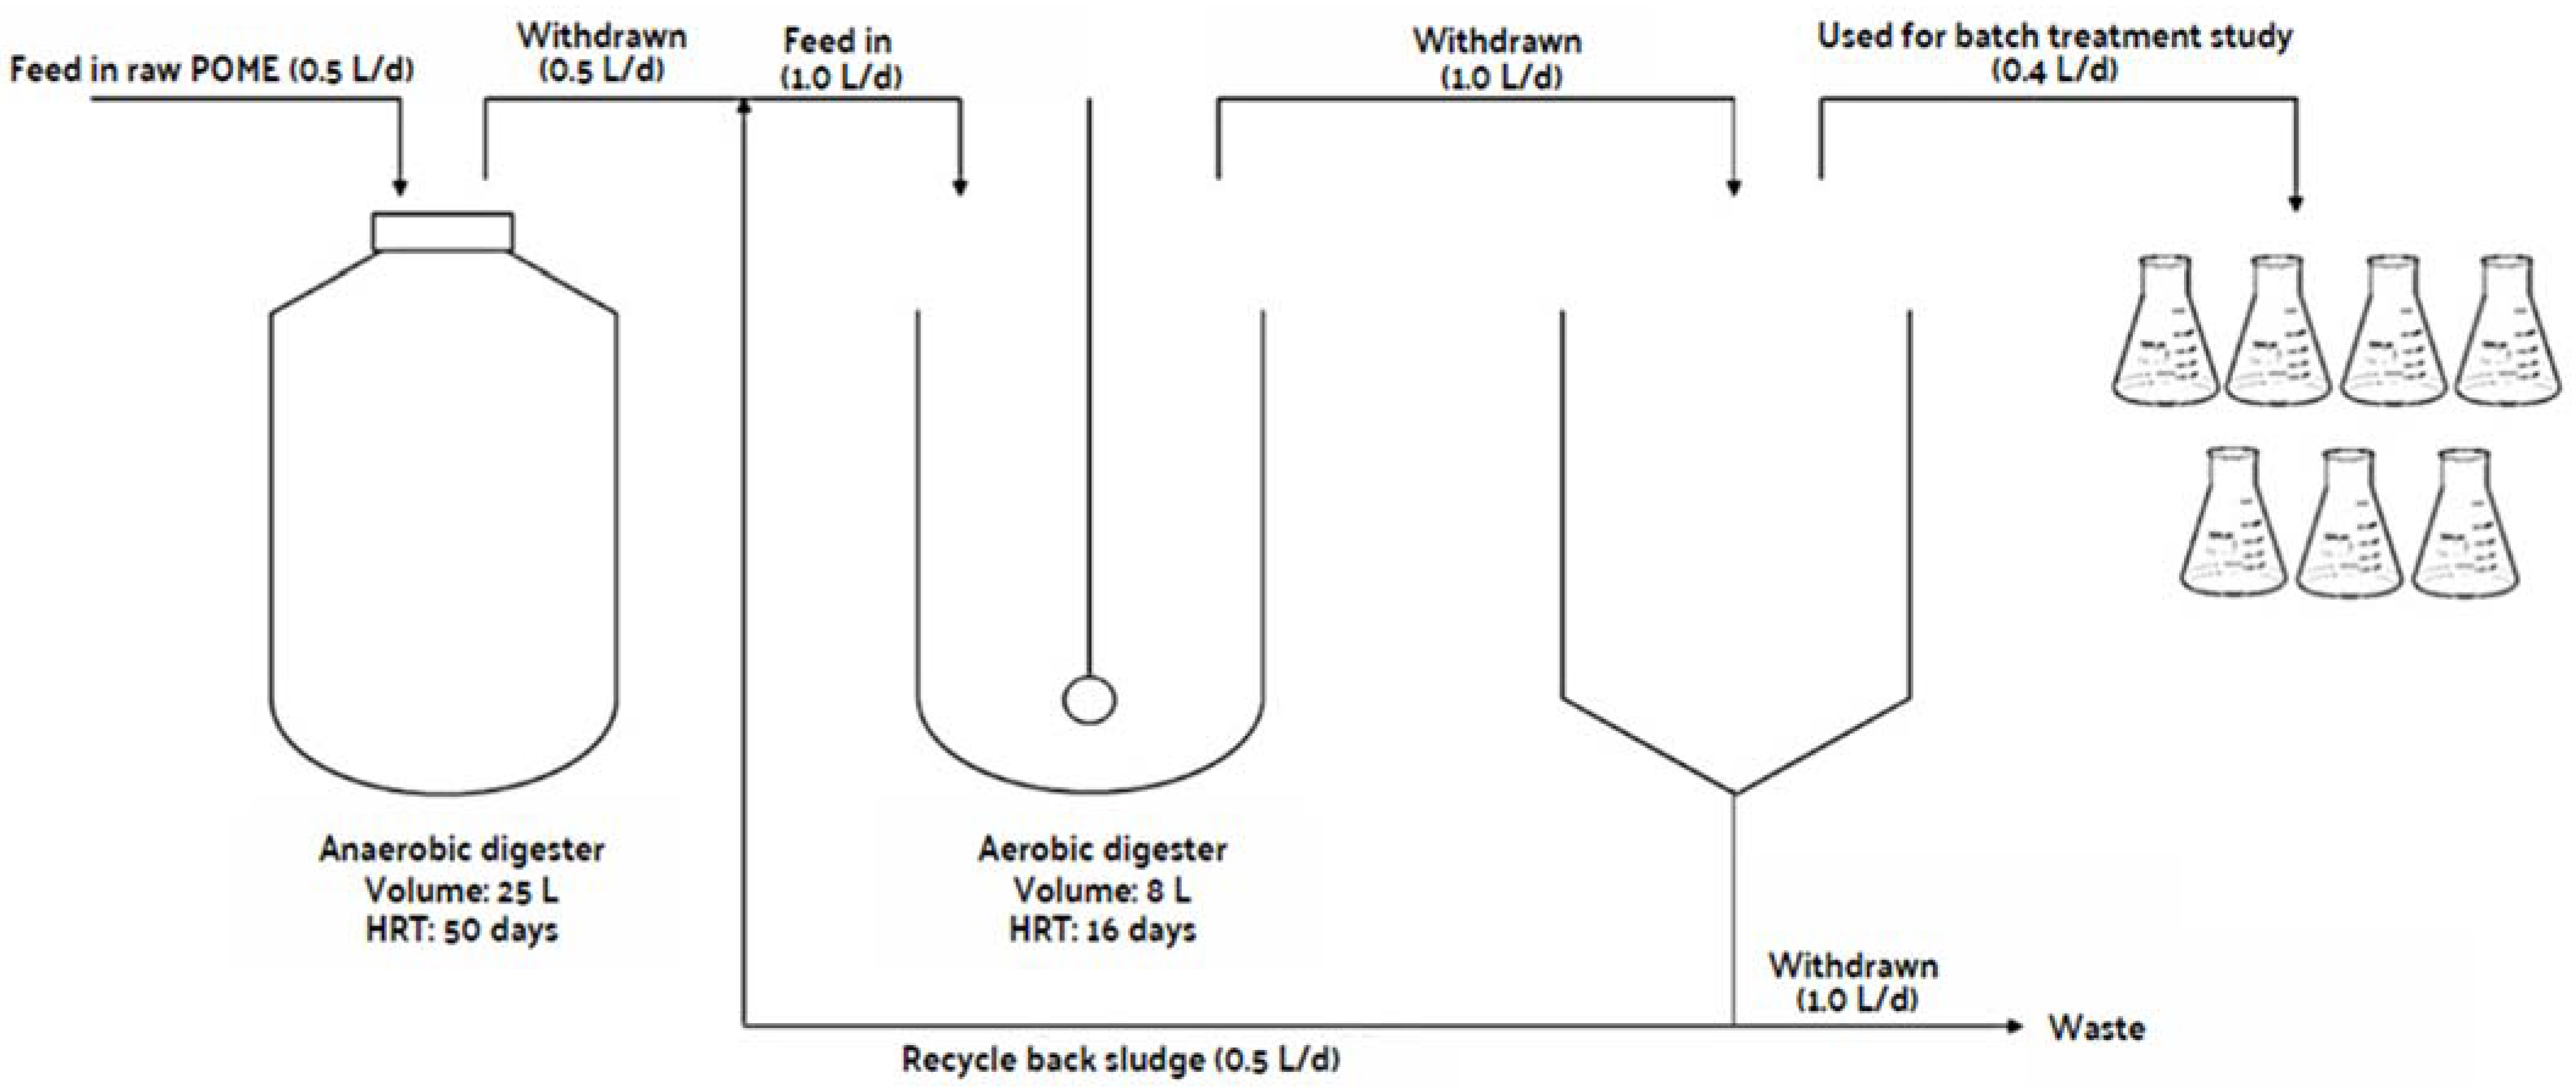
Figure 1. Lab-scale pre-treatment process of raw POME.
Fermentation 08 00658 g001
Figure 2. Growth profile of Chlorococcum oleofaciens, Chlorella sorokiniana, and Scenedesmus quadricauda over 16 days in (a) 25%, (b) 50%, and (c) 75% dilution of LAB-POME.
Fermentation 08 00658 g002
Figure 3. Phosphorus (TP) removal from LABT-POME by Chlorococcum oleofaciens.
Fermentation 08 00658 g003
Figure 4. (a) Chlorococcum oleofaciens removes total nitrogen (TN) and (b) ammonia nitrogen from LABT-POM.
Fermentation 08 00658 g004
Figure 5. Reduction of soluble chemical oxygen demand (SCOD) from LABT-POME using Chlorococcum oleofaciens.
Fermentation 08 00658 g005
Figure 6. The relative reproductive rates of Chlorococcum oleofaciens in LABT-POME fitted to the normalised logistic model.
Fermentation 08 00658 g006
Table 1. Characteristics of POME before and after the preliminary treatment processes.
ParametersRaw POMEa Treatment 1b Treatment 2
pH4–56–7.58–9
COD (mg/L)70,000–80,00010,000–15,000600–1000
BOD3 (mg/L)10,000–20,0001000–2000150–300
TN (mg/L)1700–1800800–1000400–500
TP (mg/L)820–950500–72080–150
NH3–N (mg/L)180–250300–400150–200
Colour--3000–3500
a Anaerobic-treated POME. b Aerobic-treated POME (LABT-POME).
Table 2. Images and morphology of three green microalgae.
Light Microscopy Image (40× Magnification)SEM PhotographCell Dimension (μm)CharacteristicsGenus
Fermentation 08 00658 i001Fermentation 08 00658 i0020–12 Chlorococcum sp.
Fermentation 08 00658 i003Fermentation 08 00658 i0042.6–4.5green in colour, spherically shaped cells, cup-shaped chloroplastsChlorella sp.
Fermentation 08 00658 i005Fermentation 08 00658 i006Long:
11–18
Wide:
3.5–7
green in colour, 2 or 4 cells attached side by side, two flagella are present, cells arranged in a zigzag or linear patternScenedesmus sp.
Table 3. Visible results of the three green microalgae cultivated in different dilutions (25%, 50%, and 75%; v/v) of LABT-POME.
MicroalgaeDilution of POME (v/v)
25%50%75%
Chlorococcum oleofaciensFermentation 08 00658 i007Fermentation 08 00658 i008Fermentation 08 00658 i009
Chlorella sorokinianaFermentation 08 00658 i010Fermentation 08 00658 i011Fermentation 08 00658 i012
25%50%75%
Scenedesmus quadricaudaFermentation 08 00658 i013Fermentation 08 00658 i014Fermentation 08 00658 i015
Table 4. Morphology of the three green microalgae before and after growing in LABT-POME (75%) observed with a 40× objective light microscope and SEM.
Microalgae SpeciesBeforeAfter
Chlorococcum oleofaciensLight microscope
Fermentation 08 00658 i016
Light microscope
Fermentation 08 00658 i017
SEM
Fermentation 08 00658 i018
SEM
Fermentation 08 00658 i019
Chlorella sorokinianaLight microscope
Fermentation 08 00658 i020
Light microscope
Fermentation 08 00658 i021
SEM
Fermentation 08 00658 i022
SEM
Fermentation 08 00658 i023
Table 5. Values of kinetic coefficients.
MicroalgaeXo (μg/mL)Xm (μg/mL)μ (d−1)R2p-Value
Chlorococcum oleofaciens0.1811.110.320.99<0.0001
Publisher’s Note: MDPI stays neutral with regard to jurisdictional claims in published maps and institutional affiliations.