Abstract
A growing awareness of global climate change has led to an increased interest in investigating renewable energy sources, such as the anaerobic digestion of biomass. This process utilizes a wide range of microbial communities to degrade biodegradable material in feedstock through a complex series of biochemical interactions. Anaerobic digestion exhibits nonlinear dynamics due to the complex and interacting biochemical processes involved. Due to its dynamic and nonlinear behavior, uncertain feedstock quality, and sensitivity to the process’s environmental conditions, anaerobic digestion is highly susceptible to instabilities. Therefore, in order to model and operate a biogas production unit effectively, it is necessary to understand which parameters are most influential on the model outputs. This also reduces the amount of estimation required. Through a scoping review, the present study analyzes the studies on the application of sensitivity analysis in anaerobic digestion modeling. Both local and global sensitivity analysis approaches were carried out using different mathematical models. The results indicate that anaerobic digestion model no.1 (ADM1) was the most commonly used model for analyzing sensitivity. Both local and global sensitivity analyses are widely employed to investigate the influence of key model parameters such as kinetic, stoichiometric, and mass transfer parameters on model outputs such as biogas production, methane concentration, pH, or economic viability of the plant.
1. Introduction
Anaerobic digestion (AD), a biochemical process, is well-recognized as an alternative method for recycling and treating organic wastes while generating bioenergy [1]. The application of AD has been widespread in several fields over the last few decades. It is possible to produce usable biogas as a source of clean energy through AD [2]. As a sustainable, renewable, and carbon-neutral energy source, the anaerobic digestion of biogas has been demonstrated to be an effective method of reducing the world’s carbon footprint, as well as its reliance on fossil fuels [3].
Several anaerobic digestion models have been developed over the past few decades. Emebu et al. [4] reviewed different AD models and classified them into single-equation or multi-step dynamic models. Typically, single-equation models are simple, requiring a limited number of inexpensive experiments to fit the curves and making them easily applicable for simulation and control. Models based on one equation assume that biogas can be produced from feedstock without incorporating the various biochemical, mass transfer, and physicochemical processes involved. The single-equation method can be categorized into dynamic, cumulative, and multi-regression single-equation models. In contrast, the multi-step dynamic model incorporates more than one sequentially interconnected dynamic equation to account for many AD process phenomena. Many equations are involved in biogas production prediction, including microbial growth, feedstock and substrate utilization, biogas formation and evolution, etc. The multi-step dynamic model can be classified into single-step, two-step, and multi-step degradation models. A single-step degradation model (SSDM) is a simplified model that can be used to evaluate biogas yield from a substrate directly. Two-step degradation models (TSDM), also known as AM2 models, are ideal for monitoring and controlling software sensors and AD systems. The multi-step degradation model (DSDM) represents the most comprehensive AD model that incorporates reaction dynamics for all intermediates.
Mathematical models for AD were first proposed by Eastman and Ferguson [5] in the early 1980s. Based on ordinary differential equations (ODE) systems, they primarily modeled biochemical processes occurring in AD reactors, and in order to reduce the model complexity, different simplifications and assumptions were made [6]. Model development continued for several decades, and several approaches were consolidated during this time. For years, the mathematical modeling of AD processes has been challenging for the scientific community [7]. The International Water Association (IWA) task group developed the anaerobic digestion model no.1 (ADM1) in 2002, which offered a unified approach to AD mathematical modeling [8]. ADM1, as the most popular multi-step degradation model [9], provides a structured mathematical representation of complex processes in converting organic substrates into methane, CO2, and inert byproducts (biogas) [10]. It is important to note that, while the ADM1 does not cover all processes involved in the AD process (such as precipitation of solids and sulfur reduction), it is intended to provide predictions that are as accurate as possible and can be used to develop, operate, and optimize the anaerobic digestion process [11]. There are several steps involved in ADM1 [12]. The first step involves disintegrating complex solids into soluble and particulate inerts, carbohydrates, proteins, lipids, and inert substances (a non-biological step) [13]. In the next step, the disintegration products are hydrolyzed by enzymes, and sugars, amino acids, and long-chain fatty acids (LCFAs) are the main products. In the acidogenesis process, sugars and amino acids are fermented to produce volatile fatty acids (VFAs), hydrogen gas, and carbon dioxide. Lastly, methane is produced both by acetoclastic (cleavage of acetate to methane) and hydrogenotrophic (reduction of carbon dioxide to methane) methanogenesis processes [14]. Figure 1 illustrates the reaction path in ADM1, as described in [8].
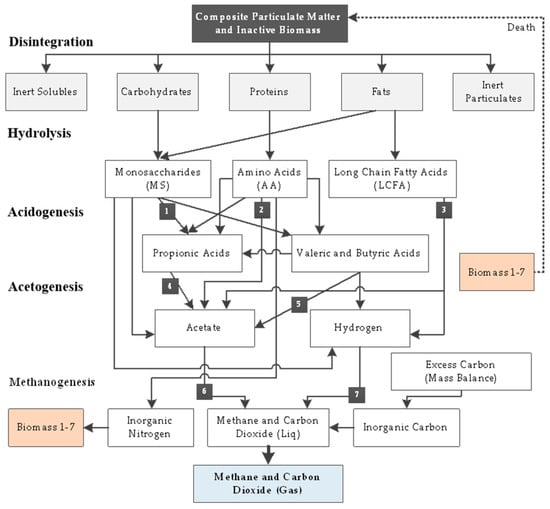
Figure 1.
The reaction paths in ADM1 described in [8].
Additionally, there are some other models for anaerobic digestion. One of the most widely used open-source implementations of ADM1 is the Benchmark Simulation Model number 2 (BSM2), developed in the MATLAB/SIMULINK environment [15]. BSM2 is the enhanced version of BSM1, which does not allow for evaluating control strategies at the plant level. The activated sludge models (ASM) [16] and novel approaches such as the process simulation model (PSM) [17] and GM (1, N), which is a Grey model with N variable.
Identifying the most influential input parameter or variable on the model’s outputs in a complex model (such as ADM1) with several input parameters and output parameters is crucial. Sensitivity analysis (SA) is a practical tool for identifying how the outcomes of our models differ when assumptions are altered. There is a significant fluctuation in the results when specific assumptions are changed when sensitivity is high; these assumptions must be extremely well established [18,19]. Moreover, SA can assist in verifying the validity of model assumptions and identifying the parameters [1,20]. It is also possible to use SA to calibrate the model parameters to demonstrate a stronger correlation with experimental data. SA ranks the parameters according to their relevance, and nominal values are assigned to the parameters with the least influence [6].
As discussed above, in order to determine whether each parameter of a model has a significant effect on the system’s behavior, sensitivity analysis is commonly used [21]. There are two main types of sensitivity analysis: local and global. Analyzing the impact of one parameter on the cost function at a time while keeping the other parameters constant is known as a local sensitivity analysis, and global sensitivity analysis (GSA) examines the effect of simultaneous variations in model parameters on model outputs [22,23,24]. Compared to GSA, local sensitivity analysis (LSA) is very straightforward, can easily be applied and interpreted, and often requires fewer simulation runs. Global sensitivity analysis involves varying several input factors simultaneously and evaluating their sensitivity over the entire range [25]. There are different approaches to conducting a GSA. Tian [26] provided a classification with four methods: regression, screening-based, variance-based, and metamodel-based methods. The regression method has the advantage of being easy to understand and fast to compute. Many indicators can be used for this purpose, usually, after Monte Carlo is performed, including standardized regression coefficients, partial correlation coefficients, and their rank transformations. Screening methods are often used to fix some input factors from a large number of factors without reducing the variance of the output. Among different screening methods, the Morris method [27] is the most commonly used approach. By calculating partial derivatives at different locations in the input variable domain variation, the Morris method overcomes the limitations of the local SA [28]. In a variance-based analysis, output uncertainty is decomposed according to input uncertainty. This variance-based method is considered a model-free approach suitable for complex nonlinear and non-additive models [26]. Although this method has a high computational cost, it is capable of quantifying the variance of the output caused by each input as well as considering the interaction effects between variables. Fourier amplitude sensitivity test (FAST) and Sobol are two commonly used methods [29]. Although the Sobol method can decompose all output variances, it is much more computationally intensive than other global sensitivity analysis methods [30]. With the advancements in computing cost, the metamodel-based method, or surrogate method, has received increased attention in recent years. These models have been extensively discussed in [31].
Following PRISMA guidelines [32,33,34,35], the present study aims to conduct a scoping review to identify and assess the frequency with which sensitivity analysis approaches are reflected in anaerobic digestion modeling studies. Therefore, the present study aims to address the following research questions:
- What type of sensitivity analysis and what method were addressed?
- What models of anaerobic digestion were used?
- How have sensitivity analysis methods been applied to resolve a particular problem?
2. Research Methodology and Design: Scoping Review
Arksey and O’Malley [31] and Peters et al. [32] proposed a methodological framework for scoping reviews. This method was employed because it is more rigorous than a traditional literature review [23]. PRISMA flow diagrams include a report of the papers found at each stage [36]. As part of PRISMA’s reporting methodology, flow diagrams (Figure 2) are an established method for systematic and scoping reviews [21,32]. Since the literature identified is not intended to be critically assessed, this method is neither a mapping review nor a systematic review. An alternative approach is to present a descriptive and qualitative thematic analysis. As part of the research process, Figure 1 illustrates these six steps.
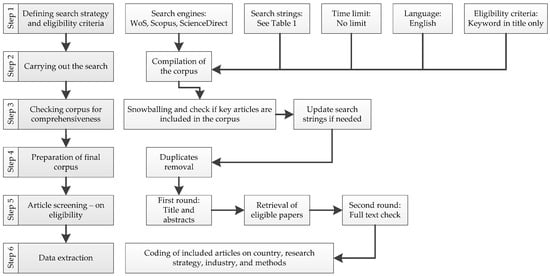
Figure 2.
Overall research process scheme (adapted from [23]).
2.1. Review Procedure
The scoping review protocol involves different main stages, such as identifying research questions, selecting studies, charting data, and summarizing and reporting the results. As illustrated in Figure 1, the following steps were taken under the scoping review protocol (PRISMA):
- As seen in Section 1, three research questions were defined.
- Several trial-and-error searches were performed using scientific databases (Web of Science, Scopus, and ScienceDirect) to begin the search. Each database’s search strings are listed below.Web of Science: ALL = ((anaerobic AND digestion) OR adm1 OR bsm2) AND sensitiv*Scopus: TITLE-ABS-KEY ((anaerobic AND digestion) OR adm1 OR bsm2) AND sensitiv*ScienceDirect: ((anaerobic AND digestion) OR adm1 OR bsm2) AND sensitivity.In the initial search, titles, abstracts, and keywords were searched with no limit throughout all databases. As a result, 1071, 1011, and 89 studies (in all categories) were listed in Web of Science, Scopus, and ScienceDirect, respectively. Asterisks can often be used to increase a search’s search results by indicating terms with a similar first letter [21]. For example, sensitiv* can find sensitive, sensitivity, sensitivities, etc. According to the limited number of studies at this stage (with no limitation), although there is considerable interest in studying anaerobic digestion, few studies have addressed sensitivity analysis.
- In order to obtain more precise results at this stage, the search was limited to just the tile. Therefore, the remaining articles dropped to 18, 21, and 11 for WoS, Scopus, and ScienceDirect. The limited number of studies at this stage (with no limitation) reveals that, although there is considerable interest in studying anaerobic digestion, few studies have addressed sensitivity analysis.
- Due to the reason above, no limit was applied on the year of publication, and all studies until September 2022 were considered.
- The language of the studies was also limited to English. Despite this, there was no language other than English, and the number of studies remained the same.
- The list contained many duplicates. Therefore, after trimming the list and removing duplicates using Microsoft Excel® v2016 (Microsoft, Redmond, WA, USA), only 23 remained.
- By screening the titles and full text of the studies, eligibility was assessed at two stages. During the title screening stage, one document was considered non-relevant, and two articles were eliminated during the full-text screening stage. At this stage, 19 publications were included in the list.
- In the last step, by backward snowballing, 12 studies were found relevant and added to the list, and the final list consisted of 31 studies. A snowballing strategy that can be forward or backward involves identifying additional papers by using the reference list or citations to a paper [37,38].
After the extraction of bibliographic information, the collected articles were categorized according to the characteristics such as year, country, type of papers, method, and tools. Section 3 presents a summary of the results. Figure 3 illustrates the results of the screening process in order to present the retained articles and studies at each stage following the PRISMA methodology.
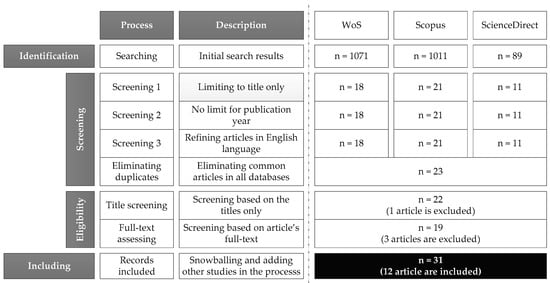
Figure 3.
PRISMA flow diagram.
2.2. Limitations
This section discusses the limitations of the study. Three well-known and frequently used databases (Web of Science, Scopus, and ScienceDirect) were utilized among the numerous metadata service providers and publishers. Adding additional databases, such as Google Scholar, would improve results. Additionally, this study only includes journal and conference papers, as well as book chapters, and not gray literature, white papers, publicly available records, and technical reports. As discussed in Section 2.1, the search was limited to the titles only. Commonly, AD studies include sensitivity analysis, but this study aimed to address studies in which sensitivity analysis dominates. Despite the English language limitation, all selected studies were in English. Moreover, more extensive snowballing would enhance the outcome.
3. Results and Discussion
This section provides the descriptive information associated with the latest studies on performing sensitivity analysis in anaerobic digestion modeling.
3.1. Classification Based on the Publication Year
A year-wise analysis informs the reader about the progress research, and highlights the researchers’ interest in the subject. Figure 4 illustrates the number of published studies since 1984. There were some initiatives in 1984 and 1985, followed by three studies in 2003, 2005, and 2008. The main studies began in 2012, with the highest in 2015, 2019, and 2021 by four studies. Interestingly, as of September 2022, no studies have been registered. One reason for this low interest could be the huge uncertainties associated with mathematical modeling. Moreover, as mentioned earlier, the current mathematical models are not covering all reactions, and because this analysis is mainly based on mathematical models, it is challenging to interpret the results.
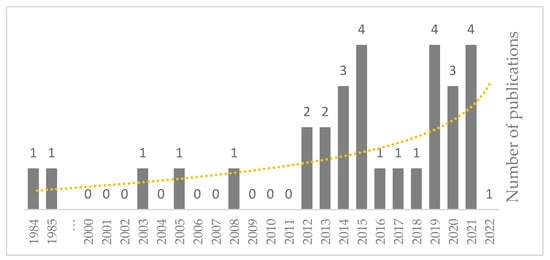
Figure 4.
The number of selected studies and overall trend from 1984 to September 2022.
3.2. Classification Based on the Publication Country
Analysis of the selected publications revealed that 23 countries contributed to this topic (1984–2022). As seen in Figure 5, the highest contribution belongs to Sweden and Denmark, with five studies (4 joint publications), followed by Italy, with four studies. Brazil, Canada, South Korea, and Belgium contributed to three publications. France, Spain, the USA, China, and Chile had two publications each. Eleven countries were involved in only one publication each, categorized under “Other Countries.” Norway, Romania, Australia, Russia, Finland, Iran, Lebanon, Saudi Arabia, the UK, France, South Africa, and Cuba belong to this category.
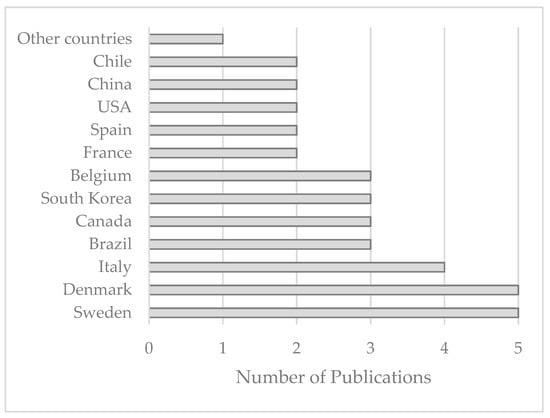
Figure 5.
Contributions from different countries from 1984 to September 2022.
3.3. Classification Based on Document Type
As discussed earlier, this review considered all types of publications, excluding reports and gray literature. According to Figure 6, there are three types in the selected documents. Articles have the highest rank of 84%, conference papers have the second-highest rank of 13%, with four studies [39,40,41,42], and one thesis [43] makes up only 3%. Book chapters and, most importantly, reviews were not addressed in the 30 selected studies, which emphasizes the importance and lack of review studies on this topic.
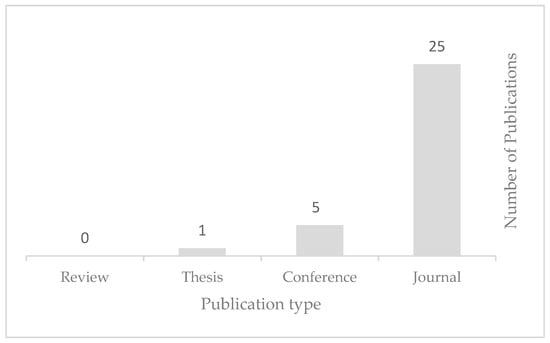
Figure 6.
Categorization based on document type.
3.4. Anaerobic Digestion Models
Apart from limited studies based on experiments, most of the analyses were based on mathematical models, emphasizing the importance of developing mathematical models. A summary of the models and frequencies found in the 30 selected studies is presented in Table 1.

Table 1.
Models used in sensitivity analyses.
3.5. Sensitivity Analysis Approaches
A comprehensive content-based analysis was conducted in order to answer the research questions. Following is a summary of 30 selected research studies conducted over the years. As discussed earlier, generally, there are two approaches to analyzing sensitivity: local and global. Table 2 summarizes two main sensitivity analysis approaches and their frequency in the selected publications. As expected, the local approaches dominate by almost 60 percent. The local sensitivity analysis is a one-at-a-time technique that examines the impact of one parameter on the output at a time while keeping the other parameters constant. As the biggest limitation, this method does not consider parameter interaction. Four studies used a specific method in a local sensitivity analysis. Local relative sensitivity analysis introduced by Dochani and Vanrolleghem [66] is a method for calculating sensitivity functions for dynamic simulations utilizing finite difference approximations. The objective of parametric sensitivity analysis (SA) is to select the sensitive parameters that have the greatest impact on the model output variables, thus improving the efficiency of design optimization by adjusting a limited number of sensitive parameters rather than all the adjustable parameters [67]. A dynamic sensitivity analysis is one in which the sensitivity indexes are time-dependent [68,69].
Table 2.
Sensitivity analysis approaches and their frequency.
In contrast with local sensitivity analysis, when all input factors are varied simultaneously, and the sensitivity is evaluated over each input factor’s full range, a sensitivity analysis is considered global [25]. As discussed in Section 1, there are different global sensitivity analysis methods. Several approaches were identified from the selected studies, which will be discussed further.
3.6. Local Approaches
3.6.1. Local Sensitivity Analysis
According to Table 2, fifteen studies used local sensitivity analysis, indicating the highest level of interest. In a comprehensive LSA, Barahmand [12] explored the potential effects of varying 48 stoichiometric and kinetic parameters in ADM1 on 35 output variables. As a result of the analysis, all correlations and sensitivity indexes between input variables and output variables were provided. As a conclusion, in this study, pH, as one of the critical output variables, shows the highest sensitivity to , , and . Panaro et al. [7] performed calibration, validation, and sensitivity analysis on a surface-based ADM1 model for the AD of potatoes to investigate the most sensitive parameters. In order to validate and calibrate the model at a laboratory scale, ad-hoc anaerobic digestion experiments were applied. Moreover, LSA investigated the importance of selecting the correct parameters for methane generation and volatile fatty acid concentrations in real AD bioreactors. Depending on which partial derivative is greater in absolute terms, the maximum or minimum value of those partial derivatives was used as a sensitivity index for each parameter [7]. Disintegration kinetic constant Ksbk presented the highest sensitivity among disintegration/hydrolysis-related parameters and Monod-specific uptake rates.
In order to implement a model predictive control system for AD systems, Li et al. [61] developed linearized ADM1 (LADM) as a model predictive control for anaerobic digestion systems. Model input data from the lab-scale AD system was used for the sensitivity test. SA resulted that kdis, khyd_ch, km_ac, KS_ac, and Yac were the most influential parameters. Based on an anaerobic digestion model, Silva and De Bortoli [63] calculated the first-order sensitivity coefficients for a system of stiff nonlinear differential equations. As part of this approach, the auxiliary equations were used to calculate the sensitivity coefficients solved separately from the model equations, using the same numerical approximations and time steps used to calculate the model solution using the 4th-order Rosenbrock method [70]. Based on the results, they could determine the importance of each reaction for each species involved in the model. Fatolahi et al. [44] calibrated ADM1 incorporated into Matlab/Simulink to simulate a mesophilic lab-scale reactor fed with the organic fraction of municipal solid waste. A sensitivity index based on Shannon entropy was used to determine five parameters as indicators: biogas flow, methane flow, pH, effluent COD, and ammonia concentration. Shannon entropy [71] refers to a measure of the uncertainty regarding the occurrence of a given event, given partial information about the system. According to the results, all other indicators’ parameters could be covered by the parameters of the biogas flow indicator with an entropy greater than 0.2 dB. In addition, genetic algorithms were used to estimate 13 critical kinetic parameters, including the maximum specific uptake rate of sugar, propionate, acetate, etc. Based on a techno-economic approach, Fuess and Ziait [57] identified the key factors affecting the economic performance of sugarcane biorefineries’ AD of vinasses.
Macleod et al. [59] determined the models’ quantitative sensitivities using factorial design. A factorial design allows the effects of a factor to be assessed at several levels of the other factors, enabling valid conclusions to be drawn over a wide range of variables [72]. The retention time had the greatest impact on total solids removal and volatile solids removal, and biogas was greatly influenced by loading rate and temperature. There was a high degree of precision in the regression model fitted to the experimental data, indicating that small reactors were as sensitive to changes in loading, retention time, and temperature as full-scale digesters. Benbelkacem et al. [47] performed a sensitivity analysis on ADM1 to investigate how biogas production was affected by KLa and KmX. Atallah et al. [51] conducted an LSA on ADM1 based on the two sets of digester data to optimize parameters based on five performance indicators: methane generation, pH, acetate, total COD, and ammonia. It was concluded that at one end of the simulated range, some parameters are highly sensitive. However, on the other end, they are less sensitive. In order to simulate the operation of continuous digesters fed at different HRTs, Souza et al. [52] evaluated the feasibility of using biochemical methane potential (BMP) tests data to calibrate ADM1. Based on data from BMP tests, a sensitivity analysis was conducted to determine the most sensitive ADM1 parameters to be calibrated. The “fminsearch” function from MATLAB® (Mathworks, Natick, MA, USA) was used for calibrating the differences between experimental and simulated values. As a result, asymmetric characteristics were observed for kdis, khydch, khydpr, and khydli when the parameters were varied at low levels. At low ranges, kmac also showed a high degree of sensitivity. In order to establish the basis for the appropriate application of the ADM1, Jeong et al. [53] developed a model for the serum bottle test that allows for a comparison of stoichiometric and kinetic parameters with the components. The results showed that the product yield on the substrate had a high sensitivity to model components, with methane concentration being the most sensitive. Although Monod’s maximum specific uptake rate was strongly associated with biomass concentration, individual values could not be determined.
Pinto et al. [56] identified the most sensitive parameters affecting the economic viability of investments for generating electrical energy through anaerobic bio-digestion of vinasses. Several strategically selected variables were subjected to a univariate sensitivity analysis. In the sensitivity analysis, the NPV for the vinasse daily flow, the electricity sale price in the RCE, the contracted amount in the FCE, and the power limit of the installed plant were examined. The profitability of the process was also evaluated using a sensitivity analysis. Biogas reuse is governed primarily by investment costs for AD power plants and product prices (electricity or biomethane). In order to design an optimal control strategy for the bioprocess, Iancu and Petre [42] performed a system sensitivity analysis to determine how command and parameter changes affect the evolution of the system states and outputs.
Although the most commonly used sensitivity analysis method for adapted ADM1 models is the local sensitivity method, it has some drawbacks [26,73,74]. LSA does not consider interaction effects between parameters. Moreover, small variations and fluctuations make the analysis challenging [6].
3.6.2. Parametric Sensitivity Analysis
Chen et al. [46] concocted a parametric sensitivity analysis on the ADM1 model using AQUASIM 2.0 (Reichert, 1994) to simulate biogas production from Hydrilla verticillata and select the most sensitive parameters for estimation using the absolute–relative sensitivity function. The results indicated that biogas production is greatly influenced by the disintegration constant (kdis), the protein hydrolysis constant (khyd_pr), the maximum specific substrate uptake rate (km_aa, km_ac, km_h2), and the half-saturation constants (Ks_aa, Ks_ac). The model equations were optimized by fitting the batch experiment data to the model equations. They could predict the experimental results of daily biogas production and composition using their ADM1 model after parameter estimation. According to them, batch experiments alone are not sufficient to determine the actual biogas potential of HV under actual process conditions; continuous anaerobic digestion reactions will also be necessary. Furthermore, a future plan for their study was grouped into three steps: (1) developing an anaerobic digester with continuous flow, such as an up-flow anaerobic sludge blanket (UASB) or a continuously stirred tank reactor (CSTR); (2) analyzing the stability of the anaerobic reactor by applying the modified ADM1 model to simulations of continuous AD processes in CSTR or UASB reactors; and (3) experimentally verifying the predictive effects of the modified ADM1 model by conducting continuous AD experiments in the CSTR or UASB reactor.
In another study, Havlik et al. [65] applied a parametric sensitivity method to a mathematical model of anaerobic digestion in order to determine how individual model parameters affected selected output variables. According to the relative parametric sensitivity value, yield coefficients and rate constants were the most influential parameters in the process. As a result of the parametric sensitivity analysis of the anaerobic digestion model, it was concluded that the stoichiometric coefficients and rate constants should be evaluated with the highest priority during the construction of the model. In contrast, other coefficients, such as saturation and inhibition constants, had relatively little influence, and their order-of-magnitude estimates were sufficient for construction.
3.6.3. Local Relative Sensitivity Analysis
Barrera et al. [48] modeled the anaerobic digestion of cane-molasses vinasses. They extended ADM1 with sulfate reduction for high-strength and sulfate-content wastewater. Four parameters of the original ADM1 (km,pro, km,ac, km,h2, and Yh2) and all sulfate reduction parameters (Spro, Sac, pH, Qgas, Sgas,ch4, Sgas,co2, Sso4, Sh2s, and Sgas,h2s) were calibrated based on a local relative sensitivity analysis. It was found that the mentioned process variables were accurately predicted during model validation, despite some deviations between the model predictions and the experimental values. Thirty-six days of dynamic data were used to calibrate the model. Using an iterative approach [75], the most sensitive parameters were calibrated by fitting the model to the experimental results for the mentioned process variables. Their model showed high-to-medium accuracy (10–30%), with a mean absolute relative error ranging between 1 and 26%. As the sulfate loading rate increased, the model was able to predict the failure of methanogenesis and sulfidogenesis.
3.6.4. Dynamic Sensitivity Analysis
Lee et al. [50] conducted the anaerobic model for co-substrate degradation by a temperature-phased anaerobic digestion process based on ADM1 in order to validate the performance of ADM1. Moreover, dynamic sensitivity analyses of kinetic parameters were carried out. In order to analyze the dynamic sensitivity of the continuous experimental model, the average of absolute differences between simulation results with parameters previously determined by Batstone et al. [8] and parameters with a relative change of the target parameter was used as the sensitivity index. For sensitivity analysis, the kinetic parameters were taken into account. However, stoichiometric parameters were negligible due to their small variation. According to the sensitivity analysis, the maximum specific uptake rate and half saturation value were highly sensitive to model components. For propionate users and acetate utilizers, key parameters, including the maximum uptake rate and half saturation constant, were estimated using iterative methods, which optimized the parameters based on experimental results. For acetate utilizers, the maximum uptake rate was estimated using iterative methods. Table 3 summarizes the sensitivity approaches and methods in the selected studies.
Table 3.
Sensitivity approaches and methods used in analyses.
3.7. Global Approaches
Twelve of the thirty selected studies utilized GSA as the sensitivity analysis method. Based on a definitive screening design and multiple linear regression analysis, Boutoute et al. [1] demonstrated the reliability of a GSA methodology. The method was applied to a simplified model of anaerobic digestion. According to the sensitivity analysis, the slow hydrolysis constant and the upper pH inhibition limit of the hydrolytic biomass were crucial for accurate prediction of the biogas production rate, and biogas methane percentage varied slightly with kinetic parameters. Furthermore, the mass transfer coefficient significantly impacted the pH due to CO2 desorption. Trucchia and Frunzo [6] conducted a GSA and uncertainty quantification (UQ) for a modified version of the ADM-based model. A large number of parameters were analyzed to perform GSA, which led to a first preliminary screening analysis using the Morris method. Based on the two defined quantities of interest (QoI), a surrogate model for ADM1 was developed. For the quantitative GSA, the output results from the surrogate model have been analyzed with Sobol indices. They resulted that for the whole set of QoI which was adopted, the role of parameters particle radius (r0) and surface-based kinetic constant (Ksbk) were crucial.
A computational approach was demonstrated by Fortela et al. [45] in order to explore the importance of biochemical mechanism parameters in AD models with variations in the concentrations of feedstock. Their methodology incorporated GSA, functional principal component analysis (FPCA), and rank-clustering techniques. With GSA-FPCA integration, the time-varying nature of GSA (Morris’ indices) was removed, while rank-clustering provided a statistically based method to group parameter sensitivities based on variations in the feedstock. Based on the first principal component scores, the ranked Morris sensitivity indices revealed the stoichiometric parameters most likely to influence kinetic responses, as well as those that were the least sensitive. Pastor-Poquet et al. [60] evaluated the effect of high NH3 levels on the high-solids anaerobic digestion of organic fractions of municipal solid waste through calibration and cross-validation of a high-solids anaerobic digestion model for homogenized reactors. Based on the experimental data available, the GSA was designed to identify the most influential parameter that should be calibrated. The identifiability of 35 biochemical parameters and 32 initial process conditions were assessed using batch experiments at different solid-to-substrate ratios.
Parameter optimization was carried out using variance-based global sensitivity analysis and approximate Bayesian computation. Xu [43] developed a method for calibrating parameters that could be incorporated into ADM1 built for industrial-scale digesters. A partial least squares (PLS) method was proposed, which consisted of four steps: a series of Monte Carlo simulations; GSA as a multivariate regression technique called PLS Regression, which was applied to the results in the previous step; parameter calibration; and validation. According to the author, the parameter calibration method proposed in this thesis significantly improved the model’s overall accuracy, and comparing the PLS method with other methods, such as Group and Brute Force methods, showed promising results. A systematic framework for the construction and validation of high-accuracy meta-models for the efficient scenario-based GSA of complex wastewater treatment plant models was presented by Al et al. [54]. Four engineering scenarios were investigated in order to assess the efficiency and robustness of three meta-modeling approaches, namely polynomial chaos expansion [76], Gaussian process regression [77], and artificial neural networks [78,79]. The proposed framework showed significant computational gains compared to the Monte Carlo-based approaches. An investigation into the influence of influent fractionation, kinetics, stoichiometry, and mass transfer parameter uncertainties on biogas production in wastewater treatment plants was conducted by Solon et al. [49]. Using BSM2, the amounts of CH4, H2, and CO2 generated in a plant were quantified. In order to identify the set of parameters that have the greatest influence on the biogas production uncertainty, a comprehensive global sensitivity analysis was conducted based on standardized regression coefficients (SRC) and Morris’ screening’s (MS’s) elementary effects. GSA was repeated in the anaerobic digester for different solids retention times (SRTs) and temperature regimes. It resulted that unless the anaerobic digester operates at low SRT and mesophilic conditions, both SRC and MS are good sensitivity measures. The influent fractionation was the most influential parameter for predicting the emissions of CH4 and CO2 at high SRT.
Using one-dimensional secondary settling tanks (1-D SST) models with first-order and second-order mathematical structures, Ramin et al. [55] examined the sensitivity of wastewater treatment plant model performance. Based on the input uncertainties associated with the biokinetic parameters in ASM1, the fractionation parameter in the primary clarifier, and the settling parameters in the SST model, a GSA was performed on BSM2. In particular, for the biogas production and treated water quality in the plant model, the settling parameters were found to have the most influence on uncertainty as the biokinetic parameters. A study was conducted by Ramin et al. [39] to examine the impact of two operational strategies for reducing excess activated sludge waste on the simulation performance. They conducted GSA on BSM2 using linear regression (SRC method) with Monte Carlo simulations and Morris screening. According to the results obtained in this study, 1-D SST model parameters greatly influenced biogas production through anaerobic digestion and the quality of the plant’s effluent water. However, they showed a limited effect on estimating the quality of nitrogen-rich returns from anaerobic digestion.
A GSA was conducted by Flores-Alsina et al. [58] on a phenomenological model based on BSM2 that generates dynamic scenarios of an influent disturbance at wastewater treatment plants. Combined Monte Carlo simulations and SRC were employed for the GSA. In the next step, cluster analysis was applied in order to categorize the influence of the model parameters into three groups: strong, medium, and weak. Flow rates during dry weather and their variability were strongly influenced by both catchment size and wastewater production per person. In wet weather conditions, the probability of a rain event, the catchment size, and rainfall falling on permeable surfaces were the most influential parameters. Bendetti et al. [40] applied GSA using the Monte Carlo approach to BSM2. Among the parameters, the design and operation parameters were found to be the most sensitive, followed by the parameters of the wastewater treatment model, while the adopted BSM2 evaluation criteria were relatively insensitive to variations in the parameters of the sludge treatment model. Using a simplified AD model, Donoso-Bravo et al. [62] introduced a three-step procedure for estimating kinetic and stoichiometric parameters with a high degree of accuracy. A variance-based GSA and a multi-start strategy that helped to identify the possible local minima were all part of this process. Table 4 lists and provides information about anaerobic digestion models and the application of the sensitivity analyses in the selected studies.
Table 4.
Sensitivity approaches and methods used in analyses.
4. Conclusions
Sensitivity analysis is an integral part of anaerobic digestion modeling. The literature lacks reviews on this topic, and the present study, in order to fill the gap, aims to conduct a scoping review to investigate the application of sensitivity analysis in anaerobic digestion modeling. The results indicate that in addition to calibration and estimation, it can be used to investigate the influence of input parameters on the model’s output. There is considerable interest in both local and global approaches to sensitivity analysis in the literature. Mathematical models, in particular, ADM1-based models were commonly used to perform sensitivity analyses. The sensitivity of methane production, pH, COD, and biogas flow rate were studied extensively in the selected studies. Many advantages can be derived from sensitivity analysis. It is far more reliable to make predictions based on a detailed analysis of all the variables. As a result, decision-makers and designers can identify exactly where improvements can be made, and are able to make informed decisions about the process. Moreover, local sensitivity analysis can serve as the basis for uncertainty analysis, particularly possibilistic approaches such as fuzzy set theory.
Author Contributions
Conceptualization, Z.B. and G.S.; methodology, Z.B. and G.S.; analysis and investigation, Z.B. and G.S.; data curation, Z.B.; writing—original draft preparation, Z.B.; writing—review and editing G.S.; visualization, Z.B.; supervision, G.S. All authors have read and agreed to the published version of the manuscript.
Funding
This research received no external funding.
Institutional Review Board Statement
Not applicable.
Informed Consent Statement
Not applicable.
Data Availability Statement
Not applicable.
Acknowledgments
We would like to express our great appreciation to Peyman Sadrimajd for his valuable and constructive suggestions during the development of this research work. His willingness to give his time so generously has been very much appreciated.
Conflicts of Interest
The authors declare no conflict of interest.
References
- Boutoute, A.; Di Miceli Raimondi, N.; Guilet, R.; Cabassud, M.; Amodeo, C.; Benbelkacem, H.; Buffiere, P.; Teixeira Franco, R.; Hattou, S. Development of a Sensitivity Analysis Method to Highlight Key Parameters of a Dry Anaerobic Digestion Reactor Model. Biochem. Eng. J. 2021, 173, 108085. [Google Scholar] [CrossRef]
- Kil, H.; Xi, Y.; Li, D. A New Waste Characterization Method for the Anaerobic Digestion Based on ADM1. Chem. Eng. Commun. 2017, 204, 1428–1444. [Google Scholar] [CrossRef]
- Taherdanak, M.; Zilouei, H. Biogas Production From Agricultural Residues: A Review. Curr. Biochem. Eng. (Discontin.) 2016, 3, 188–199. [Google Scholar] [CrossRef]
- Emebu, S.; Pecha, J.; Janáčová, D. Review on Anaerobic Digestion Models: Model Classification & Elaboration of Process Phenomena. Renew. Sustain. Energy Rev. 2022, 160, 112288. [Google Scholar] [CrossRef]
- Eastman, J.A.; Ferguson, J.F. Solubilization of Particulate Organic Carbon during the Acid Phase of Anaerobic Digestion. J. Water Pollut. Control Fed. 1981, 53, 352–366. [Google Scholar]
- Trucchia, A.; Frunzo, L. Surrogate Based Global Sensitivity Analysis of ADM1-Based Anaerobic Digestion Model. J. Environ. Manag. 2021, 282, 111456. [Google Scholar] [CrossRef]
- Panaro, D.B.; Frunzo, L.; Mattei, M.R.; Luongo, V.; Esposito, G. Calibration, Validation and Sensitivity Analysis of a Surface-Based ADM1 Model. Ecol. Model. 2021, 460, 109726. [Google Scholar] [CrossRef]
- Batstone, D.J.; Keller, J.; Angelidaki, I.; Kalyuzhnyi, S.V.; Pavlostathis, S.G.; Rozzi, A.; Sanders, W.T.M.; Siegrist, H.; Vavilin, V.A. The IWA Anaerobic Digestion Model No 1 (ADM1). Water Sci. Technol. 2002, 45, 65–73. [Google Scholar] [CrossRef]
- Sadrimajd, P.; Mannion, P.; Howley, E.; Lens, P.N.L. PyADM1: A Python Implementation of Anaerobic Digestion Model No. 1; bioRexiv: New York, NY, USA, 2021. [Google Scholar] [CrossRef]
- Parker, W. Application of the ADM1 Model to Advanced Anaerobic Digestion. Bioresour. Technol. 2005, 96, 1832–1842. [Google Scholar] [CrossRef]
- Ramírez, I. ADM1 Applications for a Hybrid Up-Flow Anaerobic Sludge-Filter Bed Reactor Performance and for a Batch Thermophilic Anaerobic Digestion of Thermally Pretreated Waste Activated Sludge. Rev. Fac. De Ing. Univ. De Antioq. 2012, 65, 167–179. [Google Scholar]
- Barahmand, Z. Comprehensive Local Sensitivity Analysis of the ADM1-Based Anaerobic Digestion Process; WIT Press: Southampton, UK, 2022; pp. 235–246. [Google Scholar] [CrossRef]
- Tassew, F.A.; Bergland, W.H.; Dinamarca, C.; Bakke, R. Influences of Temperature and Substrate Particle Content on Granular Sludge Bed Anaerobic Digestion. Appl. Sci. 2019, 10, 136. [Google Scholar] [CrossRef]
- Fezzani, B.; Cheikh, R.B. Implementation of IWA Anaerobic Digestion Model No. 1 (ADM1) for Simulating the Thermophilic Anaerobic Co-Digestion of Olive Mill Wastewater with Olive Mill Solid Waste in a Semi-Continuous Tubular Digester. Chem. Eng. J. 2008, 141, 75–88. [Google Scholar] [CrossRef]
- Jeppsson, U.; Rosen, C. Aspects on ADM1 Implementation within the BSM2 Framework; Department of the Industrial Electrical Engineering and Automation, Lund Institute of Technology: Lund, Sweden, 2006. [Google Scholar]
- Henze, M.; Gujer, W.; Mino, T.; van Loosedrecht, M. Activated Sludge Models ASM1, ASM2, ASM2d and ASM3; IWA Publishing: London, UK, 2006. [Google Scholar]
- Rajendran, K.; Kankanala, H.R.; Lundin, M.; Taherzadeh, M.J. A Novel Process Simulation Model (PSM) for Anaerobic Digestion Using Aspen Plus. Bioresour. Technol. 2014, 168, 7–13. [Google Scholar] [CrossRef] [PubMed]
- Barahmand, Z.; Jayarathna, C.; Ratnayake, C. Sensitivity and Uncertainty Analysis in a Circulating Fluidized Bed Reactor Modeling. In Proceedings of the First SIMS EUROSIM Conference on Modelling and Simulation, Online, 21–23 September 2021; Linköping University Press: Linköping, Finland, 2021. [Google Scholar] [CrossRef]
- Barahmand, Z. Design of an Industrial Chlorination Reactor Using CPFD Simulations. Master’s Thesis, University of South-Eastern Norway, Porsgrunn, Norway, 2021. [Google Scholar]
- Tartakovsky, B.; Mu, S.J.; Zeng, Y.; Lou, S.J.; Guiot, S.R.; Wu, P. Anaerobic Digestion Model No. 1-Based Distributed Parameter Model of an Anaerobic Reactor: II. Model Validation. Bioresour. Technol. 2008, 99, 3676–3684. [Google Scholar] [CrossRef] [PubMed]
- Barahmand, Z.; Eikeland, M.S. A Scoping Review on Environmental, Economic, and Social Impacts of the Gasification Processes. Environments 2022, 9, 92. [Google Scholar] [CrossRef]
- Zi, Z. Sensitivity Analysis Approaches Applied to Systems Biology Models. IET Syst. Biol. 2011, 5, 336–346. [Google Scholar] [CrossRef]
- Barahmand, Z.; Eikeland, M.S. Life Cycle Assessment under Uncertainty: A Scoping Review. World 2022, 3, 692–717. [Google Scholar] [CrossRef]
- Barahmand, Z.; Eikeland, M.S. Techno-Economic and Life Cycle Cost Analysis through the Lens of Uncertainty: A Scoping Review. Sustainability 2022, 14, 12191. [Google Scholar] [CrossRef]
- Zhou, X.; Lin, H.; Lin, H. Global Sensitivity Analysis. In Encyclopedia of GIS; Shekhar, S., Xiong, H., Eds.; Springer: Boston, MA, USA, 2008; pp. 408–409. ISBN 978-0-387-35973-1. [Google Scholar]
- Tian, W. A Review of Sensitivity Analysis Methods in Building Energy Analysis. Renew. Sustain. Energy Rev. 2013, 20, 411–419. [Google Scholar] [CrossRef]
- Morris, M.D. Factorial Sampling Plans for Preliminary Computational Experiments. Technometrics 1991, 33, 161–174. [Google Scholar] [CrossRef]
- Balesdent, M.; Brevaul, L.; Lacaze, S.; Missoum, S.; Morio, J. 8—Methods for High-Dimensional and Computationally Intensive Models. In Estimation of Rare Event Probabilities in Complex Aerospace and Other Systems; Morio, J., Balesdent, M., Eds.; Woodhead Publishing: Sawston, UK, 2016; pp. 109–136. ISBN 978-0-08-100091-5. [Google Scholar]
- Saltelli, A.; Ratto, M.; Tarantola, S.; Campolongo, F. Sensitivity Analysis for Chemical Models. Chem. Rev. 2005, 105, 2811–2828. [Google Scholar] [CrossRef] [PubMed]
- Jaxa-Rozen, M.; Pratiwi, A.S.; Trutnevyte, E. Variance-Based Global Sensitivity Analysis and beyond in Life Cycle Assessment: An Application to Geothermal Heating Networks. Int. J. Life Cycle Assess 2021, 26, 1008–1026. [Google Scholar] [CrossRef]
- Sobester, A.; Forrester, A.; Keane, A. Engineering Design via Surrogate Modelling: A Practical Guide; John Wiley & Sons: Hoboken, NJ, USA, 2008; ISBN 978-0-470-77079-5. [Google Scholar]
- Tricco, A.; Lillie, E.; Zarin, W.; O’Brien, K.; Colquhoun, H.; Levac, D.; Moher, D.; Peters, M.; Horsley, T.; Weeks, L.; et al. PRISMA Extension for Scoping Reviews (PRISMA-ScR): Checklist and Explanation. Ann. Intern. Med. 2018, 169, 467–473. [Google Scholar] [CrossRef] [PubMed]
- Rethlefsen, M.L.; Kirtley, S.; Waffenschmidt, S.; Ayala, A.P.; Moher, D.; Page, M.J.; Koffel, J.B.; Blunt, H.; Brigham, T.; Chang, S.; et al. PRISMA-S: An Extension to the PRISMA Statement for Reporting Literature Searches in Systematic Reviews. Syst. Rev. 2021, 10, 39. [Google Scholar] [CrossRef]
- Sarkis-Onofre, R.; Catalá-López, F.; Aromataris, E.; Lockwood, C. How to Properly Use the PRISMA Statement. Syst. Rev. 2021, 10, 117. [Google Scholar] [CrossRef] [PubMed]
- Selçuk, A.A. A Guide for Systematic Reviews: PRISMA. Turk. Arch. Otorhinolaryngol. 2019, 57, 57–58. [Google Scholar] [CrossRef] [PubMed]
- Page, M.J.; McKenzie, J.E.; Bossuyt, P.M.; Boutron, I.; Hoffmann, T.C.; Mulrow, C.D.; Shamseer, L.; Tetzlaff, J.M.; Akl, E.A.; Brennan, S.E.; et al. The PRISMA 2020 Statement: An Updated Guideline for Reporting Systematic Reviews. Int. J. Surg. 2021, 88, 105906. [Google Scholar] [CrossRef] [PubMed]
- Wohlin, C. Guidelines for Snowballing in Systematic Literature Studies and a Replication in Software Engineering. In Proceedings of the 18th International Conference on Evaluation and Assessment in Software Engineering, London, UK, 13–14 May 2014; Association for Computing Machinery: New York, NY, USA; pp. 1–10. [Google Scholar]
- Streeton, R.; Cooke, M.; Campbell, J. Researching the Researchers: Using a Snowballing Technique. Nurse Res. 2004, 12, 35–47. [Google Scholar] [CrossRef]
- Ramin, E.; Flores, X.; Sin, G.; Gernaey, K.V.; Jeppsson, U.; Steen Mikkelsen, P.; Plósz, B.G. Relative Importance of Secondary Settling Tank Models in WWTP Simulations—A Global Sensitivity Analysis Using BSM2. In Proceedings of the Sixth Biannial Meeting of the International Environmental Modelling and Software Society, Leipzig, Germany, 1–5 July 2012; pp. 588–595. [Google Scholar]
- Benedetti, L.; Batstone, D.J.; De Baets, B.; Nopens, I.; Vanrolleghem, P.A. Global Sensitivity Analysis of Biochemical, Design and Operational Parameters of the Benchmark Simulation Model No. 2; International Environmental Modelling and Software Society: Viganello, Switzerland, 2008; Volume 2, pp. 1322–1330. [Google Scholar]
- Vavilin, V.A.; Rytov, S.V.; Pavlostathis, S.G.; Jokela, J.; Rintala, J. A Distributed Model of Solid Waste Anaerobic Digestion: Sensitivity Analysis. Water Sci. Technol. 2003, 48, 147–154. [Google Scholar] [CrossRef]
- Iancu, E.; Petre, E. Control Strategy Based on Sensitivity Analysis. Application for Anaerobic Digestion Bioprocess. In Proceedings of the 2017 21st International Conference on Control Systems and Computer Science (CSCS), Bucharest, Romania, 29–31 May 2016; pp. 84–89. [Google Scholar]
- Xu, Z. ADM1 Parameter Calibration Method Based on Partial Least Squares Regression Framework for Industrial-Scale Anaerobic Digestion Modelling. Master’s Thesis, Stellenbosch University, Stellenbosch, South Africa, 2019. [Google Scholar]
- Fatolahi, Z.; Arab, G.; Razaviarani, V. Calibration of the Anaerobic Digestion Model No. 1 for Anaerobic Digestion of Organic Fraction of Municipal Solid Waste under Mesophilic Condition. Biomass Bioenergy 2020, 139, 105661. [Google Scholar] [CrossRef]
- Fortela, D.L.B.; Sharp, W.W.; Revellame, E.D.; Hernandez, R.; Gang, D.; Zappi, M.E. Computational Evaluation for Effects of Feedstock Variations on the Sensitivities of Biochemical Mechanism Parameters in Anaerobic Digestion Kinetic Models. Biochem. Eng. J. 2019, 143, 212–223. [Google Scholar] [CrossRef]
- Chen, X.; Chen, Z.; Wang, X.; Huo, C.; Hu, Z.; Xiao, B.; Hu, M. Application of ADM1 for Modeling of Biogas Production from Anaerobic Digestion of Hydrilla Verticillata. Bioresour. Technol. 2016, 211, 101–107. [Google Scholar] [CrossRef] [PubMed]
- Benbelkacem, H.; Bollon, J.; Gourdon, R.; Buffière, P. Dry Anaerobic Digestion Modelling: Parameter Sensitivity. Can. J. Chem. Eng. 2015, 93, 386–390. [Google Scholar] [CrossRef]
- Barrera, E.L.; Spanjers, H.; Solon, K.; Amerlinck, Y.; Nopens, I.; Dewulf, J. Modeling the Anaerobic Digestion of Cane-Molasses Vinasse: Extension of the Anaerobic Digestion Model No. 1 (ADM1) with Sulfate Reduction for a Very High Strength and Sulfate Rich Wastewater. Water Res. 2015, 71, 42–54. [Google Scholar] [CrossRef] [PubMed]
- Solon, K.; Flores-Alsina, X.; Gernaey, K.; Jeppsson, U. Effects of Influent Fractionation, Kinetics, Stoichiometry and Mass Transfer on CH4, H2 and CO2 Production for (Plant-Wide) Modeling of Anaerobic Digesters. Water Sci. Technol. 2015, 71, 870–877. [Google Scholar] [CrossRef] [PubMed]
- Lee, M.-Y.; Suh, C.-W.; Ahn, Y.-T.; Shin, H.-S. Variation of ADM1 by Using Temperature-Phased Anaerobic Digestion (TPAD) Operation. Bioresour. Technol. 2009, 100, 2816–2822. [Google Scholar] [CrossRef]
- Atallah, N.M.; El-Fadel, M.; Ghanimeh, S.; Saikaly, P.; Abou-Najm, M. Performance Optimization and Validation of ADM1 Simulations under Anaerobic Thermophilic Conditions. Bioresour. Technol. 2014, 174, 243–255. [Google Scholar] [CrossRef]
- Souza, T.S.O.; Carvajal, A.; Donoso-Bravo, A.; Peña, M.; Fdz-Polanco, F. ADM1 Calibration Using BMP Tests for Modeling the Effect of Autohydrolysis Pretreatment on the Performance of Continuous Sludge Digesters. Water Res. 2013, 47, 3244–3254. [Google Scholar] [CrossRef]
- Jeong, H.-S.; Suh, C.-W.; Lim, J.-L.; Lee, S.-H.; Shin, H.-S. Analysis and Application of ADM1 for Anaerobic Methane Production. Bioprocess Biosyst. Eng. 2005, 27, 81–89. [Google Scholar] [CrossRef]
- Al, R.; Behera, C.R.; Zubov, A.; Gernaey, K.V.; Sin, G. Meta-Modeling Based Efficient Global Sensitivity Analysis for Wastewater Treatment Plants—An Application to the BSM2 Model. Comput. Chem. Eng. 2019, 127, 233–246. [Google Scholar] [CrossRef]
- Ramin, E.; Flores-Alsina, X.; Sin, G.; Gernaey, K.; Jeppsson, U.; Mikkelsen, P.; Plósz, B. Influence of Selecting Secondary Settling Tank Sub-Models on the Calibration of WWTP Models—A Global Sensitivity Analysis Using BSM2. Chem. Eng. J. 2014, 241, 28–34. [Google Scholar] [CrossRef]
- Schiochet Pinto, L.; Pinheiro Neto, D.; de Leles Ferreira Filho, A.; Domingues, E.G. An Alternative Methodology for Analyzing the Risk and Sensitivity of the Economic Viability for Generating Electrical Energy with Biogas from the Anaerobic Bio-Digestion of Vinasse. Renew. Energy 2020, 155, 1401–1410. [Google Scholar] [CrossRef]
- Fuess, L.T.; Zaiat, M. Economics of Anaerobic Digestion for Processing Sugarcane Vinasse: Applying Sensitivity Analysis to Increase Process Profitability in Diversified Biogas Applications. Process Saf. Environ. Prot. 2018, 115, 27–37. [Google Scholar] [CrossRef]
- Flores-Alsina, X.; Gernaey, K.V.; Jeppsson, U. Global Sensitivity Analysis of the BSM2 Dynamic Influent Disturbance Scenario Generator. Water Sci. Technol. 2012, 65, 1912–1922. [Google Scholar] [CrossRef][Green Version]
- McLeod, J.D.; Othman, M.Z.; Beale, D.J.; Joshi, D. The Use of Laboratory Scale Reactors to Predict Sensitivity to Changes in Operating Conditions for Full-Scale Anaerobic Digestion Treating Municipal Sewage Sludge. Bioresour. Technol. 2015, 189, 384–390. [Google Scholar] [CrossRef]
- Pastor-Poquet, V.; Papirio, S.; Harmand, J.; Steyer, J.-P.; Trably, E.; Escudié, R.; Esposito, G. Assessing Practical Identifiability during Calibration and Cross-Validation of a Structured Model for High-Solids Anaerobic Digestion. Water Res. 2019, 164, 114932. [Google Scholar] [CrossRef]
- Li, D.; Lee, I.; Kim, H. Application of the Linearized ADM1 (LADM) to Lab-Scale Anaerobic Digestion System. J. Environ. Chem. Eng. 2021, 9, 105193. [Google Scholar] [CrossRef]
- Donoso-Bravo, A.; Mailier, J.; Ruiz-Filippi, G.; Vande Wouwer, A. Identification in an Anaerobic Batch System: Global Sensitivity Analysis, Multi-Start Strategy and Optimization Criterion Selection. Bioprocess Biosyst. Eng 2013, 36, 35–43. [Google Scholar] [CrossRef]
- Silva, M.I.; De Bortoli, A.L. Sensitivity Analysis for Verification of an Anaerobic Digestion Model. Int. J. Appl. Comput. Math 2020, 6, 38. [Google Scholar] [CrossRef]
- Marsili-Libelli, S.; Nardini, M. Stability and Sensitivity Analysis of Anaerobic Digestion Models. Environ. Technol. Lett. 1985, 6, 602–609. [Google Scholar] [CrossRef]
- Havlik, I.; Votruba, J.; Sobotka, M.; Volesky, B. Parametric Sensitivity in Modeling of Anaerobic Digestion. Biotechnol. Lett. 1984, 6, 607–610. [Google Scholar] [CrossRef]
- Dochain, D.; Vanrolleghem, P. Dynamical Modelling & Estimation in Wastewater Treatment Processes; IWA Publishing: London, UK, 2005; Volume 4, ISBN 978-1-78040-304-5. [Google Scholar]
- Di, Z.H.; Ye, A.Z.; Duan, Q.Y.; Wang, X.X. Assessment of Parametric Sensitivity Analysis Methods Based on A Quasi Two-Dimensional Groundwater Model. J. Environ. Inform. 2019, 37, 62–78. [Google Scholar] [CrossRef]
- Loonen, R.; Hensen, J. Dynamic Sensitivity Analysis For Performance-Based Building Design And Operation; IBPSA: Chambery, France, 2013; Volume 13, pp. 299–305. [Google Scholar]
- Wu, W.H.; Wang, F.S.; Chang, M.S. Dynamic Sensitivity Analysis of Biological Systems. BMC Bioinform. 2008, 9, S17. [Google Scholar] [CrossRef] [PubMed]
- Voss, D.A. Fourth-Order Parallel Rosenbrock Formulae for Stiff Systems. Math. Comput. Model. 2004, 40, 1193–1198. [Google Scholar] [CrossRef]
- Shannon, C.E. A Mathematical Theory of Communication. Bell Syst. Tech. J. 1948, 27, 379–423. [Google Scholar] [CrossRef]
- Nordstokke, D.; Colp, S.M. Factorial Design. In Encyclopedia of Quality of Life and Well-Being Research; Michalos, A.C., Ed.; Springer: Dordrecht, The Netherlands, 2014; pp. 2144–2145. ISBN 978-94-007-0753-5. [Google Scholar]
- Hamby, D.M. A Review of Techniques for Parameter Sensitivity Analysis of Environmental Models. Environ. Monit Assess 1994, 32, 135–154. [Google Scholar] [CrossRef]
- Saltelli, A. Sensitivity Analysis: Could Better Methods Be Used? J. Geophys. Res. Atmos. 1999, 104, 3789–3793. [Google Scholar] [CrossRef]
- Dereli, R.K.; Ersahin, M.E.; Ozgun, H.; Ozturk, I.; Aydin, A.F. Applicability of Anaerobic Digestion Model No. 1 (ADM1) for a Specific Industrial Wastewater: Opium Alkaloid Effluents. Chem. Eng. J. 2010, 165, 89–94. [Google Scholar] [CrossRef]
- Crestaux, T.; Le Maitre, O.; Martinez, J.-M. Polynomial Chaos Expansion for Sensitivity Analysis. Reliab. Eng. Syst. Saf. 2009, 94, 1161–1172. [Google Scholar] [CrossRef]
- Minh, L.Q.; Duong, P.L.T.; Lee, M. Global Sensitivity Analysis and Uncertainty Quantification of Crude Distillation Unit Using Surrogate Model Based on Gaussian Process Regression. Ind. Eng. Chem. Res. 2018, 57, 5035–5044. [Google Scholar] [CrossRef]
- Cao, M.; Alkayem, N.F.; Pan, L.; Novák, D. Advanced Methods in Neural Networks-Based Sensitivity Analysis with Their Applications in Civil Engineering; IntechOpen: London, UK, 2016; ISBN 978-953-51-2705-5. [Google Scholar]
- Fathaddin, M.T.; Arshanda, M.I.; Rachman, Y.A.; Putra, E.A.P.; Nugrahanti, A.; Kasmungin, S. Sensitivity Analysis in Using of Artificial Neural Network Models to Determine Infill Well Locations in a Mature Oil Field. IOP Conf. Ser. Earth Environ. Sci. 2018, 212, 012070. [Google Scholar] [CrossRef]
Publisher’s Note: MDPI stays neutral with regard to jurisdictional claims in published maps and institutional affiliations. |
© 2022 by the authors. Licensee MDPI, Basel, Switzerland. This article is an open access article distributed under the terms and conditions of the Creative Commons Attribution (CC BY) license (https://creativecommons.org/licenses/by/4.0/).