Article

Using Formic Acid to Promote Bacterial Cellulose Production and Analysis of Its Material Properties for Food Packaging Applications

by
Tzu-Yu Chen
1,
Shella Permatasari Santoso
2,3 and
Shin-Ping Lin
1,4,5,*
1
School of Food Safety, Taipei Medical University, 250 Wu-Hsing Street, Taipei 11031, Taiwan
2
Department of Biochemistry and Molecular Cell Biology, School of Medicine, Taipei Medical University, 250 Wu-Hsing Street, Taipei 11031, Taiwan
3
Department of Chemical Engineering, Widya Mandala Surabaya Catholic University, Kalijudan 37, Surabaya 60114, Indonesia
4
Research Center of Biomedical Device, Taipei Medical University, 250 Wu-Hsing Street, Taipei 11031, Taiwan
5
TMU Research Center for Digestive Medicine, Taipei Medical University, 250 Wu-Hsing Street, Taipei 11031, Taiwan
*
Author to whom correspondence should be addressed.
Fermentation 2022, 8(11), 608; https://doi.org/10.3390/fermentation8110608
Submission received: 13 October 2022 / Revised: 31 October 2022 / Accepted: 2 November 2022 / Published: 4 November 2022
(This article belongs to the Special Issue Cellulose Valorization in Biorefinery)

Abstract

:
Bacterial cellulose (BC) is a microbial cellulose that presents various characteristics such as high mechanical strength, high water content, and great biocompatibility and biodegradability. Therefore, it provides great potential to be applied in functional packaging applications. In this study, formic acid (80 µg/mL) was found to promote BC production (a 23% increase in yield from 5.18 to 6.38 g/L) utilizing quorum sensing-related gene (ginI) induction within 5 days of cultivation. The enhancement in BC relied on the addition of FA in static culture, and there was no need to shift to another production system, thus providing an economical approach for industrial production. The characteristic analysis showed that the induced BC still retained its high water-holding capacity (98.4%) with no other structure, morphology, or property changes including chemical groups, crystallinity (80.4%), and thermostability (with Tmax at 360 °C). Analysis of the produced BC showed that it is a suitable, ecofriendly biomaterial for food packaging, and its further evaluation will be accomplished in future studies.

1. Introduction

Cellulose is a water-insoluble polysaccharide [1] known as the most abundant, renewable, and inexpensive polymer [2], which can be obtained from plants, animals, and microorganisms. Mostly, plant cellulose has hemicellulose, lignin, and pectin and thus needs to undergo treatment to obtain the pure product [3]. Animal cellulose is found in tunicate and provides limited applications due to its low productivity [4].
Bacterial cellulose (BC) is a type of nanoscale cellulose produced by microorganisms [5]. The intricate network of cellulose nanofibers within the nano scale consists of the beta-1, 4 glucan chain with the molecular formula (C6H10O5)n. The glucan chains are held together by inter- and intra- hydrogen bonding [6]. Compared to plant cellulose, BC is composed of cellulose without other impurities (lignin, pectin, and hemicellulose) [7]. Therefore, BC exhibits extremely different material properties such as high crystallinity [8], high water-holding capacity [9], and mechanical properties [10], as well as biodegradability [11] and biocompatibility [12]. Due to its special material properties, BC has garnered great attention in biomedical and food packaging applications. However, the high cost of BC production limits its wide application at an industrial level. Static culture is the most primitive method of BC production, and is widely used due to its simplicity without the need for complex instruments such as a bioreactor. A solid hydrogel might be produced at the liquid–air interface after 5 to 20 days depending on the BC-producing strain and its medium under static culture. Thus far, most studies on BC production focused on establishing a production system [13], optimizing the culture conditions [14], identifying new BC-producing strains [15], and using alternative nutrients [16,17]. Nonetheless, these strategies often require additional costs, processing, or instruments to achieve improvements in BC production. Finding a simple, cost-effective approach has become an important issue for scaling up BC production.
Quorum sensing (QS) is a well-known communication pathway in microorganisms. Most microbes make contact with each other and regulate phenotypes, such as biofilm formation, swarming motility, and specific product production, through signal accumulation. Liu, et al. [18] found that QS plays a crucial role in the BC biosynthesis pathway, and QS induction is mainly regulated by N-acyl-L-homoserine lactones (AHLs), which induce the LuxI/R system to trigger BC production. Iida et al. [19] also revealed that three kinds of AHLs accumulate during BC producer growth leading to QS pathway induction. In the regulatory process, ginI and ginR are considered to be related to the synthesis of AHLs in Komagataeibacter xylinus (K. xylinus). Thus, expressions of these genes are helpful to confirm the regulation of the AHL-induced QS pathway for BC production. Although the QS mechanism in K. xylinus has been proposed, its application for BC production improvement is still not widely studied. Discovering more information on QS-induced BC production is helpful for constructing a more effective production system for BC at the industry level.
Formic acid (FA) is a carboxylic acid that can be obtained from the acid hydrolysis of cellulosic waste [20]. Santoso et al. [16] indicated that BC production can be improved using agriculture waste acid hydrolysates, and further found a correlation between specific FA concentrations and enhanced BC production. In addition, Cheng et al. [21] also demonstrated that FA will induce the QS system of Chromobacterium violaceum (C. violaceum), resulting in an increment in violacein production. According to those results, we assumed that FA addition might provide the same regulation of BC production through QS promotion. This study aimed to investigate the relationship between FA and the QS system in BC production. Furthermore, the effect of FA on BC yield enhancement was also evaluated to determine whether it can be used in current BC production processes. Last but not least, the material properties of the produced BC were analyzed.

2. Materials and Methods

2.1. Materials

K. xylinus ATCC 700178 was used as the BC-producing strain, which was cultured in a CSL-fructose medium in a static condition at 28 °C for 5 days. Cellulase was purchased from Sigma-Aldrich (St. Louis, MO, USA). Fructose and xylose were purchased from Himedia (Mumbai, India). FA was purchased from JT Baker Chemical (Phillipsburg, NJ, USA).

2.2. Microorganisms and Maintenance

Frozen stock (1 mL) of K. xylinus 700178 was added to a 50 mL CSL-fructose medium at 28 °C for 3 days of cultivation. BC pellicles were then broken using a blender for the inoculation (10%) in a 50 mL CSL-fructose medium with different concentrations of FA at 28 °C. After 5 days of culture, the BC pellicles were collected and boiled at 80 °C in 100 mL of a 0.1 N NaOH solution for 30 min and washed in double-distilled (dd)H2O until they became a white color. The obtained translucent BC pellicles were dried utilizing a freeze-drying machine for the following material property analyses.

2.3. Relative Expressions of QS Genes Using a Quantitative Polymerase Chain Reaction (qPCR)

Total RNA was extracted from K. xylinus 700178 using a TRIzolTM Kit (Invitrogen, Carlsbad, CA, USA) according to the protocol of the manufacturer, and then messenger (m)RNA was reverse-transcribed into complementary (c)DNA using a RevertAid First Strand cDNA Synthesis Kit (Thermo Scientific, Waltham, MA, USA). Next, 18~20 ng of cDNA was used to analyze gene expressions using an SYBR Green Real-Time PCR Kit (Geneone, Seoul, Korea). qPCR conditions were as follows: 2 min at 50 °C, 10 min at 95 °C, and 40 cycles of 15 s at 95 °C and 60 s at 60 °C. The qPCR was performed using designed forward and reverse primers (gyrB-F, 5′-TCTCGTCACAGACCAAGGACAAG-3′ and gyrB-R, 5′-TTCCTTGGGGTGGGTTTCAAAC-3′; and ginI-F, 5′-TGTGGCCAATGAGCAGTGGG-3′ and ginI-R, 5′-ACCGGGTGATTTCCCAGACC-3′. The abundance was normalized to the gyrB housekeeping gene.

2.4. Characteristic Analysis of BC

2.4.1. Scanning Electron Microscopy (SEM)

The surface of freeze-dried BC pellicles was coated with nano-gold and detected by SEM at an accelerating voltage of 5 kV (Hitachi S-4800 Field Emission Scanning Electron Microscope, Tokyo, Japan) with 30,000× image magnification. Fiber size measurements were conducted using image processing software (ImageJ, National Institute of Science and Technology, Gaithersburg, MD, USA).

2.4.2. X-ray Diffraction (XRD)

The freeze-dried BC film was pulverized into BC powder using a homogenizer (Prep-CB24, Clubio, Lionbio, New Taipei City, Taiwan) to avoid a preferred orientation [22]. To determine the crystallinity of the produced BC, XRD patterns were collected on an X-ray powder diffractometer (X Pert PRO model, Nalytical, Almelo, The Netherlands) using a copper X-ray source. Scans were collected at 4°/min from 5° to 40° 2θ. The crystallinity was calculated using an XRD deconvolution method [8] by collecting the peak area from 14°, 16°, 22°, 34°, and 21.5° (assigned to the amorphous region).

2.4.3. Fourier Transform Infrared (FTIR)

Attenuated total reflectance FTIR spectroscopy (PerkinElmer, Wellesley, MA, USA) was selected to evaluate the chemical group changes on the surface of FA-induced BC. The investigated spectral range was from 4000 to 1000 cm−1. The signal was obtained by averaging 30 scans at a resolution of 1 cm−1.

2.4.4. Thermogravimetric Analysis (TGA)

To analyze the thermostability of BC produced by the addition of different amounts of FA, weight changes under different temperatures were examined using a thermogravimetric analyzer (Pyris 1 model, PerkinElmer, Waltham, MA, USA). For the thermal decomposition behavior test, BC samples were dried at 80 °C before undergoing an N2 purge (40 mL/min) in a temperature range of 80~650 °C at a heating rate of 10 °C/min.

2.4.5. Water Content

To calculate the water content of BC, the wet and dry weights of BC were detected, and it was calculated using the following equation:
Water   content   % = W t W 0 / W t × 100 % ;  
where W0 and Wt represent the weight of dried BC and wet BC, respectively.

2.5. Statistical Analysis

Statistical evaluation of all experimental data (variation from basal values) was performed using an analysis of variance (ANOVA). Post-hoc comparisons with the negative control were performed with Tukey’s test. Statistical analyses were conducted with IBM SPSS Statistics 19 (IBM, Armonk, NY, USA) with p < 0.05 considered significant.

3. Results and Discussion

3.1. Effects of Different Concentrations of FA on BC Production

BC production and biomass using different concentrations of added FA of 40 to 320 µg/mL are presented in Figure 1. The highest BC yield (Figure 1a) was found in the 80 µg/mL FA-addition group (6.38 g/L) and showed a significant 23% increase compared to the control group (5.17 g/L). In the biomass result (Figure 1b), no groups showed a correlation with the results of BC production, which suggests that the enhancement of BC with FA treatment was not due to cell growth. In a past study, BC production was optimized using different carbon sources and nitrogen sources, but optimization often increased both the BC and biomass [23]. However, our results (Figure 1) showed that the addition of FA caused a special signal to initiate the BC production synthesis pathway.
Interestingly, our results are similar to those of Cheng, Hsiao, Hou, Hsieh, Hsu, Chen, and Lin [21]. Their study indicated that a specific FA concentration (160 µg/mL) improved violacein production in C. violaceum without an increase in the bacterial number. Furthermore, bacterial growth would be inhibited under a much higher FA concentration than 160 µg/mL. A higher concentration of FA treatment will inhibit the C. violaceum growth but not influence K. xylinus growth, which might be due to the high tolerance of K. xylinus for FA [16].

3.2. Effects of FA on QS-Related Genes Involved in BC Production

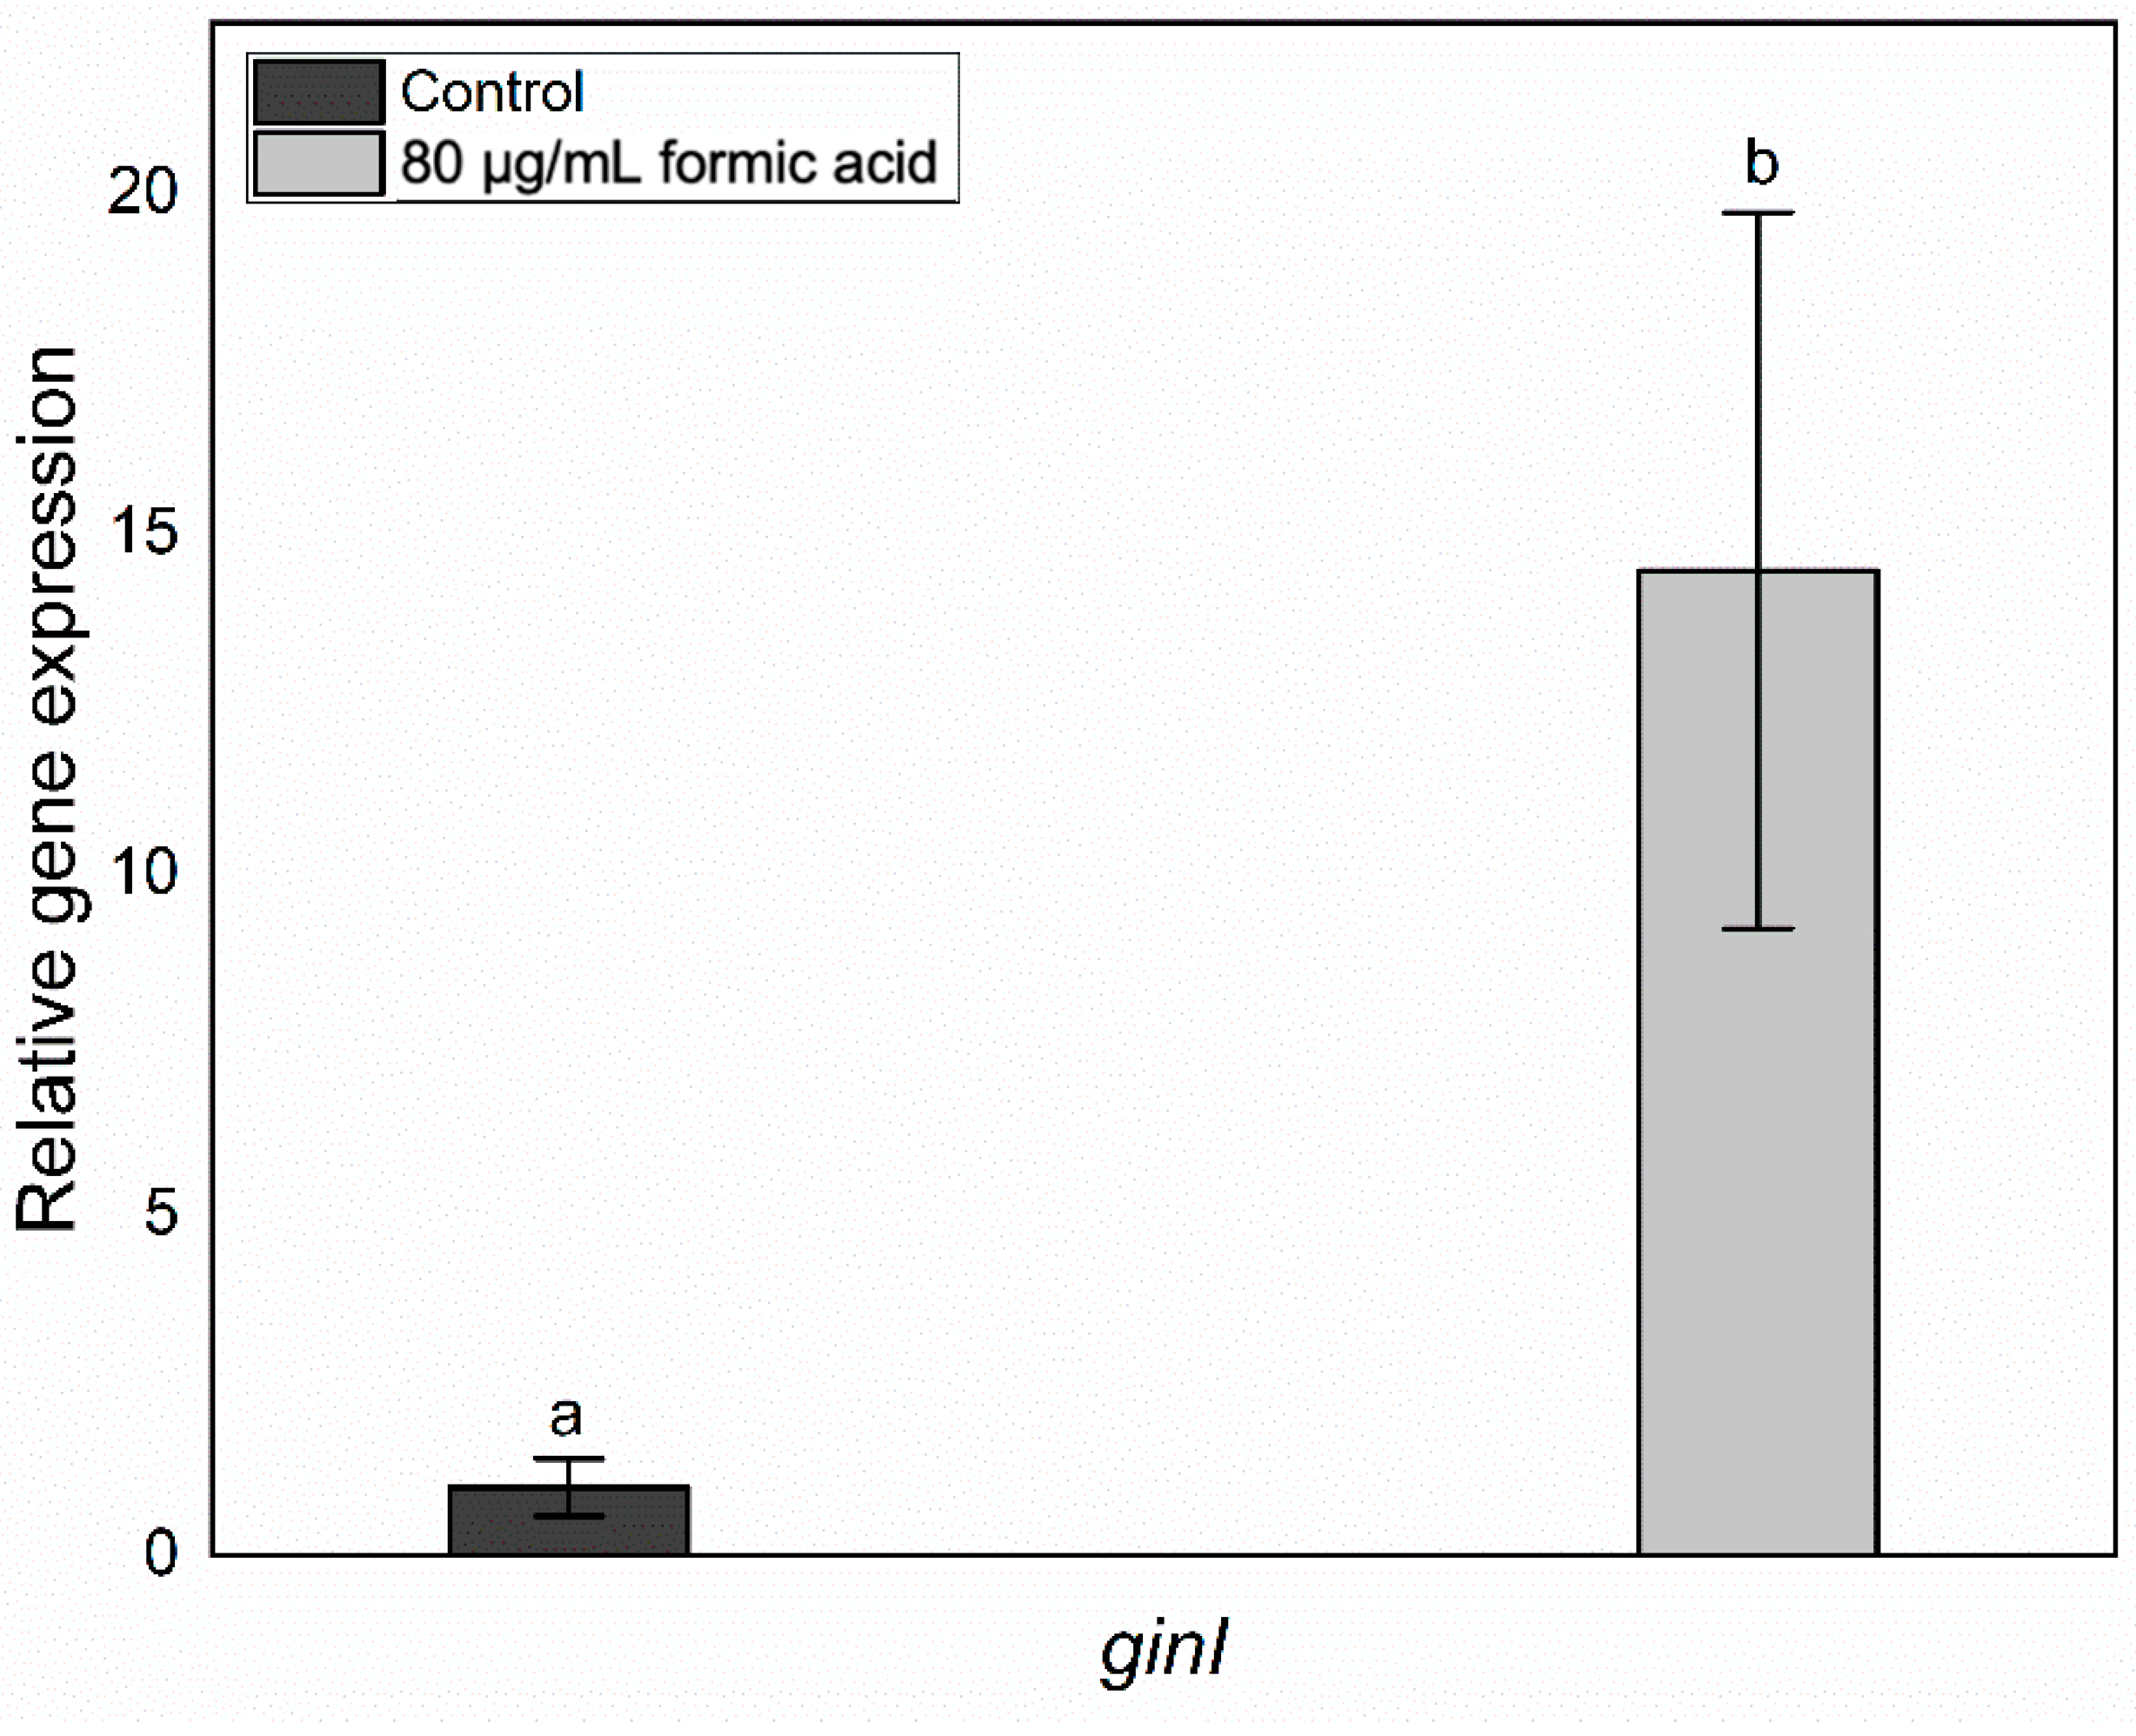
In order to explore the relationship between FA addition and the increase in BC production, the QS-related gene, ginI, was selected to confirm whether the QS pathway was induced by FA treatment [18]. The qPCR results (Figure 2) demonstrated that the ginI gene was significantly expressed at 80 µg/mL FA induction compared to the control. The GinI–GinR system, a kind of common Gram-negative bacterial QS system (LuxR–LuxI system) homolog, was found in Gluconacetobacter intermedius [24]. The GinI–GinR system can regulate the QS system by controlling autoinducer synthesis. Zhang, et al. [25] also indicated that luxR gene expression reached 38-fold, which caused a 15.6% increase in BC production by K. xylinus. Therefore, the results in Figure 2 show [25] that the effect of FA addition was of major importance in regulating the QS system to increase BC production. However, the induction of QS by the GinI–GinR system or its upstream genes as regulated by FA still needs to be confirmed. In fact, most QS-related studies focus on biofilm formation [26], spore formation [27], and virulence factor regulation [28]. However, it has attracted more attention in the application of regulating biosynthesis pathways in recent years. Kim, et al. [29] established an expression system of recombinant Escherichia coli (E. coli) with the QS gene as a regulator to produce bisabolene, which can enhance its production by 44%. In addition, the QS system can also balance strain growth and product synthesis to alleviate the toxicity of end products and intermediates [30]. More information on QS regulation in BC production will be helpful to establish the QS overexpression system in K. xylinus in the same manner as the E. coli system.
In many QS-related studies, autoinducers such as N-acyl-l-homoserine lactones (AHLs) were added to induce the QS mechanism to improve the target product. Morohoshi et al. [31] added a long-chain AHL to enhance violacein production. Wang et al. [32] tried to co-culture microalgae with bacteria to accumulate an AHL concentration to induce the extracellular production of polymeric substances. There are many strategies to promote the QS mechanism using autoinducer induction, but all of these autoinducers present high costs. Therefore, FA can be considered as a replacement strategy for autoinducers.

3.3. Morphology of the Produced BC

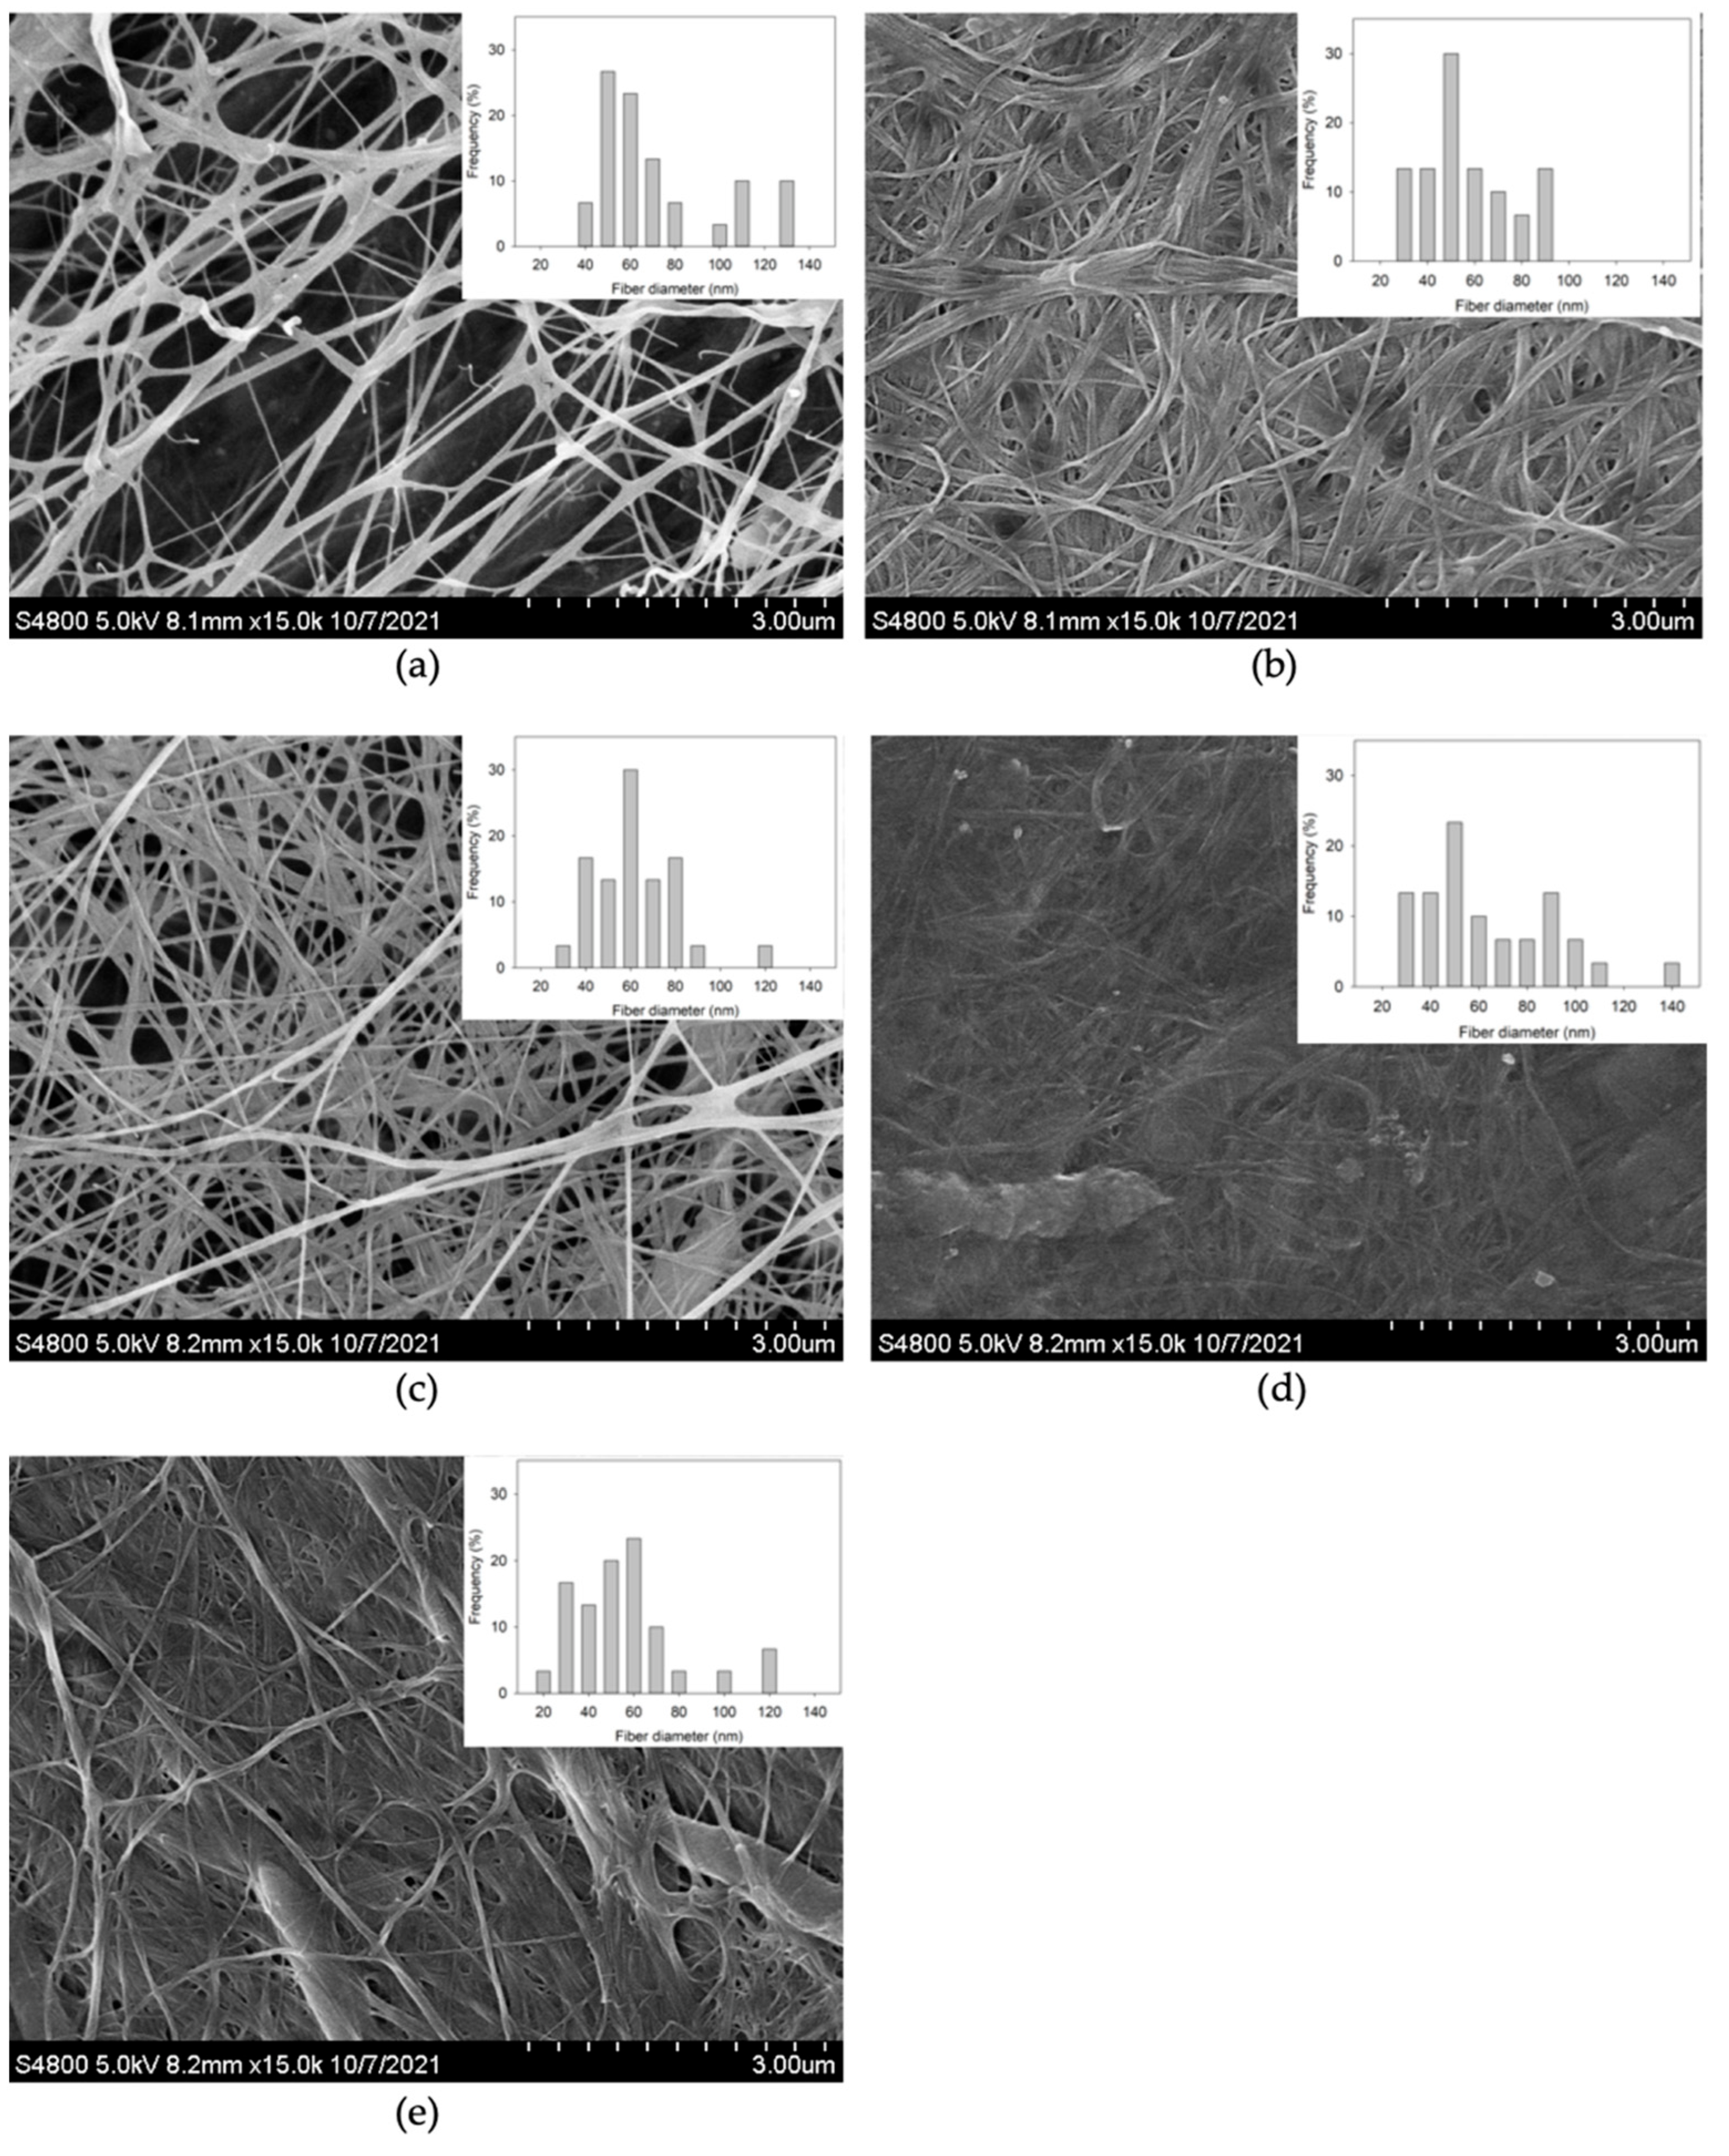
BC has many unique applications, such as surface coatings, due to its nanoscale fiber sizes [33]. This property also differs from plant cellulose with microscale fibers [7]. In the visualization of SEM results (Figure 3), BC samples presented a network structure with nanoscale fibers of 52~68 nm (Table 1). Fiber sizes did not significantly differ in any of the BC groups. This was similar to the results of a previous nutrient optimization study [34].
In some cases, the fiber size of BC increased when certain additives, such as carboxymethyl cellulose [35], microcrystalline cellulose [13], and chitosan [36], were added to the medium during BC production. Additives being incorporated into the BC fibers not only changed the fiber sizes but also increased BC production [37]. In this study, the concentration of added FA was too low to be incorporated into the BC fibers. The FTIR results also proved that no FA-related signal peak existed in the spectrum of the produced BC (Figure 4b), which suggests that FA’s effect of increasing BC production may have been due to its function as a QS induction mechanism. The FA addition did not change the structure of the produced BC, which may suggest there is no need to alter the BC post-processing step after production. In some BC production improvement-related studies, impurities need to be removed from BC, which resulted in extra processing costs [38]. Furthermore, the distribution of the fiber size (Figure 3) was mainly 40 to 80 nm. For drug-delivery applications, the nanoscale fiber can allow the drug to be adsorbed on its surface and slowly released out of the fiber [39]. Meanwhile, its tight fiber structure can prevent microorganisms from passing through the BC film and form a physical barrier for wound dressing or food packaging purposes [40].

3.4. Characterization of the Produced BC

XRD patterns were used to confirm the crystal type of the produced BC (Figure 4a) and indicated that all of the BC groups presented three major peaks at diffraction angles of 14.4°, 16.7°, and 22.5°, which correspond to the cellulose Iα form [7]. Moreover, one slight peak existed at 34.7° in all BC samples, which demonstrated that no preferred orientation appeared, which indicated that the degree of ground BC samples was sufficient [22]. In the crystallinity results (Table 1), all BC samples ranged from 80.4% to 84% and exhibited no significant difference from each other. The crystallinity results also showed no correlation with the different concentrations of added FA. A previous study demonstrated that organic acid treatment changed the amorphous region on the BC surface [41] resulting in crystallinity decreasing. However, we did not find the same result in our study, which indicated that the concentration of FA used will not influence the BC crystal structure.
In the FTIR results of all BC samples (Figure 4b), the characteristic peak of stretching of O-H groups was observed at 3350 to 3220 cm−1. Other absorption spectra of chemical groups were detected in the stretching of C-H at 2850~2920 cm−1, bending of H-O-H groups at 1650 cm−1, bending of CH2 at 1428 cm−1, and stretching of C-O groups at 1109 cm−1. These BC characterization peaks were consistent with those of a previous study [42]. According to Molina-Ramírez, et al. [43], using ethanol and acetic acid as inducers in the medium to improve BC production did not influence functional groups on the BC surface. In addition, no proportional relationship was found between the intensity of FA characterization peaks and different concentrations of added FA in the produced BC. Rashid et al. [44] showed that the FA characteristic peak of C-H stretching was at 2929 cm−1. The result indicated that no signal existed at 2929 cm−1, which suggests no FA remained in the BC.
The thermostability of FA-induced BC was investigated using TGA analysis (Figure 4c, Table 1). All of the BC samples showed a single thermal decomposition peak from 339.5 °C to 361.1 °C, which was similar to our previous study [13]. Lin et al. [17] demonstrated that impurities incorporated into BC will cause multiple decomposition peaks generated under different temperatures. The result of a single decomposition peak in each group indicated that without the alteration of the cellulose structure, no impurity existed inside the BC. Among these samples, the 80 µg/mL FA-induced BC group had a maximum thermal degradation temperature of 361.1 °C, which suggests that it would provide the greatest thermostability. A higher thermostability of BC might extend its application in further material processing such as surface modifications.
In the water content results (Table 1), all of the BC samples retained a high water-holding capacity of 98.41% to 98.58%. The water was absorbed between the network structure of BC microfibers instead of interacting with the hydrophilic group of fibers [7]. The similar water content of each group presented indirect evidence that FA induction may not change the microfiber distance or structure. Furthermore, such a high water-holding capacity would allow BC to be used for food trays [45] and functional food packaging [46]. In summary, the results of SEM, XRD, FTIR, and TGA might be indirect evidence that FA was not incorporated into BC.

4. Conclusions

The effects of specific concentrations of FA for BC production were investigated. The results showed that the ginI QS-related gene was induced when utilizing 80 µg/mL FA treatment, and the BC yield further increased by 23%. These findings provide a foundation for a mechanistic understanding of the FA-induced QS system for enhancing BC production. Furthermore, the BC produced from FA induction presented high crystallinity, high water content, and great thermostability. Further analysis of food packaging applications such as water vapor permeability or food storage tests will be evaluated in future work.

Author Contributions

Conceptualization, S.-P.L.; methodology, S.-P.L.; performed the experiments and analyzed the data, T.-Y.C. and S.P.S.; writing and original draft preparation, S.-P.L. All authors have read and agreed to the published version of the manuscript.

Funding

This work was financially supported by Taipei Medical University and the Ministry of Science and Technology, Taiwan, through research grants with contract nos. MOST109-2222-E-038-004, MOST110-2813-C-038-228-E, and MOST110-2221-E-038-003-MY3.

Institutional Review Board Statement

Not applicable.

Informed Consent Statement

Not applicable.

Data Availability Statement

All data are contained within the article.

Conflicts of Interest

The authors declare no conflict of interest.

References

  1. Brown, R.M., Jr. Cellulose structure and biosynthesis: What is in store for the 21st century? J. Polym. Sci. Part A Polym. Chem. 2004, 42, 487–495. [Google Scholar] [CrossRef]
  2. Esa, F.; Tasirin, S.M.; Abd Rahman, N. Overview of bacterial cellulose production and application. Agric. Agric. Sci. Procedia 2014, 2, 113–119. [Google Scholar] [CrossRef] [Green Version]
  3. Choi, S.M.; Shin, E.J. The nanofication and functionalization of bacterial cellulose and its applications. Nanomaterials 2020, 10, 406. [Google Scholar] [CrossRef] [PubMed] [Green Version]
  4. Wu, S.; Ning, D.; Xu, D.; Cheng, Y.; Mondal, A.K.; Zou, Q.; Zhu, H.; Huang, F. Preparation and characterization of super hydrophobic aerogels derived from tunicate cellulose nanocrystals. Carbohydr. Res. 2022, 511, 108488. [Google Scholar] [CrossRef] [PubMed]
  5. Nakagaito, A.; Iwamoto, S.; Yano, H. Bacterial cellulose: The ultimate nano-scalar cellulose morphology for the production of high-strength composites. Appl. Phys. A 2005, 80, 93–97. [Google Scholar] [CrossRef]
  6. Ul-Islam, M.; Khan, T.; Park, J.K. Water holding and release properties of bacterial cellulose obtained by in situ and ex situ modification. Carbohydr. Polym. 2012, 88, 596–603. [Google Scholar] [CrossRef]
  7. Lin, S.-P.; Calvar, I.L.; Catchmark, J.M.; Liu, J.-R.; Demirci, A.; Cheng, K.-C. Biosynthesis, production and applications of bacterial cellulose. Cellulose 2013, 20, 2191–2219. [Google Scholar] [CrossRef]
  8. Park, S.; Baker, J.O.; Himmel, M.E.; Parilla, P.A.; Johnson, D.K. Cellulose crystallinity index: Measurement techniques and their impact on interpreting cellulase performance. Biotechnol. Biofuels 2010, 3, 1–10. [Google Scholar] [CrossRef] [Green Version]
  9. Schrecker, S.; Gostomski, P. Determining the water holding capacity of microbial cellulose. Biotechnol. Lett. 2005, 27, 1435–1438. [Google Scholar] [CrossRef]
  10. Dayal, M.S.; Catchmark, J.M. Mechanical and structural property analysis of bacterial cellulose composites. Carbohydr. Polym. 2016, 144, 447–453. [Google Scholar] [CrossRef]
  11. Wang, B.; Lv, X.; Chen, S.; Li, Z.; Sun, X.; Feng, C.; Wang, H.; Xu, Y. In vitro biodegradability of bacterial cellulose by cellulase in simulated body fluid and compatibility in vivo. Cellulose 2016, 23, 3187–3198. [Google Scholar] [CrossRef]
  12. Helenius, G.; Bäckdahl, H.; Bodin, A.; Nannmark, U.; Gatenholm, P.; Risberg, B. In vivo biocompatibility of bacterial cellulose. J. Biomed. Mater. Res. Part A 2006, 76, 431–438. [Google Scholar] [CrossRef]
  13. Lin, S.-P.; Liu, C.-T.; Hsu, K.-D.; Hung, Y.-T.; Shih, T.-Y.; Cheng, K.-C. Production of bacterial cellulose with various additives in a PCS rotating disk bioreactor and its material property analysis. Cellulose 2016, 23, 367–377. [Google Scholar] [CrossRef]
  14. Santoso, S.P.; Chou, C.-C.; Lin, S.-P.; Soetaredjo, F.E.; Ismadji, S.; Hsieh, C.-W.; Cheng, K.C. Enhanced production of bacterial cellulose by Komactobacter intermedius using statistical modeling. Cellulose 2020, 27, 2497–2509. [Google Scholar] [CrossRef]
  15. Lin, S.-P.; Huang, Y.-H.; Hsu, K.-D.; Lai, Y.-J.; Chen, Y.-K.; Cheng, K.-C. Isolation and identification of cellulose-producing strain Komagataeibacter intermedius from fermented fruit juice. Carbohydr. Polym. 2016, 151, 827–833. [Google Scholar] [CrossRef]
  16. Santoso, S.P.; Lin, S.-P.; Wang, T.-Y.; Ting, Y.; Hsieh, C.-W.; Yu, R.-C.; Angkawijaya, A.E.; Soetaredjo, F.E.; Hsu, H.-Y.; Cheng, K.-C. Atmospheric cold plasma-assisted pineapple peel waste hydrolysate detoxification for the production of bacterial cellulose. Int. J. Biol. Macromol. 2021, 175, 526–534. [Google Scholar] [CrossRef]
  17. Lin, S.-P.; Huang, S.-H.; Ting, Y.; Hsu, H.-Y.; Cheng, K.-C. Evaluation of detoxified sugarcane bagasse hydrolysate by atmospheric cold plasma for bacterial cellulose production. Int. J. Biol. Macromol. 2022, 204, 136–143. [Google Scholar] [CrossRef]
  18. Liu, M.; Liu, L.; Jia, S.; Li, S.; Zou, Y.; Zhong, C. Complete genome analysis of Gluconacetobacter xylinus CGMCC 2955 for elucidating bacterial cellulose biosynthesis and metabolic regulation. Sci. Rep. 2018, 8, 6266. [Google Scholar] [CrossRef] [Green Version]
  19. Iida, A.; Ohnishi, Y.; Horinouchi, S. Control of acetic acid fermentation by quorum sensing via N-acylhomoserine lactones in Gluconacetobacter intermedius. J. Bacteriol. 2008, 190, 2546–2555. [Google Scholar] [CrossRef] [Green Version]
  20. Lin, S.-P.; Kuo, T.-C.; Wang, H.-T.; Ting, Y.; Hsieh, C.-W.; Chen, Y.-K.; Hsu, H.-Y.; Cheng, K.-C. Enhanced bioethanol production using atmospheric cold plasma-assisted detoxification of sugarcane bagasse hydrolysate. Bioresour. Technol. 2020, 313, 123704. [Google Scholar] [CrossRef]
  21. Cheng, K.-C.; Hsiao, H.-C.; Hou, Y.-C.; Hsieh, C.-W.; Hsu, H.-Y.; Chen, H.-Y.; Lin, S.-P. Improvement in violacein production by utilizing formic acid to induce quorum sensing in Chromobacterium violaceum. Antioxidant 2022, 11, 849. [Google Scholar] [CrossRef] [PubMed]
  22. French, A.D. Idealized powder diffraction patterns for cellulose polymorphs. Cellulose 2014, 21, 885–896. [Google Scholar] [CrossRef]
  23. Andriani, D.; Apriyana, A.Y.; Karina, M. The optimization of bacterial cellulose production and its applications: A review. Cellulose 2020, 27, 6747–6766. [Google Scholar] [CrossRef]
  24. Iida, A.; Ohnishi, Y.; Horinouchi, S. Identification and characterization of target genes of the GinI/GinR quorum-sensing system in Gluconacetobacter intermedius. Microbiology 2009, 155, 3021–3032. [Google Scholar] [CrossRef] [PubMed] [Green Version]
  25. Zhang, T.-Z.; Liu, L.-P.; Ye, L.; Li, W.-C.; Xin, B.; Xie, Y.-Y.; Jia, S.-R.; Wang, T.-F.; Zhong, C. The production of bacterial cellulose in Gluconacetobacter xylinus regulated by luxR overexpression of quorum sensing system. Appl. Microbiol. Biotechnol. 2021, 105, 7801–7811. [Google Scholar] [CrossRef]
  26. Das, S.; Das, S.; Ghangrekar, M. Bacterial signalling mechanism: An innovative microbial intervention with multifaceted applications in microbial electrochemical technologies: A review. Bioresour. Technol. 2022, 344, 126218. [Google Scholar] [CrossRef]
  27. Ansaldi, M.; Marolt, D.; Stebe, T.; Mandic-Mulec, I.; Dubnau, D. Specific activation of the Bacillus quorum-sensing systems by isoprenylated pheromone variants. Mol. Microbiol. 2002, 44, 1561–1573. [Google Scholar] [CrossRef]
  28. Haque, S.; Ahmad, F.; Dar, S.A.; Jawed, A.; Mandal, R.K.; Wahid, M.; Lohani, M.; Khan, S.; Singh, V.; Akhter, N. Developments in strategies for Quorum Sensing virulence factor inhibition to combat bacterial drug resistance. Microb. Pathog. 2018, 121, 293–302. [Google Scholar] [CrossRef]
  29. Kim, E.-M.; Woo, H.M.; Tian, T.; Yilmaz, S.; Javidpour, P.; Keasling, J.D.; Lee, T.S. Autonomous control of metabolic state by a quorum sensing (QS)-mediated regulator for bisabolene production in engineered E. coli. Metab. Eng. 2017, 44, 325–336. [Google Scholar] [CrossRef] [Green Version]
  30. Shen, Y.-P.; Fong, L.S.; Yan, Z.-B.; Liu, J.-Z. Combining directed evolution of pathway enzymes and dynamic pathway regulation using a quorum-sensing circuit to improve the production of 4-hydroxyphenylacetic acid in Escherichia coli. Biotechnol. Biofuels 2019, 12, 1–11. [Google Scholar] [CrossRef]
  31. Morohoshi, T.; Kato, M.; Fukamachi, K.; Kato, N.; Ikeda, T. N-acylhomoserine lactone regulates violacein production in Chromobacterium violaceum type strain ATCC 12472. FEMS Microbiol. Lett. 2008, 279, 124–130. [Google Scholar] [CrossRef] [Green Version]
  32. Wang, H.; Wu, P.; Zheng, D.; Deng, L.; Wang, W. N-Acyl-homoserine lactone (AHL)-mediated microalgal–bacterial communication driving chlorella-activated sludge bacterial biofloc formation. Environ. Sci. Technol. 2022, 56, 12645–12655. [Google Scholar] [CrossRef]
  33. Ruhs, P.A.; Malollari, K.G.; Binelli, M.R.; Crockett, R.; Balkenende, D.W.; Studart, A.R.; Messersmith, P.B. Conformal bacterial cellulose coatings as lubricious surfaces. ACS Nano 2020, 14, 3885–3895. [Google Scholar] [CrossRef]
  34. Padmanabhan, S.K.; Lionetto, F.; Nisi, R.; Stoppa, M.; Licciulli, A. Sustainable production of stiff and crystalline bacterial cellulose from orange peel extract. Sustainability 2022, 14, 2247. [Google Scholar] [CrossRef]
  35. De Lima Fontes, M.; Meneguin, A.B.; Tercjak, A.; Gutierrez, J.; Cury, B.S.F.; Dos Santos, A.M.; Ribeiro, S.J.; Barud, H.S. Effect of in situ modification of bacterial cellulose with carboxymethylcellulose on its nano/microstructure and methotrexate release properties. Carbohydr. Polym. 2018, 179, 126–134. [Google Scholar] [CrossRef] [Green Version]
  36. Ul-Islam, M.; Subhan, F.; Islam, S.U.; Khan, S.; Shah, N.; Manan, S.; Ullah, M.W.; Yang, G. Development of three-dimensional bacterial cellulose/chitosan scaffolds: Analysis of cell-scaffold interaction for potential application in the diagnosis of ovarian cancer. Int. J. Biol. Macromol. 2019, 137, 1050–1059. [Google Scholar] [CrossRef]
  37. Lin, S.-P.; Hsieh, S.-C.; Chen, K.-I.; Demirci, A.; Cheng, K.-C. Semi-continuous bacterial cellulose production in a rotating disk bioreactor and its materials properties analysis. Cellulose 2014, 21, 835–844. [Google Scholar] [CrossRef]
  38. Ciecholewska-Juśko, D.; Broda, M.; Żywicka, A.; Styburski, D.; Sobolewski, P.; Gorący, K.; Migdał, P.; Junka, A.; Fijałkowski, K. Potato juice, a starch industry waste, as a cost-effective medium for the biosynthesis of bacterial cellulose. Int. J. Mol. Sci. 2021, 22, 10807. [Google Scholar] [CrossRef]
  39. Adepu, S.; Khandelwal, M. Drug release behaviour and mechanism from unmodified and in situ modified bacterial cellulose. Proc. Indian Natl. Sci. Acad. 2021, 87, 110–120. [Google Scholar] [CrossRef]
  40. Gorgieva, S. Bacterial cellulose as a versatile platform for research and development of biomedical materials. Processes 2020, 8, 624. [Google Scholar] [CrossRef]
  41. Lee, K.-Y.; Quero, F.; Blaker, J.J.; Hill, C.A.; Eichhorn, S.J.; Bismarck, A. Surface only modification of bacterial cellulose nanofibres with organic acids. Cellulose 2011, 18, 595–605. [Google Scholar] [CrossRef] [Green Version]
  42. Gao, H.; Sun, Q.; Han, Z.; Li, J.; Liao, B.; Hu, L.; Huang, J.; Zou, C.; Jia, C.; Huang, J. Comparison of bacterial nanocellulose produced by different strains under static and agitated culture conditions. Carbohydr. Polym. 2020, 227, 115323. [Google Scholar] [CrossRef] [PubMed]
  43. Molina-Ramírez, C.; Enciso, C.; Torres-Taborda, M.; Zuluaga, R.; Gañán, P.; Rojas, O.J.; Castro, C. Effects of alternative energy sources on bacterial cellulose characteristics produced by Komagataeibacter medellinensis. Int. J. Biol. Macromol. 2018, 117, 735–741. [Google Scholar] [CrossRef] [PubMed]
  44. Rashid, T.; Kait, C.F.; Murugesan, T. A “Fourier Transformed infrared” compound study of lignin recovered from a formic acid process. Procedia Eng. 2016, 148, 1312–1319. [Google Scholar] [CrossRef] [Green Version]
  45. Jebel, F.S.; Almasi, H. Morphological, physical, antimicrobial and release properties of ZnO nanoparticles-loaded bacterial cellulose films. Carbohydr. Polym. 2016, 149, 8–19. [Google Scholar] [CrossRef]
  46. Wang, L.-F.; Rhim, J.-W. Preparation and application of agar/alginate/collagen ternary blend functional food packaging films. Int. J. Biol. Macromol. 2015, 80, 460–468. [Google Scholar] [CrossRef]
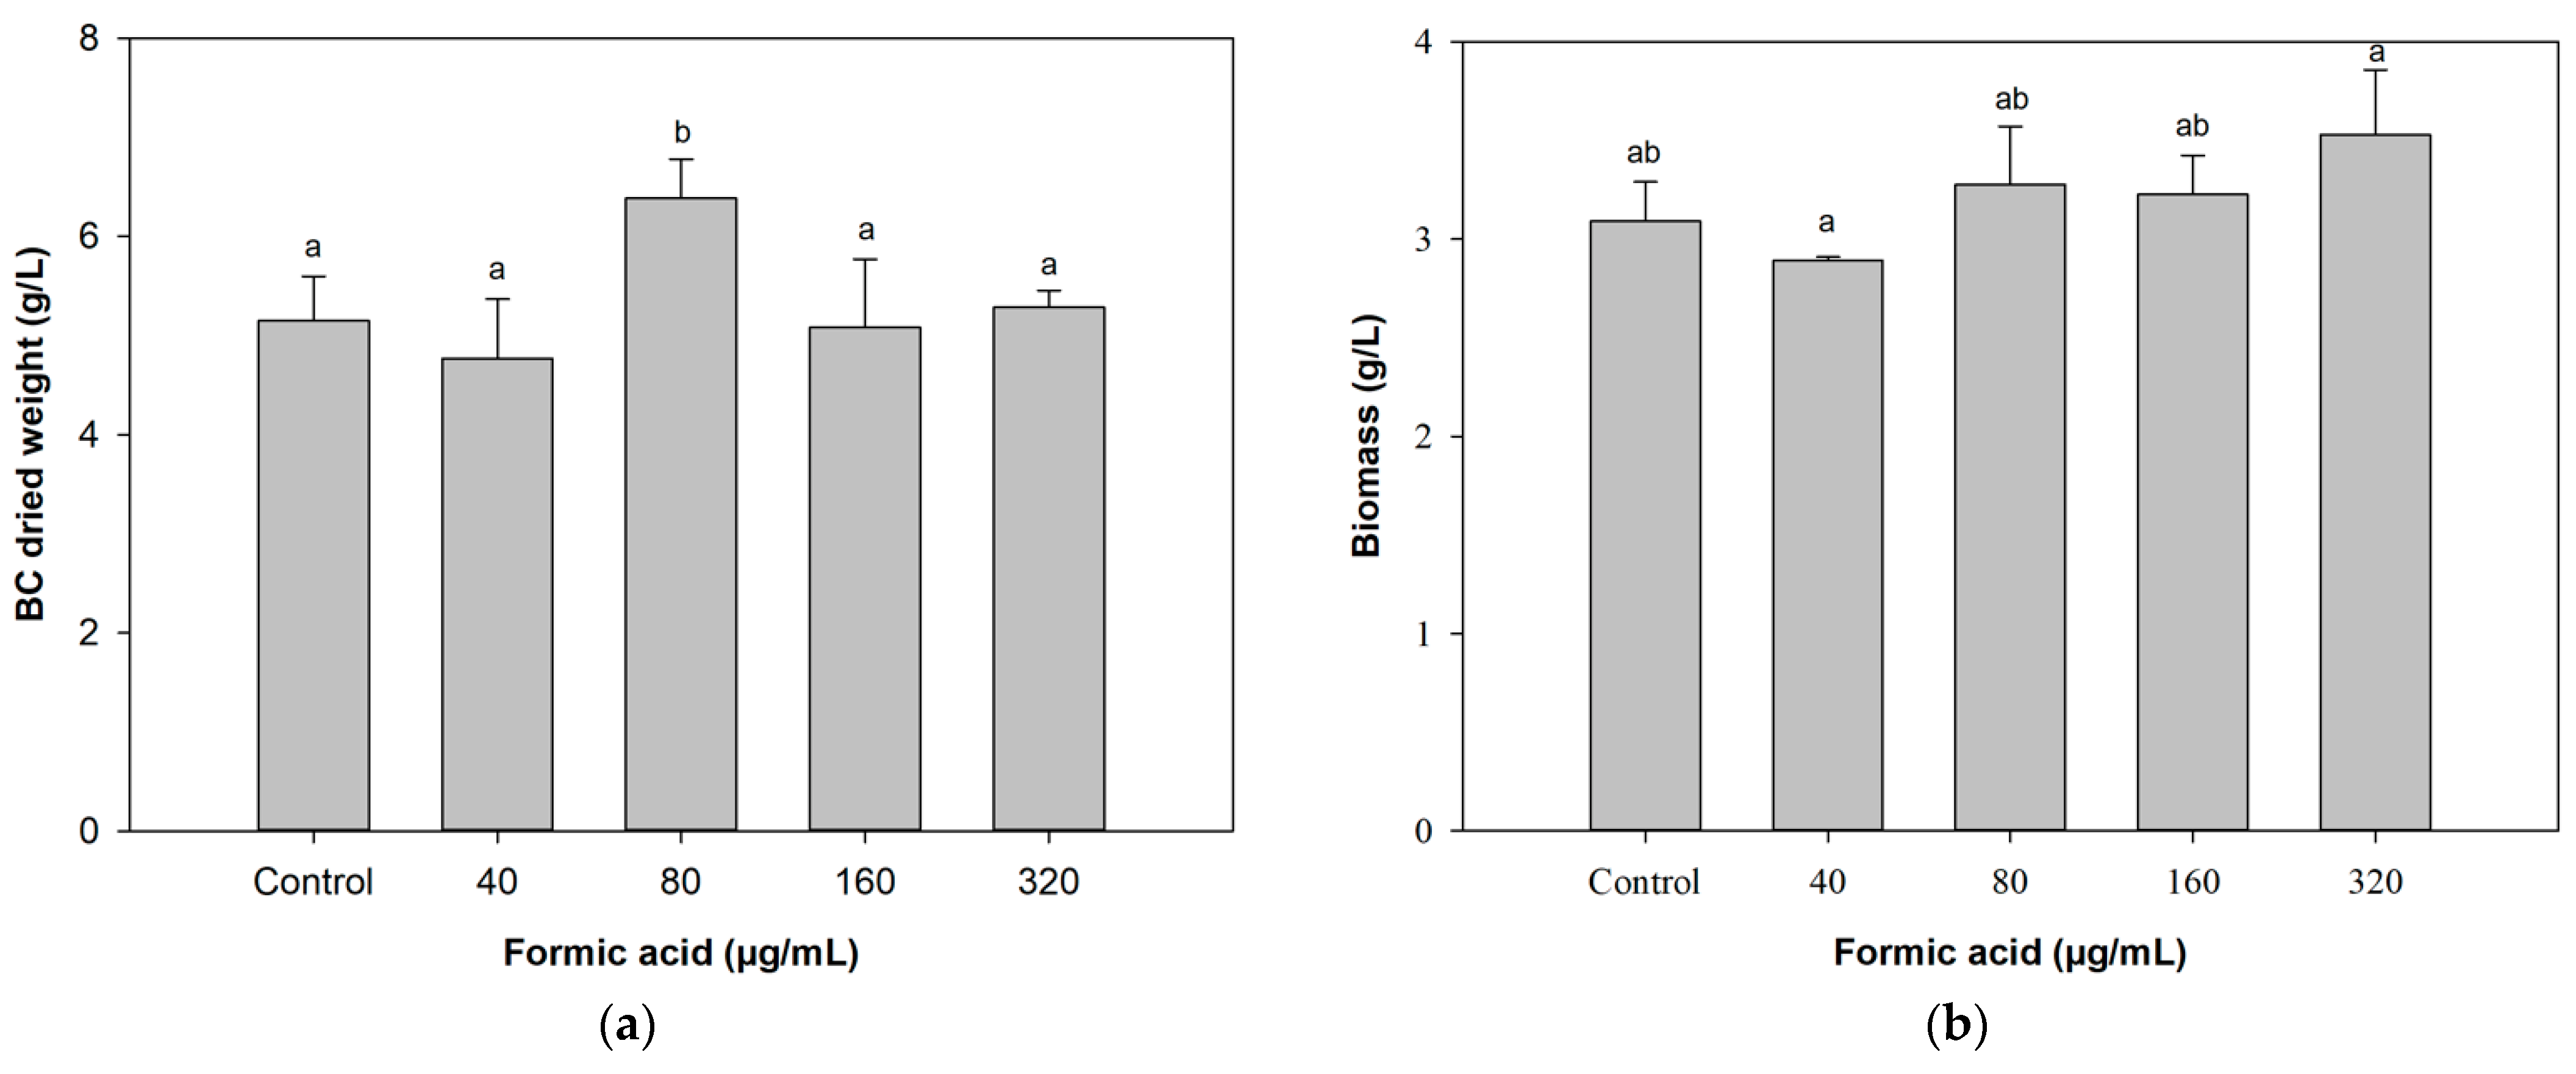
Figure 1. The effect of different FA concentrations on (a) BC yield and (b) biomass. Each value is expressed as mean ± standard deviation (n = 3). Different superscripts are significantly different (p < 0.05).
Fermentation 08 00608 g001
Figure 2. Effect of formic acid (80 µg/mL) on the gene expression of ginI in K. xylinus 700178. Each value is expressed as mean ± standard deviation (n = 3). Different superscripts are significantly different (p < 0.05).
Fermentation 08 00608 g002
Figure 3. Visualization of BC control (a), 40 µg/mL (b), 80 µg/mL (c), 160 µg/mL (d), and 320 µg/mL (e) groups, and its fiber size distribution (n = 30).
Fermentation 08 00608 g003
Figure 4. The material properties of produced BCs. (a) XRD, (b) FTIR, and (c) TGA analysis.
Fermentation 08 00608 g004
Table 1. Material properties of bacterial cellulase (BC) samples.
Addition of FA (µg/mL)Water Content
(%)
Crystallinity
(%)
Major Tpeak
(°C)
Fiber Size Average
(nm)
Control98.47 ± 0.07 a83.1 ± 4 a339.568 ± 27 a
4098.58 ± 0.09 a80.9 ± 3.1 a346.652 ± 17.9 a
8098.41 ± 0.08 a80.4 ± 2.7 a361.157 ± 18.4 a
16098.57 ± 0.01 a84 ± 1.2 a359.360.1 ± 25.7 a
32098.53 ± 0.07 a81.6 ± 1.8 a354.752 ± 23.6 a
Each value is expressed as the mean ± standard deviation (n = 3). The number of replicates for fiber size was 30 for each group. Different superscript letters indicate a significant difference (p < 0.05). FA, formic acid; Tpeak, maximal thermal degradation temperature.
Publisher’s Note: MDPI stays neutral with regard to jurisdictional claims in published maps and institutional affiliations.