Article

Dynamics of Microbiota in Three Backslopped Liquid Sourdoughs That Were Triggered with the Same Starter Strains

1
Porto Conte Ricerche S.r.l., Località Tramariglio n.15, 07041 Alghero, Italy
2
MFM Sunalle, via Ogliastra 10, 08023 Fonni, Italy
*
Author to whom correspondence should be addressed.
These authors contributed equally to this work.
Fermentation 2022, 8(10), 571; https://doi.org/10.3390/fermentation8100571
Submission received: 8 September 2022 / Revised: 13 October 2022 / Accepted: 19 October 2022 / Published: 21 October 2022
(This article belongs to the Special Issue Development and Application of Starter Cultures)

Abstract

:
The preparation of sourdough may include the use of starter microorganisms to address the fermentation process toward specific conditions. The aim of this work was to study the dynamics of the microbial ecosystem in three liquid sourdoughs (SD1, SD2 and SD3) triggered with the same microbial strains. Lactiplantibacillus plantarum (formerly known as Lactobacillus plantarum), Saccharomyces cerevisiae and Candida lambica strains were inoculated as starters, and sourdoughs were differentiated for the fermentation conditions and for the method of starter inoculation. The analyses were performed on the three sourdoughs propagated in the laboratory for 22 days and on the sample SD1, which was transferred to a bakery and refreshed over many months. The dynamics of microbial communities were studied by plate-count analysis and metataxonomic approach. The acidity of sourdough was evaluated over time. Metataxonomic analysis highlighted a large heterogeneity of fungi microbiota in all sourdough preparations, many of them probably originated from the flour, being pathogens of plants. Few yeast species were found, and S. cerevisiae was plentiful but did not predominate over the other species, whereas the C. lambica species decreased over time and then disappeared in all preparations. The bacterial microbiota was less heterogeneous than the fungi microbiota; the species L. plantarum, Leuconostoc citreum and Levilactobacillus brevis (formerly known as Lactobacillus brevis) were always present in all sourdoughs, whereas Fructilactobacillus sanfranciscensis (formerly known as Lactobacillus sanfranciscensis) became the dominant species in bakery-propagated SD1 and in SD2 at the end of the propagation period.

Graphical Abstract

1. Introduction

Spontaneous sourdough is a complex biological system obtained after the fermentation of cereal flour and water by means of bacteria and yeast, mostly deriving from the raw ingredients, the bread-making environment, and the bakers [1]. The microorganisms in sourdough mainly belong to lactic acid bacteria (LAB) and yeast, which ferment the carbohydrates in flour, producing the carbon dioxide responsible for the bread dough rise and other metabolites such as organic acids and alcohols, which are responsible for the organoleptic properties of bread (flavor, texture and shelf life). Since ancient times, sourdough has been used as a natural leavening agent in bread production and shared among artisanal bakers and home-baking communities. Commonly, sourdoughs are classified into four types [2]:
Type I sourdough is derived from a spontaneous fermentation process, which is followed by a daily backslopping, consisting in a cyclic reinoculation of a so-called “mother dough” using a newly prepared batch of flour and water. Fermentation temperature is set between 20–30 °C and the fermentation time ranges from 5 to 24 h. This sourdough can be refrigerated at regular intervals or at occurrence, and it is most commonly used in artisanal bakeries. The dough yield (ratio between the dough obtained and the flour used) is not exceeding 200.
Type II sourdough is obtained when a flour–water mixture is inoculated with LAB and yeast. Fermentation is conducted for one or more days and temperature is set above 30 °C. Sometimes, yeast is added at the final stage of the fermentation process. Sourdough type II is a semiliquid product with a dough yield between 200–300, and for this reason it is usually employed at an industrial scale.
When sourdough type II is commercialized in the form of a semidried product, it is called sourdough type III.
Type IV sourdough is a combination of type II and type I; in fact, the sourdough is obtained by inoculating selected microorganisms in a mixture of flour and water, and thereafter it is maintained by a backslopping procedure according to the type I sourdough method.
The fermentation of sourdough by spontaneous microflora can lead to the unpredictable growth of various microorganisms. The mutation of the sourdough microbial community over time is conditioned by the non-sterile and open-batch conditions of sourdough and by the use of ingredients potential microbial sources, as the flour, the water or the devices which are used in the backslopping process. Moreover, the development and the behavior of microbial species and the competitiveness between species depend on a multitude of factors, such as temperature, dough yield, and microbial metabolites [3]. The use of spontaneously fermented sourdough can result in unstable product quality.
The use of selected LAB and yeasts as a starter in sourdough technology has become a common practice, mainly in industrial production. Starter microorganisms can be used as flavor carriers and texture improvers, or for their antifungal or health-promoting properties, in order to improve the performances and the properties of sourdough [4,5].
When starter microorganisms are inoculated, as in sourdough type IV, there is a competition between the starter microorganisms and the spontaneously growing microorganisms, and if the starter cultures cannot adapt to the sourdough substrate, and to the acidic conditions, then the spontaneously growing microorganisms can dominate [6]. Moreover, De Vuyst and Neysen [7] observed that the persistence of a microbial association over time is dependent on several factors, such as the process parameters (temperature, dough yield, time of fermentation) or microbial competition (bacteriocin production).
Until now, about 70 different species of LAB [8] and 40 species of yeast have been identified in the sourdough environment. Among LAB, L. plantarum, F. sanfranciscensis and L. brevis were the most isolated species in worldwide sourdoughs [4]. Young sourdoughs can harbor a consistent number of spontaneous microorganisms, but they were largely dominated by L. plantarum and L. brevis, while F. sanfranciscensis is considered predominant in traditionally prepared and older sourdoughs [7,9]; in fact, when the sourdough becomes mature, the diversity of microflora decreases, mostly because the organic acids produced by LAB select for acid-tolerant microorganisms [2].
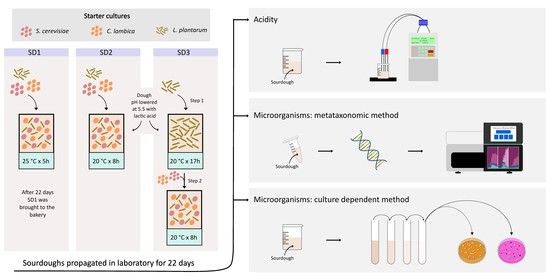
This study describes the dynamics of the microbiota in three liquid sourdoughs that were propagated for 22 days in a laboratory. One of them was also studied after transferring to and propagation in a bakery. The sourdoughs were triggered using the same microbial starter, composed of L. plantarum, S. cerevisiae and C. lambica, with the purpose to guide the fermentation and dominate the mature sourdoughs. The starter strains were inoculated using different methods and sourdoughs were propagated under two different fermentation temperatures, 25 °C and 20 °C, in order to study the behavior of starter strains. To investigate the dynamics of the microbial population, culture-dependent and metataxonomic methods were applied.

2. Materials and Methods

2.1. Microorganisms and Growth Conditions

The strains of L. plantarum PCC1034, S. cerevisiae PCC1662 and C. lambica PCC1649, isolated from Italian sourdoughs and belonging to the culture collection of Porto Conte Ricerche, were used as starters to inoculate a mixture of flour and water. The strains were identified with the instrument MALDI Biotyper (MicroFlex™, Bruker Daltonik GmbH, Bremen, Germany), using the software MBT Compass® 4.1 and the attached libraries (Bruker Daltonik GmbH, Bremen, Germany). The L. plantarum PCC1034 was selected among other strains, belonging to the same species, for its acidification capacity at different growth temperatures. Microbial strains were stored at −80 °C. The LAB strain was routinely propagated in MRS liquid medium (Oxoid, Basingstoke, Hampshire, UK), modified [10] with the addition of fresh yeast extract (5%, v/v) and 1% maltose at a final pH of 5.5 (mMRS), and incubated at 28 °C in anaerobic conditions. The yeast strains were propagated in YEPD liquid medium [10] and incubated at 28 °C under stirring conditions.

2.2. Preparation of Liquid Sourdough and Laboratory Propagation

In order to prepare the liquid sourdough, the selected strains of bacteria and yeast were inoculated in mMRS and YEPD liquid media, respectively, and incubated at 28 °C for 24 h. The next day, 400 μL of the bacterial culture and 200 μL of each yeast culture were inoculated in 40 mL of fresh mMRS and in 20 mL of fresh YEPD, respectively, and incubated at 28 °C. After 24 h, the cells were harvested (6076× g for 10 min at 4 °C), resuspended in 10 mL of physiological solution and used to inoculate a mixture of 1.5 kg re-milled semolina (Mulino Brundu, Torralba, Italy) and 1.5 kg of sterile water. Liquid sourdough was managed in the laboratory using the Automatic Fermenter AFT5 (SITEP S.r.l., Voghiera, Italy). With regard to the cell number of inoculated strains, it was detected in each dough after inoculum. For all samples, the cell concentration was of the order of 107 UFC g−1 for bacteria and 105 UFC g−1 for yeast strains. Values were reported in Figure 1 and indicated as “S”. The sourdoughs were refreshed over 22 days from Monday to Friday by a daily backslopping procedure, mixing an equal amount (ratio 1:1:1) of mother sourdough, fresh re-milled semolina and water, which was previously autoclaved 15 min at 120 °C. After the fermentation process, the sourdough was stored at a low temperature (5 ± 2 °C). The value of dough yield (DY) was 200.
Three different sourdoughs were prepared, called SD1, SD2 and SD3, using different methods of inoculum for the starter strains and different fermentation conditions, as follows:
  • For SD1, the starter strains were inoculated together. The pH of the dough was about 6.5 before starter addition. Fermentation was carried out at 25 °C for 5 h.
  • For SD2, the starter strains were inoculated together. The pH of the dough was lowered before starter addition at value 5.5, using lactic acid 90% (Sigma-Aldrich, Milan, Italy). Fermentation was carried out at 20 °C for 8 h.
  • For SD3, the pH of the dough was lowered before starter addition, as in SD2. The starter strains were inoculated separately. At first, the L. plantarum was inoculated, and it was left to ferment at 20 °C for 17 h. The following day, the yeast strains were inoculated throughout the refreshment step, and fermentation was carried out at 20 °C for 8 h.
The pH was lowered in order to support the growth of L. plantarum. The fermentation times were selected based on experience, as such values allowed sourdough pH values in between 4.0 and 4.5.
Samples of sourdoughs used for microbiological, chemical and metataxonomic analyses were collected about 24 h after the refreshment step, during the low-temperature phase, whereas the sample collected on Monday refers to the sourdough refreshed on Friday.

2.3. Refreshment of Liquid Sourdough in the Bakery

After 22 days, the liquid sourdough SD1 was transferred to an artisanal bakery (MFM Sunalle, Fonni, Italy), referred to as SD1-bak, and used for baking purposes. The sourdough was refreshed twice a week with the aid of the automatic bioreactor Fermentolevain FL80 (Esmach, Italy), mixing sourdough, semolina and water in a ratio of 1:1:1. Fermentation was carried out at 25 °C for 5 h, then the sourdough was cooled to 5 °C. Approximately every 2 months, and up to 8 months, one sample of sourdough was transferred to the Porto Conte Ricerche laboratory and analyzed.

2.4. Determination of pH and Total Titratable Acidity

Ten grams of liquid sourdough were mixed with 90 mL of distillated water and stirred for 30 min, and then an automatic titrator (pH-Matic 23, Crison Instruments, Alella, Spain) was used to measure pH values and total titratable acidity (TTA), the latter was reported as the amount (mL) of NaOH N/10 to achieve pH 8.5 in 10 g of sample. Analyses were done in triplicate.

2.5. Analysis of Sourdough Microorganisms—Culture Dependent Approach

The viable cell number of bacteria and yeast growing in sourdough was estimated by plate-count technique. Ten grams of sourdough were mixed for 2 min with 90 mL of sterile peptone solution (1 g/L of peptone in distilled water) in a sterile stomacher bag, using a Stomacher Lab blender 80 (VWR International PBI, Milano, Italy). Serial dilutions were performed and plated onto mMRS agar for bacterial enumeration and Rose-Bengal Chloramphenicol agar (Oxoid, Basingstoke, UK) for yeast enumeration. Plates of mMRS were incubated under anaerobiosis (AnaeroGen and AnaeroJar, Oxoid, Basingstoke, UK) at 28 °C for 48 h. Rose-Bengal Chloramphenicol agar plates (RB) were incubated at 28 °C for 72 h. The use of RB plates allowed for differentiating Saccharomyces from Candida based on colony morphology. Candida had white colonies with a rugged surface from which “feet” extended from the margins into the surrounding agar, and Saccharomyces colonies were circular in shape, violet and had a smooth surface.

2.6. Analysis of Sourdough Microorganisms—Metataxonomic Approach

2.6.1. Nucleic Acid Extraction and High-Throughput Sequencing Analysis

DNA was extracted from the samples collected in the three experiments, SD1, SD2 and SD3. Extraction was performed following the procedure reported in “Manual DNA Extraction from Food Samples” [11] and using the ReliaPrep™ Blood gDNA Miniprep System (Promega, Milano, Italy). DNA quality and yield were evaluated via agarose gel and Qubit fluorometer (Life Technologies, Carlsbad, CA, USA). Libraries were constructed using Illumina’s recommendations as implemented in 16S Metagenomic Sequencing Library Preparation guide and Fungal Metagenomic Demonstrated Protocol. Two primers, Lac1 (5′-AGCAGTAGGGAATCTTCCA-3′) and Lac2 (5′-ATTYCACCGCTACACATG-3′), were used to amplify the variable regions 3 and 4 of the bacterial 16S rRNA gene [12]. Among fungi, the gene-specific sequences used in this paper target the fungal ITS1 region between the 18S and 5.8S rRNA genes. They include the ITS1-F and ITS2 primers [13], which are widely used for fungal barcoding studies. All primers were modified to contain adaptors for MiSeq sequencing.
Three separate gene-amplification reactions were performed for each sample, pooled together and cleaned up using AMPure XP (Beckman Coulter, Brea, CA, USA) magnetic beads. The next PCR attached dual index barcodes and sequencing adapters using the Illumina Nextera XT kit so that the PCR products may be pooled and sequenced directly. A final library size and quantification were conducted using a Bioanalyzer 2100 (Agilent Technologies, Santa Clara, CA, USA) and Qubit fluorometer, respectively. DNA sequencing was performed on the Illumina MiSeq platform using v3 chemistry according to the manufacturer’s specifications to generate paired-end reads of 251 bases of length in each direction.

2.6.2. Sequence Analyses of the 16S rRNA and ITS Amplicons

For 16S rDNA gene sequencing, data quality control and analyses were performed using the QIIME pipeline package v.1.9.1 [14]. The overlapping paired-end reads were merged using the script join_paired_ends.py inside the QIIME package. Only Illumina reads with a length >200 bp were retained for further analysis. Operational taxonomic units (OTUs) were generated using a pipeline based on USEARCH’s OTU clustering recommendations (http://www.drive5.com/usearch/manual/otu_clustering.html (accessed on 26 October 2021)) using the closed-reference OTU picking to allow clustering of 16S sequences, as previously described [14]. Reads were clustered at 97% identity using UCLUST to produce OTUs. The taxonomy classification was determined in accordance with the Greengenes 13_8 database. In addition, taxonomic attribution was completed by searching in the NCBI 16S ribosomal RNA sequences database through the Nucleotide BLASTdatabase [15].
For ITS gene sequencing, data quality control and analyses were performed using the BaseSpace ITS Metagenomics App by Illumina. The ITS Metagenomics workflow performs a taxonomic classification using the UNITE database. Taxonomic identification of strains was completed by comparing the sequences of each sample with those reported in the Nucleotide BLAST database [15].

2.6.3. Data Availability

The sequence data have been deposited in the Sequence Read Archive of the NCBI database (BioProject ID: PRJNA886648).

2.7. Statistical Analysis and Graph Generation

For each sourdough sample, a standard ANOVA procedure was applied to the dataset of acidity and to the cell count of each microbial group. The means were separated by LSD test at a p = 0.05 significance level using the Statgraphics Centurion 18 software package (version 18, Statpont Technologies Inc., Warrenton, VA, USA). Some data were subjected to non-parametric statistical analysis by determining the median value. Metataxonomic count data were uploaded to the web application MicrobiomeAnalyst (http://www.microbiomeanalyst.ca (accessed on 26 October 2021)) to assess different statistics through comparative analysis. The relative proportion of read counts was used as a quantitative estimation of the abundance of each taxon of the three sourdoughs. The diversity within each sample (alpha diversity) was estimated with the Shannon diversity index, which takes into account the number of species and their frequency in each sourdough sample. Statistical significance testing between samples was considered and differences were assigned as statistically significant at p < 0.05. The differences between microbial samples (beta-diversity) were calculated and visualized as Principal Coordinate Analysis (PCoA). The statistical significance of group clustering was calculated through a permutational multivariate analysis (PERMANOVA) on taxonomic data.

3. Results

Three different liquid sourdoughs, called SD1, SD2 and SD3, were refreshed in a laboratory over a period of 22 days and studied through microbial plate-count, metataxonomic analysis, and pH and TTA determination. The sourdoughs were triggered with the same microbial starter, that was prepared with selected strains of L. plantarum, S. cerevisiae and C. lambica. The fermentation temperature and the method of starter inoculation were modified among the trials, in order to study the performances of the starter strains. Moreover, the first sourdough that was processed in the laboratory, i.e., SD1, was transferred to an artisanal bakery for baking purposes, and this provided the opportunity to analyze its microbiota during the 8 months of refreshments performed in the bakery.

3.1. Lactic Acid Bacteria and Yeast Enumeration

The presumptive LAB and yeast cells were enumerated by plate-count analyses and results were reported in Figure 1. The morphology of the colonies of C. lambica and S. cerevisiae was different on RB agar plates (Figure S1), and this allowed us to differentiate the species and to estimate the respective cell number.
Overall, a different evolution of the presumptive LAB and yeasts among sourdoughs was observed. Likely due to the higher number of cells added with the starter, bacteria dominated over yeast cells across samples, and the cell density (log10 CFU g−1) was always higher for LAB than for yeasts, ranging from ca. 7 to 9 log10 CFU g−1 for bacteria and from ca. 5 to 7 log10 CFU g−1 for yeasts. In spontaneous sourdoughs, yeasts can dominate over bacteria, or cannot appear at all, in the first period of propagation [2]. In this study, the LAB:yeast ratio ranged from 1000:1 to 100:1 during the whole fermentation period, as previously found in sourdoughs [2,7,16]. The number of LAB cells detected 30 min after starter inoculum was ca. 7 log10 CFU g−1 for the three sourdoughs, and it increased over time at different rates in the different sourdough samples. Both in SD1 and SD3 the cell density of presumptive LAB exceeded the value of 8 log10 CFU g−1 the day after inoculums, whereas in SD2 the presumptive LAB grew slowly in the first week and overcame the 8 log10 CFU g−1 after seven days. All samples reached the maximum cell density of ca. 9 log10 CFU g−1, considered the highest value for LAB. The median values of presumptive LAB were 8.56, 8.50 and 8.86 (log10 CFU g−1) for SD1, SD2 and SD3, respectively (Figure S2) and the values corresponding to 25th and 75th percentiles of the data were 8.45 and 8.91 for SD1, 7.68 and 8.92 for SD2, 8.72 and 8.90 for SD3.
The behavior of the presumptive Candida strain was different in the sourdough samples, as showed in Figure 1. The cell density, detected 30 min after starter inoculum, was ca. 5 log10 CFU g−1 for all sourdough samples. In SD1, the cell density decreased over time but was still detectable up to 22 days, and cells disappeared below the detection limit (considered to be 3 log10 CFU g−1) when the sourdough was refreshed in the artisanal bakery. In SD2, the cell density of presumptive Candida decreased after inoculum until it went below the detection limit after 14 days, whereas in SD3 the presumptive Candida decreased below the detection limit after the second day.
Among the presumptive number of Saccharomyces cells, the values started from 5 log10 CFU g−1, obtained after inoculums of the starter, and increased over time by about 2 logs in the three sourdoughs. The highest number of presumptive Saccharomyces cells was found in SD1, where the values ranged from 6.9 to 7.4 from day 15 to 22; the cell number remained high after the sourdough was transferred to the bakery. In SD2 and SD3, the cell density of presumptive Saccharomyces always remained below the value of 7 log10 CFU g−1. The median values of presumptive yeast cells, calculated by adding Candida and Saccharomyces cells, were 6.21, 6.70 and 6.12 (log10 CFU g−1) for SD1, SD2 and SD3, respectively (Figure S3) and the values corresponding to 25th and 75th percentiles of the data were 5.88 and 6.93 for SD1, 6.84 and 6.82 for SD2, 5.78 and 6.32 for SD3.

3.2. pH Values and Total Titratable Acidity (TTA)

The acidifying activity of sourdoughs was reported in Figure 2 and indicated as pH and TTA values. Before starter addition, the value of pH in SD1 was 6.5, corresponding to the value of raw semolina; therefore, the value declined to pH 5.8 the day after the starter fermentation and reached the value of 4.5 after six days. From day 6 to day 22, the pH of SD1 ranged from 4.0 to 4.7 and the TTA values ranged from 5.5 to 9.0 mL NaOH N/10. The acidity increased in SD1 when the sourdough was refreshed in the bakery: pH values ranged from 4.0 to 4.3 and TTA from 7.7 to 11.0 mL NaOH N/10.
In SD2, the pH of the dough was set down to 5.5 before starter addition using lactic acid, and the value became 5.3 after the starter fermentation; thereafter, the pH value declined quite slowly, reaching the value of 4.5 just after day 10, and ranging from 4.5 to 4.2 until the end. The total acidity, measured as TTA, increased slowly, but at the end reached quite a high value, ca. 11 mL NaOH N/10.
In SD3, the pH was set down at 5.5, as in SD2, but the L. plantarum was inoculated alone and left to ferment for 17 h at 20 °C; thereafter, the yeast strains were inoculated. The pH was measured after L. plantarum fermentation and revealed a value of 4.8. Later, the pH values ranged from 4.6 to 4.3 until the end. The TTA values increased slowly up to day 14 and did not exceed the value of 8 mL NaOH N/10.
The analyses of ∆pH were reported in Figure 3, referred to as the laboratory-propagated sourdoughs. Actually, the initial lowering of pH by the addition of lactic acid reduced the ∆pH values in SD2 and SD3 with respect to SD1, and the corresponding median values were 0.93, 0.95 and 1.93. The values corresponding to 25th and 75th percentiles of the data were 1.74 and 2.27 for SD1, 0.09 and 1.05 for SD2, 0.88 and 1.04 for SD3, and as a consequence the range of ∆pH displayed between the lower and the upper quartile was wider in SD1 and SD2 compared to SD3. The same phenomenon was observed for the ∆TTA (Figure S4).

3.3. Culture Independent Analysis

The metataxonomic analysis of laboratory-propagated sourdoughs found a total number of 19 species of lactic acid bacteria (Figure 4), belonging to four genera, i.e., Lactobacillus, Leuconostoc, Weisella and Pediococcus, one species of Staphilococcus and a total of 46 species of fungi, belonging to 27 different genera (Figure 5); most of them are included in the phylum of Ascomycota (relative abundance 99.94%) and only four species belong to the Basidiomycota phylum. An overall analysis, based on the number of microbial species identified, suggested a greater diversity and heterogeneity of the fungi community compared to the bacterial community.
The most representative microbial species and their relative abundance (%) in sourdough samples were reported in Table 1, and the column of total values refers solely to the laboratory-propagated sourdoughs. Apart from the L. plantarum species, inoculated as a starter and with a 55.34% of total relative abundance, the other dominant LAB species were Leuc. citreum, L. brevis and F. sanfranciscensis, and their relative abundances (%) were 14.99, 14.87 and 9.30, respectively (Table 1). Very low values of relative abundance were found for the other LAB species; actually, only Leuconostoc paramesenteroides and Weissella korensis showed values above 1 (1.77 and 1.15, respectively), and therefore all the other species were considered negligible. Among fungi, the S. cerevisiae and C. lambica yeast species, which were inoculated as starters, were the predominant fungi species, with a relative abundance of 45.45% and 20.02%, respectively (Table 1). The other yeast species reported in Table 1, i.e., Wickerhamomyces anomalus, Candida santamariae, Saccharomyces eubayanus and Saccharomyces cariocanus, showed quite low values of total relative abundance; however, C. santamariae and W. anomalus were concentrated particularly in SD3, with quite high values of relative abundance: 6.02% and 16.71% respectively. Additionally, Dipodascus australiensis, a yeast previously identified in naturally fermented dairy products [17], was detected mostly in SD3, with 20.07% of relative abundance. Other fungi species, quite uncommon for sourdough, were identified in relatively high abundance; the Microidium phyllanthi, a pathogenic fungi isolated from plant leaves, was found in all the sourdough samples, with a total value of 7.95% of relative abundance. The Alternaria infectoria, a plant pathogenic species, was found in all sourdough samples, but its relative abundance was higher in bakery-propagated sourdough.
The dynamics of LAB microbiota can be observed from Figure 4. It is noticeable that L. plantarum dominated at day one in the three sourdoughs, and this was certainly due to the high cell number (107 CFU g−1) inoculated with the starter strain; nevertheless, other contaminant species, probably coming from semolina, were present at day one. In particular, L. brevis (1.91%) and F. sanfranciscensis (1.46%) were present in SD1, and L. brevis (9.83% and 8.05%) and W. korensis (2.45% and 2.29%) were found in SD2 and SD3. The presumptive starter strain L. plantarum predominated in all sourdoughs, as evidenced from the relative abundance values (Table 1). In SD1, the L. plantarum predominated the first six days and therefore its abundance decreased, reaching very low values at day 22; this could be due to the growth of other two species, L. brevis and Leuc. citreum, which were present in relatively high numbers. In SD2, L. plantarum predominated for the first week, and after that the F. sanfranciscensis species appeared, dominating the other species with a high relative abundance, and consequently the abundance of L. plantarum decreased until the end of the experiment (4.72% at day 22). In SD3, the decrease of L. plantarum after inoculum was lower than in SD1 and SD2, and it was found at high relative abundance throughout the experiment; after 22 days, the relative abundance of the L. plantarum species was still 45.8%. The Leuc. citreum and the L. brevis species were also present in SD3 at quite high relative abundance (20.05% and 7.82%, respectively), but L. plantarum dominated the microflora throughout the experiment.
Regarding the yeast species, the evolution of S. cerevisiae and C. lambica was quite different among the three sourdoughs, as showed in Figure 5. Unlike the L. plantarum, the relative abundance of S. cerevisiae increased over the experiments, while the C. lambica decreased and almost disappeared at the end of the experiments. Despite a similar number of yeast cells (105 CFU g−1) being inoculated as starter in the sourdoughs, the relative abundance after the first fermentation step was quite different in the three sourdoughs, at 57.56%, 29.88% and 7.45% for C. lambica and 19.21%, 53.73% and 22.10% for S. cerevisiae in SD1, SD2 and SD3, respectively. Furthermore, in SD1, C. lambica predominated over S. cerevisae for the first 10 days (Figure 5), and later S. cerevisiae became dominant; in SD2, S. cerevisiae was dominant up to 22 days, with 67.4% of relative abundance (Table 1), while C. lambica decreased plentifully after 10 days; in SD3, both strains were found at low relative abundance over time (27.6% for S. cerevisae and 6.4% for C. lambica) and a multitude of species were present, with Diplodascus australiensis and W. anomalus found at quite high relative abundance—20.1% and 16.7%, respectively.
The metataxonomic analysis of bakery-propagated SD1 (Figure 4 and Figure 5) highlighted a strong modification of the microbial composition, compared to the laboratory-propagated SD1 sample. Among bacteria, the L. brevis and Leuc. citreum disappeared after 2 months, and the F. sanfranciscensis became the dominant species with a high relative abundance (78.5%). The L. plantarum was detected at a very low relative abundance (ca. 1%). Among yeasts, S. cerevisiae was present with a relative abundance of 51.4%, but the species diversity increased and numerous species appeared; in particular, fungi of the genera Alternaria, Fusarium, Giberella.
The differences in bacterial composition between sourdoughs were evaluated through beta-diversity analysis. The PCoA plots based on statistically significant (p-value < 0.001 PERMANOVA between sourdoughs 16S taxonomic data (Figure 6A) showed that SD1Lab and SD3 samples clustered together and were separated from most of the SD2 and SD1Bak samples. No clear separation among SD1Lab and SD3 could be observed. The two axes explain the 80.6% of variation between samples (PC1 53.1% and PC2 27.5%). The results reported in Figure 6B showed low values of alpha-diversity for the three sourdoughs (SD1Lab, SD2 and SD3) at the first three points of analysis, according to the microbial composition reported in Figure 4. The alpha-diversity increased throughout the sampling time for SD1Lab and SD3, whereas in SD1Bak and SD2 the diversity decreased in the last three samples due to the dominance of the F. sanfranciscensis species.
To measure the similarity between fungi communities, statistically significant (p-value < 0.001 PERMANOVA between sourdoughs) PCoA plots, were performed (Figure 7A). The two axis, explain the 60.9% of variation among samples (PC1 36% and PC2 24.9%).The plot showed that SD1Lab and SD2 samples clustered together and a clear separation between SD3 and SD1Bak samples according to the first component. Shannon index analysis indicated that the microbial diversity was consistent in the three sourdoughs, with the exception of samples obtained at final points that showed a lower alpha-diversity compared to the initial points (Figure 7B).

4. Discussion

The stability of sourdough microflora, in terms of microbial species, is an important factor from an industrial point of view, in order to obtain the standardization of baking processes and of products. The stability and the predominance of specific strains in a sourdough ecosystem is dependent on several factors, such as the metabolic properties of the strains, the microbial interactions, and the technological and ecological parameters [2,16]. In the current work, strains of L. plantarumS. cerevisiae and C. lambica, isolated from spontaneous sourdoughs, were used to ferment semolina doughs, with the aim of developing a liquid sourdough that had a stable microflora over time. Two fermentation temperatures were investigated and the impact on the microbial strains was observed. The metataxonomic analysis revealed the complexity of the fungi microflora over time, which was characterized by the presence of numerous species; most of them were pathogens of plants, likely suggesting the flour as the origin, and just a few of them were yeasts. With regard to the bacteria, most of them were lactic acid bacteria and their heterogeneity was very low; as a matter of fact, alongside the L. plantarum species, inoculated as starter strain, few species developed in all the sourdoughs examined. Above all, L. brevis and Leuc. citreum were commonly detected from day one to the end of the experiments, except when the F. sanfranciscensis became dominant and all the other species disappeared.
The metataxonomic method used in this work does not allow for the identification of a specific microbial strain, so we cannot assert with absolute certainty the persistence of the starter strains during sourdough propagation. However, we could reasonably believe that they were present due to the following reasons: (a) the number of cells inoculated with the starter strains, about 107 CFU g−1 for bacteria and 105 CFU g−1 for yeasts, (Figure 1) were close to the values found for the dominant microflora in a mature sourdough (106–109 CFU g−1 for bacteria, 105–108 CFU g−1 for yeasts) [16]; (b) the relative abundance of L. plantarum after one day was ca. 90% (Figure 4) in all sourdoughs, whereas it was quite low for S. cerevisiae, which tend to increase over time (Figure 5); (c) the first source of sourdough contamination is the flour, where the number of bacteria ranged from 104 to 106 CFU g−1 [18], a value lower than the number of starter cells. The S. cerevisiae is one of the most encountered yeast species in spontaneous sourdough [19] whereas C. lambica, synonymous with Pichia fermentans, is a maltose-negative microorganism that is not considered a typical sourdough microorganism, but it was isolated to a lesser extent from sourdough [20,21,22]. Candida humilis (syn. Candida milleri) and Candida krusei are the most frequently isolated Candida species in sourdough [5]. In this work, more than 105 CFU g−1 of S. cerevisiae and of C. lambica were inoculated as starters in sourdoughs. The cells of C. lambica decreased over time in all sourdoughs, as showed in Figure 1 and Figure 5, but to a lesser extent in SD1, where the relative abundance was the highest (34.6%) and the decrease over time was slow. In fact, the relative abundance was 1.5% at day 22, while in SD2 it was 1.4% at day 17 and in SD3 it was 1.8% at day 10. The S. cerevisiae was found at high relative abundance both in SD1 and SD2 (Table 1), and the increase of the abundance seems to be associated with the decrease of L. plantarum and the growth of F. sanfranciscensis in both samples, as observed in Figure 4 and Figure 5. The L. plantarum is the most employed LAB species in sourdough prepared with starter strains [4], and, despite this, not so many papers studied the permanence in sourdough of L. plantarum used as starter. Minervini et al. [23], studying the robustness of seven strains of L. plantarum, showed that five of them maintained an elevated number of cells during 10 days of sourdough propagation; nevertheless, new emerging strains were found. The L. plantarum is considered a ubiquitous microorganism with a relatively large genome size that allows the expression of important metabolic functions. It has been isolated from different fermented foods including spontaneous sourdough, where it is frequently associated with L. brevis [24]. It is noticeable that L. brevis was always present in SD1, SD2 and SD3. In SD1, the cell number increased toward the end of laboratory experiment, and in SD3 its relative abundance was quite constant, ranging from 6.4% to 10%. In SD2, the abundance decreased after 10 days, and the same was observed in bakery-propagated SD1, corresponding in both samples to the appearance of the F. sanfranciscensis species (Figure 4), which became dominant over the other strains, reaching about 80% of relative abundance at the end of the experiment. The growth of F. sanfranciscensis lowered the bacterial diversity, as stated by Comasio et al. [25]. The predominance of F. sanfranciscensis in bakery-propagated SD1 is likely due to the power of the “house microbiota”, namely the microorganisms contaminating the setting and the equipment of the bakery; the F. sanfranciscensis was probably the main bacterial strain in the bakery environment and this led to the replacement of the native strains in the sourdough. The F. sanfranciscensis has the smallest genome and the highest density of ribosomal operons within the lactobacilli group, and this feature is retained to favor its predominance in sourdough substrate [16]. Siragusa et al. [26] investigated the predominance of nine strains of F. sanfranciscensis inoculated as starters in different type I sourdoughs, and they observed that only three of them were able to dominate during 10 days of continuous propagation. Viiard et al. [27] studied the LAB community of a rye sourdough used in a bakery that was initiated with a commercial starter containing Limosilactobacillus pontis; after 28 months of refreshments, the analysis revealed the presence of F. sanfranciscensis and L. pontis.
As previously reported in the literature [2,28], the dynamics of the microbial community are influenced deeply by the fermentation temperature, but the other process parameters (fermentation time, number of refreshment steps, aeration, dough yield, etc.) are considered important as well. In this work, the effect of different fermentation temperatures (25 °C and 20 °C) on sourdough microflora cannot be easily accounted for. At 25 °C, the total number of viable cells (bacteria and yeast) seems to increase with respect to the sourdoughs fermented at 20 °C (Figure 1); regarding the LAB, three LAB species contributed to increase the number of viable cells, as indicated by metataxonomic analysis in Figure 4; therefore, the high temperature did not favor the growth of L. plantarum. Presumptive Candida grew up to the 22nd day and the number of presumptive Saccharomyces cells is consistent in sourdough fermented at 25 °C. The low fermentation temperature is reported [28] to favor the growth of yeast and heterofermentative LAB species in sourdoughs produced worldwide, whereas homofermentative and facultatively heterofermentative LABs were favored at a high fermentation temperature (>30 °C). In natural sourdoughs, dominated by heterofermentative LABs and the yeast C. milleri, the LAB and yeast cells increased when the temperature was raised from 15 °C to 27 °C [29].
The values of pH and TTA observed in sourdough samples were consistent with values found in other papers [4]. The L. plantarum species, which is the most abundant and important bacterial species in the laboratory-propagated sourdoughs, showed a similar total relative abundance in SD1, SD2 and SD3 (Table 1), but the decrease over time was more pronounced in SD1 and less pronounced in SD3 (Figure 4). Anyway, the acidifying activity in the first week was greater in SD1 than in SD2 and SD3, and the lowest pH values were observed in SD1. Therefore, the higher fermentation temperature in SD1 could have favored the metabolism of L. plantarum; in the first week thereafter, the development of L. brevis, a heterofermentative species, could have contributed to the production of organic acids and to the pH decrease [5].
Concerning the sourdough samples fermented at the same temperature (SD2 and SD3) during the first week, the acidification was faster in SD3 than in SD2, likely because of the different method used to inoculate the L. plantarum. In fact, the starter strains were inoculated all together in SD2, whereas in SD3 the L. plantarum was inoculated alone and left to ferment for 17 h, and then the yeast strains were added in the subsequent backslopping. The analysis of the data reported in Figure 3 indicates that the ∆pH values were more homogeneous in SD3 compared to SD2, and the same phenomenon can be observed for the ∆TTA and bacterial cell density values reported in Figures S2 and S4, respectively. Therefore, in SD3, the growth of lactic acid bacteria and the acidification over the propagation period was more uniform and stable compared to the other samples. Regarding the evolution of starter yeasts, differences can be observed in SD2 and SD3 (Figure 5), unless the fermentation was conducted at the same temperature (20 °C). Indeed, both the S. cerevisiae and the C. lambica grew well in SD2, where the lowering of dough pH before starter addiction could have favored the growth of yeast, according with that reported by Minervini et al. [16] and to the yeast growth in SD1, where the dough pH was not lowered. On the contrary, in SD3, the lowering of pH did not favor the growth of yeast strains, probably because their growth was conditioned by the rapid growth of L. plantarum in the first days. The different methods used for starter addition seem to have affected the behavior of starter strains and the acidification process in sourdoughs.

5. Conclusions

In spontaneous sourdoughs, the first fermentation is commonly carried out by the indigenous microorganism from the flour and/or the environment, and after a few refreshments some species become dominant [16]. In this work, the starter strains were added with the purpose of guiding the first fermentation and to dominate the mature sourdough. The analyses showed that despite the high number of starter cells, other microbial species were able to grow, and sometimes became dominant species. The fungi microbiota were more heterogeneous than the bacteria microbiota, and most species probably originated from flour, being pathogens of plants. For the first time, a strain of C. lambica was used as a starter in sourdough fermentation, and the lack of competitiveness towards the other strains was shown. The growth and the stability over time of the starter L. plantarum improved when the LAB strain was inoculated alone and left to conduct the first fermentation process for many hours at a low temperature. The high fermentation temperature (25 °C) seems to promote the growth of both bacteria and yeast, but not the growth of the L. plantarum starter strain. Therefore, it will be a great challenge to find starter strains that are able to dominate the microflora, grow well at low temperatures for energy saving purposes, and that are competitive enough towards contaminant species, in order to guarantee the persistence of starter strains in sourdough.

Supplementary Materials

The following supporting information can be downloaded at: https://www.mdpi.com/article/10.3390/fermentation8100571/s1. Figure S1: Morphology of the colonies for S. cerevisiae and C. lambica growing on RB medium. Figure S2: Values of LAB cell density (log10 CFU g−1) The inner line of each box represents the median; the top and bottom of the box represent the 75th and 25th percentiles of the data, respectively. The top and bottom of the bars represent the 100% of the data. The square outside the box plot represents the outliers of the data. Figure S3: Values of yeast cell density (log10 CFU g−1) The inner line of each box represents the median; the top and bottom of the box represent the 75th and 25th percentiles of the data, respectively. The top and bottom of the bars represent the 100% of the data. The square outside the box plot represents the outliers of the data. Figure S4: Values of ∆ΤΤA (difference between the initial TTA value and the values after sourdough refreshment). Data are the means from three independent experiments (n = 3). The inner line of each box represents the median; the top and bottom of the box represent the 75th and 25th percentiles of the data, respectively. The top and bottom of the bars represent the 100% of the data. The square outside the box plot represents the outliers of the data.

Author Contributions

Conceptualization, P.C.; formal analysis, V.T., A.C., M.S., S.F. and C.F.; investigation, V.T., A.C. and C.F.; investigation and resources, A.L.; writing—original draft preparation, P.C. and C.F.; writing—review and editing, P.C.; project administration, P.C. and T.R.; funding acquisition, T.R. All authors have read and agreed to the published version of the manuscript.

Funding

This research was funded by Sardegna Ricerche, Science and Technology Park of Sardinia, and Regione Autonoma della Sardegna, under the program POR FESR Sardegna 2014–2020 Azione 1.2.2, and the R&D project “Crunch-Sunalle”.

Institutional Review Board Statement

Not applicable.

Informed Consent Statement

Not applicable.

Data Availability Statement

The data presented in this study are available on request from the corresponding author.

Conflicts of Interest

The authors declare no conflict of interest in this research article. Most of the authors are researchers employed by Porto Conte Ricerche Srl, a publicly-owned research company, subsidiary controlled and financed by Sardegna Ricerche, which is an agency of the Regional government of Sardinia.

References

  1. Reese, A.T.; Madden, A.A.; Joossens, M.; Lacaze, G.; Dunn, R.R. Influences of ingredients and bakers on the bacteria and fungi in sourdough starters and bread. mSphere 2020, 5, e00950-19. [Google Scholar] [CrossRef] [PubMed] [Green Version]
  2. Calvert, M.D.; Madden, A.A.; Nichols, L.M.; Haddad, N.M.; Lahne, J.; Dunn, R.R.; McKenney, E.A. A review of sourdough starters: Ecology, practices, and sensory quality with applications for baking and recommendations for future research. PeerJ 2021, 9, e11389. [Google Scholar] [CrossRef] [PubMed]
  3. Meroth, C.B.; Walter, J.; Hertel, C.; Brandt, M.J.; Hammes, W.P. Monitoring the bacterial population dynamics in sourdough fermentation processes by using pcr-denaturing gradient gel electrophoresis. Appl. Environ. Microbiol. 2003, 69, 475–482. [Google Scholar] [CrossRef] [PubMed] [Green Version]
  4. Arora, K.; Ameur, H.; Polo, A.; Cagno, R.; Rizzello, C.G.; Gobbetti, M. Thirty years of knowledge on sourdough fermentation: A systematic review. Trends Food Sci. 2021, 108, 71–83. [Google Scholar] [CrossRef]
  5. De Vuyst, L.; Vrancken, G.; Ravyts, F.; Rimaux, T.; Weckx, S. Biodiversity, ecological determinants, and metabolic exploitation of sourdough microbiota. Food Microbiol. 2009, 26, 666–675. [Google Scholar] [CrossRef]
  6. De Vuyst, L.; van Kerrebroeck, S.; Leroy, F. Microbial ecology and process technology of sourdough fermentation. Adv. Appl. Microbiol. 2017, 100, 49–160. [Google Scholar] [PubMed]
  7. De Vuyst, L.; Neysens, P. The sourdough microflora: Biodiversity and metabolic interactions. Trends Food Sci. 2005, 16, 43–56. [Google Scholar] [CrossRef]
  8. Oshiro, M.; Zendo, T.; Nakayama, J. Diversity and dynamics of sourdough lactic acid bacteriota created by a slow food fermentation system. J. Biosci. Bioeng. 2021, 131, 333–340. [Google Scholar] [CrossRef]
  9. Landis, E.A.; Oliverio, A.M.; McKenney, E.A.; Nichols, L.M.; Kfoury, N.; Biango-Daniels, M.; Shell, L.K.; Madden, A.A.; Shapiro, L.; Sakunala, S.; et al. The diversity and function of sourdough starter microbiomes. eLife 2021, 10, e61644. [Google Scholar] [CrossRef]
  10. Fois, S.; Piu, P.P.; Sanna, M.; Roggio, T.; Catzeddu, P. Starch digestibility and properties of fresh pasta made with semolina-based liquid sourdough. LWT Food Sci. Technol. 2018, 89, 496–502. [Google Scholar] [CrossRef]
  11. Manual DNA Extraction from Food Samples. Available online: https://ita.promega.com/resources/pubhub/applications-notes/an300/an338-manual-dna-extraction-from-food-samples/ (accessed on 24 March 2022).
  12. Di Cagno, R.; Pontonio, E.; Buchin, S.; de Angelis, M.; Lattanzi, A.; Valerio, F.; Gobbetti, M.; Calasso, M. Diversity of the lactic acid bacterium and yeast microbiota in the switch from firm-to liquid-sourdough fermentation. Appl. Environ. Microbiol. 2014, 80, 3161–3172. [Google Scholar] [CrossRef] [Green Version]
  13. Bellemain, E.; Carlsen, T.; Brochmann, C.; Coissac, E.; Taberlet, P.; Kauserud, H. ITS as an environmental DNA barcode for fungi: An in silico approach reveals potential PCR biases. BMC Microbiol. 2010, 10, 189. [Google Scholar] [CrossRef] [PubMed] [Green Version]
  14. Tanca, A.; Manghina, V.; Fraumene, C.; Palomba, A.; Abbondio, M.; Deligios, M.; Silverman, M.; Uzzau, S. Metaproteogenomics reveals taxonomic and functional changes between cecal and fecal microbiota in mouse. Front. Microbiol. 2017, 8, 391. [Google Scholar] [CrossRef] [PubMed] [Green Version]
  15. Basic Local Alignment Search Tool. Available online: https://blast.ncbi.nlm.nih.gov/Blast.cgi (accessed on 24 March 2022).
  16. Minervini, F.; de Angelis, M.; di Cagno, R.; Gobbetti, M. Ecological parameters influencing microbial diversity and stability of traditional sourdough. Int. J. Food Microbiol. 2014, 171, 136–146. [Google Scholar] [CrossRef] [PubMed]
  17. Xu, W.-L.; Li, C.-D.; Guo, Y.-S.; Zhang, Y.; Ya, M.; Guo, L. A snapshot study of the microbial community dynamics in naturally fermented cow’s milk. Food Sci. Nutr. 2021, 9, 2053–2065. [Google Scholar] [CrossRef]
  18. Scheirlinck, I.; van der Meulen, R.; de Vuyst, L.; Vandamme, P.; Huys, G. Molecular source tracking of predominant lactic acid bacteria in traditional Belgian sourdoughs and their production environments. J. Appl. Microbiol. 2009, 106, 1081–1092. [Google Scholar] [CrossRef]
  19. De Vuyst, L.; Harth, H.; van Kerrebroeck, S.; Leroy, F. Yeast diversity of sourdoughs and associated metabolic properties and functionalities. Int. J. Food Microbiol. 2016, 239, 26–34. [Google Scholar] [CrossRef]
  20. Boyaci-Gunduz, C.P.; Erten, H. Predominant yeasts in the sourdoughs collected from some parts of Turkey. Yeast 2020, 37, 449–466. [Google Scholar] [CrossRef]
  21. Syrokou, M.K.; Themeli, C.; Paramithiotis, S.; Mataragas, M.; Bosnea, L.; Argyri, A.A.; Chorianopoulos, N.G.; Skandamis, P.N.; Drosinos, E.H. Microbial ecology of greek wheat sourdoughs, identified by a culture-dependent and a culture-independent approach. Foods 2020, 9, 1603. [Google Scholar] [CrossRef]
  22. Korcari, D.; Ricci, G.; Quattrini, M.; Fortina, M.G. Microbial consortia involved in fermented spelt sourdoughs: Dynamics and characterization of yeasts and lactic acid bacteria. Lett. Appl. Microbiol. 2019, 70, 48–54. [Google Scholar] [CrossRef]
  23. Minervini, F.; de Angelis, M.; di Cagno, R.; Pinto, D.; Siragusa, S.; Rizzello, C.G.; Gobbetti, M. Robustness of Lactobacillus plantarum starters during daily propagation of wheat flour sourdough type I. Food Microbiol. 2010, 27, 897–908. [Google Scholar] [CrossRef] [PubMed]
  24. Gänzle, M.G.; Zheng, J. Lifestyles of sourdough lactobacilli–Do they matter for microbial ecology and bread quality? Int. J. Food Microbiol. 2019, 302, 15–23. [Google Scholar] [CrossRef] [PubMed]
  25. Comasio, A.; Verce, M.; van Kerrebroeck, S.; de Vuyst, L. Diverse microbial composition of sourdoughs from different origins. Front. Microbiol. 2020, 11, 1212. [Google Scholar] [CrossRef] [PubMed]
  26. Siragusa, S.; di Cagno, R.; Ercolini, D.; Minervini, F.; Gobbetti, M.; de Angelis, M. Taxonomic structure and monitoring of the dominant population of lactic acid bacteria during wheat flour sourdough type I propagation using Lactobacillus sanfranciscensis starters. Appl. Environ. Microbiol. 2009, 75, 1099–1109. [Google Scholar] [CrossRef] [Green Version]
  27. Viiard, E.; Bessmeltseva, M.; Simm, J.; Talve, T.; Aaspõllu, A.; Paalme, T.; Sarand, I. Diversity and stability of lactic acid bacteria in rye sourdoughs of four bakeries with different propagation parameters. PLoS ONE 2016, 11, e0148325. [Google Scholar] [CrossRef] [Green Version]
  28. De Vuyst, L.; van Kerrebroeck, S.; Harth, H.; Huys, G.; Daniel, H.-M.; Weckx, S. Microbial ecology of sourdough fermentations: Diverse or uniform? Food Microbiol. 2014, 37, 11–29. [Google Scholar] [CrossRef]
  29. Simonson, L.; Salovaara, H.; Korhola, M. Response of wheat sourdough parameters to temperature, NaCl and sucrose variations. Food Microbiol. 2003, 20, 193–199. [Google Scholar] [CrossRef]
Figure 1. Histogram representation of cell counts (log10 CFU g−1) for the samples SD1, SD2 and SD3. The blue columns indicate the presumptive lactic acid bacteria (LAB) on mMRS agar, the red columns indicate the presumptive Saccharomyces and the green columns indicate the presumptive Candida, both enumerated on RB agar. “S” refers to the cell number after starter inoculum. Data from duplicate analyses are expressed as mean value. Bars indicate LSD intervals at 95% confidence level.
Fermentation 08 00571 g001
Figure 2. Mean values of pH (blue line) and total titratable acidity (TTA) (red line) for the samples SD1, SD2 and SD3. “S” refers to the pH and TTA values detected after inoculum. Bars indicate LSD intervals at 95% confidence level.
Fermentation 08 00571 g002
Figure 3. Values of ∆pH (difference in pH units between the initial pH and pH values after sourdough refreshment). Data are the means from three independent experiments (n = 3). The inner line of each box represents the median; the top and bottom of the box represent the 75th and 25th percentiles of the data, respectively. The top and bottom of the bars represent the 100% of the data. The square outside the box plot represents the outlier of the data.
Fermentation 08 00571 g003
Figure 4. Relative abundance (%) of bacterial OTUs classified at the highest possible taxonomic level (species/genus) found in the three sourdoughs (SD). SD1Lab: laboratory-propagated sourdough. SD1Bak: bakery-propagated sourdough.
Fermentation 08 00571 g004
Figure 5. Relative abundance (%) of fungi taxa found in the three sourdoughs (SD). SD1Lab: laboratory-propagated sourdough. SD1Bak: bakery-propagated sourdough.
Fermentation 08 00571 g005
Figure 6. (A) Principal component analysis (PCoA) of the bacterial community. The values of axes 1 and 2 are the percentages that can be explained by the corresponding axis. Each color represents one group sample obtained from the same sourdough. (B) Shannon index values (alpha-diversity) for each sample, computed on taxonomic information, according to 16S data. Each color represents one group sample obtained from the same sourdough. SD1Lab: laboratory-propagated sourdough. SD1Bak: bakery-propagated sourdough.
Fermentation 08 00571 g006
Figure 7. (A) Principal coordinate analysis (PCoA) of the fungi community. The values of axes 1 and 2 are the percentages that can be explained by the corresponding axis. Each color represents one group sample obtained from the same sourdough. (B) Shannon index values (alpha-diversity) for each sample, computed on taxonomic information, according to ITS data. Each color represents one group sample obtained from the same sourdough. SD1Lab: laboratory-propagated sourdough. SD1Bak: bakery-propagated sourdough.
Fermentation 08 00571 g007
Table 1. Relative abundance (%) of most representative fungi and lactic acid bacteria species, reported for the single sourdough samples and as total value for the three sourdough samples.
Sourdough Samples
LABSD1LabSD1BakSD2SD3Total
Lactiplantibacillus plantarum49.951.1150.4768.1255.34
Leuconostoc citreum19.052.396.3220.0514.99
Fructilactobacillus sanfranciscensis0.2379.3426.730.159.30
Levilactobacillus brevis31.9916.756.457.8214.87
Leuconostoc pseudomesenteroides1.120.252.931.211.77
Weissella korensis0.000.011.511.851.15
Fungi
Saccharomyces cerevisiae40.9653.7767.3627.6145.45
Candida lambica34.630.0320.306.4520.02
Microidium phyllanthi16.065.494.573.977.95
Wickerhamomyces anomalus0.000.000.1916.715.81
Dipodascus australiensis0.000.000.0220.076.91
Alternaria infectoria1.019.742.997.153.80
Candida santamariae0.000.000.006.022.07
Cladosporium delicatulum0.373.910.575.062.05
Alternaria alternata0.453.901.302.331.39
Mycosphaerella tassiana0.241.990.431.860.86
Gibberella zeae0.413.791.130.340.63
Saccharomyces eubayanus1.720.640.000.000.54
Saccharomyces cariocanus1.411.490.720.260.78
Fusarium culmorum0.454.110.000.000.14
Publisher’s Note: MDPI stays neutral with regard to jurisdictional claims in published maps and institutional affiliations.

