Article

Study of Fungal Communities in Dry Red Wine Fermentation in Linfen Appellation, Shanxi

1
School of Food Science and Engineering, Yangzhou University, Yangzhou 225127, China
2
The Graduate School of East Asian Studies, Yamaguchi University, 1677-1, Yamaguchi 753-8511, Japan
*
Authors to whom correspondence should be addressed.
Fermentation 2022, 8(10), 475; https://doi.org/10.3390/fermentation8100475
Submission received: 27 July 2022 / Revised: 6 September 2022 / Accepted: 16 September 2022 / Published: 22 September 2022
(This article belongs to the Section Microbial Metabolism, Physiology & Genetics)

Abstract

:
In this study, the fermentation mash of Cabernet Sauvignon, Cabernet Franc, and Matheran from Linfen, Shanxi Province, was sequenced using the Illumina MiSeq high-throughput sequencing platform to analyze the structural diversity of fungal communities in different samples. The results showed that a total of 10 phyla, 125 families, and 187 genera were detected in the nine samples of this study. The main fungal phyla were Ascomycota, Basidiomycota, and Mortierellomycota. The main fungal genera are Hanseniaspora, Mortierella, Sclerotinia, Aureobasidium, Saccharomyces, Aspergillus, Clavulina, Candida, etc. Hanseniaspora was the dominant genus in the pre-fermentation stage, accounting for more than 70%; Saccharomyces was the dominant genus in the middle and late fermentation stage, accounting for more than 75% in the middle fermentation stage and up to 90% in the late fermentation stage. This study provides a theoretical basis for monitoring and optimizing winemaking processes and introducing wine grape varieties in the Linfen region of Shanxi.

1. Introduction

Winemaking is a metabolic process involving a variety of microorganisms [1], among which bacteria, yeasts, molds, and other microorganisms play a crucial role in its production and flavor formation [2,3]. The symbiotic and metabolic interactions between different microorganisms form a complex microbial community [4,5] and affect the aroma and flavor of wines to some extent [6,7]. In addition, factors such as winemaking raw materials, the winemaking process, geographical location, and climatic conditions can affect the structure of winemaking microbial communities [8,9].
In recent years, due to the advantages of short sequencing time and high sequencing throughput, researchers at home and abroad have applied high-throughput sequencing technology to classify and identify winemaking microorganisms, monitor the dynamic changes of winemaking microbial communities during the fermentation process, trace wine flavor substances, and identify whether wine products are adulterated [10]. In the wine field, high-throughput sequencing is used to investigate the microbial diversity on the grape surface, and the diversity and dynamics of microorganisms during fermentation have also been reported. Portillo et al. [11] studied the bacterial diversity of Grenache and Carignan grape berries using high-throughput sequencing analysis, showing differences in microorganisms in different varieties of grape berries. Zhang et al. [12] investigated the composition of microorganisms on grape skins using 16S rRNA and internal transcribed spacer (ITS) sequencing and found that grape varieties play an important role in shaping bacterial and fungal communities, and that the abundance of several important bacterial and fungal taxa differed. Setati et al. [13] selected the entire ITS to sequence the fungal communities of Cabernet Sauvignon berries from three adjacent vineyards in South Africa and concluded that there were highly significant differences in the composition of the fungal communities between adjacent vineyards.
Most studies have focused on the composition of bacterial and fungal communities in the skins of different varieties of wine grapes, with less research on the composition and differences between fungal communities in different varieties and fermentation stages, and no studies on fungal communities in the fermentation process of different grape varieties in the Linfen production area have been reported. In this study, high throughput sequencing was used to analyze the differences and changes in fungal communities of different wine grape varieties in the Linfen appellation during natural fermentation to assess the composition and abundance of fungal communities, which is important to investigate the fungal diversity and its influence on wine quality in the Linfen appellation, to explore high-quality yeasts and other dominant fungi, and to provide a reference for future in-depth study on the microbial community structure and its role in the fermentation of wines from the Linfen appellation in Shanxi.

2. Materials and Methods

2.1. Experimental Materials

The grapes were collected from the grape base of Rongzi Winery Co., Ltd. in Linfen City, Shanxi Province; 9.9 °C, 570 mm of precipitation, and 212 days of frost-free period per year make it the most suitable area for wine grape cultivation. Ten kg each of three grape varieties, Cabernet Sauvignon, Cabernet Franc, and Matheran were randomly picked at maturity, harvested from the plants with sterile gloves, kept in clean bags, and sent to the laboratory in ice boxes to prepare for fermentation.

2.2. Experimental Methods

2.2.1. Wine Fermentation Process

The wine fermentation process was described in an article by Hu et al. (2020) [14]. Attention was paid to the natural fermentation after manual crushing and pressing with sterile gloves. All fermentation processes were monitored daily using a densitometer, 50 mL samples were collected at three different fermentation stages, and three samples were taken from each group of fermentation stages for parallel experiments: early (day 1), mid-fermentation (day 4), and late fermentation (day 8). Thirty mL of wine mash samples were aseptically aspirated in sterile centrifuge tubes and stored in a refrigerator at −80 °C for gene sequencing.

2.2.2. Gene DNA Extraction from Wine Samples

The steps of the DNA extraction kit MOBIO PowerSoil® DNA Isolation Kit were followed. After the extraction of genomic DNA, the extracted genomic DNA was detected by 1% agarose gel electrophoresis.

2.2.3. PCR Amplification and MiSeq Sequencing of Wine Samples

PCR amplification system: DNA template 30 ng, forward and reverse primers (5′-CTTGGTCATTTAGAGGAAGTAAA-3′ and 3′-TGCGTTC-TTCATCGATGC-5′, 5 μmol/L) were 1 μL and 3 μL of 2 ng/μL each. Bovine serum albumin solution, 12.5 μL 2 × Taq Plus Master Mix, 7.5 μL ddH2O. The amplification procedure was as follows: pre-denaturation at 94 °C for 5 min, denaturation at 94 °C for 30 s, annealing at 55 °C for 30 s, extension at 72 °C for 1 min, 28 cycles, and elongation at 72 °C for 10 min, with three replicates for each sample. The PCR products were amplified by 1% agarose gel electrophoresis and purified by Agencourt AMPure XP Nucleic Acid Purification Kit. The sequencing platform was Illumina MiSeq PE300, and the subsequent library construction and sequencing were entrusted to Beijing Ovation Biotechnology Co. (Beijing, China).

2.3. Data Processing

Miseq sequencing yielded Pair-End (PE) double-end sequence data, which were spliced using Flash (v1.20) and Pear (v0.9.6) software, filtered using Trimmomatic (v0.36), and chimeras were removed by Uchime software to obtain valid sequences. The sequences were classified into OTUs with 97% similarity using QIIME (v1.8.0) software, and the species information was obtained by taxonomic annotation of OTUs with the UNITE (Fungal) taxonomic database.
Alpha diversity analysis was then performed using mothur, and curve plots were produced using R language tools. Based on the Unweighted Unifrac distance matrix, the UPGMA method was used to cluster and build a tree to integrate the relative abundance of species at the level of phylum, order, family, and genus for each sample and to summarize and analyze the fungal flora of the three varieties of wine at different fermentation stages.

3. Results

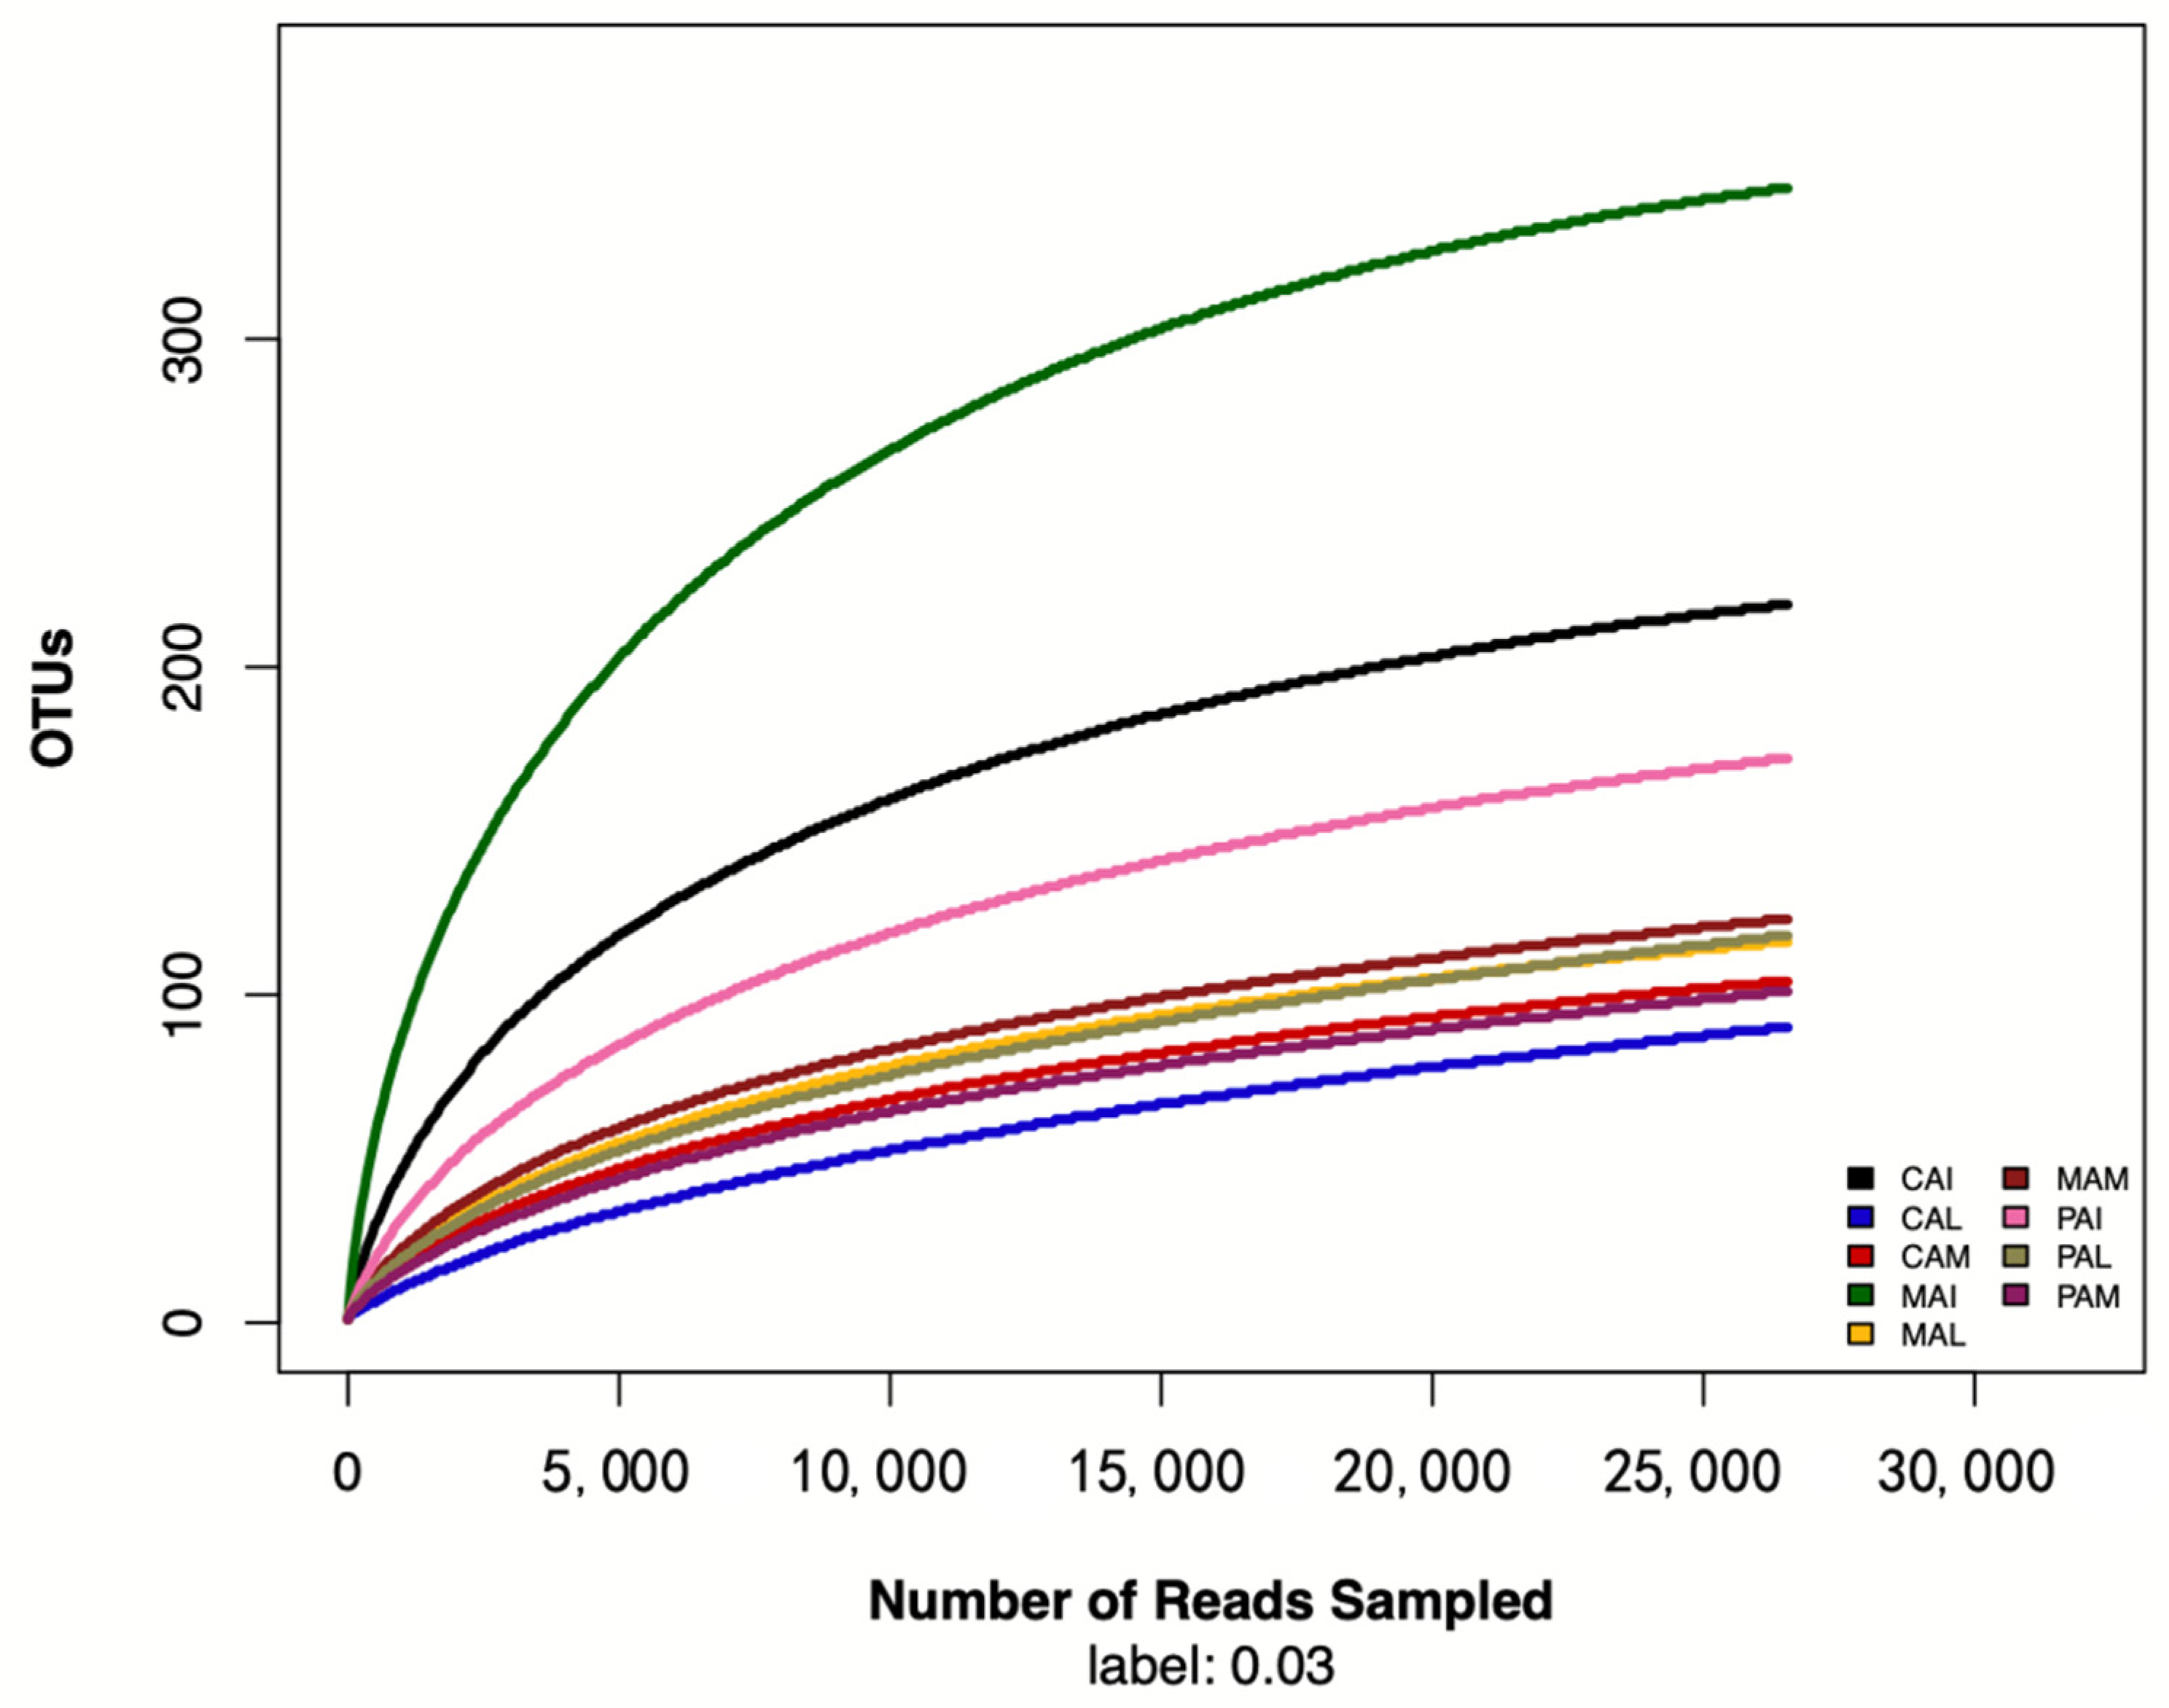
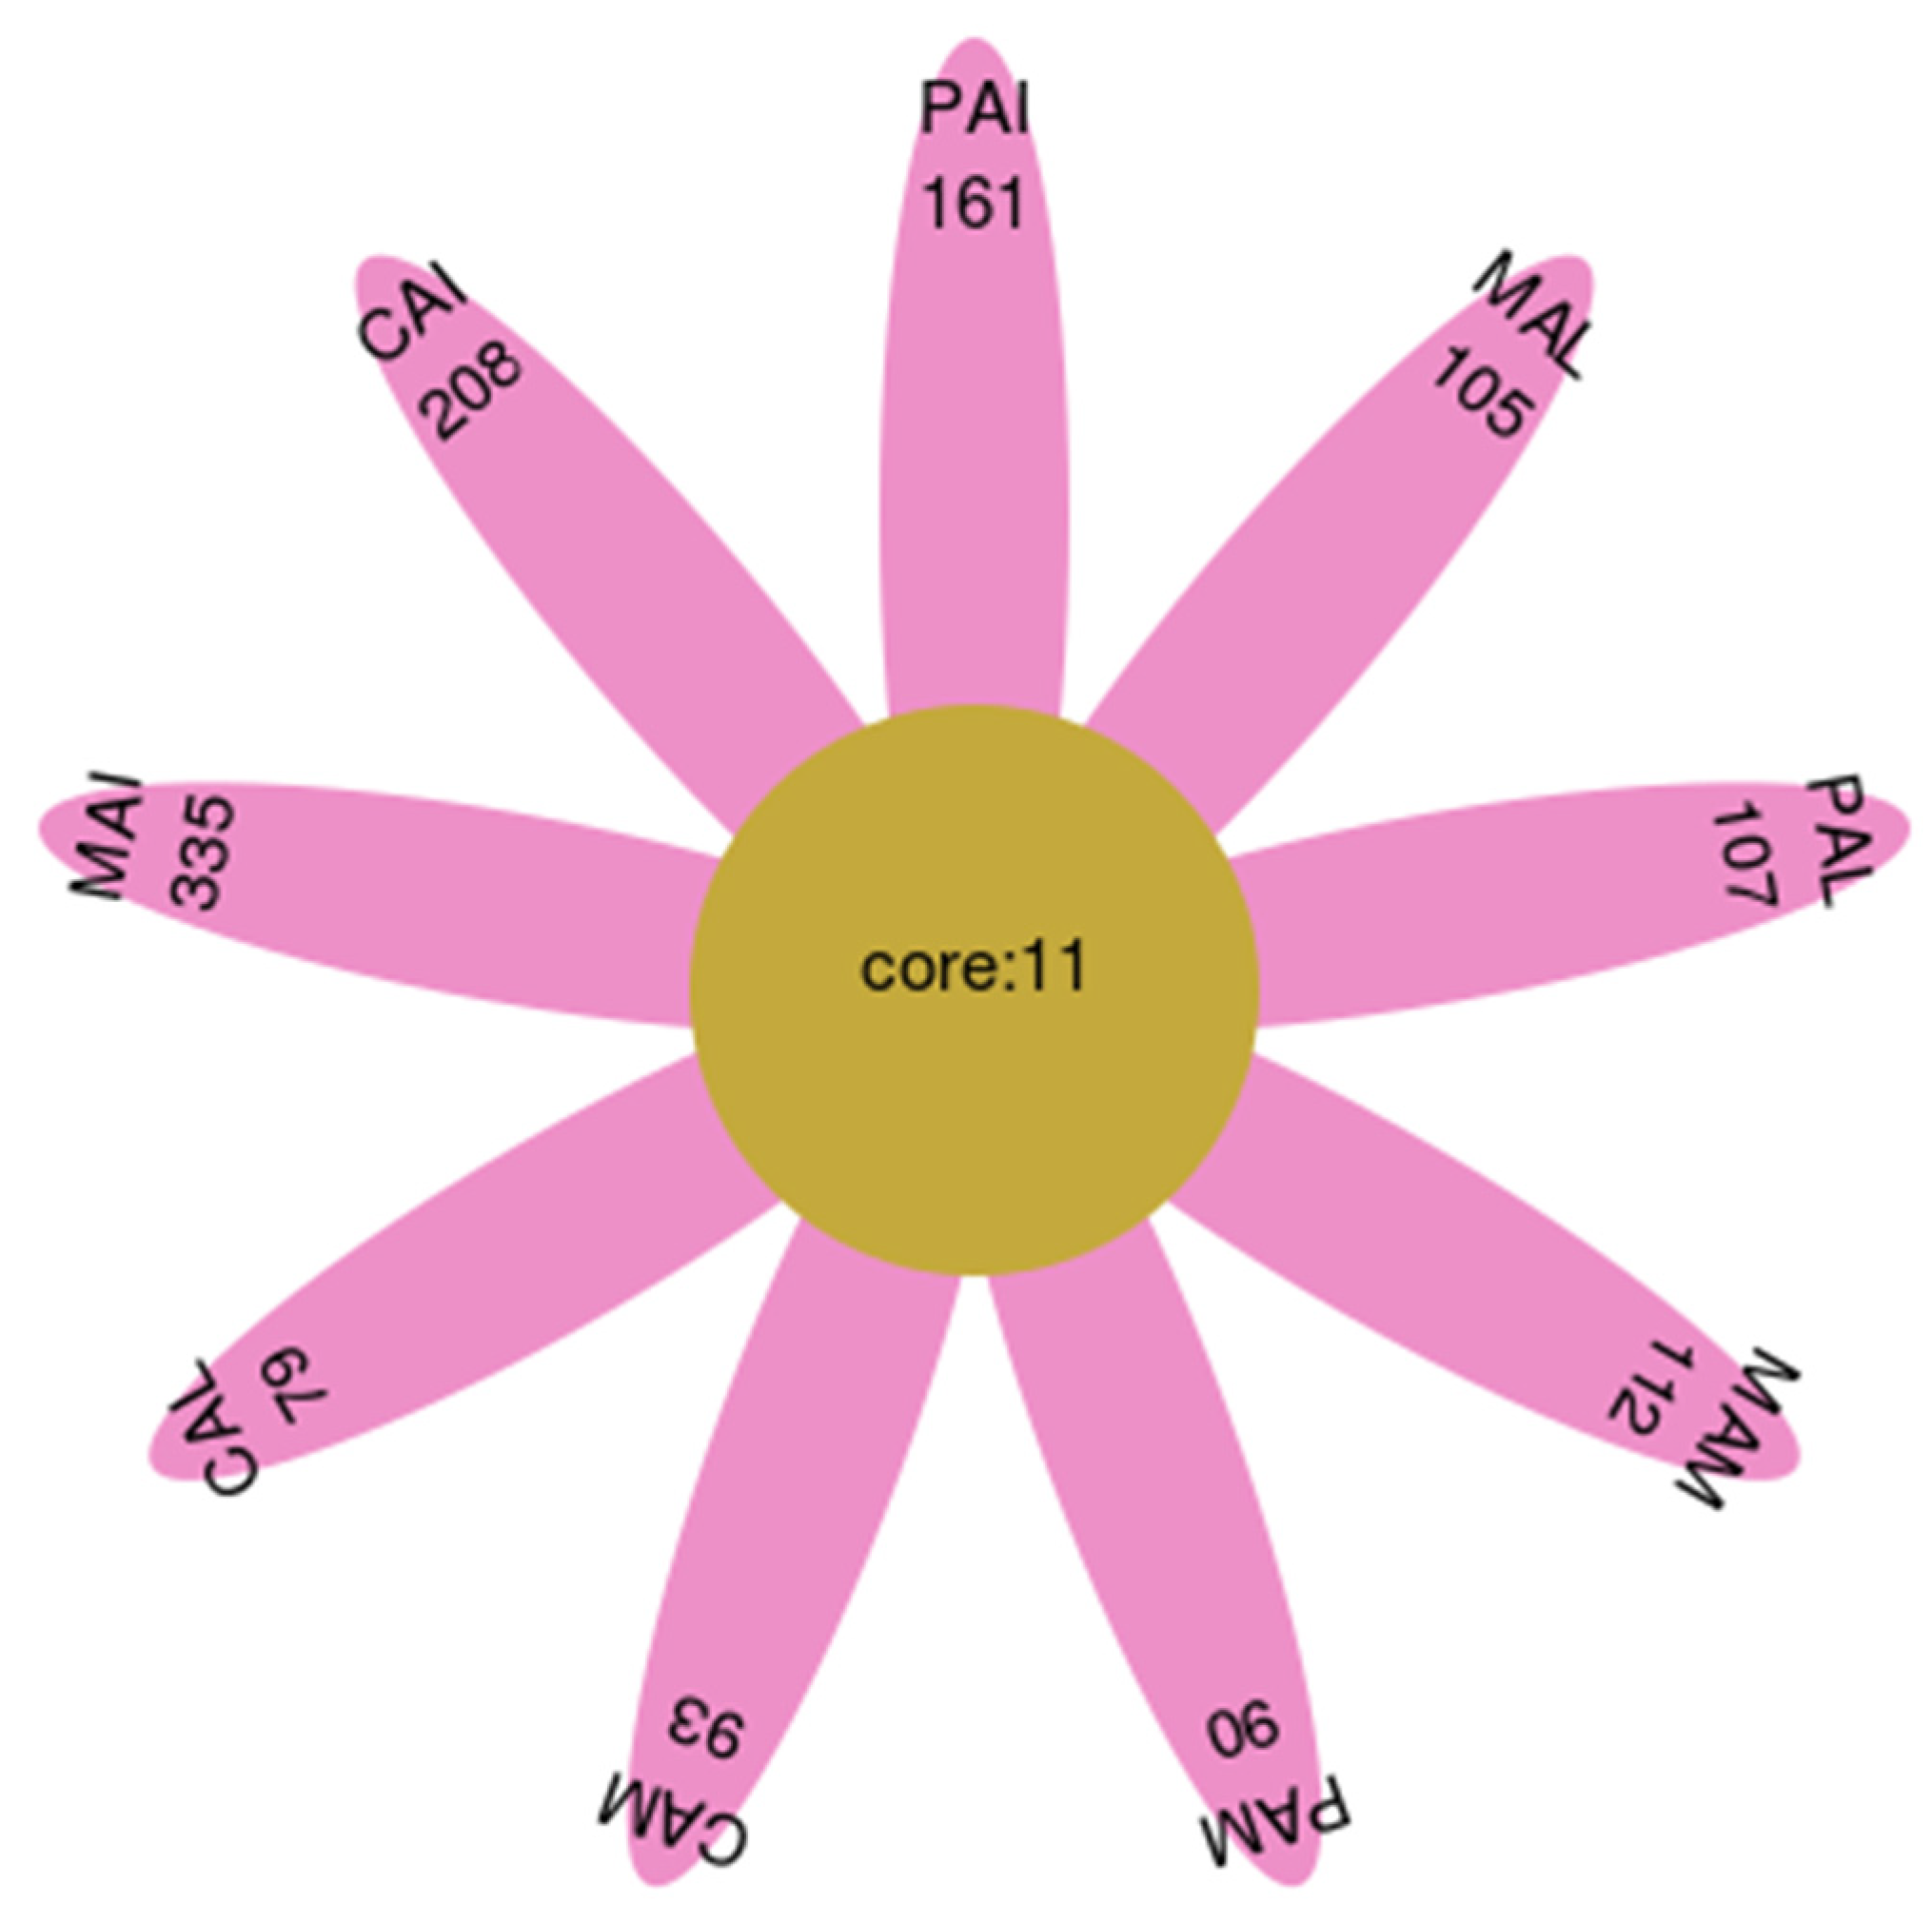
3.1. Sequence Data and OTUs Analysis

After sequencing the samples of Cabernet Sauvignon, Cabernet Franc, and Matheran wines at different fermentation periods, the distribution of high-quality sequences was obtained as shown in Table 1. A total of 361,385 valid sequences were collected from nine samples, and the vast majority of sequences were 420–440 in length, indicating that the sequences were excellent and could be used for subsequent experimental analysis. The dilution curves of the samples are shown in Figure 1, which are constructed by randomly selecting a certain number of individual samples, counting the number of species represented by these individual samples, and using the number of individuals vs. the number of species to construct the curves. In Figure 1 it can be seen that the OTU curve tends to smooth out as the number of effective sequences increases when the number of effective sequences rises above 25,000. This indicates that the amount of data is reasonable and can reflect all samples’ fungal diversity information.
The OTU Venn diagram (Figure 2) was used to visualize the number of OTUs common and unique to the three varieties of wine samples. As can be seen in Figure 2, there were 163 identical OTUs for the three types of samples, 38 unique to Cabernet Sauvignon, 33 unique to Cabernet Franc, and 201 unique to Matheran. This indicates that there are both identical and unique fungal communities in the three varieties. To further demonstrate the OTU distribution of all samples, an OTU distribution petal map (Figure 3) was created to show the number of unique and shared OTUs of all samples. As shown in Figure 3, the total number of OTUs for all samples was 11, indicating the presence of a fungal community that survived the fermentation process.

3.2. Alpha Diversity Analysis of Fungal Flora during Wine Fermentation

An alpha diversity index table, including chao1 index, coverage index, observed_species, PD_whole_tree, Shannon, and Simpson index, can reflect the richness and diversity of samples at different fermentation stages of three wines from the Linfen appellation in Shanxi [15].
The higher the value of the coverage index, the higher the probability of sequences being detected in the samples. The coverage index of all samples was 1.00, indicating that the coverage rate was 100%, which can show the real situation of the fungi in the samples.
The chao1 and observed_species indices represent the estimated number of OTUs in the community and the actual number of OTUs observed with increasing sequencing depth, respectively, which can reflect the abundance of fungal communities in the wine samples at different fermentation periods. As shown in Table 2, the chao1 indices of all three varieties were highest in the pre-fermentation period, indicating that fungal abundance was highest in the pre-fermentation period.
The PD_whole_tree index reflects the spectral diversity of the fungal communities in the samples, i.e., the differences in the preservation of the evolutionary history of the fungal communities. Shannon and Simpson indices reflect the diversity of the fungal communities in the samples at different fermentation periods of the wine, and it can be seen from Table 2 that the trend of fungal community diversity was not consistent for different varieties of wines. For Cabernet Sauvignon, the Shannon and Simpson indices were the highest in the middle of fermentation, indicating that the fungal diversity of Cabernet Sauvignon samples was the highest in the middle of fermentation. Matheran and Cabernet Franc had the highest Shannon and Simpson indices at the pre-fermentation stage, indicating that Matheran and Cabernet Franc had the highest fungal diversity at the pre-fermentation stage.

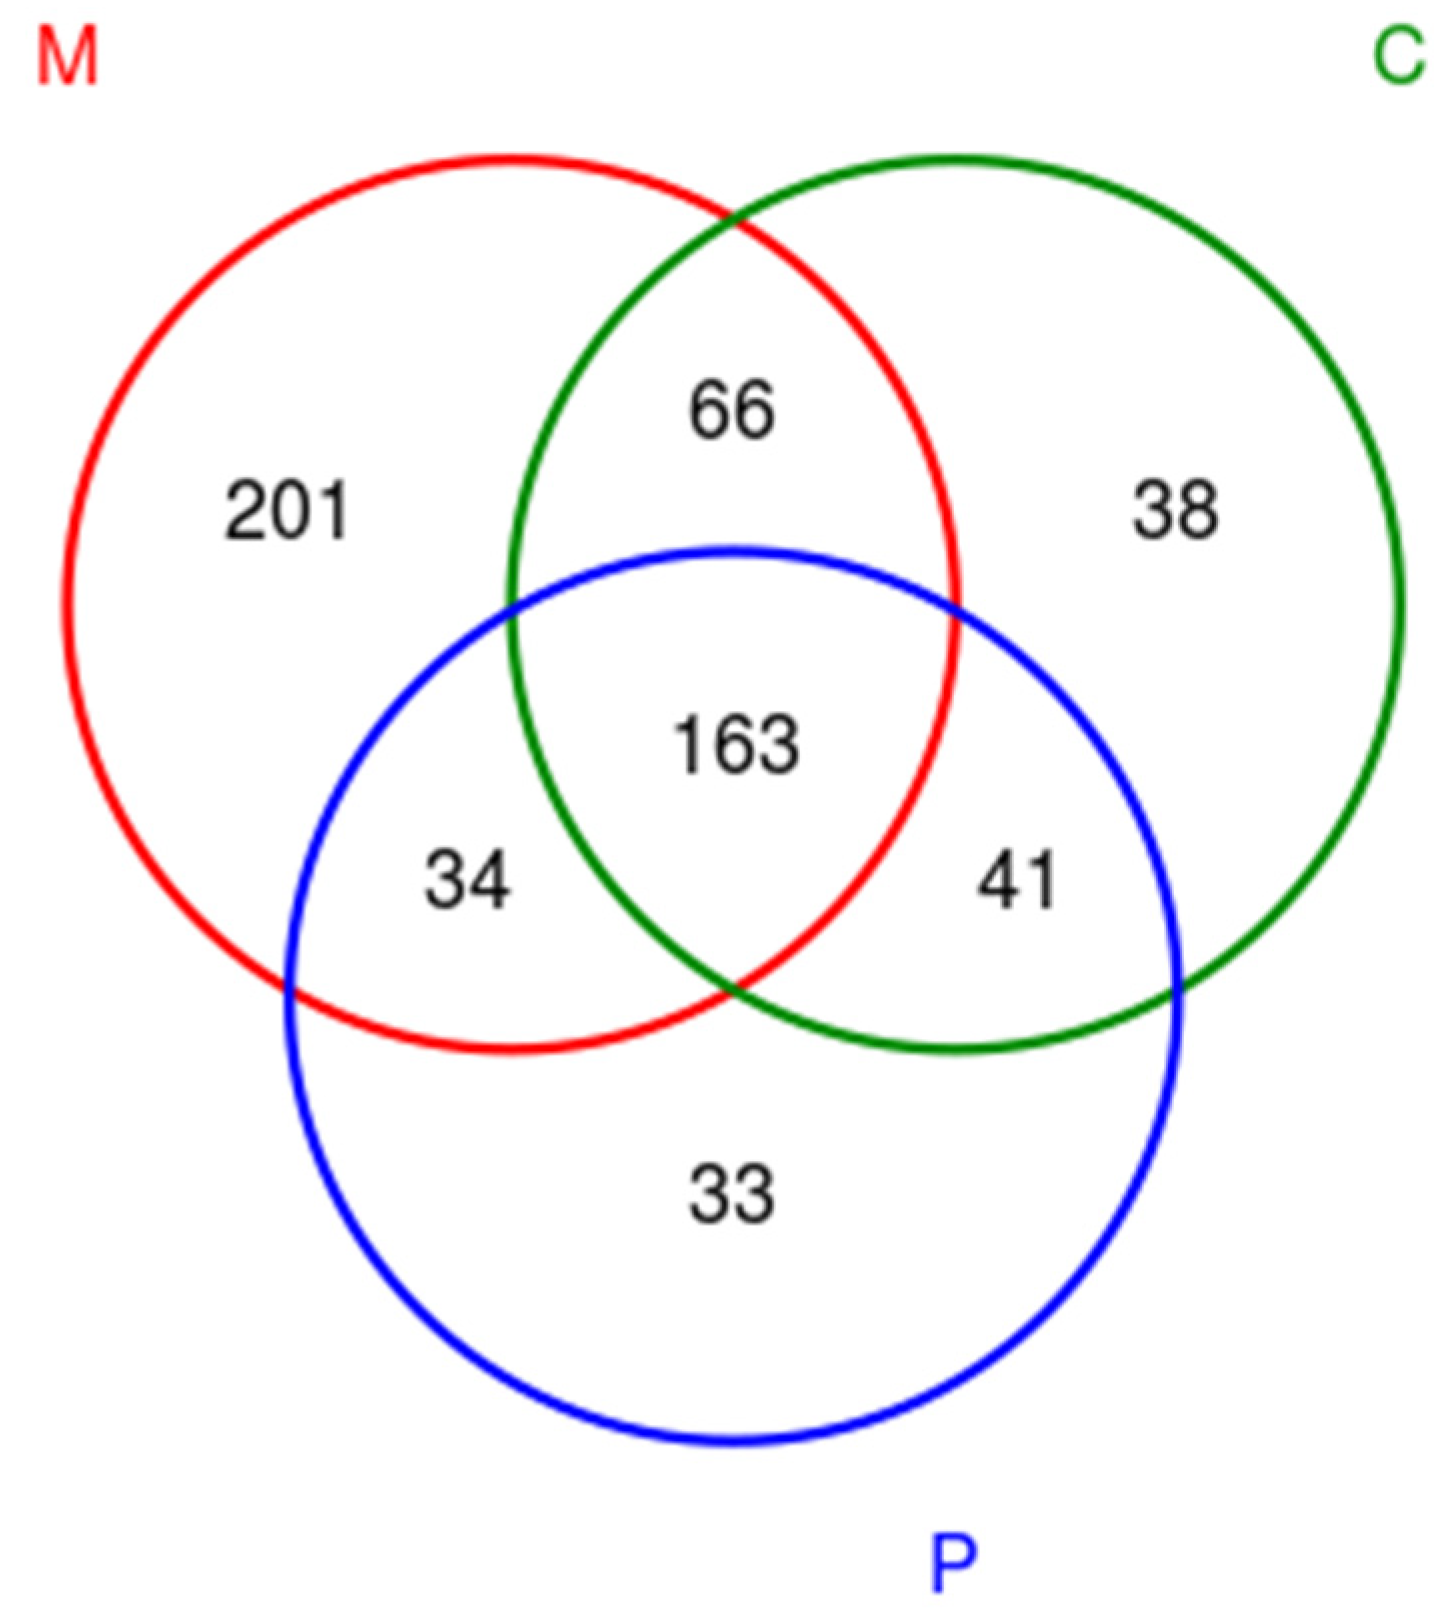
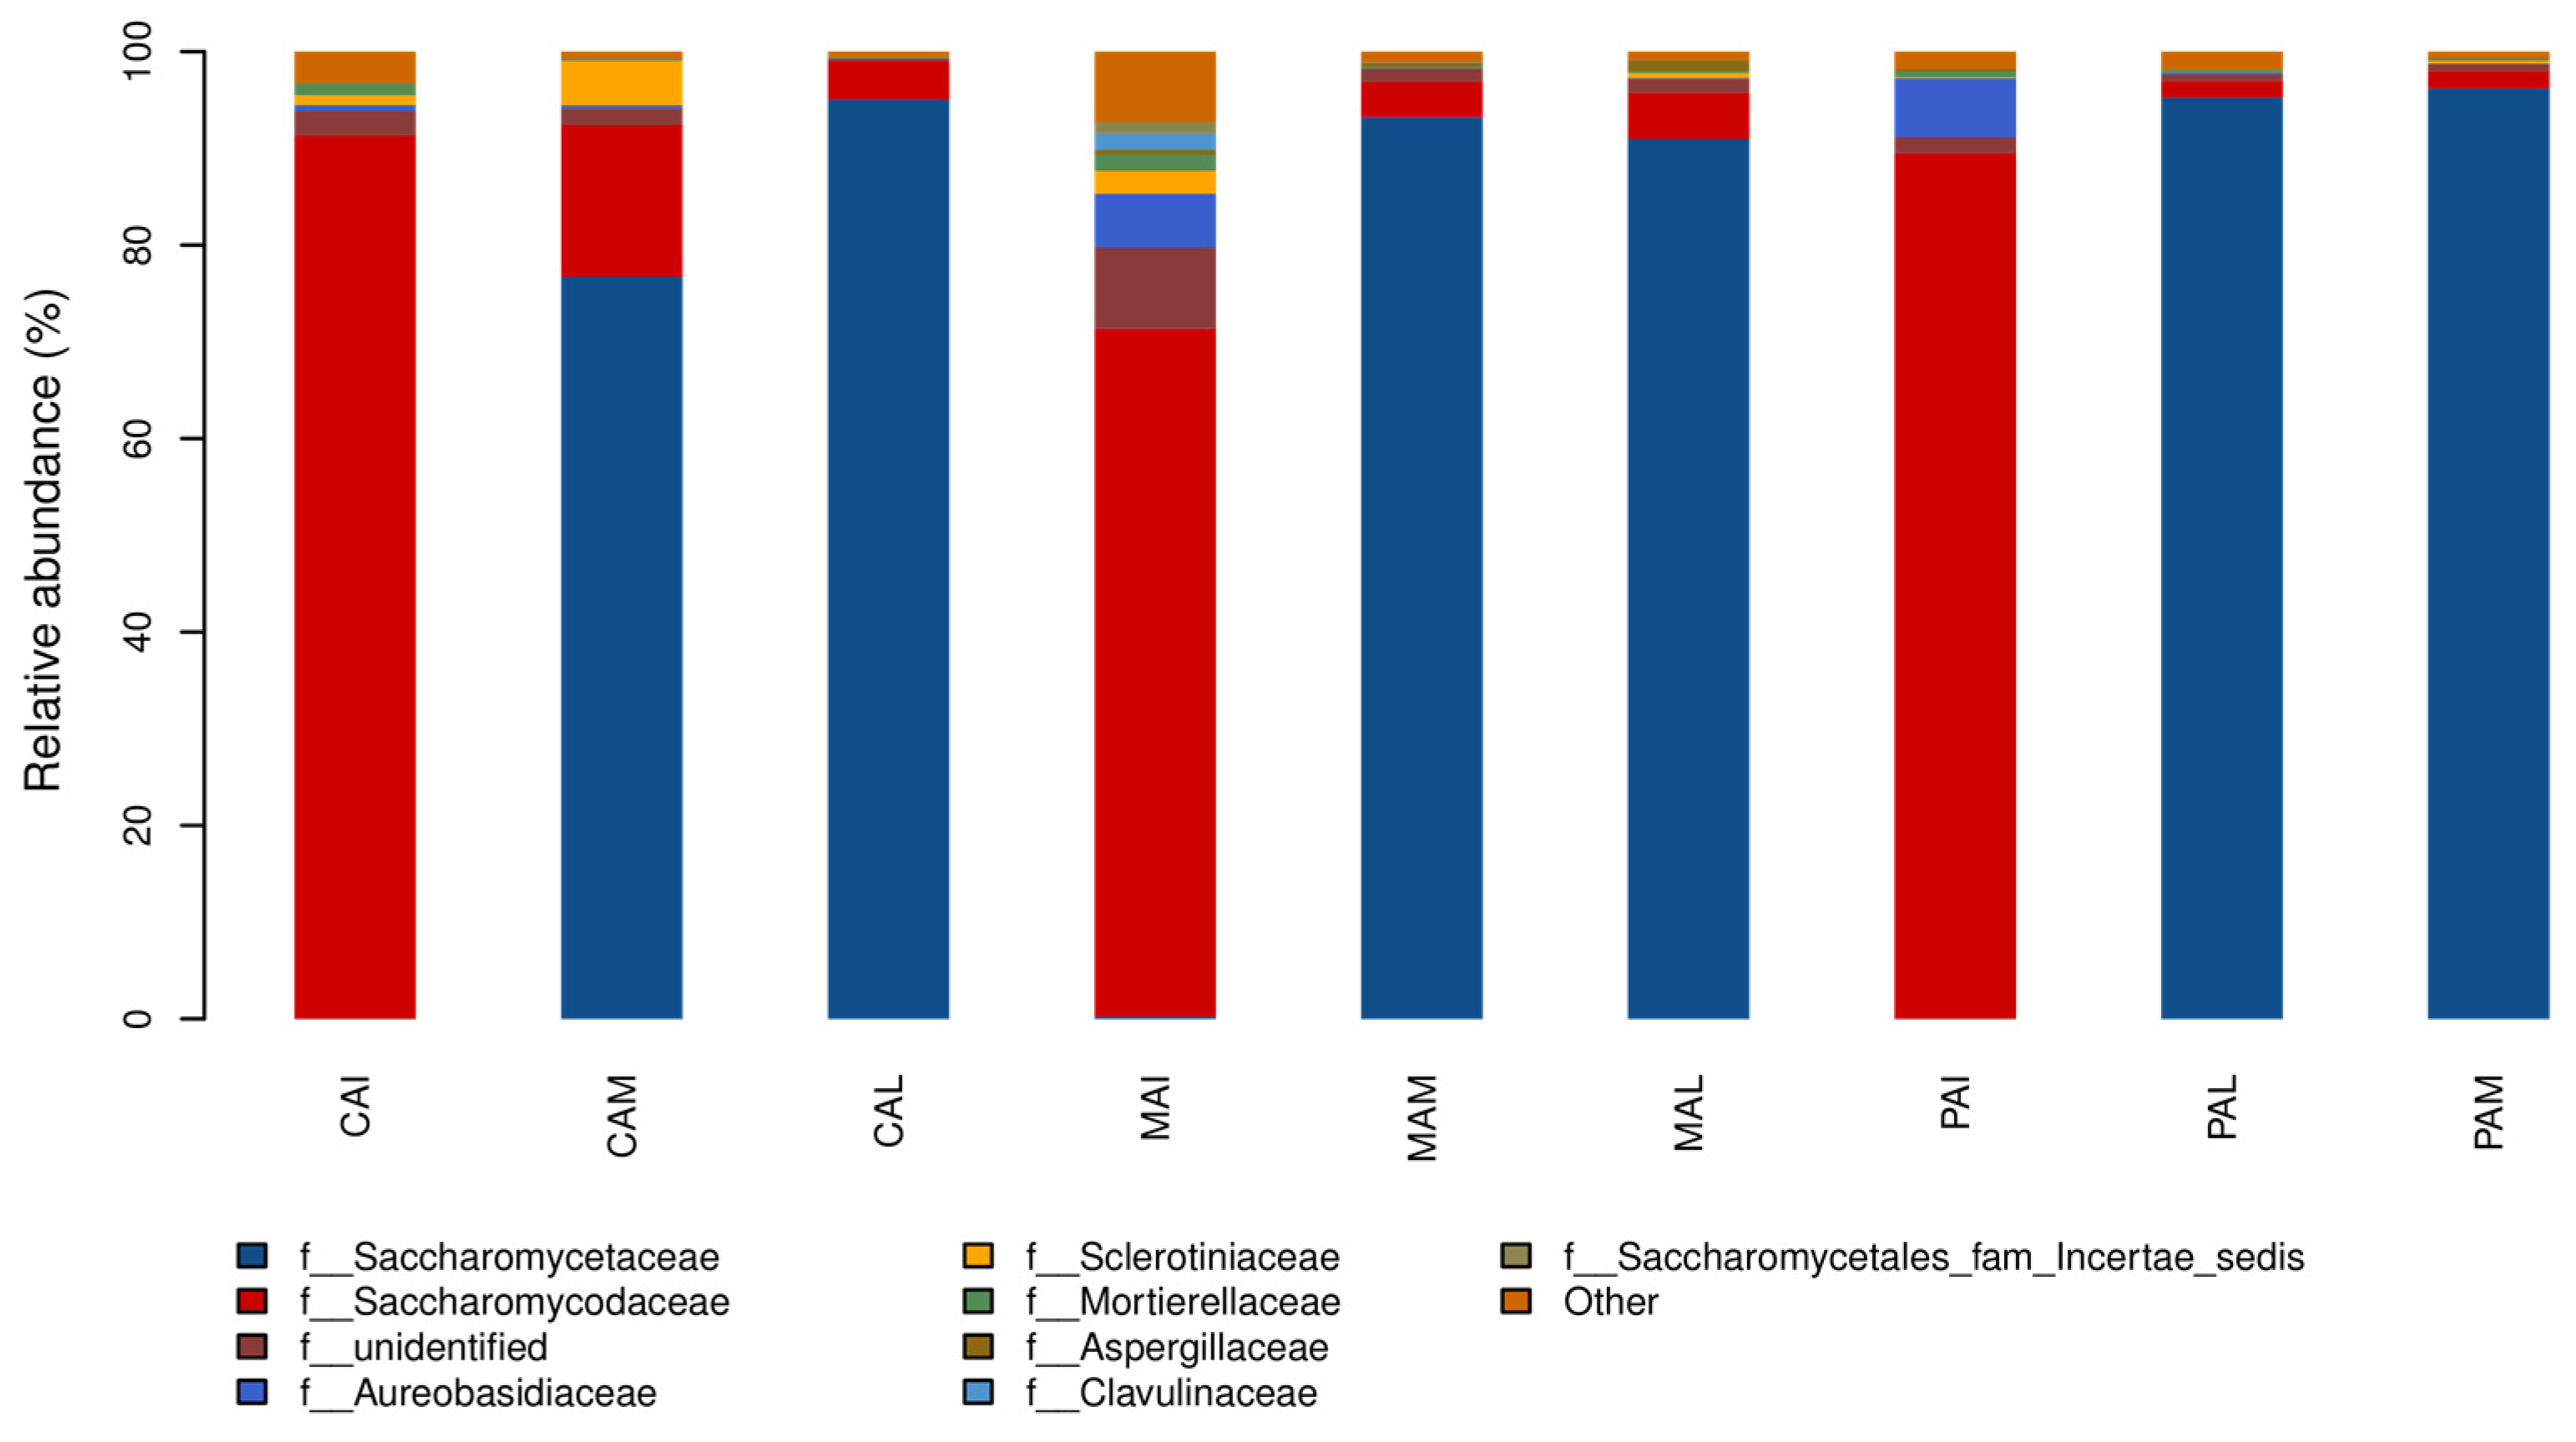
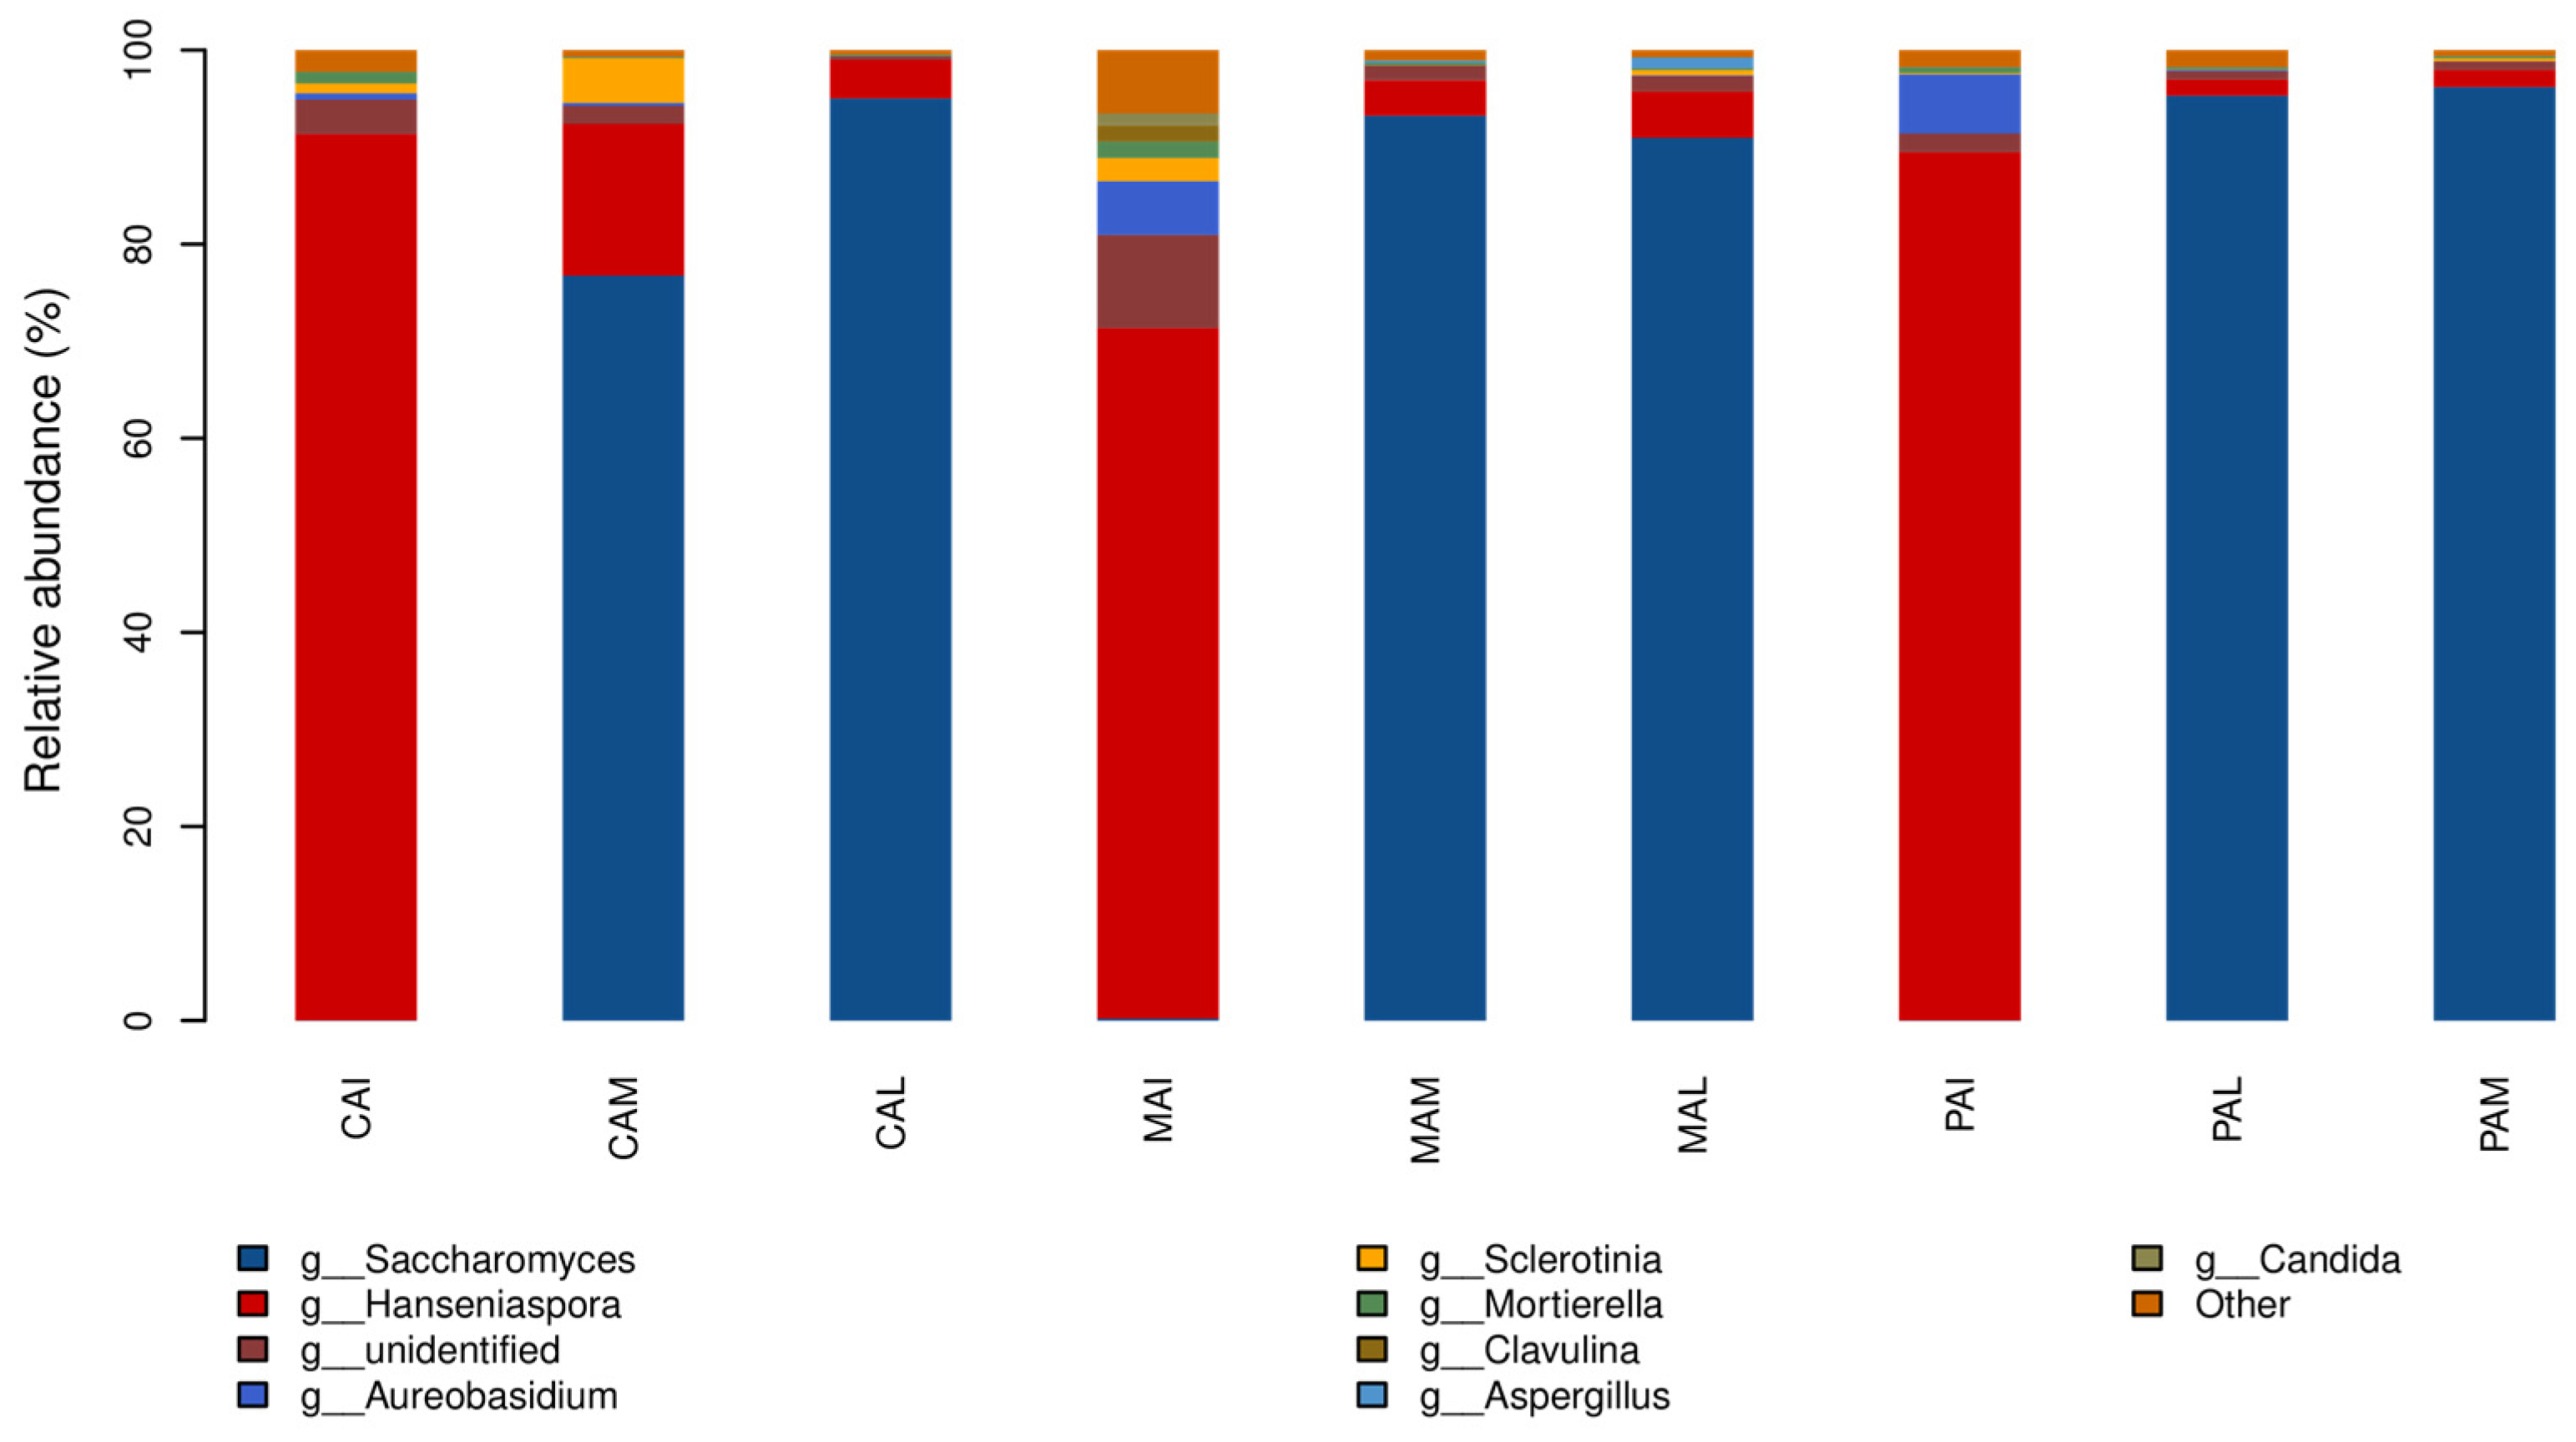
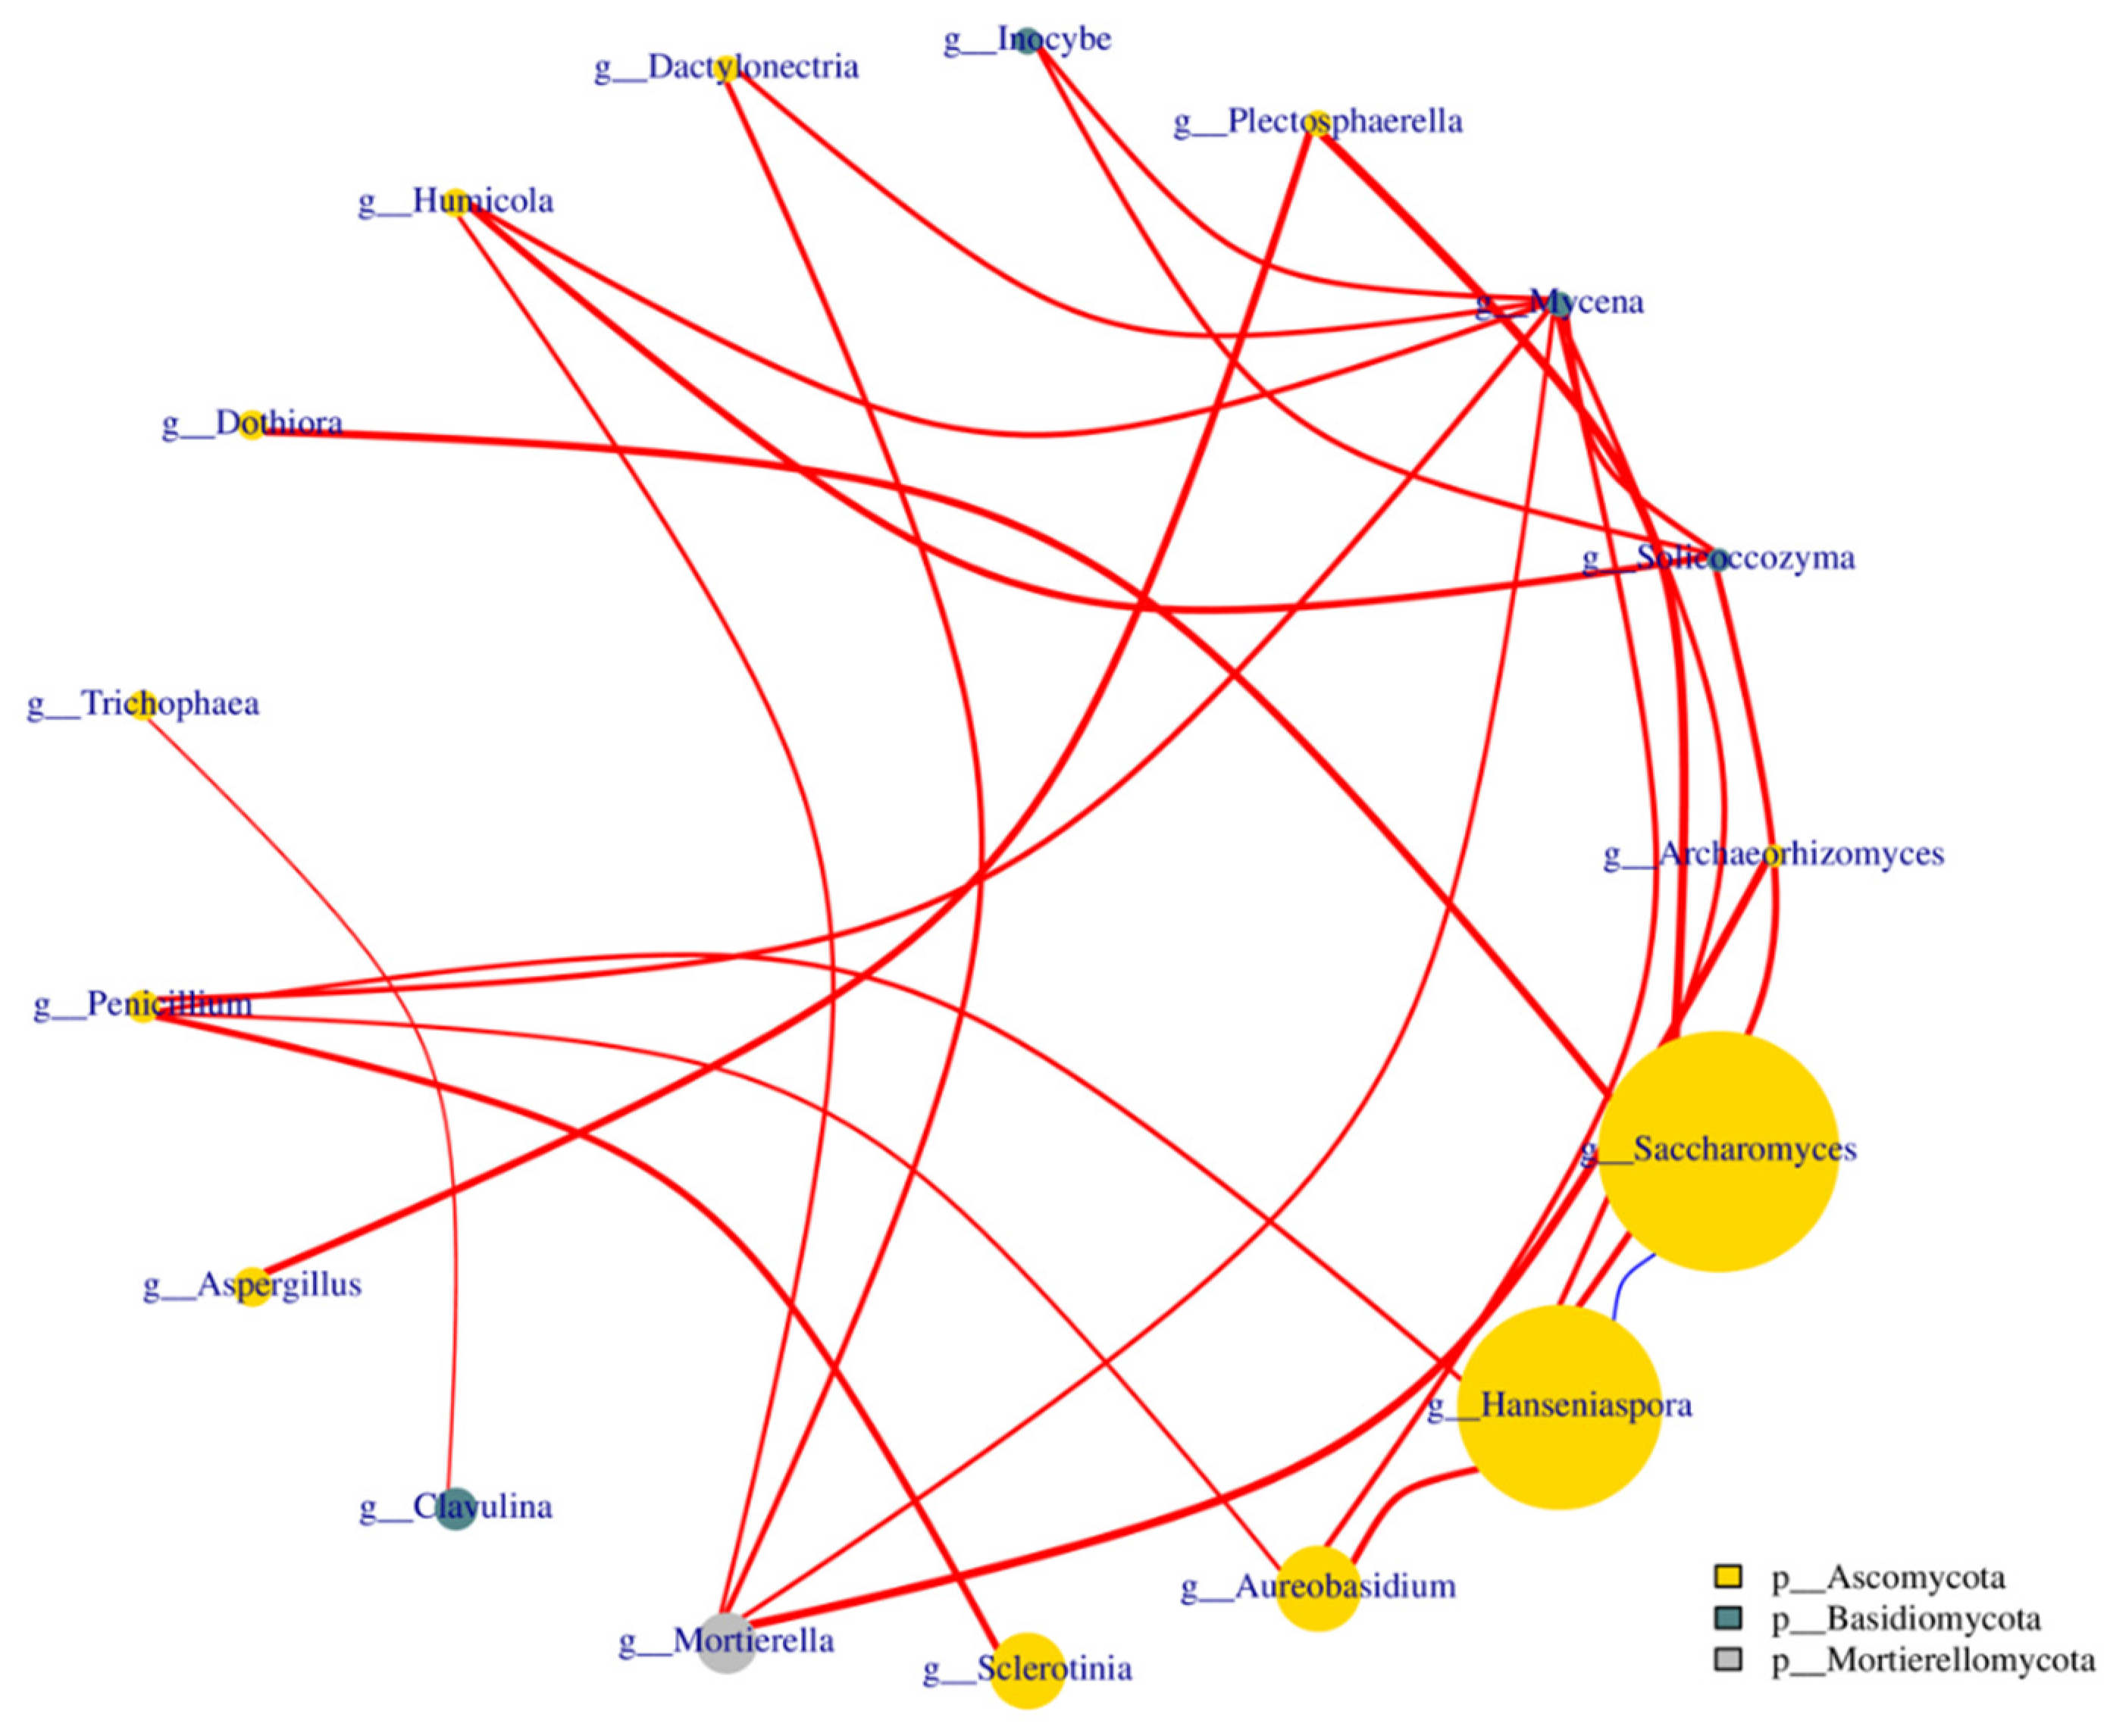
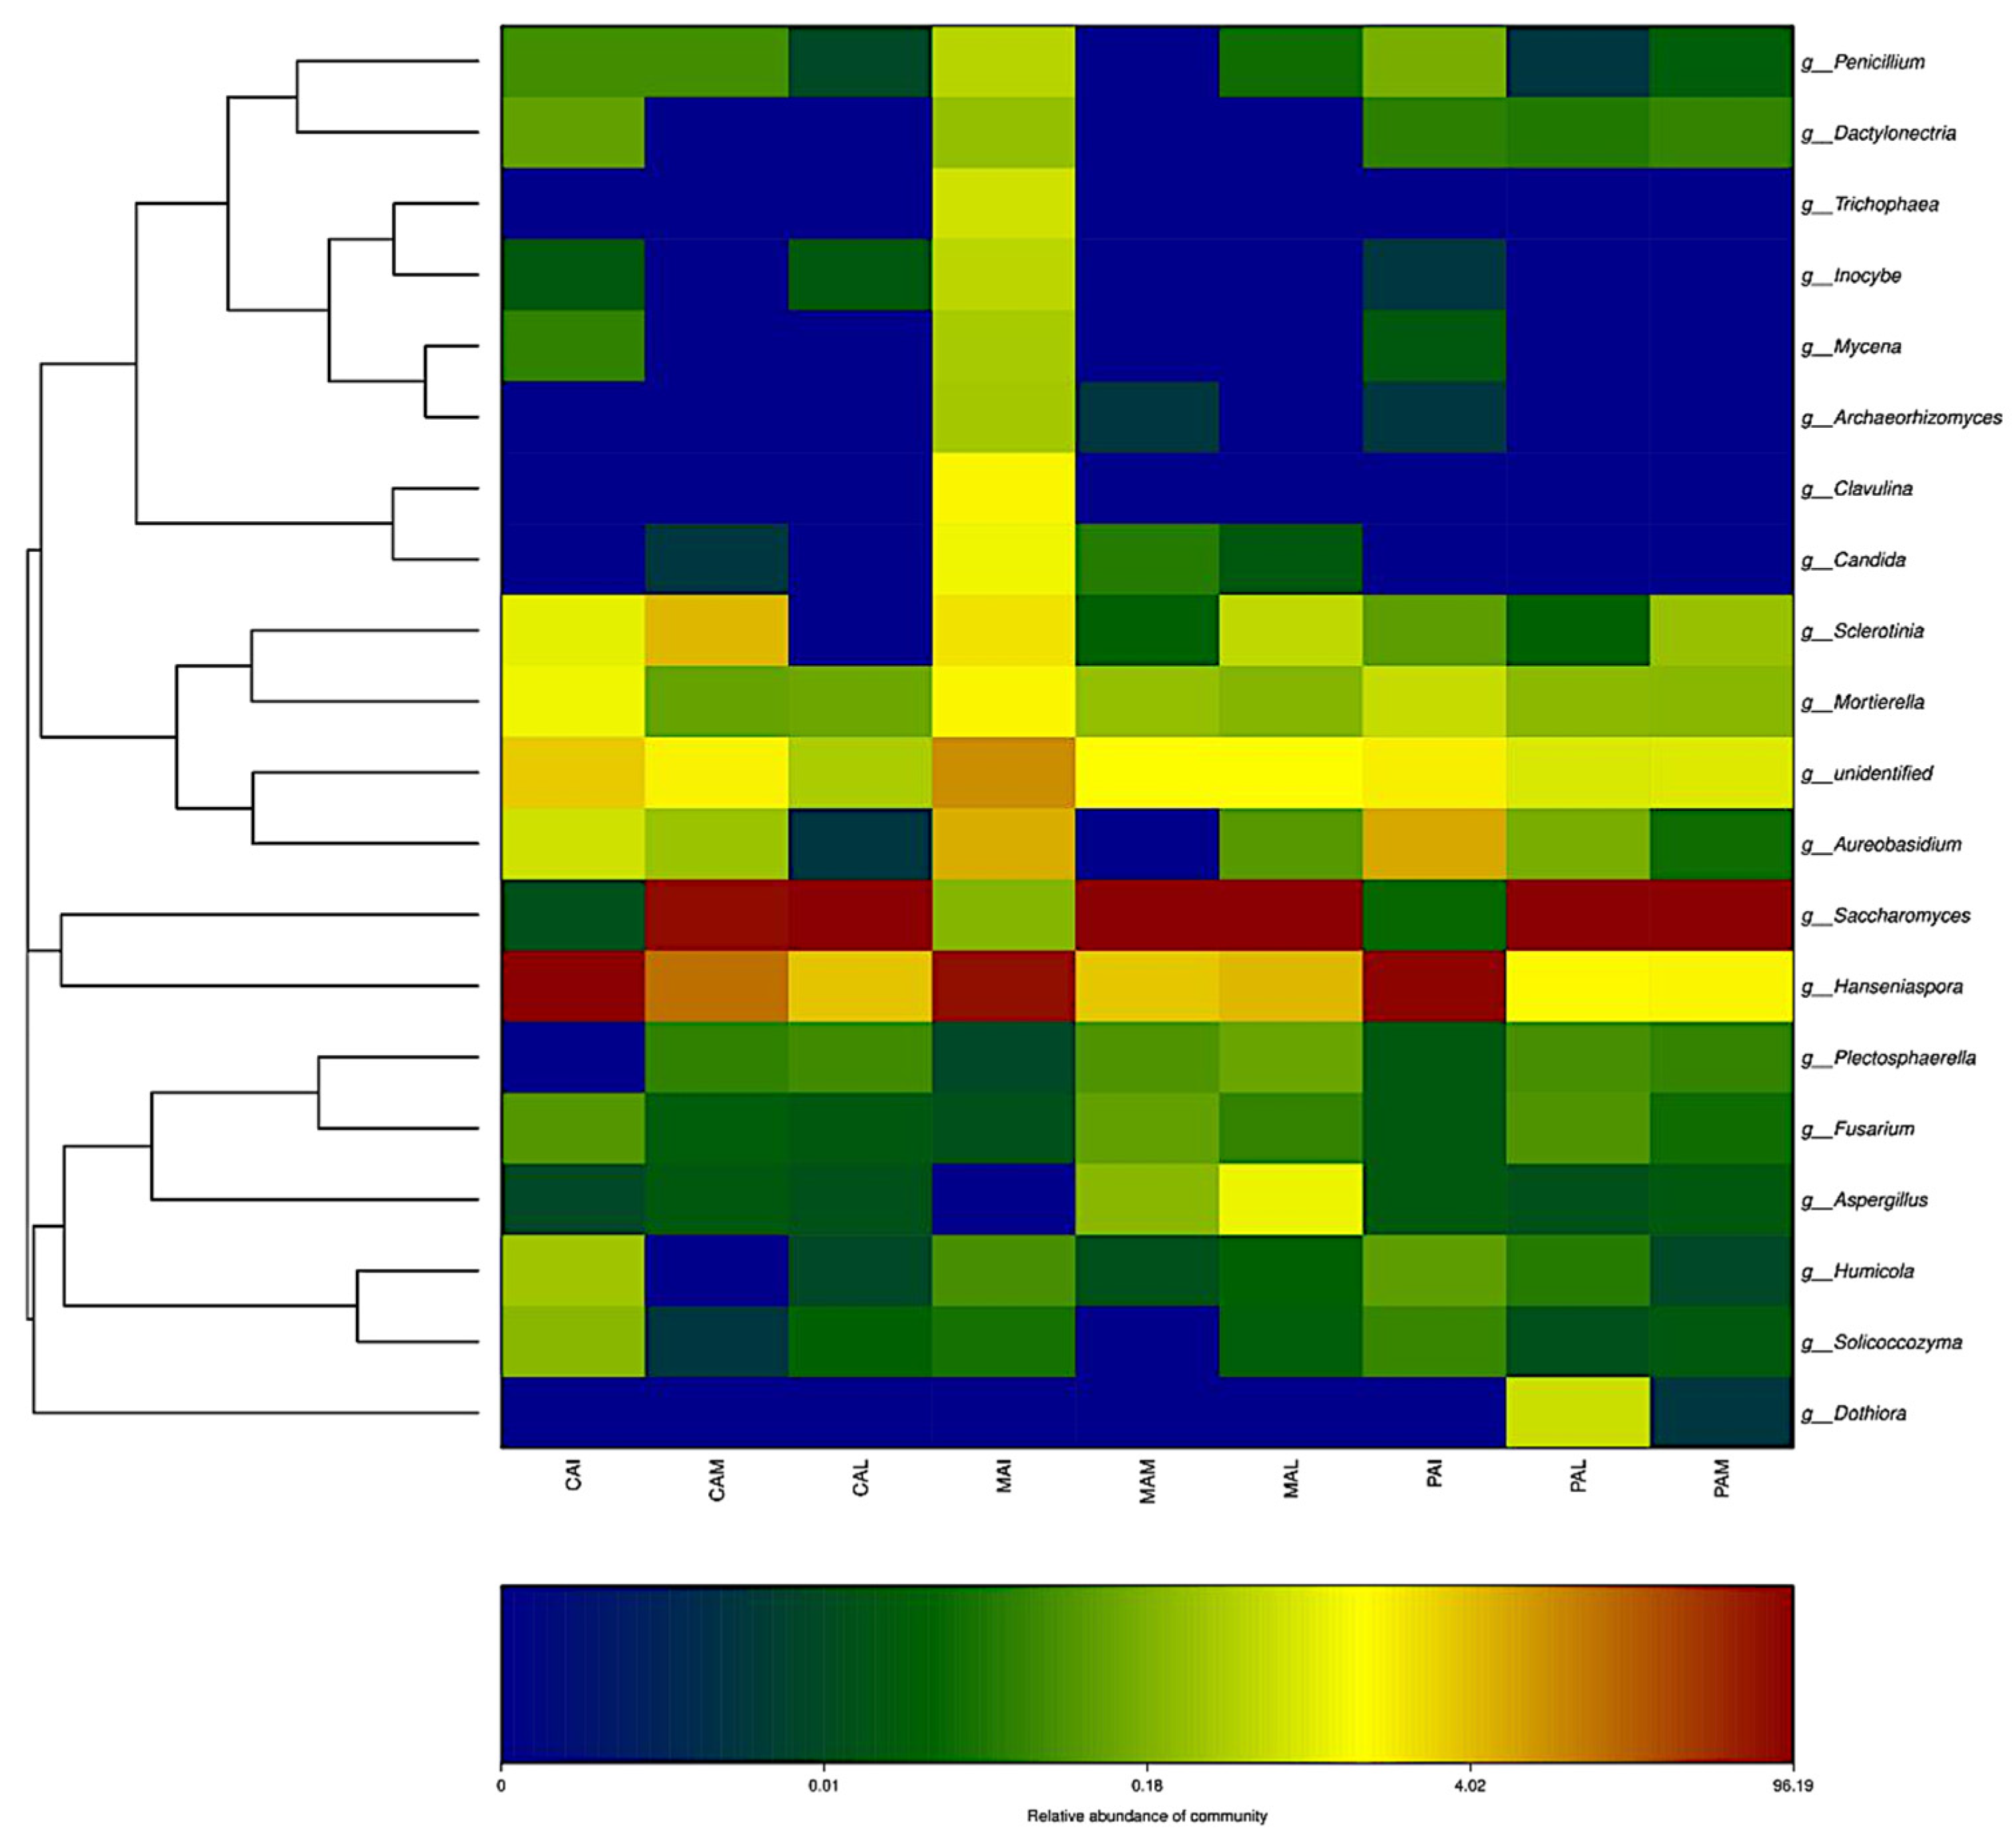
3.3. Taxonomic Distribution and Correlation Analysis of Fungi

A species evolutionary tree was constructed to visualize the species abundance and evolutionary relationships during wine fermentation in Linfen, Shanxi. As shown in Figure 4, a total of 187 genera were detected in the nine samples of this study, belonging to 10 phyla, including Ascomycota, Basidiomycota, and Mortierellomycota. A total of 125 genera belonged to Ascomycota and 46 genera belonged to Basidiomycota, and Ascomycota and Basidiomycota were the dominant phyla. Zhang et al. [16] found that the fungal communities on the skins of wine grapes in the Shacheng appellation were only Ascomycota, Basidiomycota, and Zygomycota, indicating that there are some differences in the structure of fungal communities in different appellations.
The fungal distributions of Cabernet Sauvignon, Matheran, and Cabernet Franc samples at different fermentation periods were demonstrated at the family and genus levels by comparing and analyzing the representative sequences of OTUs to obtain the taxonomic information of each OTU. Based on the integration of species abundance at the family level is shown in Figure 5, a total of 125 different families of fungi were identified from the nine samples, and the eight dominant families with content above 1.00% were Saccharomycetaceae, Sclerotiniaceae, Saccharomycetales Incertae sedis, Saccharomycodaceae, Mortierellaceae, Aspergillaceae, Aureobasidiaceae, and Clavulinaceae. The relative abundance of Saccharomycodaceae in Cabernet Sauvignon, Matheran, and Cabernet Franc samples was the highest in the early fermentation period, with 91.36%, 71.17%, and 89.48%, respectively. At mid-fermentation, the relative abundance of Saccharomycetaceae in Cabernet Sauvignon, Matheran, and Cabernet Franc samples was the highest, at 76.76%, 93.25%, and 96.19%, respectively. The relative abundance of Saccharomycetaceae in Cabernet Sauvignon, Matheran, and Cabernet Franc samples was the highest at 95.04%, 90.98%, and 95.31%, respectively, at the end of fermentation. Saccharomycodaceae and Saccharomycetaceae constituted the main fungal groups in the pre-fermentation, middle, and late fermentation stages of wines from the Linfen appellation in Shanxi Province, and had a significant influence on the whole fermentation process.
Based on the integration of species relative abundance of samples at the genus level, shown in Figure 6, a total of 187 fungi of different genera were identified from nine samples, and it can be seen from the figure that the eight dominant genera with content above 1.00% were Hanseniaspora, Mortierella, Sclerotinia, Aureobasidium, Saccharomyces, Aspergillus, Clavulin, and Candida.
As shown in Figure 6, Hanseniaspora dominated in the pre-fermentation period, with the relative abundance of 91.36%, 89.48%, and 71.17% for the Cabernet Sauvignon, Matheran, and Cabernet Franc samples, respectively. Saccharomyces accounted for only a small percentage with a relative abundance of 0.01%, 0.21%, and 0.03% in the Cabernet Sauvignon, Matheran, and Cabernet Franc samples, respectively. Mendoza [17] et al. found that non-Saccharomyces cerevisiae, belonging mainly to Hanseniaspora and Candida, was co-cultured with Saccharomyces cerevisiae, and the wines obtained presented higher concentrations of higher alcohols, esters, and terpene alcohols as well as stronger aromas. At mid-fermentation, Saccharomyces dominated, with relative abundances of 76.76%, 93.24%, and 96.19% in the Cabernet Sauvignon, Matheran, and Cabernet Franc samples, respectively. In the middle stage of fermentation, Saccharomyces dominated with a relative abundance of 76.76%, 93.24%, and 96.19% in the Cabernet Sauvignon, Matheran, and Cabernet Franc samples, respectively. In the late fermentation stage, the relative abundance of Saccharomyces was 95.04%, 90.98%, and 95.31% in the Cabernet Sauvignon, Matheran, and Cabernet Franc samples, respectively, and still dominated. By comparison, the relative abundance of Hanseniaspora decreased to 3.96%, 4.78%, and 1.67% in the Cabernet Sauvignon, Matheran, and Cabernet Franc samples, respectively. Saccharomyces became the core microorganism in the middle and late stages of fermentation. This indicates that as fermentation proceeded, Saccharomyces cerevisiae microorganisms in Saccharomyces rapidly adapted to the environment and proliferated under the high abundance of Hanseniaspora stress for ethanol fermentation. Therefore, Saccharomyces in the fermentation broth replaced Hanseniaspora as the microorganism with the greatest relative abundance in the middle and late stages of fermentation.
The results of the top 20 genera in absolute abundance for all samples were selected for correlation analysis by Spearman’s test, and the corresponding gates were used as the legend. The calculated results were filtered out from those with p-values greater than 0.05 or correlation values |R| < 0.4 for plotting to obtain Figure 7. As the figure shows, Hanseniaspora showed a negative correlation with Saccharomyces; Hanseniaspora showed a positive correlation with Aureobasidium.

3.4. Dynamic Changes of Fungal Flora

The top 20 genera in terms of relative abundance values were selected and, based on their abundance information in samples at different fermentation stages, a cluster analysis was performed; with species and samples as classification objects, a heatmap was constructed to facilitate observation of the distribution of fungal communities at different fermentation stages of single variety wine samples, and at the same fermentation stage of different variety wine samples. As can be seen in Figure 8, the relative abundance of dominant groups of fungi such as Hanseniaspora and Saccharomyces at the different fermentation stages of dry red wines was similar in all the samples. Moreover, the differences among the samples were immediately apparent; for example, the abundance of Candida was significantly higher in the pre-fermentation samples of Matheran than in the other samples. Non-Saccharomyces cerevisiae, represented by Candida, can produce β-glucosidase, which hydrolyzes flavor compounds present as glycosylated precursors in wine to form free volatiles, thus improving the flavor of the wine [18]. Aspergillus is the second dominant genus in the fermentation of red glutinous rice wine and is associated with the production of bitter and sweet amino acids, which play an important role in balancing the taste of the wine [19].
To further investigate the influence of the dynamics of fungal flora on wine quality during fermentation, 12 representative species with a high relative abundance and important roles were selected to show their proportional distribution in nine samples based on their abundance information in different samples. As shown in Table 3, Hanseniaspora uvarum dominated in the pre-fermentation period, with 71.15% to 91.36% in the different samples. H. uvarum was mostly derived from grape berries and was the class of yeast with the highest percentage in the vineyard [20]. Therefore, H. uvarum in the pre-fermentation samples may be derived from wine grape skins. The abundance of H. uvarum gradually decreased as the fermentation time increased. However, traces were still present in the late fermentation period, indicating that H. uvarum survived throughout the fermentation process, which is consistent with the study by Andorrà et al. [21].
Saccharomyces cerevisiae accounted for only 0.01% to 0.21% in the early stages of fermentation but dominated in the middle and late stages, accounting for more than 90%. This is because S. cerevisiae possesses efficient sugar conversion [22], good alcohol and temperature tolerance, and strong competition for limited nutrients, gradually replacing other yeasts in the middle and late stages of fermentation.
Aureobasidium pullulans were present in every sample and showed the highest levels in the pre-fermentation period of each variety. A. pullulans is a pectinolytic strain that produces more elevated amounts of pectinase and reduces filtration time. It can also increase the total anthocyanin content and improve the full polyphenol index and color, thus improving the sensory characteristics of the wine [23].
Mortierella alpina was present in every sample, with the highest percentage of 0.26% in pre-fermentation Cabernet Sauvignon samples. M. alpina is an oil-producing filamentous fungus with a strong lipid synthesis capacity that produces arachidonic acid [24], which is essential for the development of the human brain and optic nerve and has an important role in improving intelligence and vision levels. It also has important effects in preventing cardiovascular diseases, diabetes, and tumors [25,26,27].
Candida tropicalis was present only in samples of Matheran species and had the highest abundance in the pre-fermentation period. C. tropicalis is the dominant strain in traditional Mexican palm wines and possesses the ability to produce ethanol in high-temperature environments [28].
Issatchenkia orientalis was present only in Matheran samples, decreased in abundance in the middle stages of the fermentation, and largely disappeared in the later stages. This is in agreement with the findings of Maurizio et al. [29]. I. orientalis is an acid-, ethanol-, and temperature-tolerant native yeast [30] that can rapidly degrade malic acid in a medium with malic acid as the only carbon and energy source [31].
Aspergillus niger was present only in samples from the middle and late stages of fermentation. A. niger is a filamentous fungus and the dominant strain in red glutinous rice wine that promotes the production of 2-methylpropanoic acid, 2-heptanoic acid, isoamyl acetate, and 2,4-di-test-butyl-phenol [32]. A. niger contains glycosidases that hydrolyze glycosidic terpene alcohols to produce free terpene alcohols, thereby increasing the floral aroma of the wine [33].
Rhodotorula mucilaginosa was present only in the middle and late stages of Matheran fermentation samples. R. mucilaginosa is a non-enological yeast that can produce high levels of β-glucosidase, which can release aroma glycosides from wine grapes, thus adding to their floral and fruity odor [34].
Stachybotrys microspora, present only in mid to late fermentation stage samples of Matheran varieties, is a filamentous fungus with hydrolytic cellulose that promotes red grape juice maceration [35].
Guehomyces pullulans, which is always present during fermentation but only between 0.0075% and 0.0527%, is a cold-tolerant yeast, the dominant strain of Korean rice wine, and one of the traditional fermenters [36].
As shown in Table 3, the distribution of fungi in the alcoholic fermentation process of wine was dominated by yeasts, accounting for more than 90% of the total. To further demonstrate the distribution of yeasts in the fermentation process of dry red wine in the Linfen appellation of Shanxi, the WL medium method was used to distinguish and identify the relevant yeasts, the yeast species, and the number of each type of yeast. As shown in Table 4, the main yeast species in the fermentation of dry red wine in the Linfen appellation of Shanxi Province were H. uvarum, S. cerevisiae, C. tropicalis, I. orientalis, and R. sp., which were basically consistent with the results obtained by sequencing. Wang et al. [8] noted the yeast composition during the natural fermentation of Cabernet Sauvignon in the Yantai region as S. cerevisiae, P. kluyveri, H. uvarum, H. occidentalis, I. occidentalis, and I. orientalis. The same as well as unique yeast species exist in the microbial communities of the fermentation mashes of different wines in different regions.

3.5. Beta Diversity Analysis of Fungal Flora during Wine Fermentation

PLS-DA analysis (Partial Least Squares Discrimination Analysis) is a multivariate statistical analysis method for discriminant analysis. Discriminant analysis is a common statistical analysis method that determines how a study object is classified based on the observed or measured values of several variables. Unlike principal component analysis (PCA), it is a supervised statistical method for discriminant analysis. The technique uses PLS-DA to model the relationship between microbial content and sample category to predict the sample category.
PLS-DA analysis was used to investigate further the differences in fungal diversity among wines of different varieties and fermentation stages (see Figure 9). The horizontal axis (PC1) and vertical axis (PC2) represent the first and second principal components of fungal diversity differences, respectively, and the magnitude of their contribution to the differences in fungal diversity is expressed as a percentage [21]. A total of 37.68% and 12.76% were contributed by the first and second principal components, respectively, indicating that these two principal components are the key factors that can reflect the differences in the structural composition of fungal communities in all samples. The more similar the fungal diversity was between different samples, the closer the points scattered in the graph were. The distance between the wine samples of different varieties is farther, indicating some influence of wine grape varieties on the composition of wine fungal microorganisms.
As shown in Figure 9, PAI, PAM, and PAL samples were close to each other, indicating that the differences between these three samples were relatively small, i.e., the composition of the Cabernet Franc fungal community was relatively stable in the pre-fermentation, middle, and late fermentation stages. Similarly, MAI was farther away from MAM and MAL samples, but MAM was closer to MAL samples, which indicated that Matheran also underwent great changes in fungal communities in the early fermentation stage and stabilized in the middle and late stages. On the whole, the fungal community composition of the Cabernet Franc wines was stable at different fermentation stages. By contrast, the fungal community of the Matheran wines varied strongly in the early stage of fermentation, although it stabilized in the middle and late stages, consistent with the trend of the Cabernet Sauvignon wines.

4. Conclusions

This paper used high-throughput sequencing technology to determine the fungal microbial diversity of three dry red wines, Cabernet Sauvignon, Matheran, and Cabernet Franc, before, during, and after natural fermentation. The following conclusions were obtained:
The results of Alpha diversity analysis showed that all three varieties showed the highest chao1 index in the pre-fermentation period, indicating the highest fungal flora richness in the early fermentation period. The Cabernet Sauvignon samples showed the highest fungal diversity in the middle stage of fermentation, and the Matheran and Cabernet Franc samples showed the highest fungal diversity in the pre-fermentation period.
Based on OTU analysis and species annotation results, a total of 10 phyla, 125 families, and 187 genera were detected in the nine samples of this study. The main fungal phyla were Ascomycota, Basidiomycota, and Mortierellomycota, and the main fungal genera were Hanseniaspora, Mortierella, Sclerotinia, Aureobasidium, Saccharomyces, Aspergillus, Clavulina, and Candida. Hanseniaspora is the dominant genus in the pre-fermentation period, and Saccharomyces is the dominant genus in the middle and late fermentation periods.
The dynamics of fungal flora during natural fermentation were as follows: the main species in the pre-fermentation period were H. uvarum, A. pullulans, M. alpina, G. pullulans, and S. cerevisiae, R. sp., C. tropicalis, and I. orientalis. Among them, H. uvarum was dominant, accounting for more than 70%. In the middle stage of fermentation, the proportion of S. cerevisiae increased to more than 75% and dominated, while H. uvarum declined to second place, A. niger, R. mucilaginosa, and R. diobovata appeared, but R. sp no longer existed, and all other species declined. In the later stage of fermentation, S. microspora appeared, and S. cerevisiae accounted for more than 90% of the total, which was absolutely dominant. These strains play an important role in initiating fermentation, increasing the aromatic composition of the wine, and improving the sensory characteristics of the wine.
The main yeast species in the fermentation of dry red wines from the Shanxi Linfen appellation were H. uvarum, S. cerevisiae, C. tropicalis, I. orientalis, and R. sp. using the traditional medium method, which was consistent with the sequencing results and again validated the accuracy of the high-throughput sequencing method.
Beta diversity analysis showed some differences in the fungal communities of different varieties of wine, suggesting that wine grape varieties influence the composition of the fungal community during wine fermentation. Cabernet Franc had a more stable fungal community composition in the pre-fermentation, middle, and late fermentation stages. The fungal communities of Cabernet Sauvignon and Matheran were highly variable in the early fermentation stage and stabilized in the mid and late stages.

Author Contributions

Writing—original draft preparation, M.Z.; writing—review and editing, B.H. and S.X.; designed research, J.S. validation, M.Z.; analyzed data, L.L. and M.Z.; supervision, B.H. All authors have read and agreed to the published version of the manuscript.

Funding

This research was funded by the National Natural Science Foundation of China “Wine Metabolomics and NMR Fingerprint Stud”, grant number NO. 31271857.

Institutional Review Board Statement

Not applicable.

Informed Consent Statement

Not applicable.

Data Availability Statement

All raw data are available at the corresponding author.

Acknowledgments

We acknowledge financial support from the National Natural Science Foundation of China.

Conflicts of Interest

The authors declare no conflict of interest.

References

  1. Maicas, S. Advances in Wine Fermentation. Fermentation 2021, 7, 187. [Google Scholar] [CrossRef]
  2. Knoll, C.; Fritsch, S.; Schnell, S.; Grossmann, M.; Krieger-Weber, S.; du Toit, M.; Rauhut, D. Impact of different malo-lactic fermentation inoculation scenarios on Riesling wine aroma. World J. Microbiol. Biotechnol. 2012, 28, 1143–1153. [Google Scholar] [CrossRef] [PubMed]
  3. Wei, R.T.; Ding, Y.T.; Gao, F.F.; Zhang, L.; Wang, L.; Li, H.; Wang, H. Community succession of the grape epidermis microbes of cabernet sauvignon (Vitis vinifera L.) from different regions in China during fruit development. Int. J. Food Microbiol. 2022, 362, 109475. [Google Scholar] [CrossRef] [PubMed]
  4. Luyt, N.A.; Beaufort, S.; Divol, B.; Setati, M.E.; Taillandier, P.; Bauer, F.F. Phenotypic characterization of cell-to-cell interactions between two yeast species during alcoholic fermentation. World J. Microbiol. Biotechnol. 2021, 37, 186. [Google Scholar] [CrossRef]
  5. Böhmer, M.; Smoľak, D.; Ženišová, K.; Čaplová, Z.; Pangallo, D.; Puškárová, A.; Bučková, M.; Cabicarová, T.; Budiš, J.; Šoltýs, K.; et al. Comparison of microbial diversity during two different wine fermentation processes. FEMS Microbiol. Lett. 2020, 367, fnaa150. [Google Scholar] [CrossRef]
  6. Hu, B.R.; Li, H. Analysis of aromatic composition in the different wine-grapes by gas chromatography-mass spectrometry. Food Ferment. Ind. 2005, 31, 89–92. [Google Scholar]
  7. Hu, B.R.; Yang, X.Y.; Wang, Z.J.; Hua, L. Analysis of aromatic composition in different mono-varietal dry wines from eastern region of Ningxia Helan mountain. Trans. Chin. Soc. Agric. Mach. 2005, 36, 87–90, 113. [Google Scholar]
  8. Jing, Y.; Zhu, Y.; Xu, Y. Mystery behind Chinese liquor fermentation. Trends Food Sci. Technol. 2017, 63, 18–28. [Google Scholar]
  9. Boran, H.U.; Jie, L.U.; Wenbiao, X.U.; Fengmin, Z. Comparative Study on the Changes of Aroma Components in the Grape and Dry Red Wine of Cabernet Sauvignon. Anim. Plant Sci. 2015, 25, 240–246. [Google Scholar]
  10. Wu, C.; Wang, C.; Wang, X.; Zhou, H.; Huang, Y.; Qiu, S. A review of the application of high-throughput sequencing technology in analysis of the diversity of microbial communities involved in the fermentation of alcoholic beverages. Food Sci. 2019, 40, 348–355. [Google Scholar]
  11. del Carmen Portillo, M.; Franquès, J.; Araque, I.; Reguant, C.; Bordons, A. Bacterial diversity of Grenache and Carignan grape surface from different vine-yards at Priorat wine region (Catalonia, Spain). Int. J. Food Microbiol. 2016, 219, 56–63. [Google Scholar] [CrossRef]
  12. Zhang, S.; Chen, X.; Zhong, Q.; Zhuang, X.; Bai, Z. Microbial community analyses associated with nine varieties of wine grape carposphere based on high-throughput sequencing. Microorganisms 2019, 7, 668. [Google Scholar] [CrossRef] [PubMed]
  13. Setati, M.E.; Acobson, D.; Bauer, F.F. Sequence-based analysis of the Vitis vinifera L. cv Cabernet Sauvignon grape must mycobiome in three South African vineyards employing distinct agronomic systems. Front. Microbiol. 2015, 6, 1358. [Google Scholar] [CrossRef] [PubMed]
  14. Hu, B.R.; Gao, J.; Xu, S.C.; Zhu, J.Y.; Fan, X.M.; Zhou, X.Y. Quality evaluation of different varieties of dry red wine based on nuclear magnetic resonance metabolomics. Appl. Biol. Chem. 2020, 63, 24. [Google Scholar] [CrossRef]
  15. Tang, X.Y. Analysis of Microbial Diversity of Naturally Fermented Soybean Paste Sauce Grains. Master’s Thesis, Shenyang Agricultural University, Shenyang, China, 2017. [Google Scholar]
  16. Zhang, S.W.; Chen, X.; Zhong, Q.D.; Huang, Z.; Meng, Z.; Luo, J.; Shi, L.; Bai, Z. Analysis of microbial community diversity of different varieties of wine grape skins. Biotechnol. Bull. 2017, 33, 128–137. [Google Scholar]
  17. Mendoza, L.M.; Merín, M.G.; Morata, V.I.; Farías, M.E. Characterization of wines produced by mixed culture of autochthonous yeasts and Oenococcus oeni from the northwest region of Argentina. J. Ind. Microbiol. Biotechnol. 2011, 38, 1777–1785. [Google Scholar] [CrossRef] [PubMed]
  18. Li, X.; Qi, G.M.; Wang, C.P. The role of non-enological yeasts in wine production and research progress. Chin. Foreign Grape Wine 2019, 1, 52–56. [Google Scholar]
  19. Liang, Z.; Lin, X.; He, Z.; Su, H.; Li, W.; Ren, X. Amino acid and microbial community dynamics during the fermentation of Hong Qu glutinous rice wine. Food Microbiol. 2020, 90, 103467. [Google Scholar] [CrossRef]
  20. Pretorius, I.S. Tailoring wine yeast for the new millennium: Novel approaches the ancient art of winemaking. Yeast 2000, 16, 675–729. [Google Scholar] [CrossRef]
  21. Andorrà, I.; Landi, S.; Mas, A.; Esteve-Zarzoso, B.; Guillamón, J.M. Effect of fermentation temperature on microbial population evolution using culture-independent and dependent techniques. Food Res. Int. 2010, 43, 773–779. [Google Scholar] [CrossRef]
  22. Liu, Z.; Wang, Z.; Sun, J.; Ni, L. The dynamics of volatile compounds and their correlation with the microbial succession during the traditional solid-state fermentation of Gutian Hong Qu glutinous rice wine. Food Microbiol. 2020, 86, 103347. [Google Scholar] [CrossRef] [PubMed]
  23. Gabriela, M.M.; Inés, M.A.V. Application of a grape surface majority pectinolytic species, Aureobasidium pullulans, to low-temperature red winemaking: Development and stability of wine color. J. Wine Res. 2020, 31, 1816534. [Google Scholar]
  24. Mao, X.Y.; Chen, T.; Tian, H.; He, D. Metabolic study of arachidonic acid production by Persea Alpina. China Fats Oils 2011, 36, 42–44. [Google Scholar]
  25. Liao, P.; Wang, W.M.; Wang, W.C.; Kryczek, I.; Li, X.; Bian, Y.; Sell, A.; Wei, S.; Grove, S.; Johnson, J.K.; et al. CD8(+) T cells and fatty acids orchestrate tumor ferroptosis and immunity via ACSL4. Cancer Cell 2022, 40, 365. [Google Scholar] [CrossRef]
  26. Bosma, K.J.; Kaiser, C.E.; Kimple, M.E.; Gannon, M. Effects of Arachidonic Acid and Its Metabolites on Functional Beta-Cell Mass. Metabolites 2022, 12, 342. [Google Scholar] [CrossRef]
  27. Barbary, F.; Moshirian, N. The Modulation of Arachidonic Acid Metabolism and Blood pressure-lowering Effect of Honokiol in Spontaneously Hypertensive Rats. Molecules 2022, 27, 3396. [Google Scholar]
  28. Urbina, J.A.S.; García, J.A.A.; Terán, F.R. Yeast species are associated with a spontaneous fermentation of taberna, a traditional palm wine from the southeast of Mexico. Ann. Microbiol. 2015, 65, 287–296. [Google Scholar] [CrossRef]
  29. Ciani, M.; Comitini, F.; Mannazzu, I.; Domizio, P. Controlled mixed culture fermentation: A new perspective on using non-Saccharomyces yeasts in winemaking. FEMS Yeast Res. 2010, 10, 123–133. [Google Scholar] [CrossRef]
  30. Kitagawa, T.; Tokuhiro, K.; Sugiyama, H.; Kohda, K.; Isono, N.; Hisamatsu, M.; Takahashi, H.; Imaeda, T. Construction of a β-glucosidase expression system using the multi-stress-tolerant yeast Issatchenkia orientalis. Appl. Microbiol. Biotechnol. 2010, 87, 1841–1853. [Google Scholar] [CrossRef]
  31. Kim, D.H.; Hong, Y.A.; Park, H.D. Co-fermentation of grape must by Issatchenkia Orientalis and Saccharomyces cerevisiae reduces the malic acid content in wine. Biotechnol. Lett. 2008, 30, 1633–1638. [Google Scholar] [CrossRef]
  32. Huang, Z.R.; Guo, W.L.; Zhou, W.B.; Li, L.; Xu, J.X.; Hong, J.L.; Liu, H.P.; Zeng, F.; Bai, W.D.; Liu, B.; et al. Microbial communities and volatile metabolites in different traditional fermentation starters used for Hong Qu glutinous rice wine. Food Res. Int. 2019, 121, 593–603. [Google Scholar] [CrossRef] [PubMed]
  33. Martino, A.; Schiraldi, C.; Di Lazzaro, A.; Fiume, I.; Spagna, G.; Pifferi, P.G.; De Rosa, M. Improvement of the flavor of Falanghina white wine using a purified glycosidase preparation from Aspergillus niger. Process Biochem. 2000, 36, 93–102. [Google Scholar] [CrossRef]
  34. Hu, K.; Zhu, X.L.; Mu, H.; Ma, Y.; Ullah, N.; Tao, Y.S. A novel extracellular glycosidase activity from Rhodotorula mucilaginosa: Its application potential in wine aroma enhancement. Lett. Appl. Microbiol. 2016, 62, 169–176. [Google Scholar] [CrossRef]
  35. Abdeljalil, S.; Ben Hmad, I.; Saibi, W.; Amouri, B.; Maalej, W.; Kaaniche, M.; Koubaa, A.; Gargouri, A. Investigations on Hydrolytic Activities from Stachybotrys microspora and Their Use as an Alternative in Yeast DNA Extraction. Appl. Biochem. Biotechnol. 2014, 172, 1599–1611. [Google Scholar] [CrossRef] [PubMed]
  36. Ning, Y.L.; Wu, Y.; He, Q.; Xu, S.; Chen, Y. Analysis of microbial community diversity in traditional Korean rice wine and its liquor beverages based on high-throughput sequencing technology. Food Sci. 2019, 40, 107–114. [Google Scholar]
Figure 1. Sample dilution curve. CAI is the pre-fermentation Cabernet Sauvignon, CAM is the mid-fermentation Cabernet Sauvignon, and CAL is the late fermentation Cabernet Sauvignon. MAI is the pre-fermentation Matheran, MAM is the mid-fermentation Matheran, and MAL is the late fermentation Matheran. PAI is the pre-fermentation Cabernet Franc, PAM is the mid-fermentation Cabernet Franc, and PAL is the late fermentation Cabernet Franc.
Fermentation 08 00475 g001
Figure 2. Venn diagram of OTU distribution. C is a sample of Cabernet Sauvignon, M is a sample of Matheran, and P is a sample of Cabernet Franc.
Fermentation 08 00475 g002
Figure 3. OTU distribution petal map. CAI is the pre-fermentation Cabernet Sauvignon, CAM is the mid-fermentation Cabernet Sauvignon, and CAL is the late fermentation Cabernet Sauvignon. MAI is the pre-fermentation Matheran, MAM is the mid-fermentation Matheran, and MAL is the late fermentation Matheran. PAI is the pre-fermentation Cabernet Franc, PAM is the mid-fermentation Cabernet Franc, and PAL is the late fermentation Cabernet Franc. The core numbers indicate the number of OTUs common to all samples, and the numbers on the petals indicate the number of OTUs unique to that sample. The number on the petal indicates the number of OTUs unique to that sample.
Fermentation 08 00475 g003
Figure 4. Evolutionary tree of species. The first column of the icon from the left shows sample information, and the second column shows the phylum level corresponding to the classification of the sample genus. The outer circle of the evolutionary tree offers the relative abundance of each genus in the different samples. The length of the color block represents the level of relative abundance.
Fermentation 08 00475 g004
Figure 5. Histogram of species composition of family-level samples. CAI is the pre-fermentation Cabernet Sauvignon, CAM is the mid-fermentation Cabernet Sauvignon, and CAL is the late fermentation Cabernet Sauvignon. MAI is the pre-fermentation Matheran, MAM is the mid-fermentation Matheran, and MAL is the late fermentation Matheran. PAI is the pre-fermentation Cabernet Franc, PAM is the mid-fermentation Cabernet Franc, and PAL is the late fermentation Cabernet Franc.
Fermentation 08 00475 g005
Figure 6. Histogram of species composition of genus-level samples. CAI is the pre-fermentation Cabernet Sauvignon, CAM is the mid-fermentation Cabernet Sauvignon, and CAL is the late fermentation Cabernet Sauvignon. MAI is the pre-fermentation Matheran, MAM is the mid-fermentation Matheran, and MAL is the late fermentation Matheran. PAI is the pre-fermentation Cabernet Franc, PAM is the mid-fermentation Cabernet Franc, and PAL is the late fermentation Cabernet Franc.
Fermentation 08 00475 g006
Figure 7. Analytical diagram of genus horizontal species association. The letters on the dots represent the names of different genera, the size of the dots represents the size of abundance, the color of the dots represents the phylum to which they belong, and the right column is the information of the phylum to which they belong; the thickness of the line represents the size of correlation, a red line indicates a positive correlation, and a blue line indicates a negative correlation.
Fermentation 08 00475 g007
Figure 8. OUT and taxonomic level Heatmap. CAI is the pre-fermentation Cabernet Sauvignon, CAM is the mid-fermentation Cabernet Sauvignon, and CAL is the late fermentation Cabernet Sauvignon. MAI is the pre-fermentation Matheran, MAM is the mid-fermentation Matheran, and MAL is the late fermentation Matheran. PAI is the pre-fermentation Cabernet Franc, PAM is the mid-fermentation Cabernet Franc, and PAL is the late fermentation Cabernet Franc. The left side of the graph shows the relational clustering analysis of the samples, with the shades of color representing the high or low abundance of the species.
Fermentation 08 00475 g008
Figure 9. Discriminant analysis of partial least squares based on OUT. CAI is the pre-fermentation Cabernet Sauvignon, CAM is the mid-fermentation Cabernet Sauvignon, and CAL is the late fermentation Cabernet Sauvignon. MAI is the pre-fermentation Matheran, MAM is the mid-fermentation Matheran, and MAL is the late fermentation Matheran. PAI is the pre-fermentation Cabernet Franc, PAM is the mid-fermentation Cabernet Franc, and PAL is the late fermentation Cabernet Franc.
Fermentation 08 00475 g009
Table 1. Sample sequence length distribution.
Sequence Length GradientNumber of Sequencs
0–2001036
200–26020,918
260–3203463
320–360432
360–38092,895
380–40031
400–42045
420–440242,204
440–460271
460–48021
480–50026
500–52028
520–54015
540–5600
560–6000
Table 2. Statistical table of Alpha Diversity Index of samples.
Name of SamplesChao1CoverageObserved_SpeciesPD_Whole_TreeShannonSimpson
CAI245.561.00219.0048.510.960.17
CAM129.621.00104.0026.941.200.38
CAL133.001.0090.0025.790.380.10
MAI371.541.00346.0076.672.500.49
MAM173.171.00123.0034.220.600.13
MAL153.051.00116.0027.520.730.17
PAI210.151.00172.0037.310.860.20
PAM144.051.00101.0026.120.380.07
PAL194.561.00118.0026.480.470.09
AI is the pre-fermentation Cabernet Sauvignon, CAM is the mid-fermentation Cabernet Sauvignon, and CAL is the late fermentation Cabernet Sauvignon. MAI is the pre-fermentation Matheran, MAM is the mid-fermentation Matheran, and MAL is the late fermentation Matheran. PAI is the pre-fermentation Cabernet Franc, PAM is the mid-fermentation Cabernet Franc, and PAL is the late fermentation Cabernet Franc.
Table 3. Proportion distribution of representative strains in different samples.
Name of StransCAICAMCALMAIMAMMALPAIPAMPAL
H. uvarum91.4%15.6%3.96%71.2%3.66%4.78%89.5%1.79%1.67%
S. cerevisiae0.0113%76.8%95.0%0.207%93.2%91.0%0.0264%96. 2%95.3%
A. pullulans0.678%0.313%0.0038%5.54%-0.102%6.10%0.0301%0.173%
M. alpina0.264%0.0113%0.0075%0.117%-0.0226%0.0942%0.0226%0.0640%
C. tropicalis---1.21%0.0226%0.0038%---
I. orientalis---0.0038%0.0113%----
A. niger-0.0038%0.0038%-0.0603%0.478%-0.0075%-
R. mucilaginosa----0.0113%0.0188%---
R. sp 0.0038%--0.0414%--0.0038%--
R. diobovata----0.0075%0.0414%--0.0038%
S. microspora----0.0001%0.0113%---
G. pullulans0.0151%0.0113%0.0188%-0.0188%-0.0113%0.0075%0.0527%
AI is the pre-fermentation Cabernet Sauvignon, CAM is the mid-fermentation Cabernet Sauvignon, and CAL is the late fermentation Cabernet Sauvignon. MAI is the pre-fermentation Matheran, MAM is the mid-fermentation Matheran, and MAL is the late fermentation Matheran. PAI is the pre-fermentation Cabernet Franc, PAM is the mid-fermentation Cabernet Franc, and PAL is the late fermentation Cabernet Franc. -Indicates relative abundance below 0.0001% or not detected.
Table 4. Changes in yeast flora during fermentation.
Number of Yeast Colonies Formed Per mL of Fermentation Broth (108 CFU/mL)
Yeast
Species
CAICAMCALMAIMAMMALPAIPAMPAL
H. uvarum5.180.8870.2254.030.2070.2715.070.1010.0946
S. cerevisiae0.00064.355.390.01175.295.160.00155.455.40
C. tropicalis---0.06830.00130.0002---
I. orientalis---0.00020.0006----
R. sp 0.0002--0.0023--0.0002--
AI is the pre-fermentation Cabernet Sauvignon, CAM is the mid-fermentation Cabernet Sauvignon, and CAL is the late fermentation Cabernet Sauvignon. MAI is the pre-fermentation Matheran, MAM is the mid-fermentation Matheran, and MAL is the late fermentation Matheran. PAI is the pre-fermentation Cabernet Franc, PAM is the mid-fermentation Cabernet Franc, and PAL is the late fermentation Cabernet Franc. -Indicates no detections.
Publisher’s Note: MDPI stays neutral with regard to jurisdictional claims in published maps and institutional affiliations.

