1. Introduction
Lignocellulosic biomass has attracted worldwide attention from both academia and industry as the most abundant renewable feedstocks to produce biofuels and biochemicals [
1]. Thermochemical conversion is one of the major platforms used to convert lignocellulosic biomass into bioenergy; however, it has faced issues because of the high ash content in most feedstocks, especially herbaceous biomass, e.g., wheat straw, corn stover, sorghum straw, etc. [
2]. In the combustion or gasification of biomass without pretreatment, the inorganic ingredients in biomass could cause serious issues to reactors and the environment, such as slagging, fouling, agglomeration, corrosion, acid gas emission, etc. [
2]. These issues not only reduce the heat transfer efficiency of the reactors, but also cause air pollution [
3]. To improve the quality of lignocellulosic biomass as a potential fuel, a pretreatment known as leaching has been extensively studied and proven effective in removing inorganic ingredients in the biomass [
4]. The most common pretreatment is water leaching, which simply washes the biomass with an adequate amount of water [
5]. While this is effective in removing certain inorganic ingredients that are water-soluble, more effective methods are necessary to reduce elements such as Ca, Mg, Si, and S that tend to form insoluble compounds in the plant [
6]. Bioleaching might be a solution to this issue, as it has been successfully applied to the mining and coal industries to extract metals (e.g., copper) from low grade ores and desulfurization, respectively [
7]. Various bacterial and fungal species have been demonstrated for their bioleaching capability to treat a range of materials, from mining ores to municipal waste fly ash [
8,
9].
In a previous study, we demonstrated the potential of a small-scale bioleaching process in pretreating lignocellulosic biomass for ash reduction by using
Aspergillus niger as a bioleaching microorganism [
10]. As a versatile industrial microbe,
A. niger has been generally recognized as safe in standard industrial settings [
11].
A. niger is the main producer of the citric acid widely used in food and pharmaceutical industries [
12]. Furthermore, a variety of enzymes can be produced from
A. niger, such as amylase, cellulase, xylanase, pectinase, etc. [
13,
14,
15]. Recently this microbe has received extensive attention in hydrometallurgical and environmental investigations. Wu and Ting used
A. niger to recover heavy metals from municipal solid waste (MSW) incinerator fly ash in both one-step and two-step leaching, and found that bioleaching achieved a higher recovery of Mn and Zn than chemical leaching [
16]. Santhyia treated the spent refinery catalyst with
A. niger to recover Al, Ni and Mo, in which the use of a buffer was found to be effective in stimulating oxalic acid secretion by this fungus, while also reducing the leaching time compared to the bioleaching process without the buffer addition [
17]. Mulligan studied
A. niger for the recovery of Cu and other metals from low-grade ores, and achieved 68% and 46% in the solubilization of Cu and Zn, respectively [
18].
In this research, the bioleaching of sorghum straw was conducted in custom-designed 2.5 L bioreactors. Response surface methodology (RSM) was used for the experimental design to study the effects of the operating parameters, including fungal mass added to each reactor, leaching time, and glucose concentration in the starting liquid phase, in an attempt to optimize the bioleaching efficiency in terms of residual ash content left over after leaching.
2. Materials and Methods
2.1. Lignocellulosic Biomass
Sorghum straw was obtained from the Idaho National Laboratory (Idaho Falls, ID, USA) in the form of 2.5 cm- (1 inch.) long dry particles. The biomass was stored and sealed in plastic bags until used. Sub-samples were taken using the quartering method, as in ASTM C702 [
19].
2.2. Bioleaching Fungus
A. niger (ATCC 22343) culture was purchased from the American Type Culture Collection (ATCC). The fungus was maintained on a potato dextrose agar, refrigerated according to the vendor’s instructions until transferred to fresh agars.
To prepare the seed culture for the bioleaching of sorghum straw, fungal spores were scraped from the potato dextrose agar culture with an inoculation loop, added to 1 mL of sterilized 0.1% (w/v) Tween 80, and centrifuged. The pellet was rinsed twice and re-suspended in 0.1% Tween 80 solution. The concentration of fungal spores was measured by hemocytometer counting. Then spores were added to fresh potato dextrose broth so that each 100 mL of medium was inoculated with ~9 × 10⁶ spores. Up to this step, all procedures were performed aseptically. The inoculated medium was incubated at 26 °C and 150 rpm until the culture reached the exponential stage.
To collect the fungal biomass for bioleaching, vacuum filtration was used to separate the pellets from the culture medium. Then, the fungal pellets were rinsed with de-ionized water (DI) twice, before being loaded into the bioleaching reactors.
2.3. Bioleaching Reactors
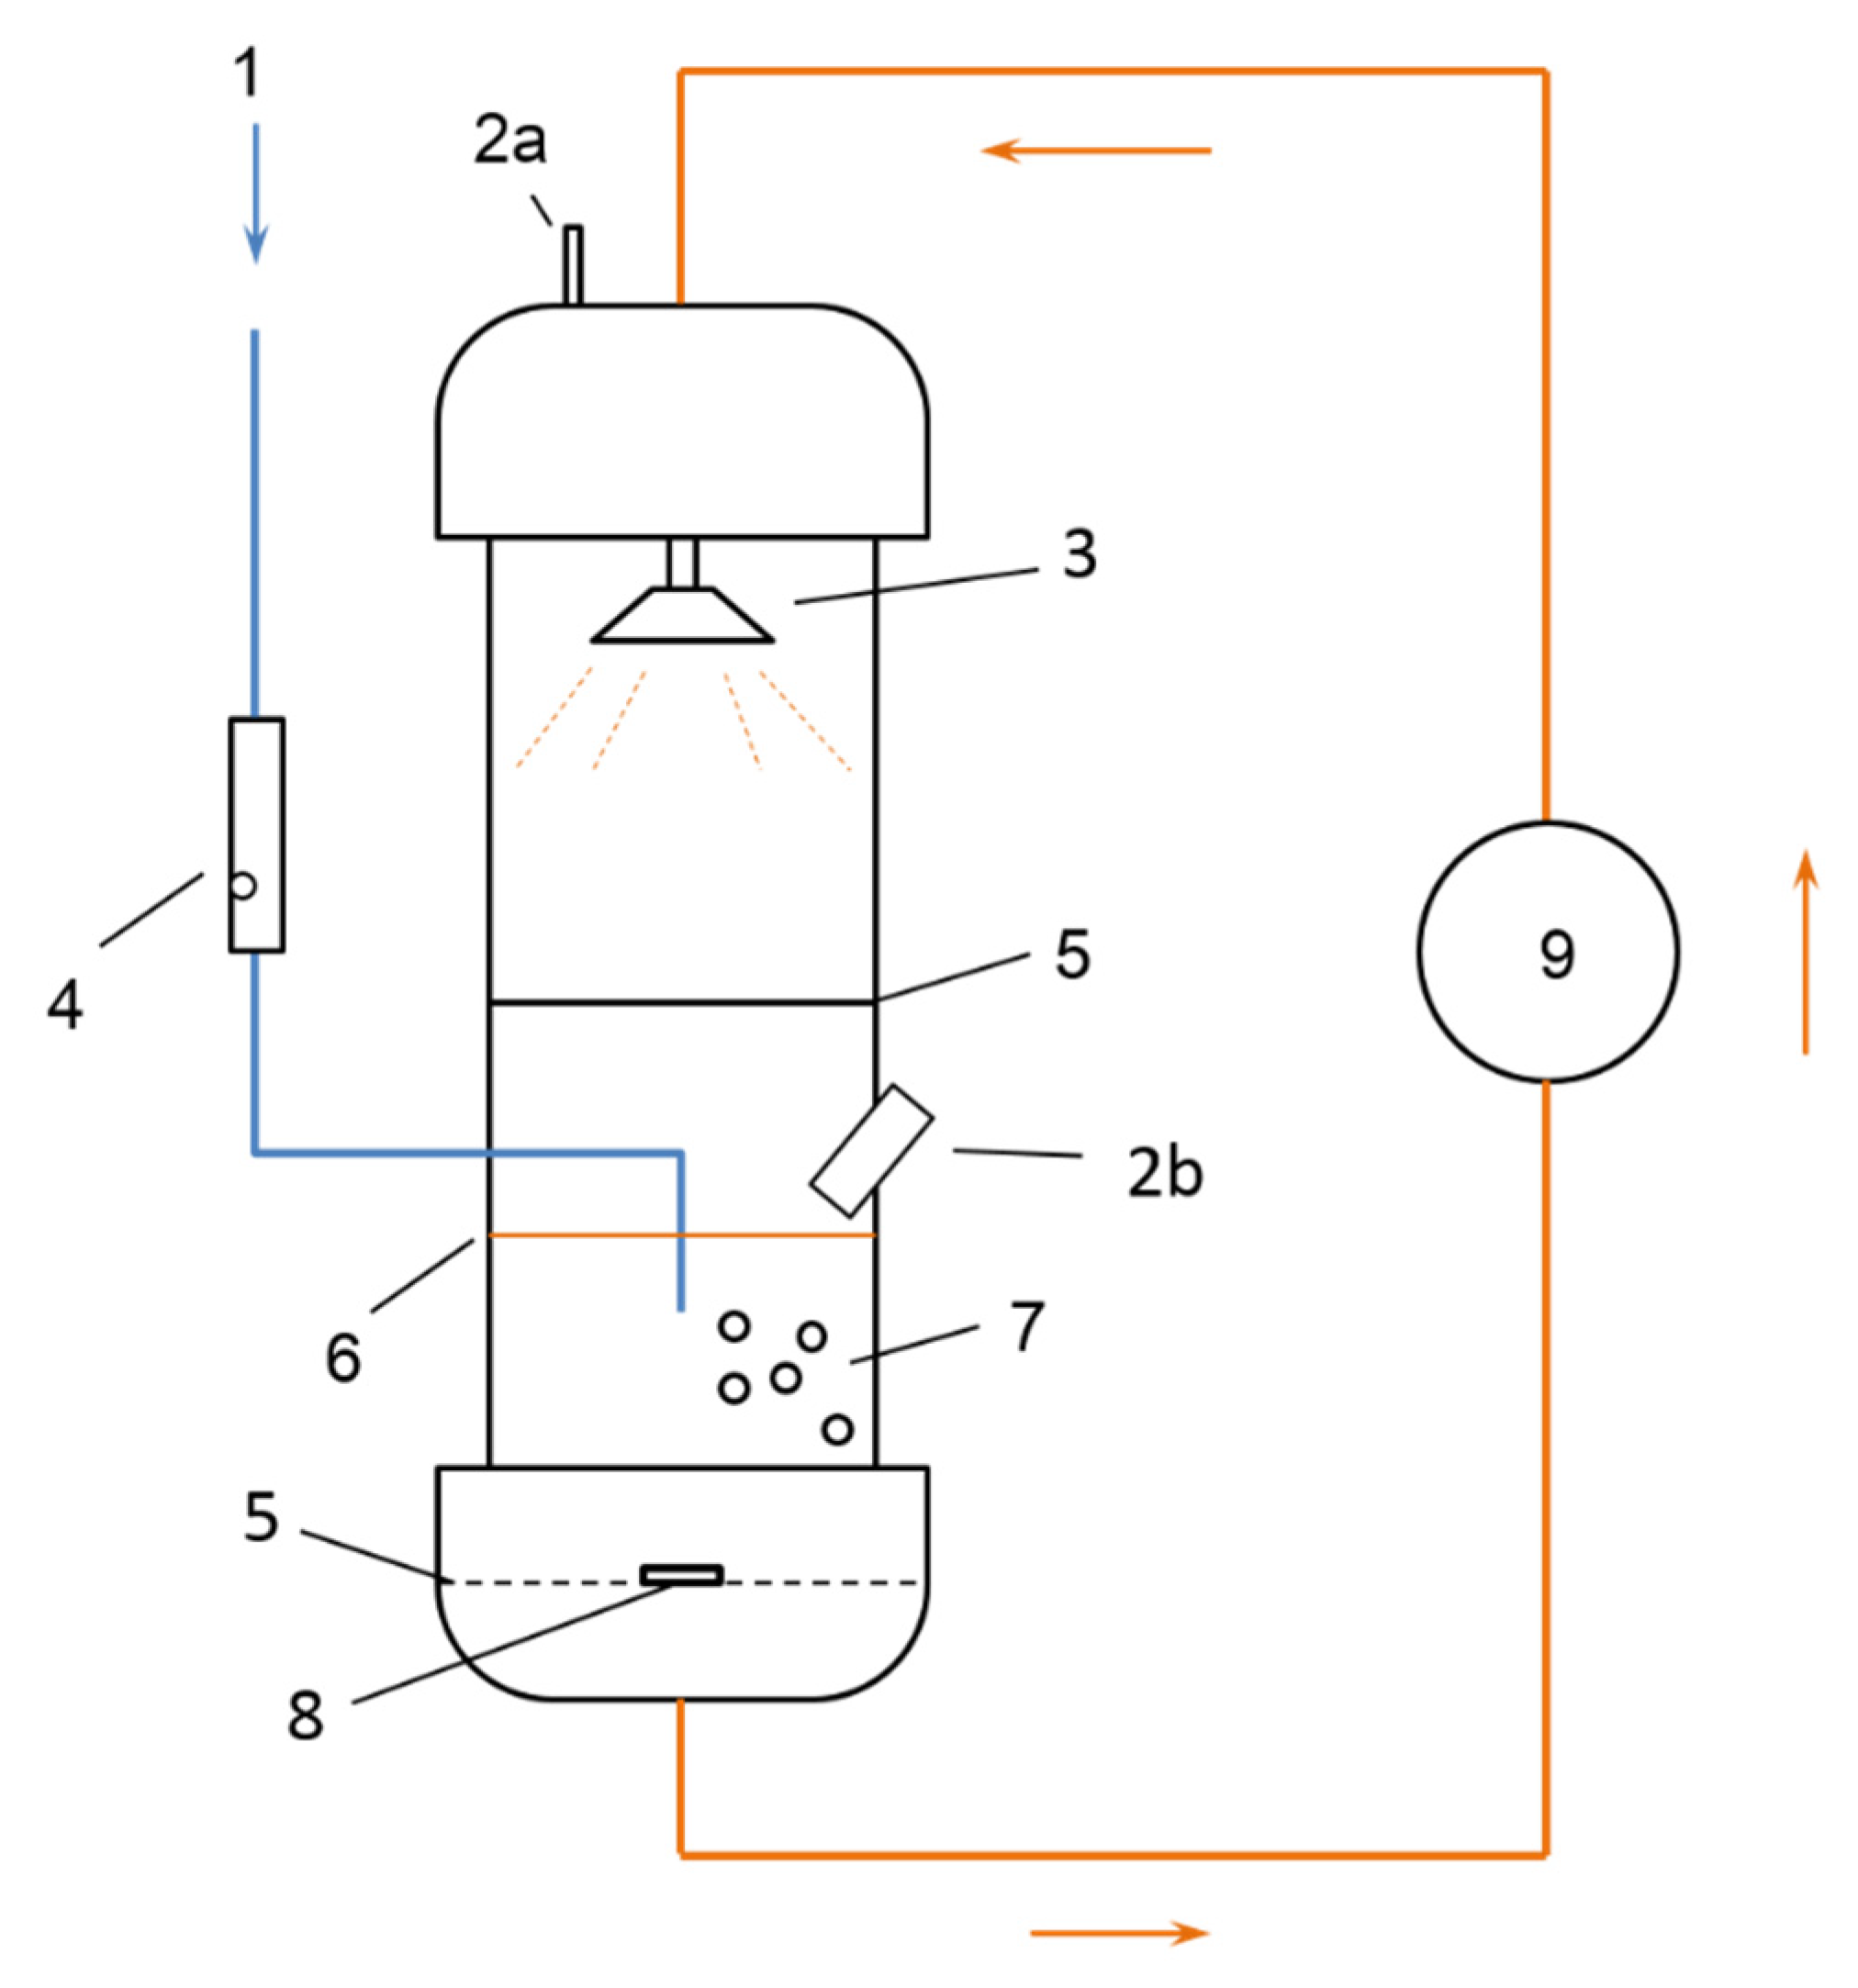
In this study, bioleaching was carried out in specially designed bioreactors based on previous research [
10]. The scheme of a single reactor is shown in
Figure 1, and four such reactors were run in parallel during bioleaching. The main body of the reactor was a 0.3 m- (1 foot) long clear polyvinyl chloride (PVC) pipe with a diameter of 10.2 cm (4 inches), which was sealed on both ends with screwed-on white PVC caps. The reactor’s main body was separated into two halves by a round-shaped plastic mesh plate with a pore size of 3 mm. Sorghum straw was added to the upper half of the reactor, and a layer of nylon mesh cloth (Component Supply Company, Fort Meade, FL, USA) was placed between the straw and the mesh plate to keep the biomass from falling to the bottom half of the reactor. The mesh size of the nylon cloth was about 160 µm, the same as used in our previous study [
10]. Fungal pellets and the liquid phase (a glucose solution to keep fungus viable) were added to the bottom half of the reactor. To prevent the fungus from clogging the liquid flow, a sandwich structure was placed in the bottom cap, which contained a layer of nylon mesh cloth between two mesh plates. To enhance the mixing of the fungal culture, a magnetic stirrer was placed in the bottom cap, on one of the mesh plates. The whole reactor sat on a stir plate. A port hole was built into the center of the screwed-on cap on both ends of the reactor. The upper and bottom caps were connected by soft tubing (Masterflex silicone tubing L/S 25, Cole-Parmer Instrument Co., Vernon Hills, IL, USA). Inside the upper cap, a sprinkler was attached to the center port hole so that liquid could be sprayed onto the sorghum straw for water conservation and uniform wetting. Aeration was directed into the bottom half of the reactor in order to provide oxygen for the fungus, and one additional port hole was opened on the upper cap for venting. For aeration adjustment, the air would first pass through a rotameter before entering the reactor. The aeration originated from a main pipe that led to the in-house compressed air supply system. Through one air regulator (Norgren, Littleton, CO, USA) and a manifold, the air was separated into five streams, one per reactor and a fifth stream left open to the atmosphere for balancing the air flows in the other four. A peristaltic pump (Model 13–310–662, Cole-Parmer Instrument Co.) drove the liquid flow as shown in
Figure 1.
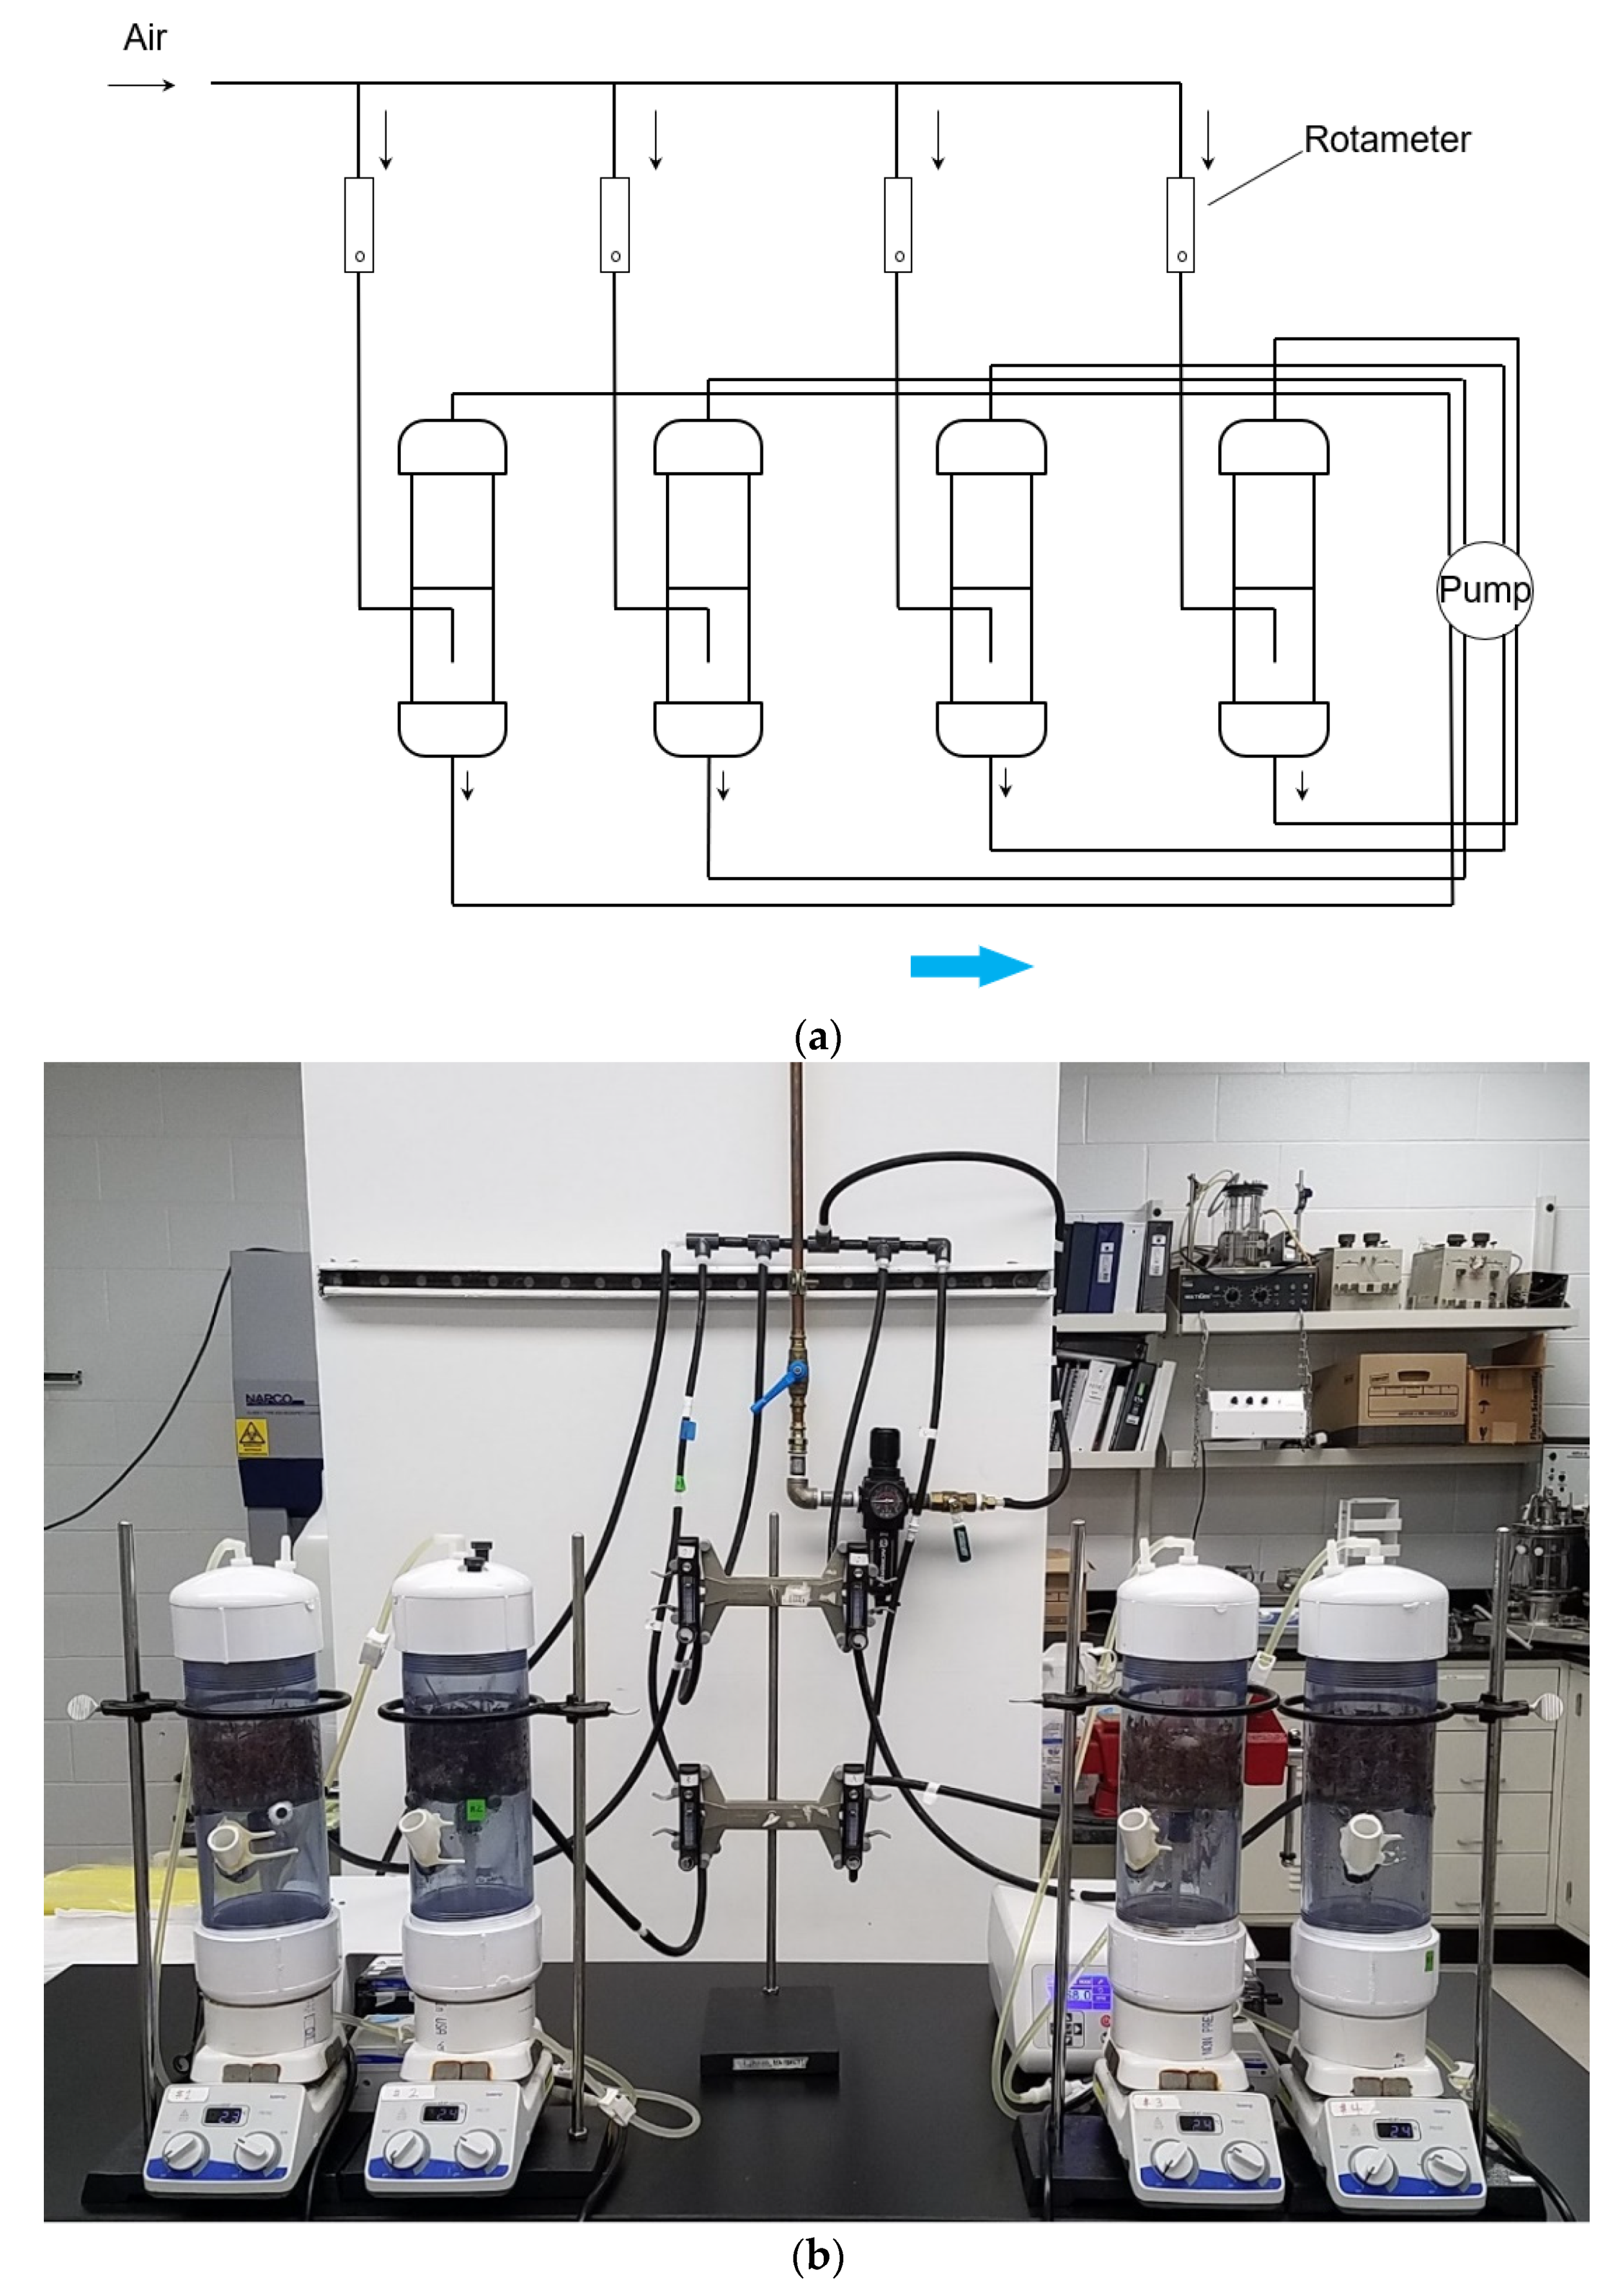
The setup of all four reactors is shown in
Figure 2a,b. All parts of the bioreactor are purchased from McMaster-Carr Supply Co. (Elmhurst, IL, USA), except for the tubing and the pump.
2.4. Experimental Design by Response Surface Methodology
RSM was used to optimize the bioleaching parameters. The objective was to achieve the minimum response Y-residual ash content based on biomass dry weight (%). Three variables were investigated in this research:the fungal mass added to each reactor (g); the leaching time (days); and the glucose concentration in the starting liquid phase (g/L). These variables were shown in the response surface model as X
1, X
2 and X
3, respectively, with coded levels set at −1, 0 and 1 for low, middle and high levels, as shown in
Table 1.
Meanwhile, the flow rate of the liquid phase running through the reactor was also a significant operating parameter for our reactor; our test runs indicated that excessively high flow rates could cause serious leaking within the system due to high pressure. Therefore, the flow rate was kept constant at 200 mL/min in this research. Since we observed that the aeration could not remain constant at low flow rates, all reactor air flows were set to 1.2 L/min to reduce the effect of oxygen insufficiency on leaching. The lignocellulosic biomass load weight of sorghum straw added to each reactor was determined by trial runs to be no more than 30 g (dry weight); further increasing the sorghum straw load could lead to issues as the wet straw could clog the venting port. Our previous research found that the ratio of liquid volume to straw biomass (mL/g dry weight) could be maintained at 25; thus, 750 mL of liquid was added to each reactor before leaching was begun.
As for the experimental design, a Box–Behnken design was adopted, with 15 runs, including 3 replicates at the center point. The actual run order was randomized, except the center points, as demonstrated in
Table 2. Data were fitted into a second-order polynomial model (Equation (1)).
where X
1, X
2, and X
3 are independent variables; Y is the response (residual ash content, %); β
i (i = 1, 2, 3), β
ii (i = 1, 2, 3) and β
ij (i = 1,2 and j = 2,3) are regression coefficients for the intercept, linear, quadratic, and interaction terms, respectively.
Water leaching experiments were also conducted in the bioreactors as controls for comparison. The same settings were used as in bioleaching, except: no fungal biomass was added; DI water was added as a starting liquid phase; and the leaching time was 48 h, as we found that longer leaching time with water did not yield further ash removal.
2.5. Data Analysis
Total solids and ash content of the sorghum straw were determined by following the same procedure used in our previous research [
10]. The bioleaching effect was evaluated by the residual ash content based on the biomass dry weight, which was calculated using Equation (2):
M1: dry mass of leached sorghum straw sample (g)
M2: ash mass of leached sorghum straw sample after 24 h at 575 °C in the muffle furnace (g)
Statistical significance was determined by analysis of variance (ANOVA) using JMP Pro 14 (SAS Institute, Cary, NC, USA) with Pcritical = 0.05.
3. Results
In this research, a series of self-designed bioreactors were set up for pretreating sorghum straw to reduce the ash content. Three operating parameters—fungal mass, leaching time, and glucose concentration—were investigated, and the residual ash content was used as a response.
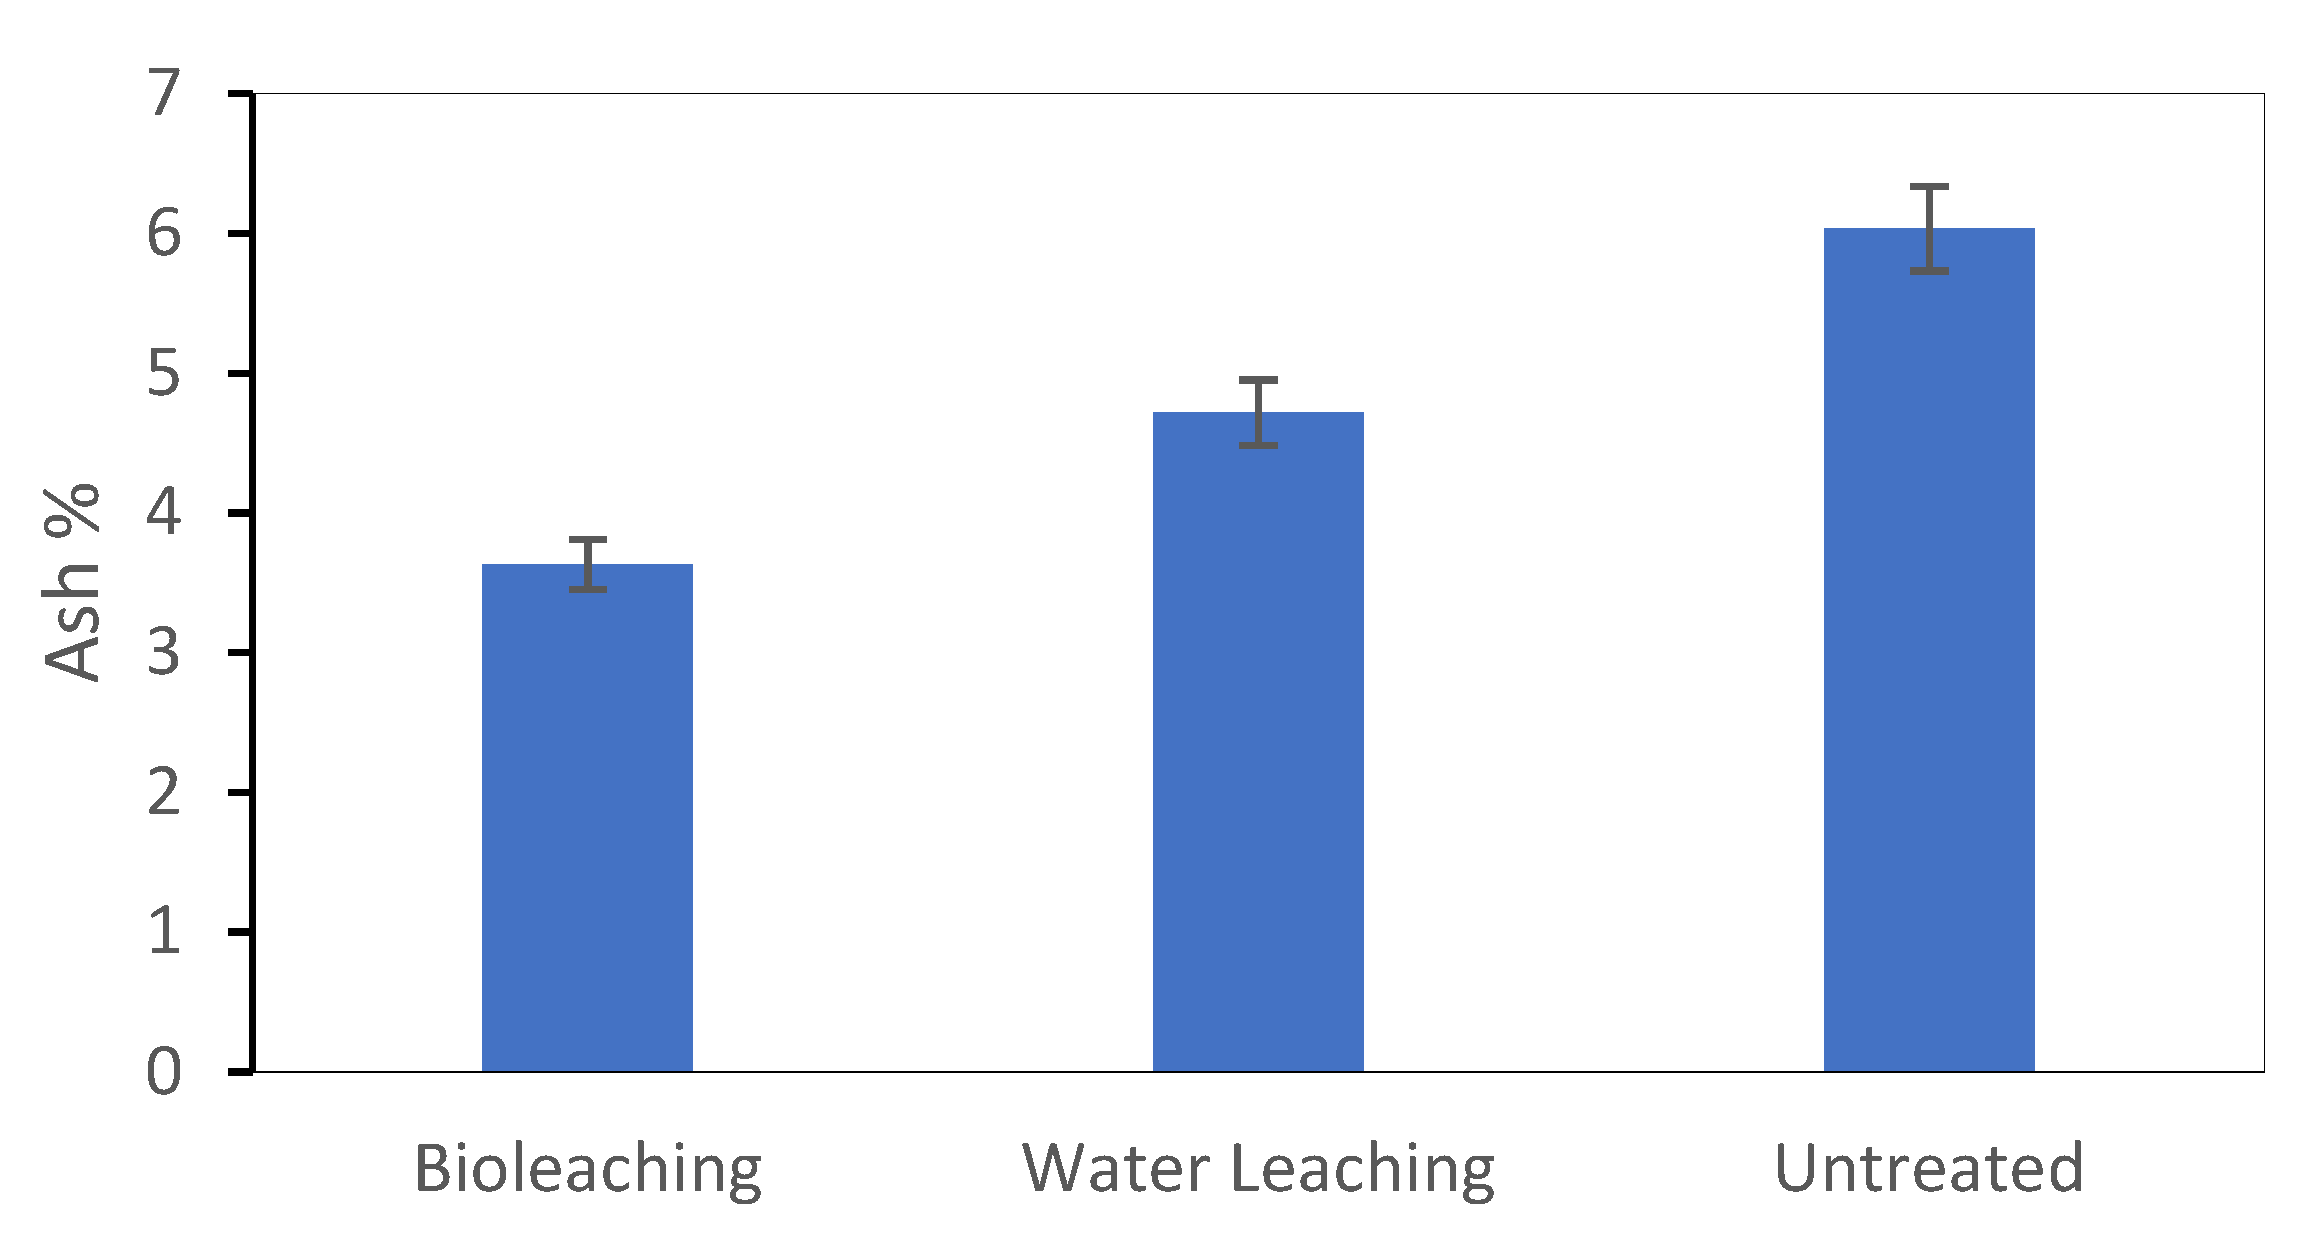
Before being fitted into the RSM model, the ash content data after bioleaching were averaged and compared to those of the raw sorghum straw and water-leached sorghum straw. As shown in
Figure 3, the ash content of the sorghum straw after bioleaching (3.63%) was significantly (
p < 0.0001) lower than that of the water-leached (4.72%) and raw sorghum straw (6.03%).
The data were fitted to a quadratic polynomial model (Equation (3)). This model was then used to generate a series of predicted responses of the same parameter combinations in the RSM design, as displayed in
Table 3.
As shown by the ANOVA in
Table 4 and
Table 5, the quadratic model was significant at 95% confidence level (
p = 0.0394), while the lack of fit was not significant (
p = 0.8341). All the coefficients were displayed in the model expression in Equation (3). The coefficient of determination (R
2) was 0.9062, indicating that 90.62% of the variability of the observed data could be predicted by this model.
All terms in Equation (3) were evaluated for their significance in the model, as displayed in
Table 6. Besides the intercept, three terms were significant at 95% confidence level: the linear effect of glucose concentration (X
3); the interaction between fungal mass and leaching time (X
1X
2); and the quadratic effect of fungal mass (X
12). Among these three, the glucose concentration (X
3) had the most significant effect on the response, with the smallest
p-value of 0.0079.
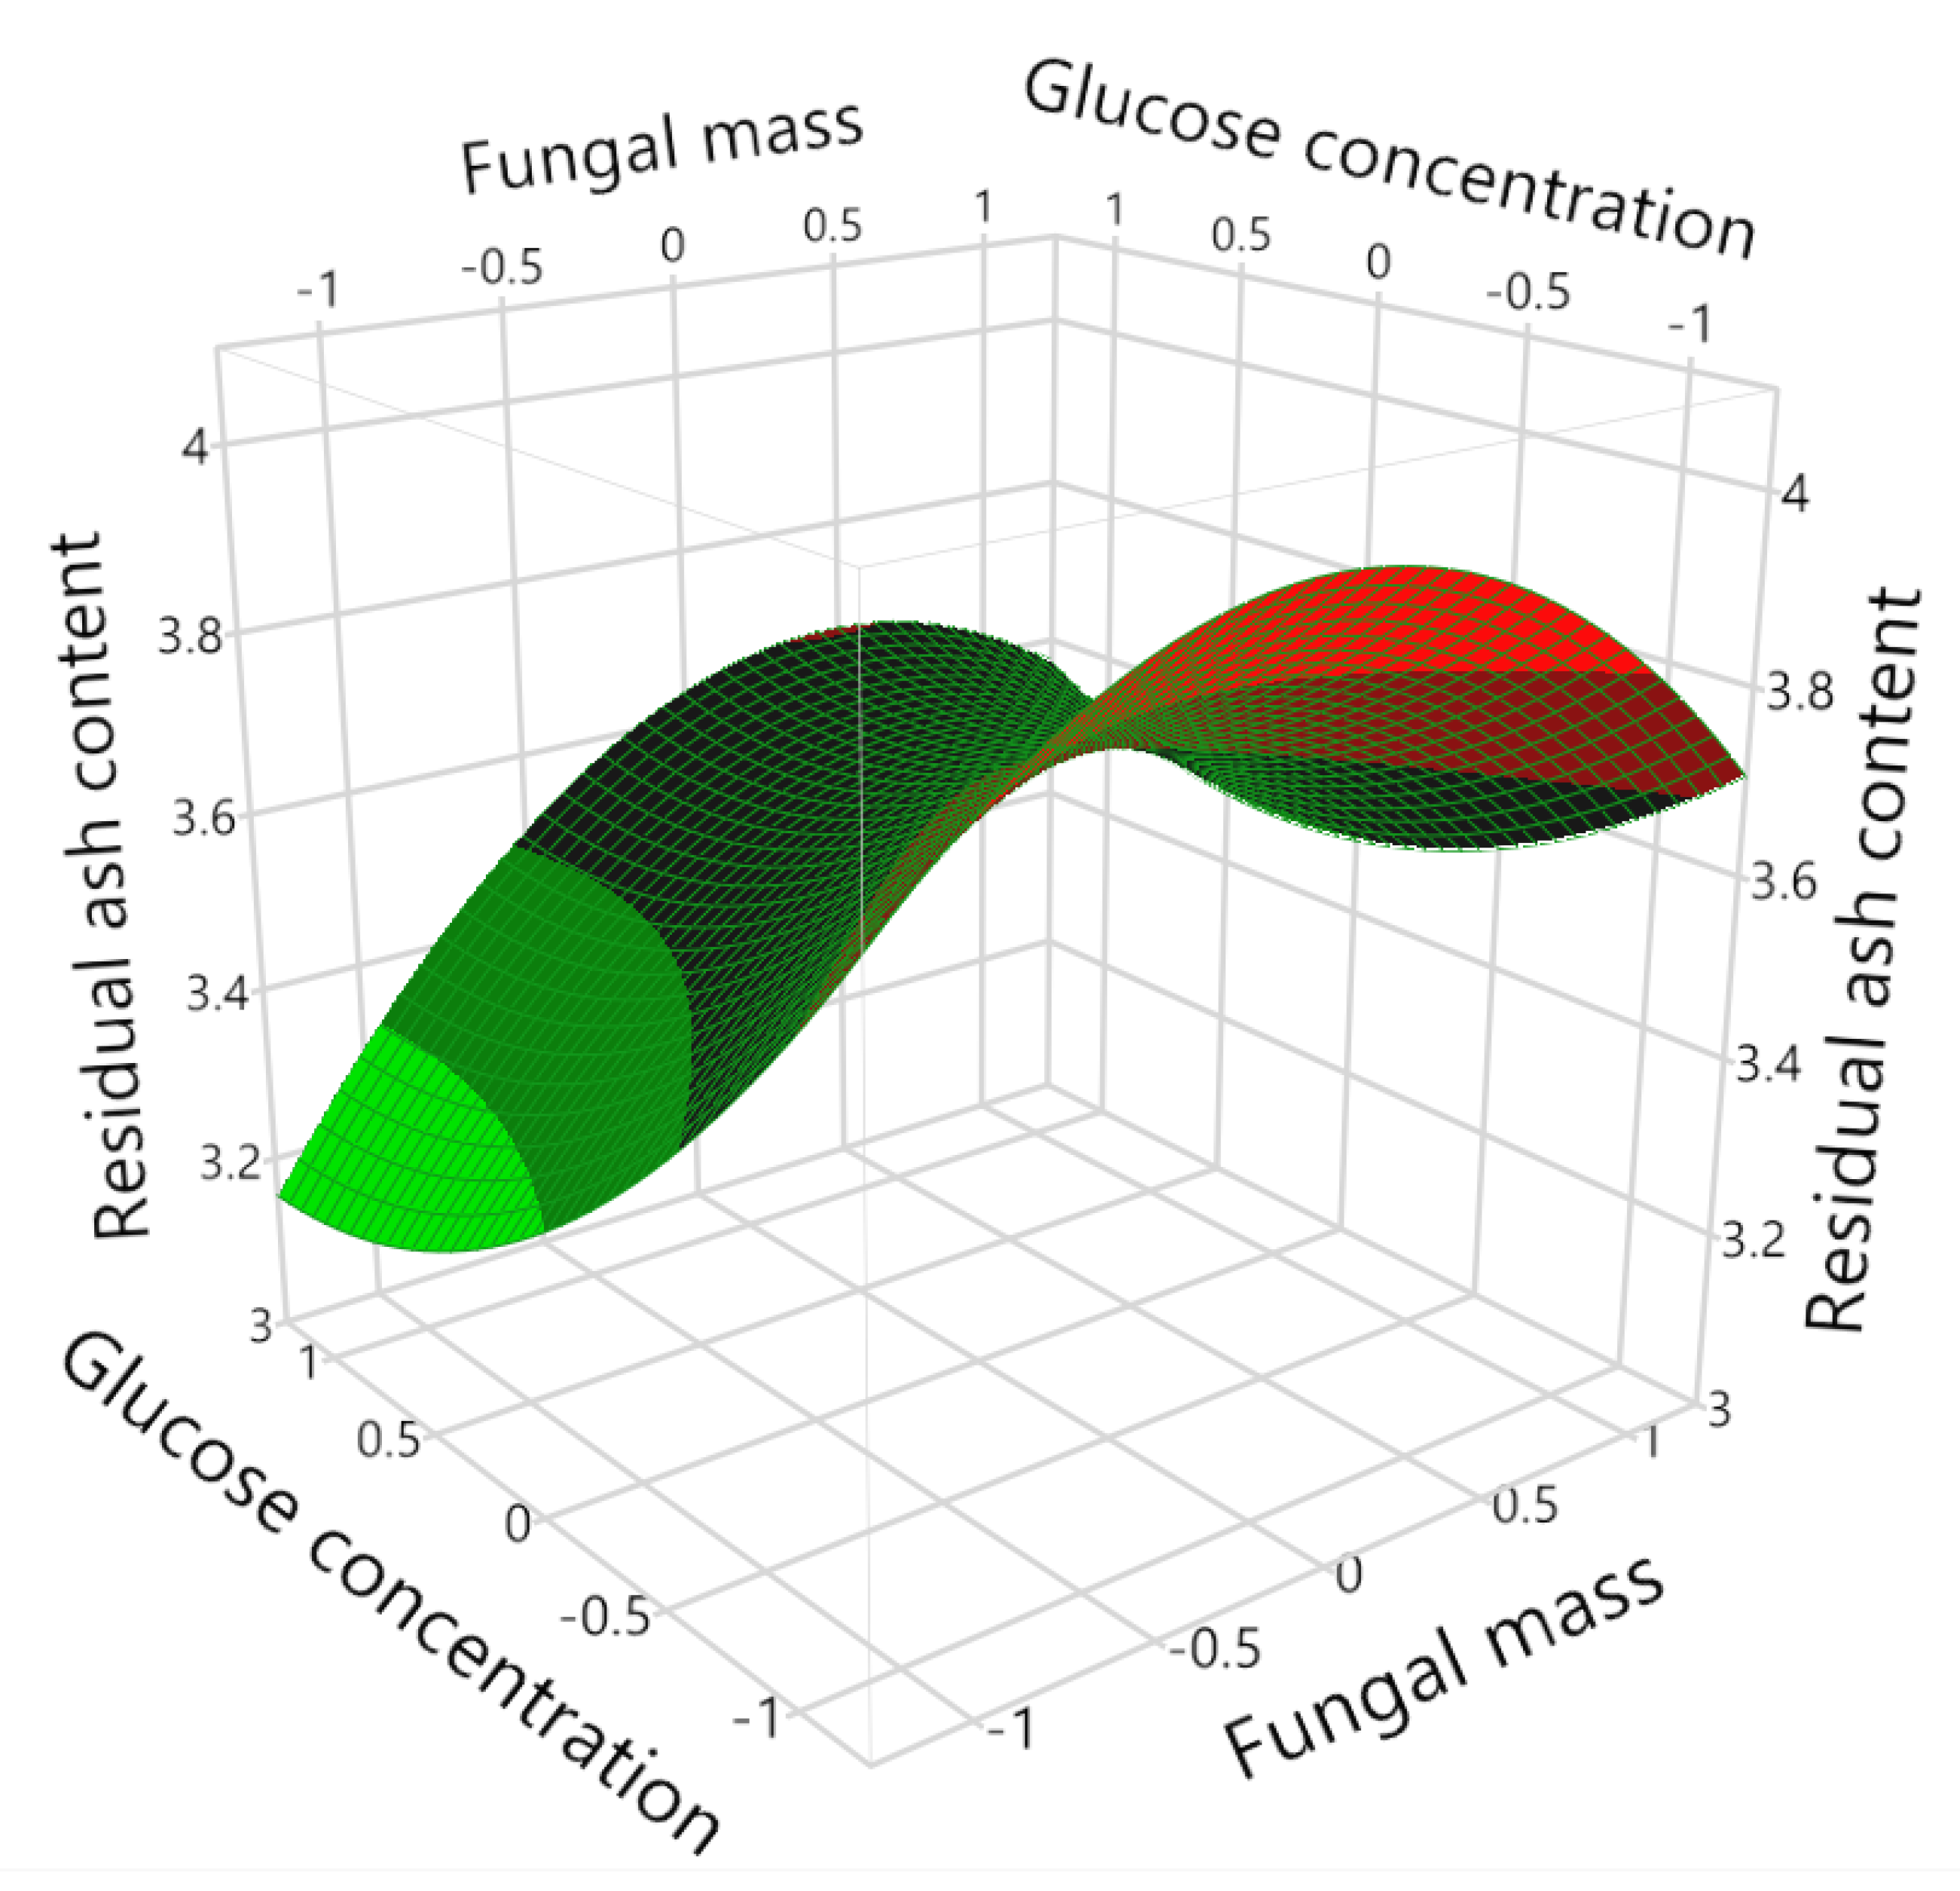
By maintaining one variable at a constant level and varying the other two, surface and contour plots were generated to assist the search for the optimal conditions that generate the maximum or minimum response. Such optimal response is usually observed at the center of an elliptical shape contour [
20]. Identifying the conditions leading to the minimum response was one objective of this research, however no such optimal value was observed with the current data set (Figures 4–9).
4. Discussion
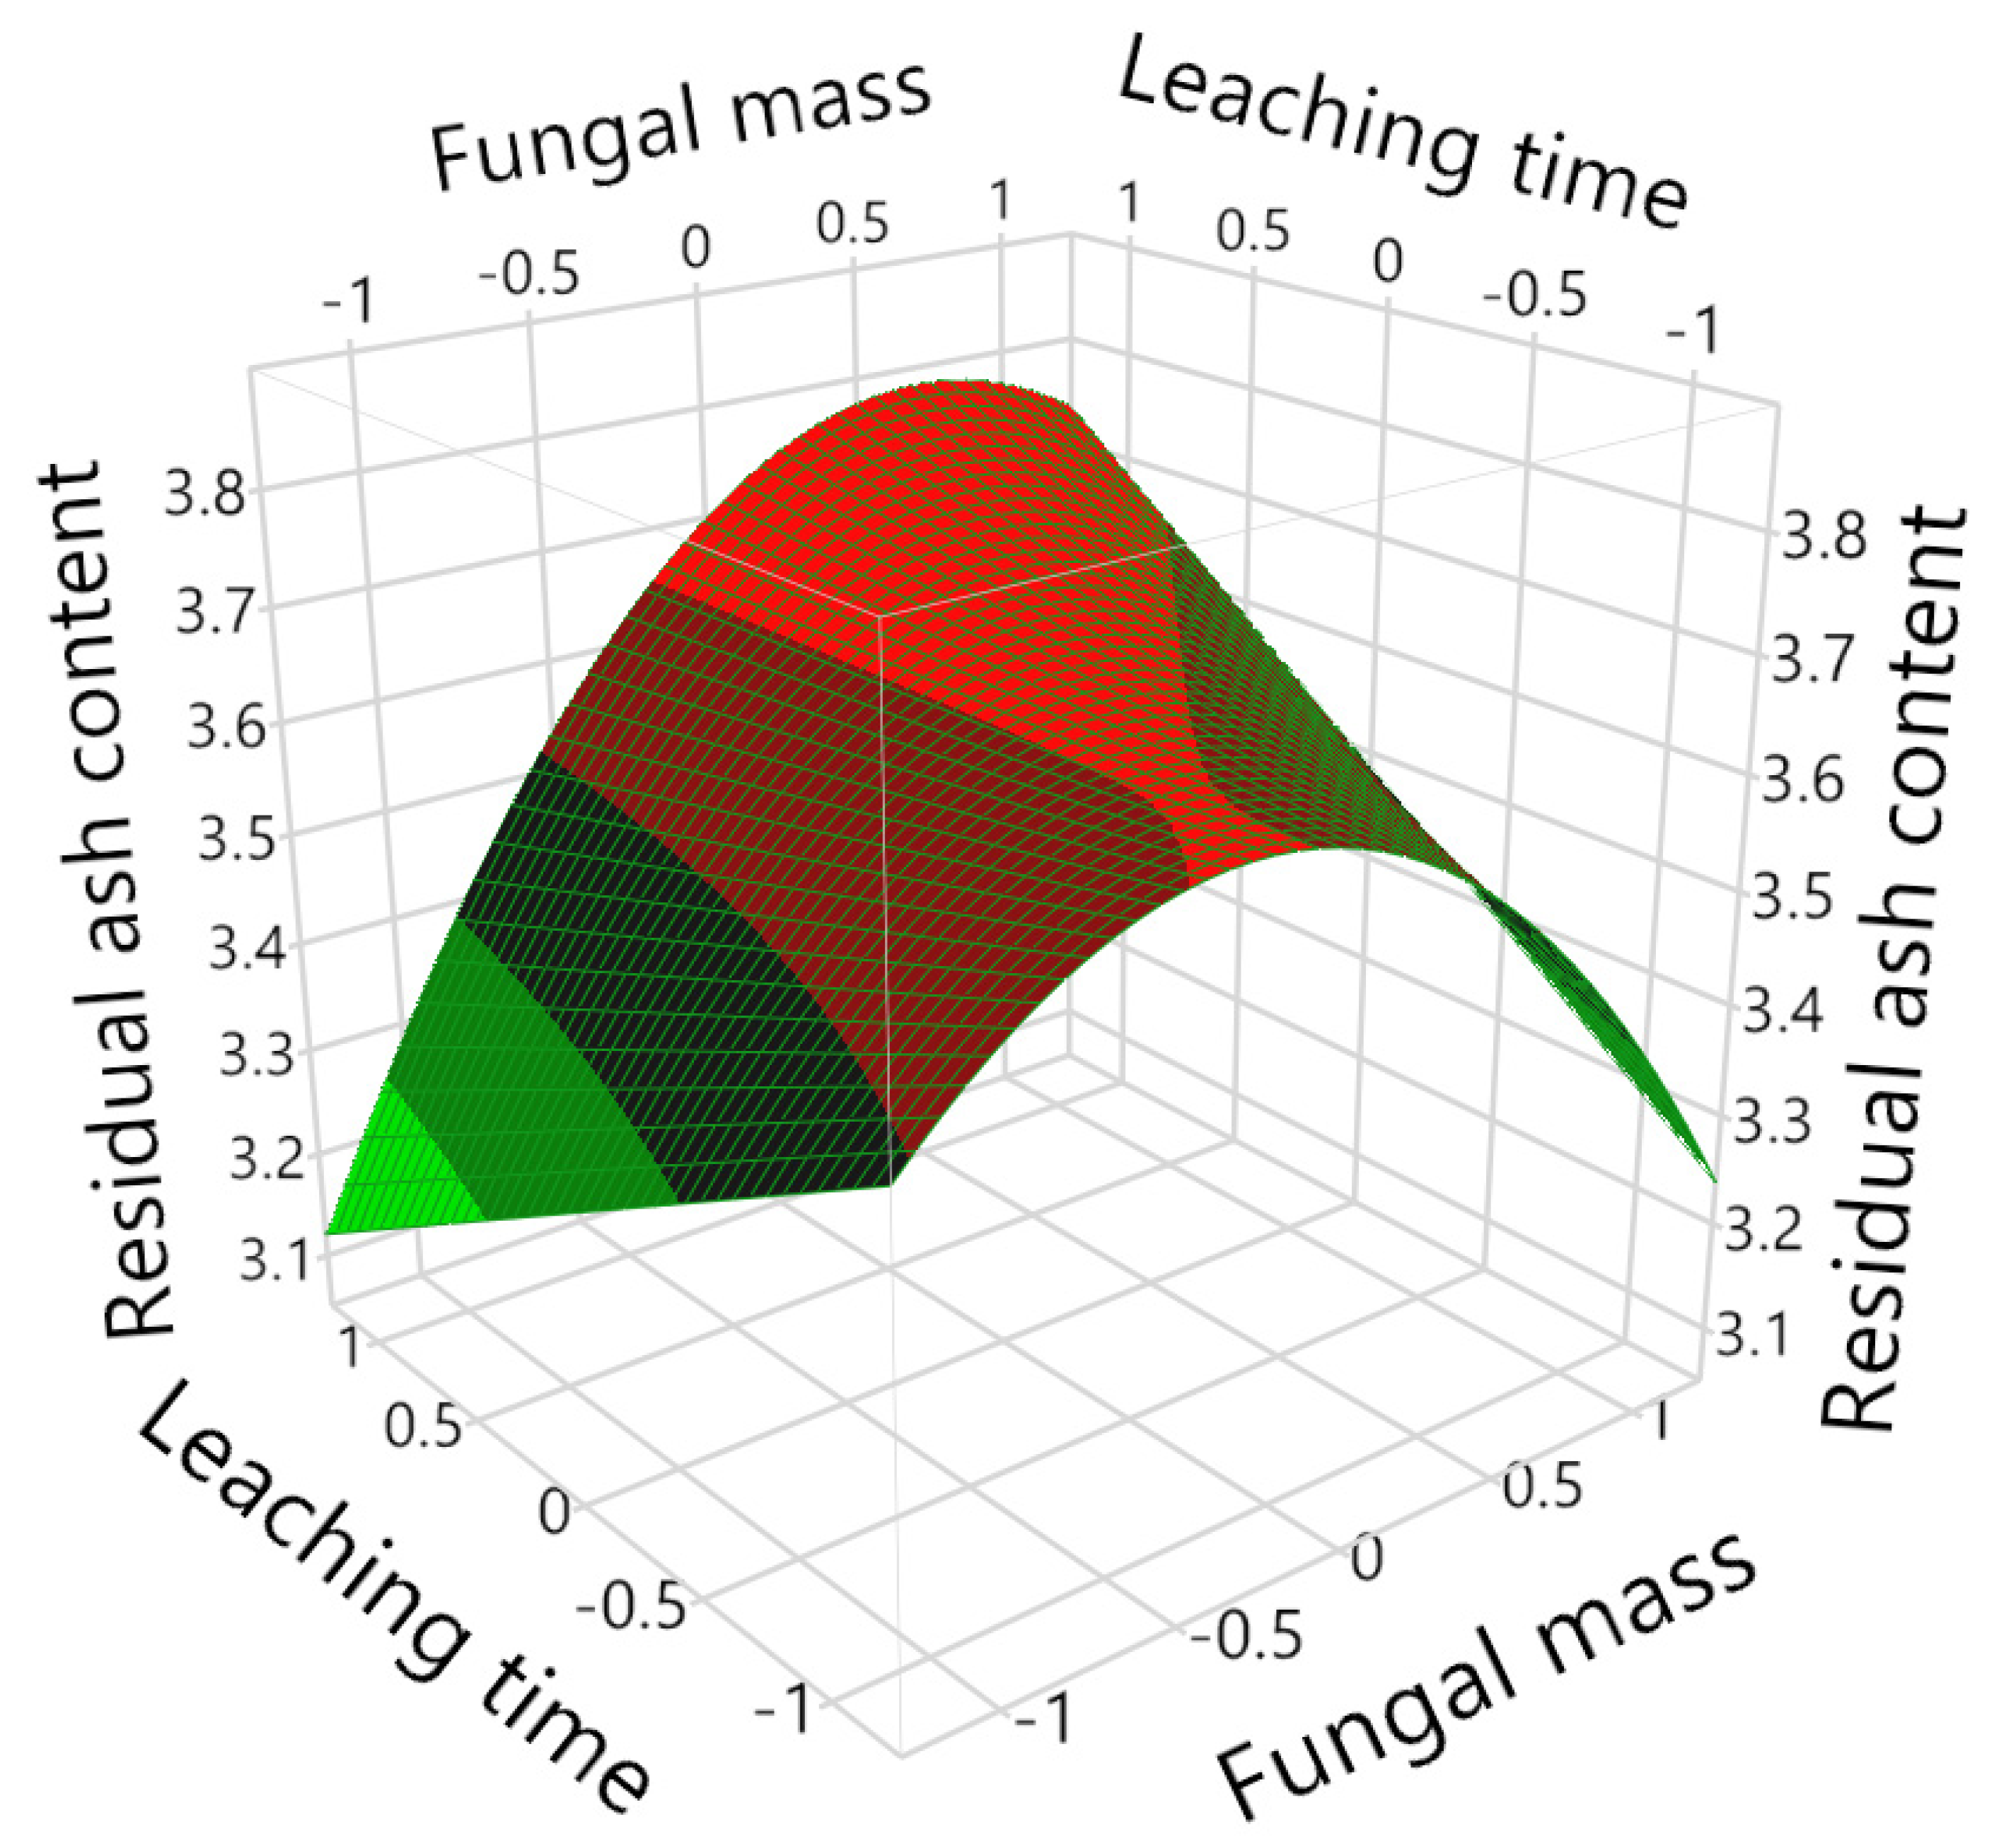
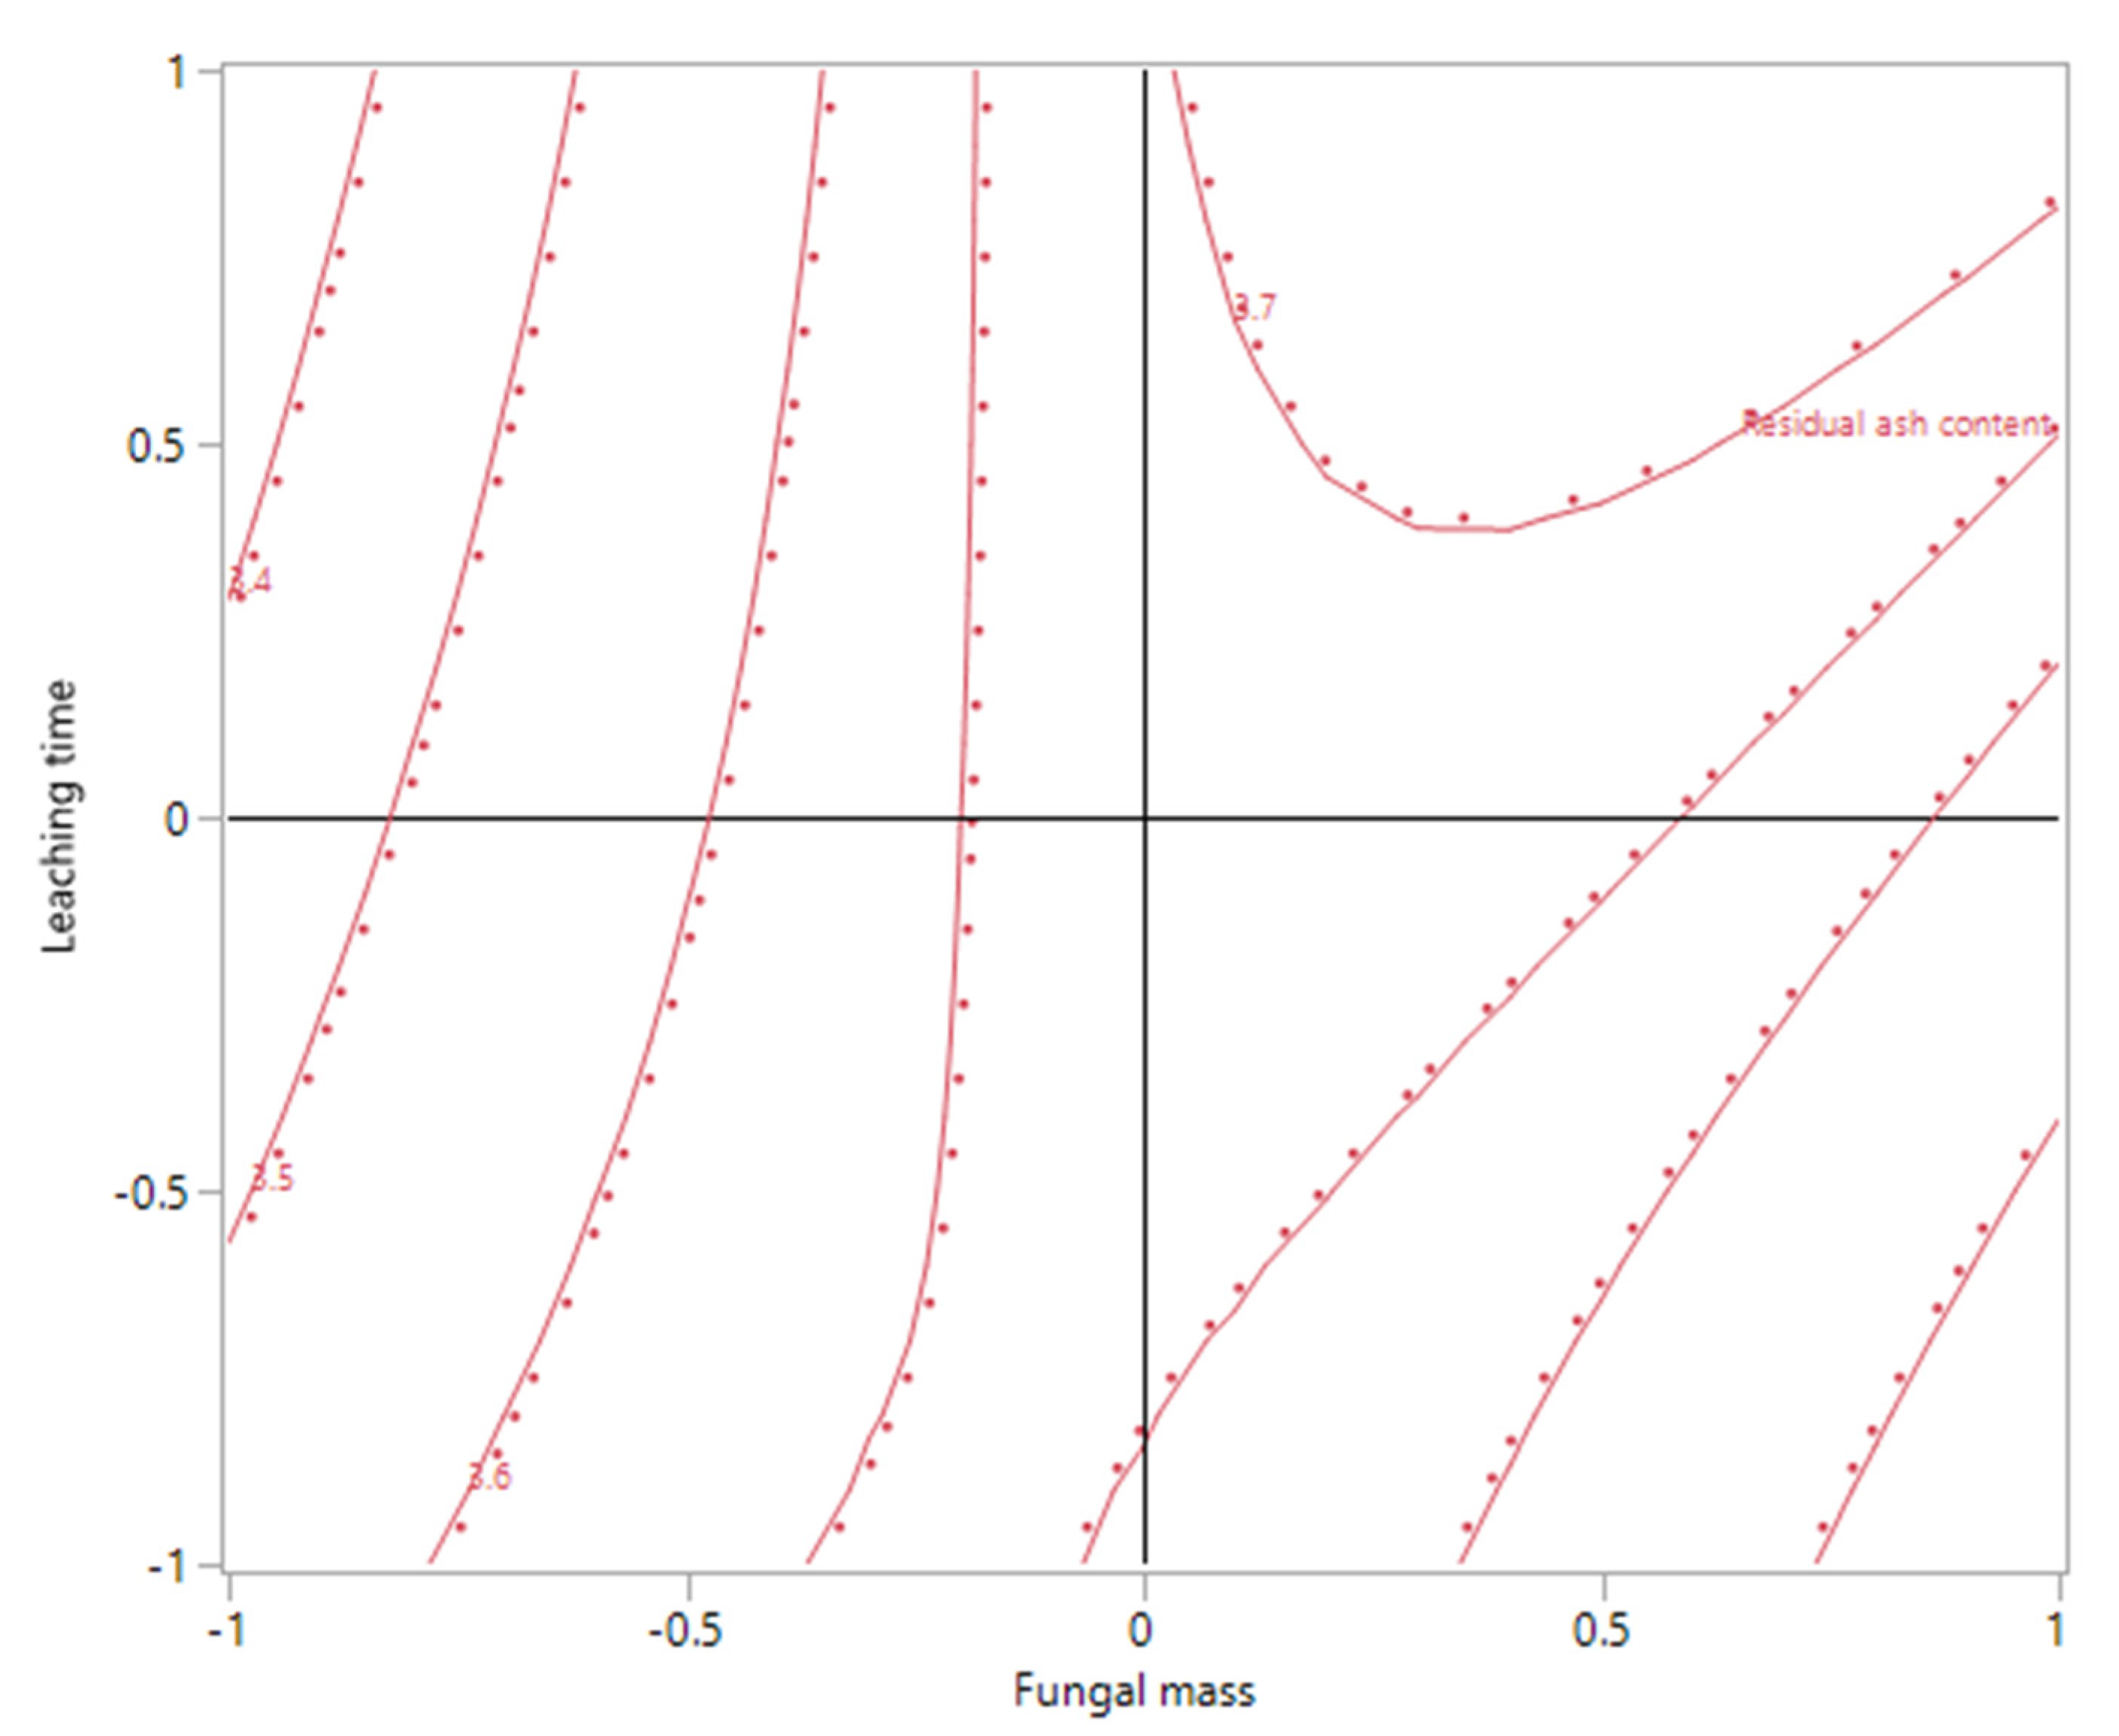
Though no optimal response was found in this study, the data did provide directions for the future work that might eventually achieve this objective. As shown in
Figure 4 and
Figure 5, the model assumed a ridge-shaped surface when the glucose concentration was maintained at a constant coded level 0 (5 g/L). The contour plot in
Figure 5 revealed the predicted response: ash content could be further decreased by increasing X
2 (leaching time) while keeping the X
1 (fungal mass) at a low level. This is in agreement with previous research on bioleaching heavy metals with
A. niger from either fly ash or mining ores, whose leaching time durations ranged from 12 to 70 days [
16,
17,
21].
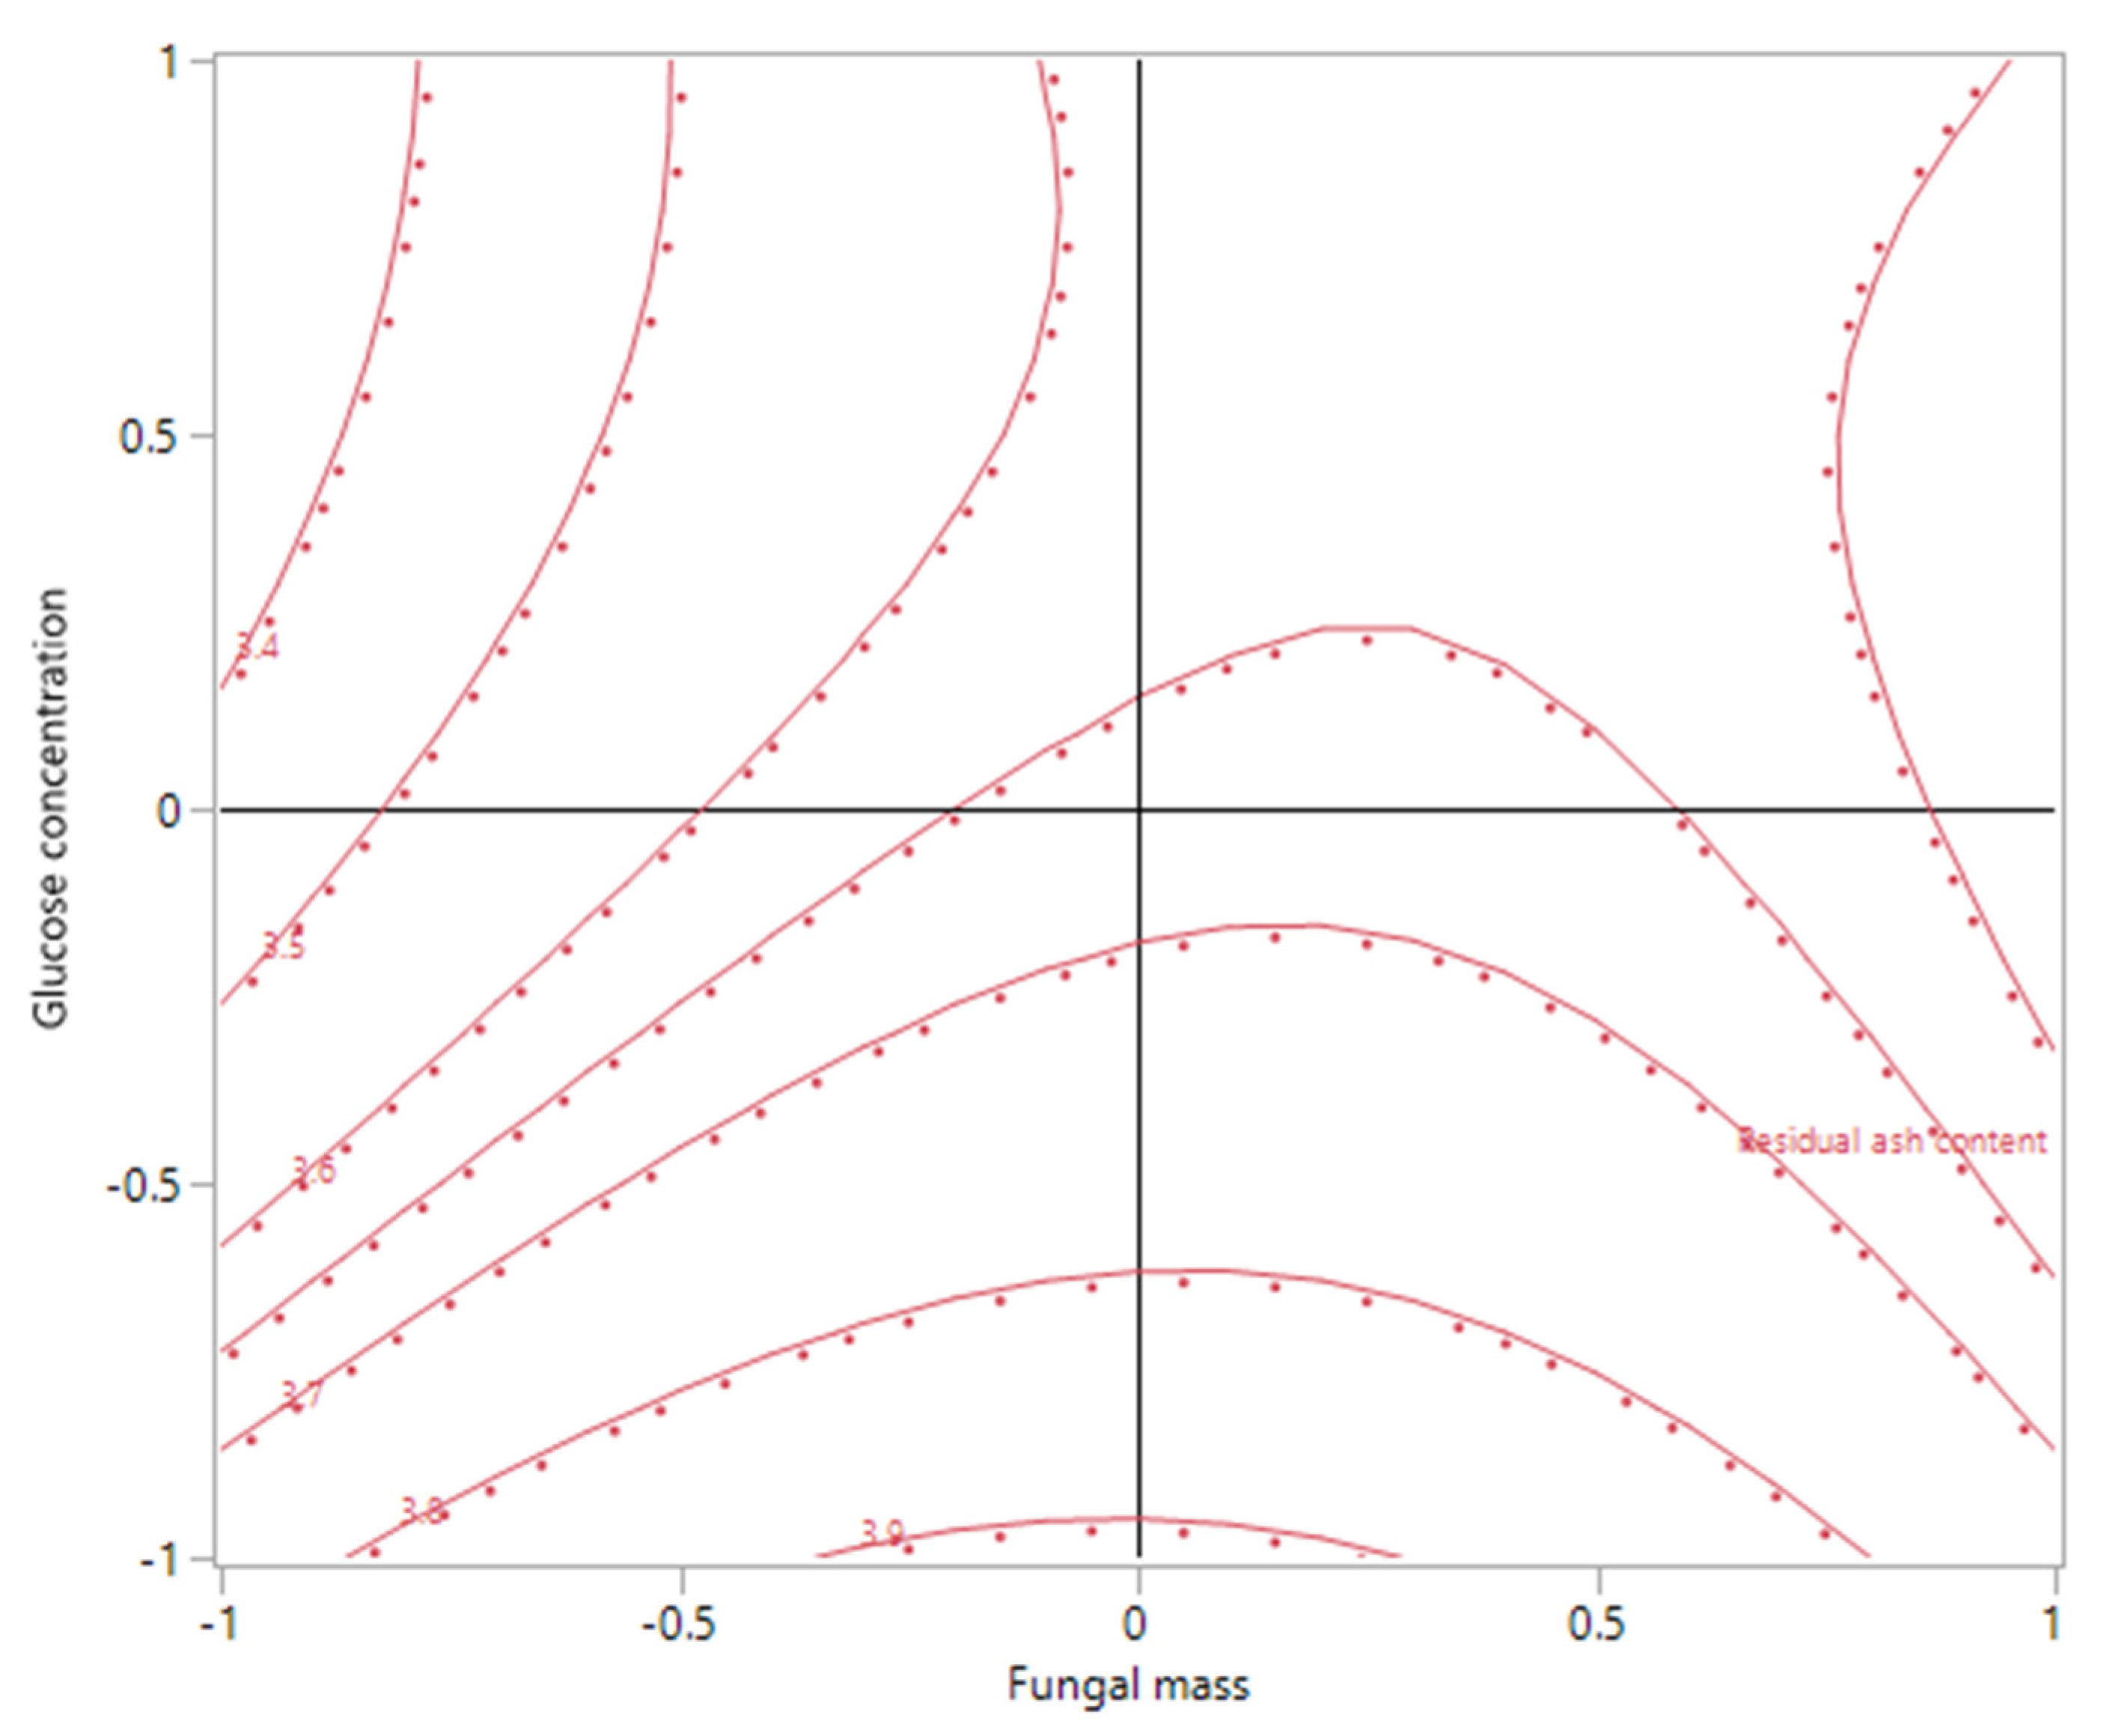
The interaction between X
1 (fungal mass) and X
3 (glucose concentration) was not significant as shown in
Table 6. However, the surface and contour plots (
Figure 6 and
Figure 7, X
2 = 0) did indicate an interesting area to explore, where X
1 (fungal mass) was lower beyond the current range (<−1) while X
3 (glucose concentration) was further increased (>1). In this study, the high level (+1) of X
3 (glucose concentration) was set at 10 g/L with the consideration of reducing the process cost; meanwhile, other researchers were regularly using a sucrose-based medium with a sugar concentration of 100 g/L for fungal cultivation and bioleaching [
21,
22]. Therefore, higher carbon source concentration could be used in follow-up studies to enhance the bioleaching effect.
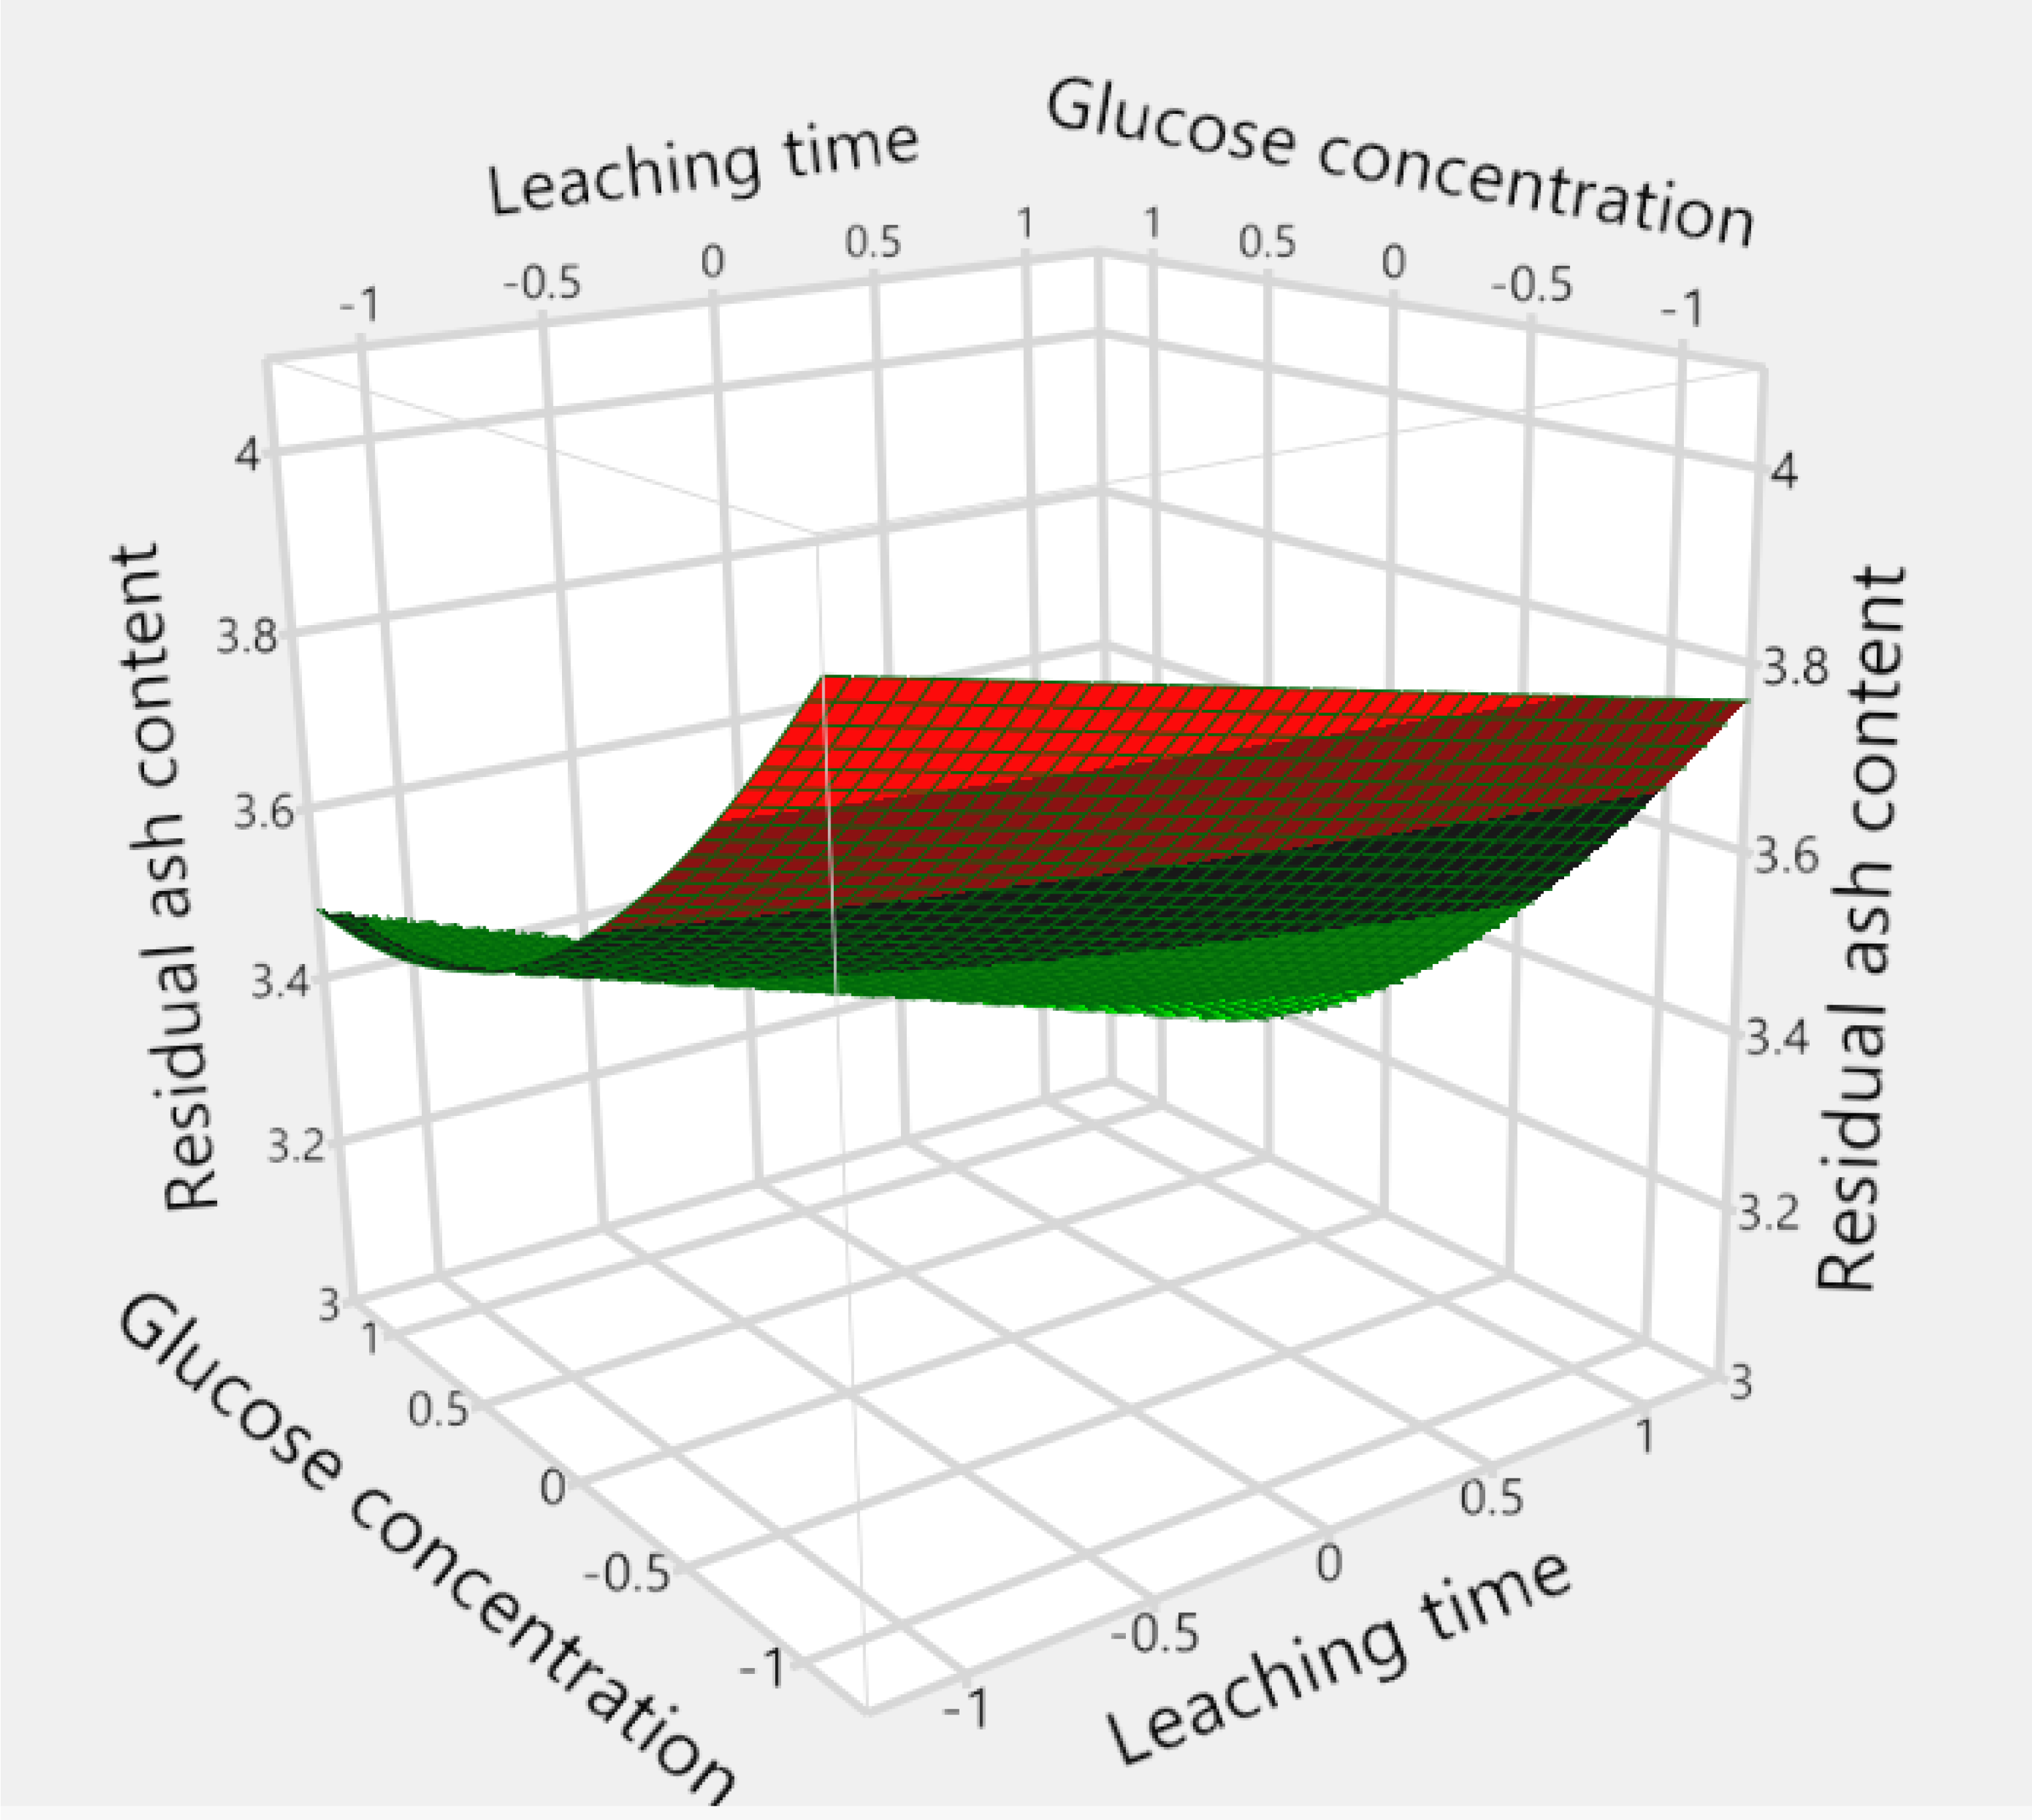
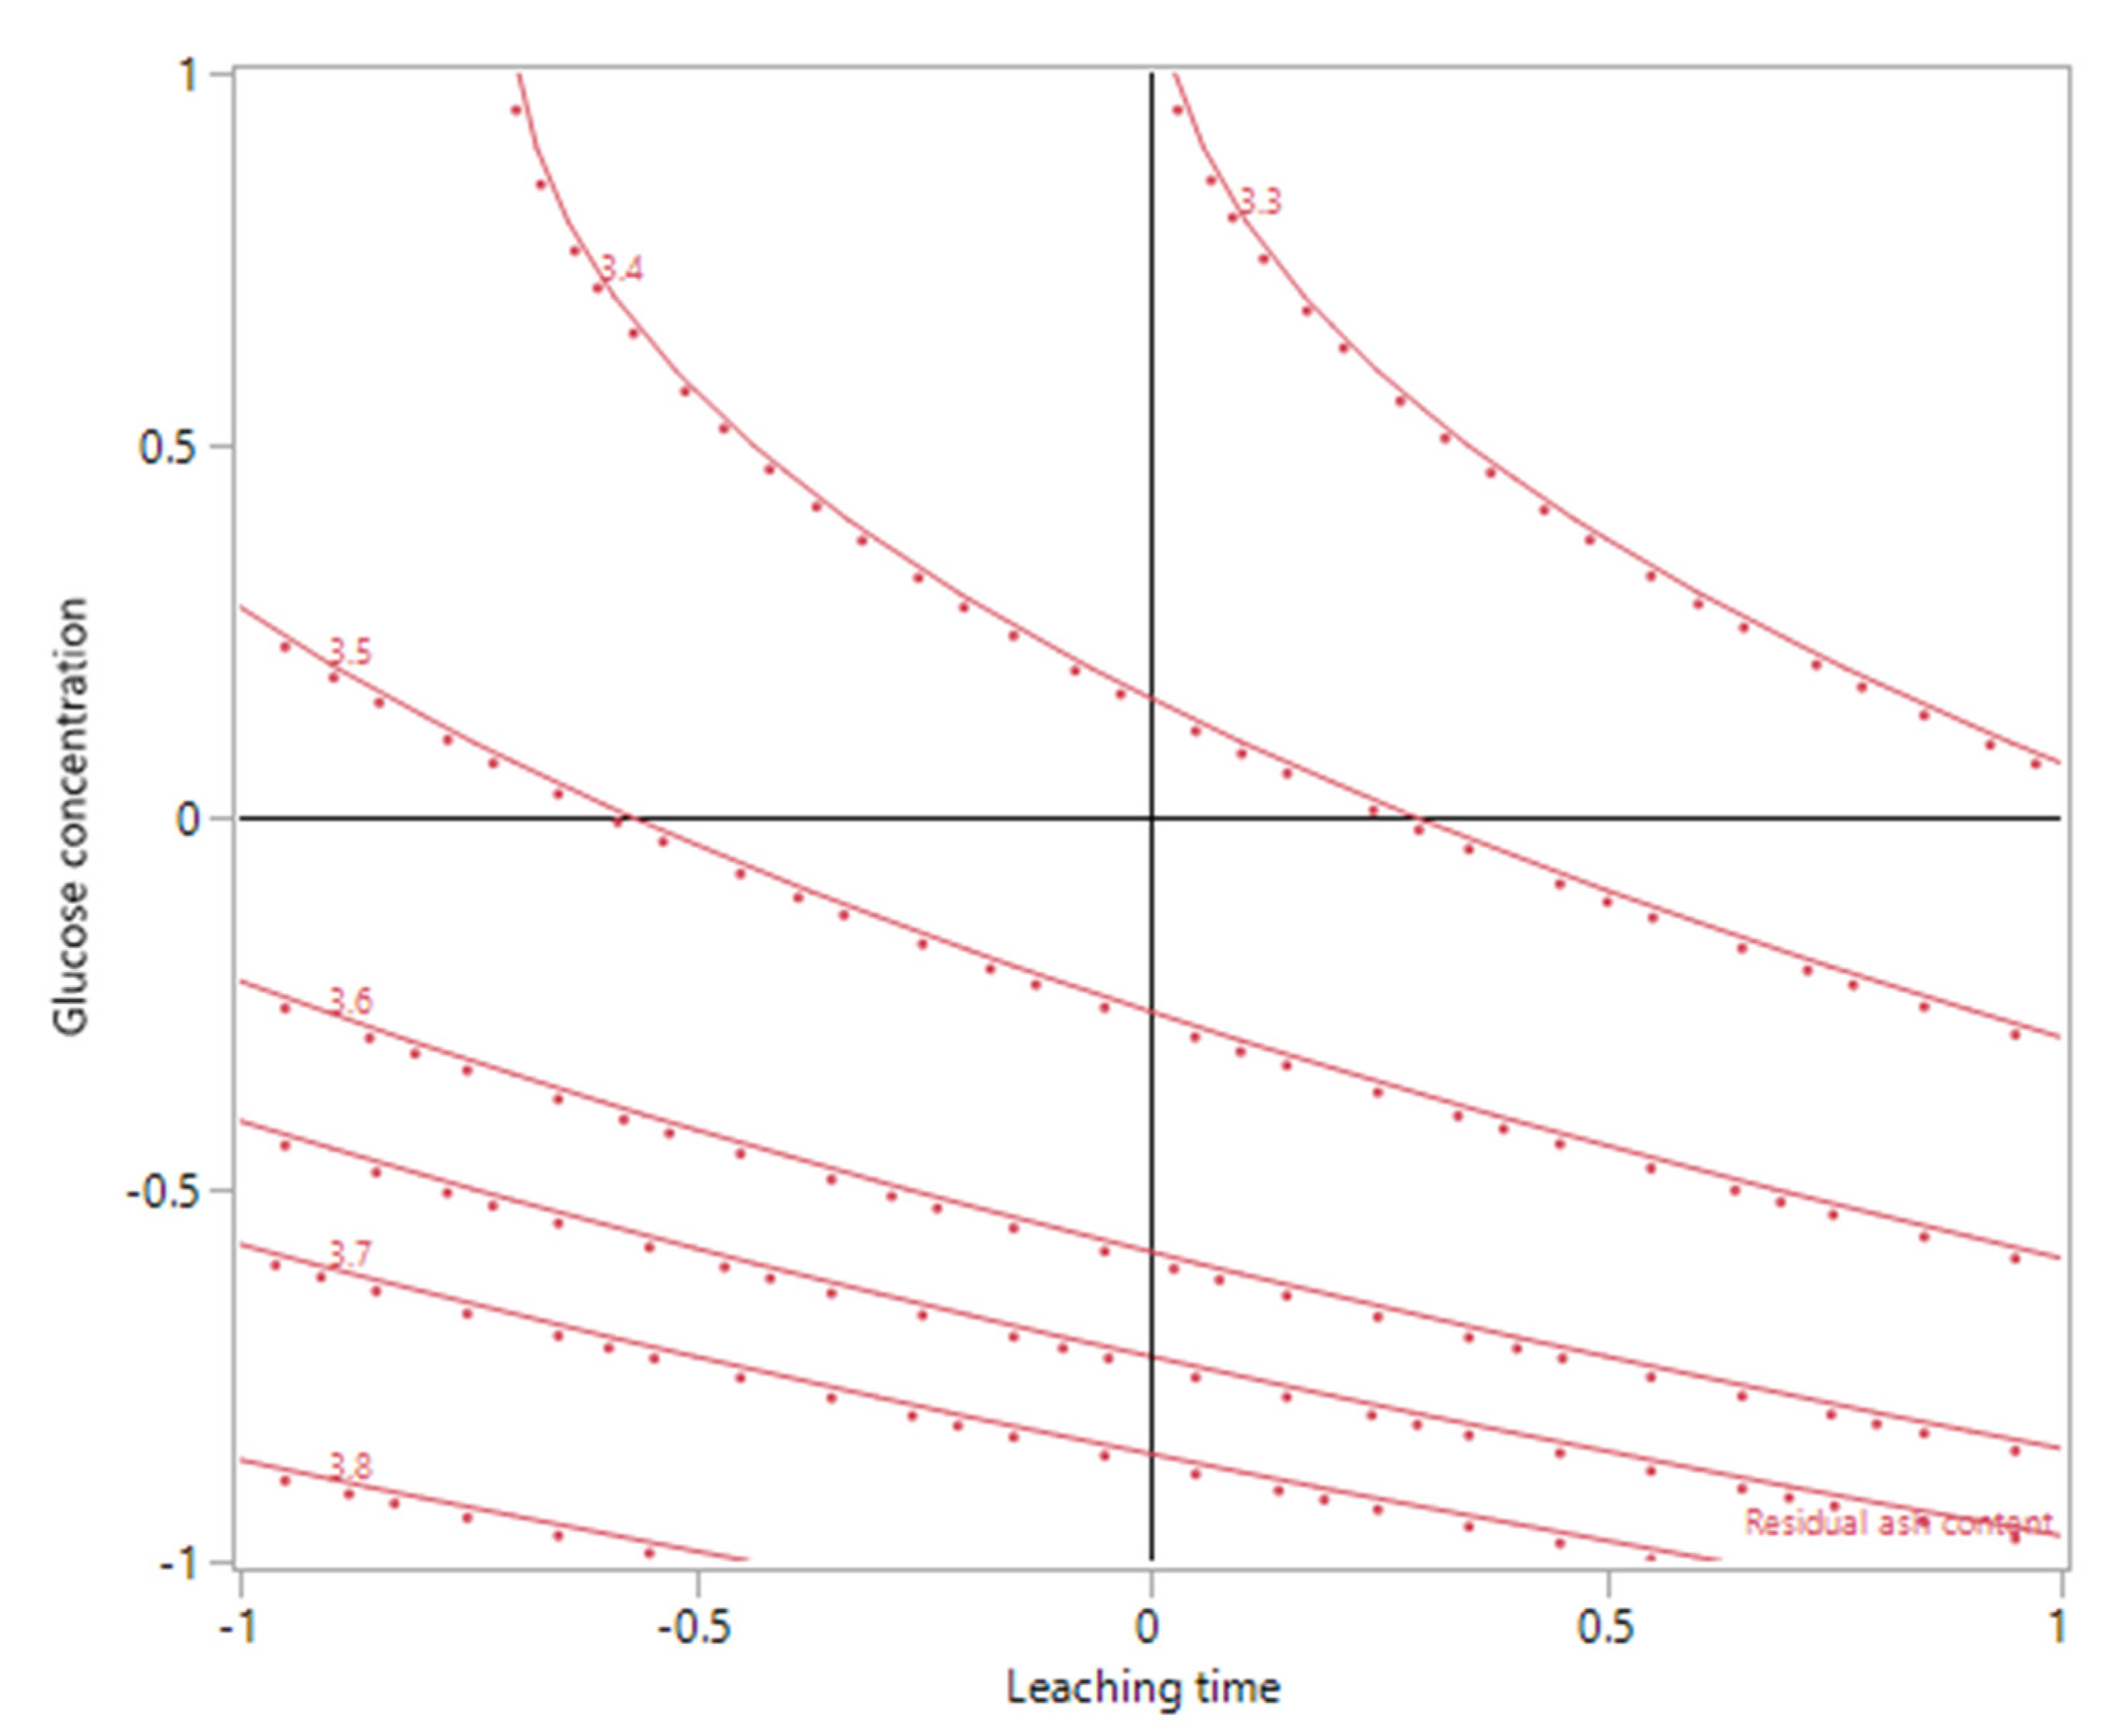
Figure 8 and
Figure 9 demonstrated the effect of the interaction of X
2 (leaching time) and X
3 (glucose concentration) on the residual ash content, when X
1 (fungal mass) was maintained at −1. The effect of X
2 (leaching time) was insignificant on the residual ash content when X
1 was set at 0 or higher, as the contour plot showed that the response contours were approximately parallel to the X
2 axis (data not shown). However, when X
1 was at the low level (−1), both plots (
Figure 8 and
Figure 9) revealed that the residual ash content could be further reduced when a longer leaching time and higher glucose concentration were used.
As indicated by the RSM data, a bioleaching experiment was carried out with 0.9 g of fungal mass and 50 or 100 g/L glucose in the starting liquid. In less than 1 day (19 h), the residual ash content of the sorghum straw was reduced to 2.73% in the case of 100 g/L of glucose, as shown in
Figure 10, which was even lower than all data obtained in the RSM study, and the residual ash content with 100 g/L glucose was significantly lower than that from leaching with 50 g/L of glucose (
p = 0.022). This supported the prediction of our model that increasing the glucose concentration could further reduce the ash content in the biomass. Therefore, future research could continue along the suggested path, and the minimum residual ash content might be obtained through another round of RSM design.
Fungal organic acids have been presented by several researchers as main leaching agents. Yang et al. claimed that gluconic acid was the major leaching agent in their study using
A. niger to remove heavy metals from MSW fly ash [
21]. De Windt and Devillers used mathematical modelling to investigate the fungal degradation of cement paste and suggested biogenic acids, including acetic, butyric, lactic, and oxalic acids, contributed to the degradation [
23]. Without using the fungus, Huang et al. found that citric acid, the most common product from
A. niger, was an effective leaching agent at room temperature for MSW fly ash treatment [
24]. A study by Umeda and Kondoh also confirmed the use of citric acid in the chemical leaching of rice husk for metal impurities removal [
25]. Our research found that the leachate pH was continuously decreasing from the first day of bioleaching for most experimental runs, and the final pH (
Table 3) was negatively correlated with X
1 (fungal mass) and X
3 (glucose concentration); however, no correlation was established between the pH and the model response, i.e., residual ash content. With further adjustment on the current bioleaching process, such as more carbon source input and longer leaching time, the correlation between fungal organic acids and bioleaching efficiency could become more evident in our research. In addition, to test this hypothesis on organic acids, the next research could also investigate the effectiveness of adding acids without fungus in ash removal.
With most lignocellulosic biomass feedstocks, ash content reduction is not the sole criterium in the determination of a suitable pretreatment process. The loss of organic matters due to leaching should also be studied. The most effective pretreatment process should be removing the inorganic compounds while keeping the organic matter loss at a minimum. Our previous study showed that organic matter loss in bioleaching was not significant, yet this could be further evaluated on the current bioreactor platform [
10]. Besides, the ash composition after the current bioleaching process may also be analyzed in follow-up studies, as it was also viewed as a crucial factor that could influence the quality of the feedstocks [
6].


