Article

Fermentation of Dairy-Relevant Sugars by Saccharomyces, Kluyveromyces, and Brettanomyces: An Exploratory Study with Implications for the Utilization of Acid Whey, Part I

by
Viviana K. Rivera Flores
,
Timothy A. DeMarsh
,
Patrick A. Gibney
and
Samuel D. Alcaine
*
Department of Food Science, Cornell University, Ithaca, NY 14853, USA
*
Author to whom correspondence should be addressed.
Fermentation 2021, 7(4), 266; https://doi.org/10.3390/fermentation7040266
Submission received: 12 October 2021 / Revised: 5 November 2021 / Accepted: 12 November 2021 / Published: 17 November 2021

Abstract

:
Acid whey from Greek-style yogurt (YAW) is an underutilized byproduct and a challenge for the dairy industry. One alternative is the fermentation of YAW by yeasts such as Saccharomyces, Brettanomyces, and Kluyveromyces spp., to produce new styles of fermented beverages. Previous research in our group suggested that the sugar profiles of the dairy coproducts impacted the fermentation profiles produced by B. claussenii. The present work aims to describe the fermentation of dairy sugars by S. cerevisiae, K. marxianus, and B. claussenii, under conditions comparable to those of YAW. For this purpose, four preparations of yeast nitrogen base, each containing 40 g/L of either lactose (LAC), glucose (GLU), galactose (GAL), or a 1:1 mixture of glucose and galactose (GLU:GAL), all at pH 4.20, were used as fermentation media. The fermentation was performed independently by each organism at 25 °C under anoxic conditions, while density, pH, cell count, ethanol, and organic acids were monitored. Non-linear modeling was used to characterize density curves, and Analysis of Variance and Tukey’s Honest Significant Difference tests were used to compare fermentation products. K. marxianus and S. cerevisiae displayed rapid sugar consumption with consistent ethanol yields in all media, as opposed to B. claussenii, which showed more variable results. The latter organism exhibited what appears to be a selective glucose fermentation in GLU:GAL, which will be explored in the future. These results provide a deeper understanding of dairy sugar utilization by relevant yeasts, allowing for future work to optimize fermentations to improve value-added beverage and ingredient production from YAW.

1. Introduction

Over the past several years, Greek-style yogurt has gained immense popularity around the world. According to Statista’s Greek yogurt report [1], this market is forecasted to reach 12.3 billion U.S. dollars worldwide by 2024. However, during Greek-style yogurt production, for every kilogram of product manufactured, 2 to 3 kg of yogurt acid whey (YAW) are also generated [2]. This represents a problem for dairy producers; due to the high biological oxygen demand of this effluent [3], its direct disposal into water streams poses a major ecological burden [4].
Several repurposing options for this coproduct have been studied over the years, including direct land application [5]; bioconversion of its lactose into lipids for animal feed [6]; and anaerobic digestion to produce methane for subsequent electricity generation [2]. However, these applications represent relatively less-preferred options within the United States Environmental Protection Agency’s Food Recovery Hierarchy system [7].
More recently, attempts to address the issues caused by the production of YAW have followed two main paths: (i) exploring opportunities to reduce the overall volume of this stream; or (ii) exploring its applications in products suitable for human consumption [8]. With regard to the latter, various studies have investigated the development of probiotic beverages using this substrate as a primary ingredient [9], the use of acid whey for the production of probiotic biomass [10], and the variety of sensory attributes that can be generated through the fermentation of acid whey beverages [11], to name a few. Such approaches are justified by the natural content of lactose, minerals, and vitamins present in YAW, which make it an attractive source of important nutrients. Menchik, Zuber, Zuber and Moraru [3] studied the composition of YAW and found its lactose content to be approximately 35 g/L; its pH to range between 4.2 and 4.5; its most abundant minerals to be potassium (157–169 mg/100 g), calcium (120–128 mg/100 g), and phosphorus (66.5–69.2 mg/100 g); and its vitamin profile to include pantothenic acid, niacin, riboflavin, and thiamine, at the following levels: 0.364, 0.115, 0.090, and 0.080 mg/100 g, respectively. These intrinsic characteristics make YAW a suitable candidate to be used as a substrate for novel beverages, in which its sugar, acid, mineral, and vitamin content can be fully exploited.
Recent trends in the fermented beverage market, namely beverages with functional characteristics or low or no alcohol [12,13], have fueled an interest in the search for non-traditional microbes that can contribute to the production of such drinks. For instance, Lawton, et al. [14] reviewed the biotechnological potential of Brettanomyces claussenii to produce novel fermented beverages from lactose-containing substrates. Despite traditionally being known as a spoilage organism, multiple applications for this yeast have recently been established in the beer industry [15]; this fact, combined with its ability to ferment lactose, makes it a good candidate to produce YAW-based beverages. Similarly, Karim, et al. [16] discussed the diverse range of applications of Kluyveromyces marxianus in food and biotechnology, including its potential as a probiotic, its role in the production of volatile compounds, and its demonstrated ability to produce bioethanol from dairy effluents like cheese whey and whey permeate, all of which make it another ideal organism to be used to produce fermented beverages from YAW. On the other hand, in the current context of industrially fermented beverages, Saccharomyces cerevisiae is the predominant yeast due to its excellent fermentation efficiency and its notably high resistance to ethanol. Even though the wild-type S. cerevisiae genome does not allow for the utilization of lactose as a carbon source [17], this yeast’s fermentative process can be combined with a mechanism of lactose hydrolysis to produce alcoholic beverages from YAW. Additionally, its role as a yeast model organism provides insights into the most basic aspects of yeast metabolism and makes it relevant in the exploration of fermentative processes.
Our preliminary experiments performed in YAW demonstrated changes in fermentation performance upon the addition of lactase [18]. Specifically, despite the observed ability of B. claussenii to metabolize both of the monomers that comprise lactose (glucose and galactose) separately, when YAW inoculated with B. claussenii was supplemented with lactase, analysis of the sugar profile of the finished fermentate revealed that the yeast had consumed the glucose but left a great majority of the galactose untouched. Those results made clear the need for the acquisition of more fundamental knowledge regarding the fermentative behaviors of yeasts employable in the development of value-added products derived from acid whey.
The current work aims to investigate the metabolic processes of such yeasts, namely S. cerevisiae, K. marxianus, and B. claussenii, in a simple medium, in order to observe these yeasts’ utilization of dairy-relevant sugars outside of the context of YAW, the chemical composition of which may complicate such observation due to the presence of constituents that obscure the view of the yeasts’ basic metabolic processes. Such YAW constituents include chemicals with buffering capacity, such as whey proteins and minerals [19], those with chelating activity, such as beta-lactoglobulin [20], and those with antifungal properties, such as lactoferrin [21].
While the present article describes observations made regarding fermentation under anoxic conditions, Part II of this study will present the results obtained in oxic environments. Here, we aimed to explore the fermentation of dairy-relevant sugars by S. cerevisiae, K. marxianus, and B. claussenii, focusing on the potential for ethanol production, all within the context of a medium adjusted to the initial sugar concentration and pH conditions characteristic of YAW. These results provide a deeper understanding of dairy sugar utilization by relevant yeasts, allowing for future work to optimize fermentations in order to improve and expand upon value-added beverage production from YAW, as we continue to work to realize the potential of alcoholic fermentation as a means for the reintroduction of YAW into the food supply chain.

2. Materials and Methods

2.1. Materials

The following reagents were obtained from Sigma-Aldrich (St. Louis, MO, USA): chloramphenicol, yeast nitrogen base with amino acids, D-lactose monohydrate, D-glucose, D-galactose, and lactic acid [90%]. A K. marxianus culture was obtained from the Cornell University Food Safety Laboratory (isolate: FSL B9-0008). S. cerevisiae (IOC BE FRUITSTM) and B. claussenii (OYL-201) cultures were obtained from Lallemand Oenology (Edwardstown, South Australia) and Omega Yeast Labs (Chicago, IL, USA), respectively.

2.2. Preparation of Inocula

Cryopreserved cultures of K. marxianus and B. claussenii were taken from their storage at −80 °C and were subcultured on Potato Dextrose Agar (Hardy Diagnostics, Santa Maria, CA, USA) supplemented with 25 mg chloramphenicol per liter medium. Incubation took place at 30 °C, for a duration of 2 days for K. marxianus and 6 days for B. claussenii. Next, a single colony from each culture was inoculated into 5 mL of a sterile 12% wt/v suspension of commercial Dry Malt Extract (Briess Malt and Ingredients Company, Chilton, WI, USA), which was then incubated for 48 h at 30 °C, with a constant agitation of 200 rpm. After this step, each culture was propagated in a flask containing 50 mL of Dry Malt Extract broth, which was incubated at the same temperature and level of agitation, until each species reached a cell concentration level greater than 3.2 × 10⁸ cfu/mL (after approximately 2 days). Each culture’s cell concentration and viability were monitored daily. Determinations of viability followed the method of Painting and Kirsop [22] with modifications: a 1:10 dilution of the culture was prepared using 1X phosphate buffered saline solution; this suspension was then diluted 1:2 with methylene blue [0.1% v/v] (Ward’s Natural Science, Rochester, NY, USA); the diluted culture was then applied to a hemocytometer and visualized under a light microscope. New cultures were propagated for each replicate. An S. cerevisiae inoculum was prepared according to the manufacturer’s recommendations. To achieve the desired inoculation level, an appropriate mass of active dried yeast was weighed, and was then rehydrated in sterile ultrapure water (Milli-Q Advantage A10 system, MilliporeSigma, Burlington, MA, USA) for 30 min prior to the inoculation (as described below).

2.3. Fermentation Media

Yeast nitrogen base with amino acids (YNB) was used as the common base for 4 distinct media, each supplemented with a different fermentable carbon source. First, the dehydrated YNB medium was reconstituted to a 1X solution, and then 40 g of either lactose (LAC), glucose (GLU), galactose (GAL), or a 1:1 mixture of glucose and galactose (GLU:GAL) was added per liter medium. Each treatment therefore had an overall concentration of fermentable sugars simulating that observed in YAW; whereas the LAC treatment simulated the sugar profile of YAW, the GLU:GAL treatment represented the sugar profile of YAW immediately following the full enzymatic hydrolysis of its lactose, and the GLU and GAL treatments were to serve as relatively less complex references against which to compare the other two treatments. A solution of 22.5% lactic acid (v/v) was then added to these preparations to adjust the pH of each to 4.2000 ± 0.0050, as measured with an iCinacTM analyzer (AMS Alliance, Rome, Italy); this resulted in a final concentration of approximately 0.1 g lactic acid per liter for all treatments. Finally, these preparations were sterilized using 0.45 µm polyethersulfone vacuum-membrane filters (VWR International, Radnor, PA, USA), and were stored at 4 °C until later use. New media were prepared for each replicate.

2.4. Inoculation and Fermentation

The media were all divided into 500 mL aliquots, and with respect to each type of sugar profile, each aliquot was inoculated with either S. cerevisiae, K. marxianus, or B. claussenii to achieve an initial concentration of approximately 4 × 10⁶ cfu/mL. For this purpose, K. marxianus and B. claussenii starters were centrifuged at 3220× g for 2 min, supernatants were discarded, and remaining pellets were resuspended in sterile Milli-Q water. Rehydrated S. cerevisiae culture was used for inoculation without further treatment. Each fermentation was carried out in a 1L Erlenmeyer flask, fitted with a stopper and an airlock (The Vintage Store, Delta, BC, Canada); airlocks were each filled with 15 mL of sterile Milli-Q water to prevent both oxygen infiltration and over-pressurization with carbon dioxide. Incubation took place at 25 °C for 7 days for S. cerevisiae and K. marxianus, and 18 days for B. claussenii; the fermentates were gently agitated (125 rpm) to maintain cultures in suspension, while approximating an anoxic environment. Three biological replicates were carried out for each fermentation; that is, replicates were run on different days, each time using fresh fermentation media and newly grown cultures, as previously stated.

2.5. Data Collection

2.5.1. Density, pH, and Microbial Enumeration

Samples for each type of analysis were collected every 24 h and measured in duplicate. To obtain density data, 7 mL of sample from each treatment was collected. These samples were degassed using an ultrasonic bath (VWR, Radnor, PA, USA) for 20 min, and were analyzed with a DMATM 35 density meter (Anton Paar, Graz, Austria), at 20 °C. For pH analyses, a 4-mL sample of each treatment was taken and measured via the iCinac TM analyzer. Microbial enumerations were obtained by sampling 0.5 mL from each treatment, doing serial dilutions with 1X phosphate buffered saline solution, and spread-plating on Potato Dextrose Agar supplemented with chloramphenicol at the concentration stated previously. Resulting plates were incubated at 30 °C for a duration of 24 h for K. marxianus, 48 h for S. cerevisiae, and 144 h for B. claussenii. After the incubation period, counts were determined using a Color Q-Count model 530 (Advanced Instruments Inc., Norwood, MA, USA).

2.5.2. Analyses of Ethanol, Organic Acids, and Sugars

A sample of 20 mL was collected at the beginning and the end of each fermentation for determination of concentrations of ethanol, lactic acid, acetic acid, and sugars (lactose, glucose, and galactose). These samples were sent to the Cornell Craft Beverage Analytical Laboratory (Cornell Agritech, Geneva, NY, USA), where they were analyzed using a Prominence HPLC system (Shimadzu, Kyoto, Japan). This system was equipped with a 300 × 7.8 mm Rezex™ ROA-Organic Acid H+ Column (Phenomenex, Torrance, CA, USA); a Photodiode Array Detector, model SPD-M20A (Shimadzu, Kyoto, Japan); and a Refractive Index Detector, model RID-10A (Shimadzu, Kyoto, Japan). A mobile solution of 0.005 N H2SO4 was used, and 20 µL of sample was injected at a constant rate of 0.5 mL/min.
Results are reported in percentage by volume (% v/v) for ethanol, and in g/L for organic acids and sugars. Additionally, ethanol results were compared to the maximum achievable ethanol yields for each treatment, which were calculated using the following equation:
M a x i m u m   E t h a n o l   Y i e l d   ( %   v / v ) = [ S u g a r ] 0 × T h e o r e t i c a l   Y i e l d 7.892
In which [Sugar]0 represents the initial sugar concentration in each treatment in g/L; the theoretical yield is considered to be 0.511 g ethanol/g glucose or galactose, and 0.535 g ethanol/g lactose; and the denominator represents a factor of the density of ethanol at 20 °C.

2.6. Statistical Analysis

2.6.1. General Analysis

Exploratory statistical analyses were performed using JMP software (SAS Institute, Cary, NC, USA), and significance level was set to 0.05. ANOVA and Tukey’s Honest Significant Difference Test were used to compare differences among means of several treatments at the same timepoint, and the “Matched Pairs” function was used for non-independent datapoints in longitudinal data analysis. In all graphs and tables, each datapoint shows the mean, and the variability range represents the standard deviation among replicates. Cell concentration results were log-transformed and analyzed using a linear scale.

2.6.2. Non-Linear Modeling

Non-linear fitting was performed using the Specialized Modeling—Fit Curve function in JMP. This analysis was performed for each individual species, using average density as the response, time as the regressor, and fermentable carbon source as the group. All curves were fitted using logistic models of 3 and 4 parameters, as well as exponential models of 2 and 3 parameters. The best fit for each species was selected using the Model Comparison tool in the Fit Curve platform, based on the corrected Akaike Information Criterion and the significance of all estimates which, according to the Wald test, had p-values of <0.0001. The models that were selected were Logistic 4P for B. claussenii, and Exponential 3P for both K. marxianus and S. cerevisiae. Refer to Table S1 for details about the models’ predictive equations.
Once a model was selected for each species, Analysis of Means (ANOM) was used to compare the growth rate parameters among treatments for the same species. The label “significant difference” was applied when an estimated parameter fell outside of the upper or lower decision limit of the analysis when using a significance level of 0.05; this process was facilitated by the Compare Parameter Estimates function in the Fit Curve platform.

3. Results and Discussion

3.1. Fermentation Characterization

3.1.1. Density

In the present study, density was used as a proxy for the concentration of fermentable sugars in the medium in order to provide data supplementary to those of actual sugar concentrations, which were obtained for the beginning and end of each fermentation, as described before. While continuous density decrease would indicate ongoing consumption of sugars and potential generation of volatile compounds and ethanol, a density value that remained unvaried over the course of several days would indicate completion of fermentation. For that reason, with regard to each individual treatment, paired t-tests were performed to compare each possible pair of days covering the duration of the fermentation. On the final day of a 3-consecutive-day period for which none of the possible pairs of days displayed a significant difference (p > 0.05), the fermentation in question was considered concluded. Figure 1 presents the density profiles of B. claussenii, K. marxianus, and S. cerevisiae in YNB supplemented with different carbon sources.
Our paired t-test showed that in the presence of lactose (LAC), B. claussenii completed the fermentation in 16 days. The ability of this species to utilize lactose in dairy by-products has been studied by other authors [23,24]. For instance, Marcus, DeMarsh and Alcaine [24] explored the fermentation profile of B. claussenii in a 10% total solid whey permeate solution under anoxic conditions. Their results showed that there was a density decrease of 0.016 g/mL after 34 days at 30 °C; however, we observed the same reduction in 16 days, indicating a higher density drop rate. The discrepancy of these results may be attributable to the differences in the fermentation media (e.g., pH and composition) as well as to the differences in experimental conditions. The mechanisms by which B. claussenii can metabolize lactose are still unclear. It has been demonstrated that both β-galactosidases and β-glucosidases possess lactase activity [25]. While B. claussenii has previously been determined to produce a β-glucosidase, which has since been characterized [26], the production of β-galactosidase by B. claussenii has not yet been thoroughly investigated, so questions remain regarding this metabolism and any associated lactose transport mechanism.
When B. claussenii was in the presence of glucose and galactose together (GLU:GAL), different results were observed. Initially, the density dropped at a noticeably higher rate than that of B. claussenii in LAC, but it ultimately bottomed out by day 5. As presented in Figure 1, this density drop was approximately half of that observed in the previously mentioned treatment, hypothetically due to the incomplete consumption of sugars in the fermentation medium (refer to Section 3.2 for further discussion on sugar composition). To the best of our knowledge, no study has explored sugar utilization by B. claussenii in a mixture of these two monosaccharides under these conditions. Moktaduzzaman, et al. [27] studied the effects that addition of glucose to a galactose medium had for B. bruxellensis under oxic conditions, but that species did not exhibit a fermentative metabolism for galactose.
Separate treatments involving either glucose or galactose aimed to unveil any potential difference in the speed at which these monosaccharides are metabolized by B. claussenii under anoxic conditions. Our results showed that this species can utilize glucose much quicker than galactose, decreasing the density of the medium containing the former in 7 days, as opposed to 18 days for that of the latter (Figure 1). A more formal approach for the comparison of these curves assisted in the determination of the significance of this difference. See Section 3.1.1.1 for a detailed explanation of this approach. One of the reasons for this behavior may relate to the transport systems responsible for the uptake of glucose and galactose by this species. While no empirical information is currently available in the literature regarding the nature of sugar transport in B. claussenii, genes encoding high-affinity glucose transporters were identified in B. bruxellensis and predicted for B. claussenii [28]. Of the other species we investigated, S. cerevisiae similarly exhibits faster growth on glucose than galactose, and galactose is primarily transported through a galactose permease encoded by the GAL2 gene [29,30].
Figure 1 presents the density decrease curves for K. marxianus; compared to those of B. claussenii, these curves show faster rates of consumption of the sugars studied. Hence, the appropriate duration of fermentation for this species was determined to be 7 days. In LAC, K. marxianus was able to complete the fermentation by day 4; in GLU:GAL, by day 6. Although no previous study has explored the ability of K. marxianus to ferment lactose specifically in YAW, its fermentation of lactose has been studied extensively in the context of other dairy byproducts [24,31,32,33]. The authors who conducted those investigations observed the great fermentation potential of this species for this sugar, and our results are in accordance with those observations. In fact, K. marxianus performed similarly in all substrates investigated, as it completed the fermentations in 4 days in both GLU and GAL.
As seen with K. marxianus, S. cerevisiae exhibited a rapid metabolism in these substrates. It completely reduced the density of GLU:GAL in 6 days, GLU in 3 days, and GAL in 4 days. On the other hand, LAC maintained its initial density, as expected. Given S. cerevisiae’s well-documented inability to take up lactose, this treatment served as a negative control against any external contamination. The LAC treatment notwithstanding, these results suggest that S. cerevisiae could maintain its characteristically efficient, rapid metabolism in dairy effluents, even at this pH. Moreover, the authors of the present study have previously observed the efficacy of S. cerevisiae in fermenting YAW, following lactose hydrolysis [18].

3.1.1.1. Non-Linear Density Modeling

To model the density curves of all treatments for each species, we used JMP’s specialized modeling platform. Non-linear modeling has been used to characterize fermentations in the past; one such example is that of Speers, et al. [34], who fit sigmoid-shaped logistic functions to changes in degrees Plato over time during the fermentations of 7 commercial beer brands.
Based on the results observed in the current study, the changes in density over time for the substrates fermented by B. claussenii were best modeled by sigmoidal profiles; consequently, the model that best fitted this density decrease was a logistic equation with 4 parameters (Table S1). This logistic model describes the characteristics of the fermentation process using the following parameters: lower asymptote (a), which is an estimation of the lowest achievable density at the end of the fermentation; upper asymptote (b), an estimation of the initial density value; growth rate (c), an estimation of the steepness of the curve or the speed at which the density decrease happened; and inflection point (d), an estimation of the time point at which the density decrease reached its maximum rate before it started slowing down. Refer to Tables S1 and S2 for details regarding the model equations for all carbon sources. This S-shaped model, in which density decrease fails to commence immediately following inoculation, suggests that this species undergoes a longer period of adaptation in the medium before it starts the process of cell replication, and later, of fermentation. Such a phenomenon was observed with all carbon sources fermented by B. claussenii (Figure S1).
Using the same type of model to describe density decrease in substrates fermented by the same species allows for the comparison of estimated parameters across carbon sources, especially the growth rates, which could unveil any significant difference in the rates of consumption of different sugars by this species. A comparison of growth rate estimates was conducted using ANOM (Figure S2), which identified the carbon source for which density reduction was significantly higher or lower than the overall reduction average of all sugars as pertains to one species. The upper and lower decision limits of this analysis served as the cutoff values to indicate significant difference. Based on this examination, fermentation of lactose by B. claussenii proved significantly slower compared to the respective fermentations of the rest of the carbon sources, while the fermentations of both glucose and the combination of glucose and galactose proved significantly faster. It is important to note that even though the hybrid carbon source composed of glucose and galactose exhibited the growth rate with the highest absolute value, this does not constitute the best fermentation performance among substrates, since its higher “a” value estimate (lower asymptote) indicates that the fermentation stopped short of consuming all available fermentable sugars (Table S2).
On the other hand, results obtained from K. marxianus showed an immediate density decrease, which was best fitted by an exponential model with 3 parameters. This model is described by three components: asymptote (a), an estimation of the lowest achievable density value; scale (b), an estimation of the difference between the highest and lowest density values in the process; and growth rate (c), an estimation of the speed at which the density decreased. Refer to Table S1 for details regarding the model equation.
The ANOM test revealed that this species ferments lactose significantly faster than it does other carbon sources, as observed by its estimate value, which exceeded the lower decision limit (Figure S2). It is worth mentioning that even though this difference is statistically significant, overall, K. marxianus exhibited a rapid fermentation rate with all carbon sources, a fact that may be more useful on a practical level.
The metabolism of S. cerevisiae in the substrates in which density decrease was observed (GLU:GAL, GLU, and GAL) was also better estimated by an exponential model with 3 parameters, albeit with a higher root mean square error than that associated with K. marxianus (Table S1). Our results as determined by the ANOM test did not show any significant differences between the growth rates of any of the carbon sources that were fermented by this species (Figure S2), showing good fermentation rates for all.

3.1.2. pH

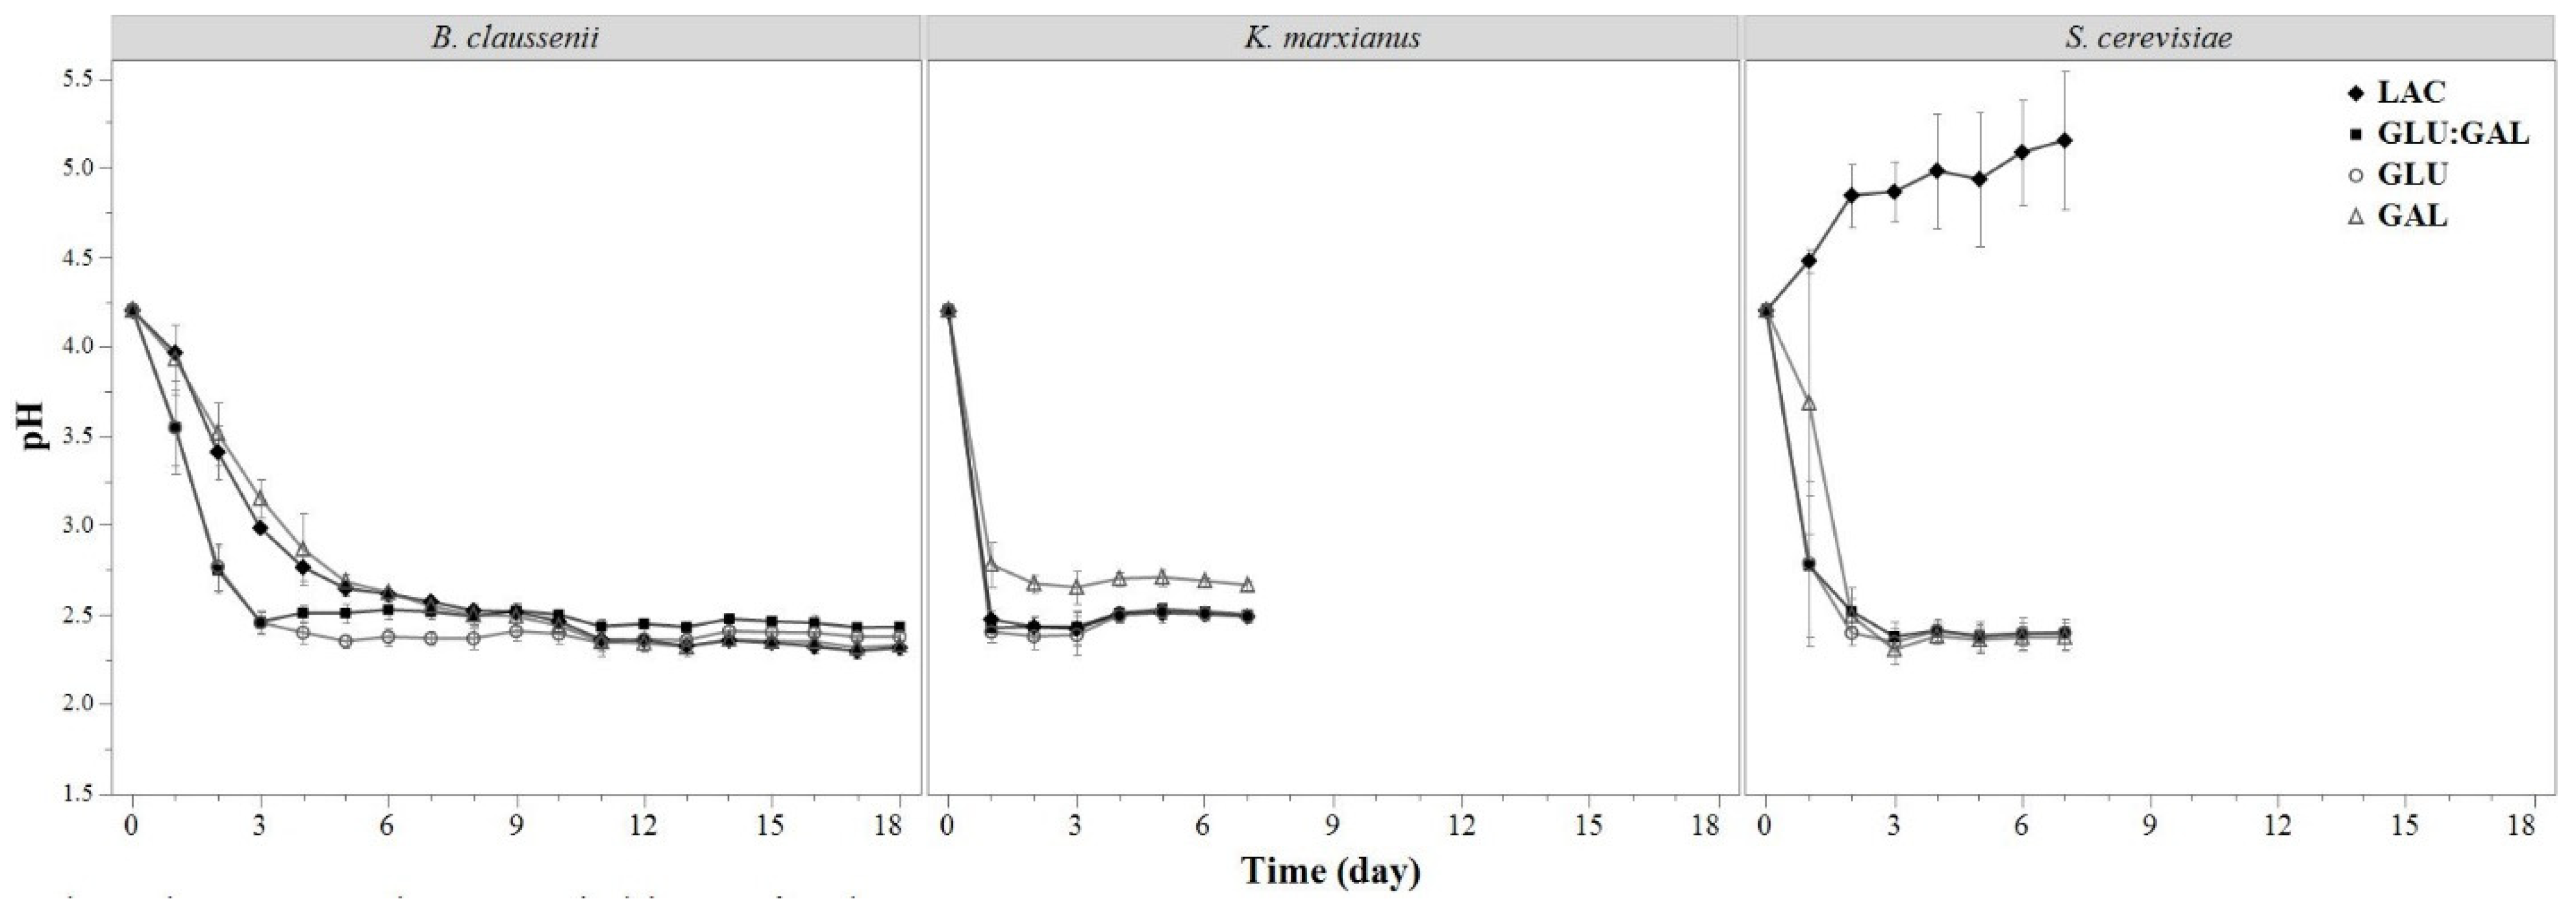
Another relevant characteristic during fermentation is pH, as it provides information about changes in the medium which may influence the fermentative performance of yeasts. Figure 2 presents the changes in pH that were observed in each medium supplemented with a different carbon source. We observed as much as a 1.9-unit reduction in pH in the media, with pH values dropping very rapidly during the first days of fermentation and decreasing more slowly as the fermentations ceased. This general pH reduction profile is typically seen during fermentations due to the logarithmic nature of the pH scale [35]. Likewise, preliminary fermentations of YAW showed this pattern of pH reduction, yet no decrease greater than 0.25 pH units was observed [11]. Such behavior may be the result of the characteristic mineral composition (K, Ca and P) of YAW [3], which improves its buffering capacity, as seen in other dairy products by Salaün, Mietton and Gaucheron [19].
As shown in Figure 2, there was a rapid decrease in pH when B. claussenii metabolized either GLU or GLU:GAL, as compared to the other 2 treatments. Early in the fermentations (days 2 and 3), a significant difference was observed in pH values when comparing the group comprising GLU and GLU:GAL with that comprising GAL and LAC; this difference subsequently lost its significance as LAC and GAL were more rapidly metabolized later in the fermentations. These results are in concordance with the significantly lower density growth rates (i.e., steeper curves) observed in GLU and GLU:GAL, as seen in Figure 1 and Figure S2, respectively.
Fermentations carried out by K. marxianus (Figure 2) showed similar pH decrease patterns for all treatments except for GAL, wherein pH values were significantly different from day 1 until the end of the fermentation (day 7).
Fermentates produced by S. cerevisiae achieved final pH levels that were comparable to the ones seen with other yeast species, except for that of LAC, for which an increased and highly variable pH was observed (Figure 2). There was an increase of almost 1 pH unit at the end of the 7-day period, potentially due to the uptake of lactic acid in its dissociated form by this species. Cássio, et al. [36] observed that S. cerevisiae IGC4072 transported lactate inside the cell by means of a proton-lactate symport, which was associated with an alkalinization of the medium. Moreover, the final pH value observed in this treatment was comparable to the one seen prior to the addition of lactic acid during the preparation of this medium.

3.1.3. Microbial Concentration

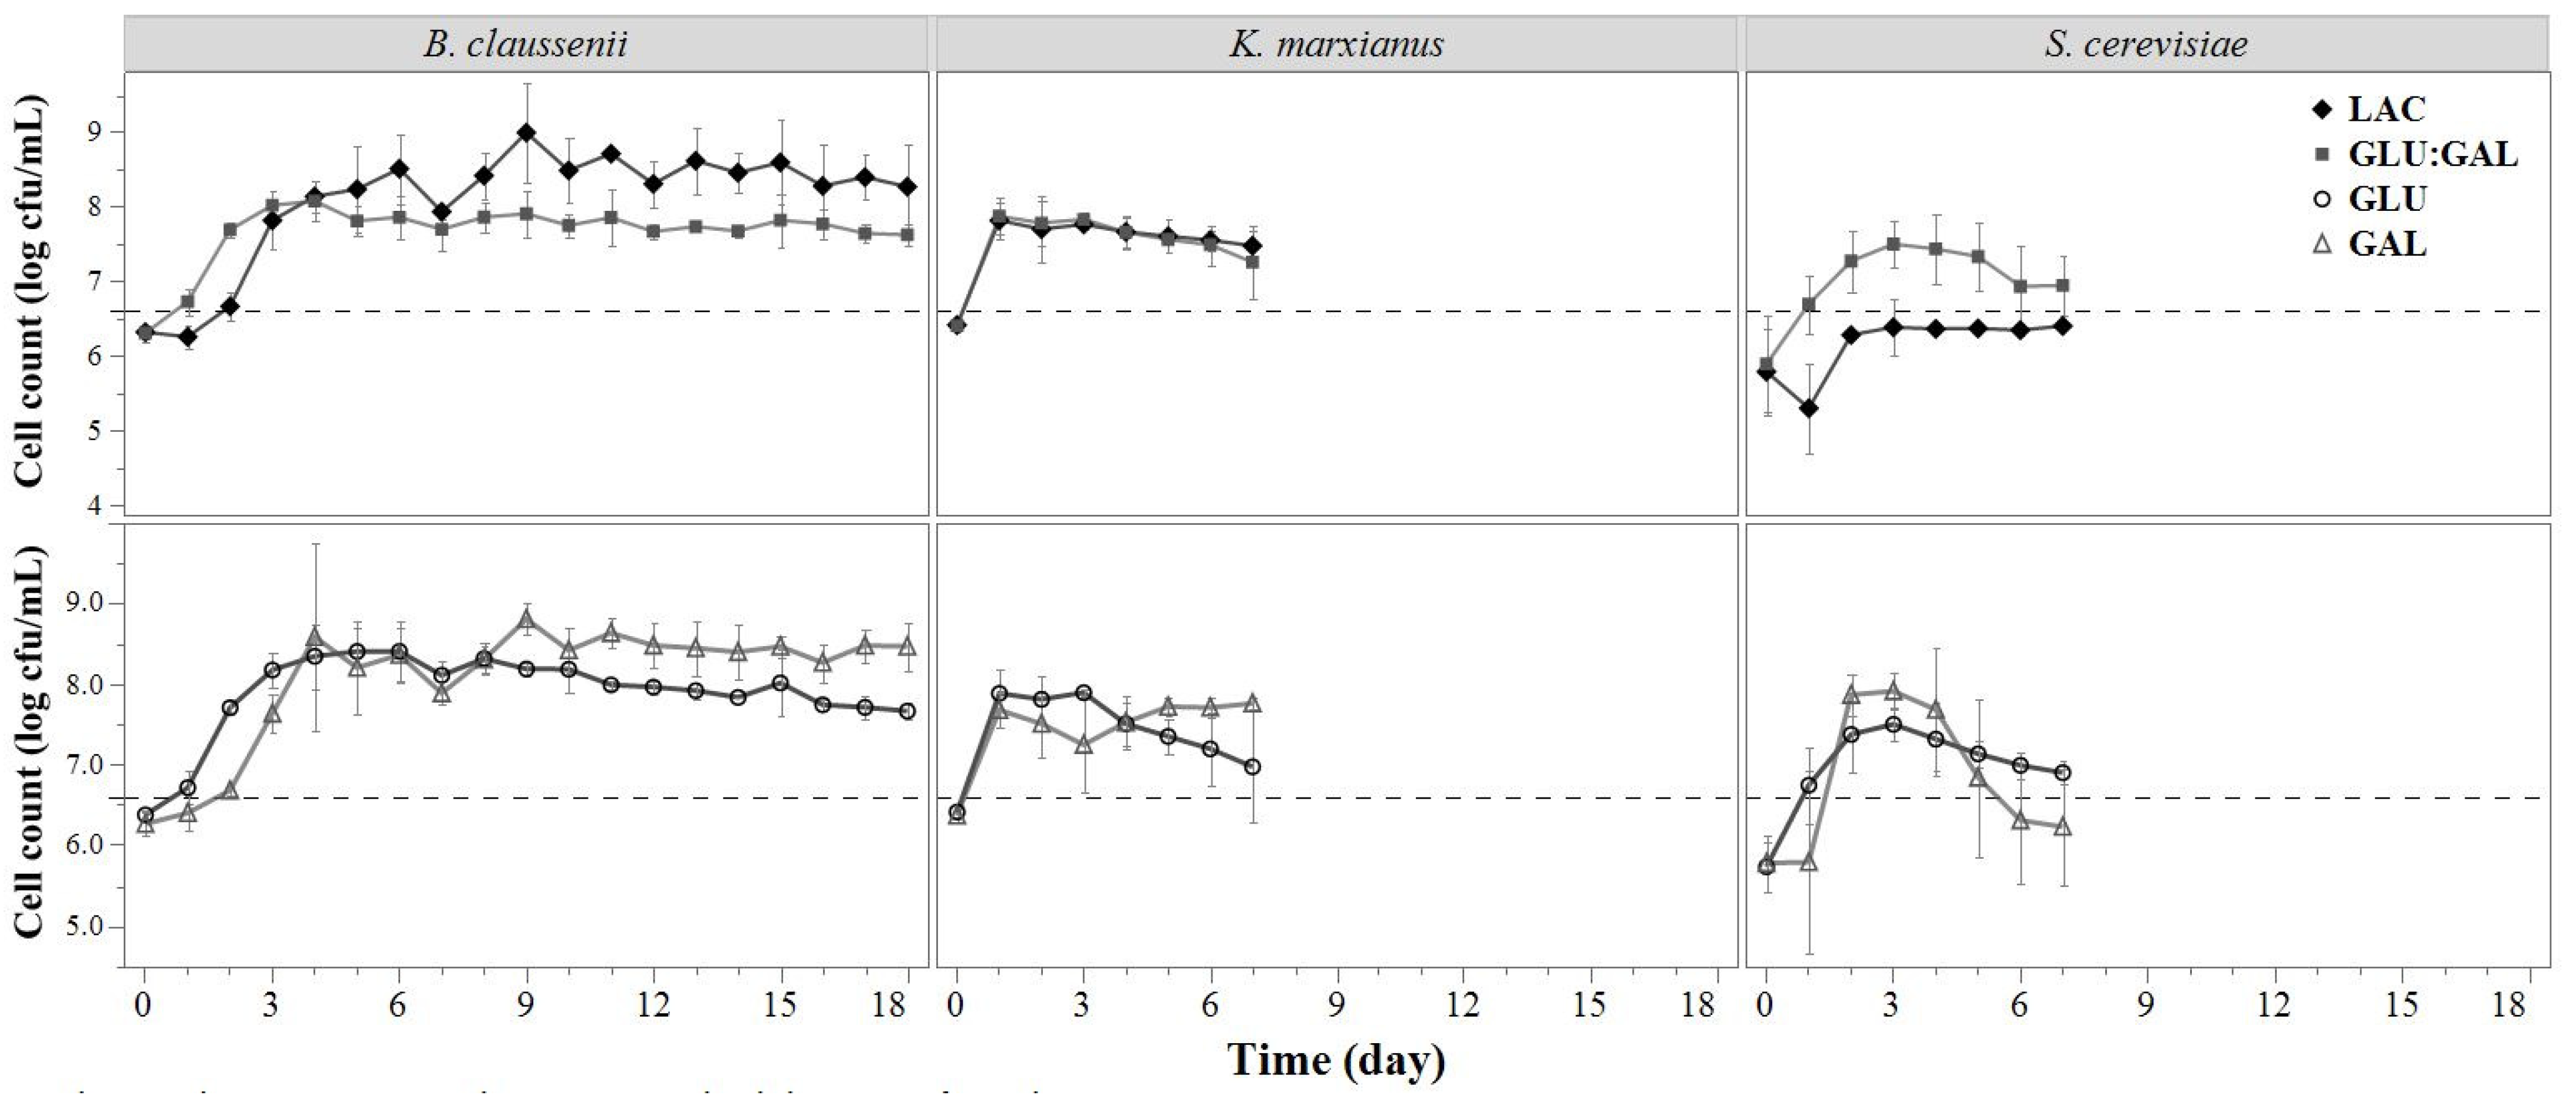
Figure 3 presents the results of cell counts of all species in different carbon sources. The graphs on the top represent the counts for LAC and GLU:GAL, while the graphs on the bottom represent those for GLU and GAL. The dotted lines show the targeted cell concentration at the time of inoculation. As compared to this initial level, almost all cases resulted in an increase of biomass at some point in the fermentation, and no apparent decrease in this microbial concentration was observed thereafter, even following the complete depletion of each sugar. Prolonged stationary phase in yeast is not surprising; Werner-Washburne, et al. [37] stated that during their stationary phase of growth, S. cerevisiae cells can maintain almost 100% viability for up to 3 months without any added nutrients or carbon source, though this is highly strain- and environment-dependent.
It is important to note that B. claussenii exhibited a slow increase in its cell concentration following inoculation, reaching exponential phase somewhere between day 1 and day 2. This longer lag period correlates to the one observed in density curves and is one possible reason that the density profile of this species was best described with a logistic model rather than an exponential model, which was found to be more appropriate for the density profiles of K. marxianus and S. cerevisiae (Section 3.1.1.1).
Growth curves for substrates fermented by K. marxianus show an increase of more than 1 log cfu/mL during the first 24 h of fermentation, indicating a short lag phase in these substrates that was not captured by our sampling frequency. Various researchers have investigated the kinetics of K. marxianus growth in cheese whey under acidic pH conditions [38,39]; their studies revealed that this species can exhibit a very short lag phase (2–4 h) in this substrate, reaching stationary phase within 16 h. It is also interesting to note that microbial counts of K. marxianus in the LAC and GLU:GAL treatments exhibited similar trends, a behavior that was not observed in any other group.
As observed in Figure 3, counts corresponding to S. cerevisiae started at a lower level than the desired inoculation and had higher variability, which may be explained by the use of active dried yeast that were rehydrated prior to inoculation, as opposed to liquid cultures for the other species. However, a relevant finding was observed in LAC, in which S. cerevisiae counts neither increased nor decreased throughout the fermentation period (matched pair comparisons revealed no significant differences between these numbers). The stable cell concentration of this species could be the result of an observed ability of S. cerevisiae to survive for extended periods with no carbon addition [37] as mentioned before, or could be due to the use of lactic acid as an alternative energy source in this medium.

3.2. Sugar Concentrations

Table 1 presents the sugar concentrations at the beginning and at the end of each fermentation for all substrates. For the purposes of this study, the B. claussenii samples were considered to be finished fermenting as of 18 days, and samples fermented by K. marxianus and S. cerevisiae were considered to be finished after 7 days; the data representing the sugar concentrations of the finished fermentates as presented here are in conformity with this timeline.
Post-fermentation sugar concentrations showed that not all B. claussenii fermentates underwent a complete consumption of sugars. GLU:GAL retained a substantial amount of galactose residue, this suggests that under the conditions provided, B. claussenii fermented only glucose, leaving almost all galactose intact. These results correlate very well with what was observed in density curves, where this treatment achieved only half the density reduction seen with the rest of the treatments (Figure 1). The factors driving this selective consumption of sugars by B. claussenii when in the presence of glucose and galactose—not in lactose—and the associated mechanisms of this behavior are still unclear. One plausible scenario involves the repression of genes involved in galactose metabolism in this species immediately following inoculation, which could be caused by the initial glucose concentration in the medium; a similar phenomenon was previously observed with D. bruxellensis CBS 2499 [27] and S. cerevisiae [29,30]. Later in the fermentation, by the time B. claussenii has fermented all of the available glucose in the medium to ethanol or acetic acid, it is possible that a state of intracellular redox imbalance has been established, such that despite any subsequent expression of gene products involved in galactose metabolism, a significant lag occurs before the cells can finally utilize the available galactose. While the full investigation of such a lag phase is outside of the scope of the current research, cell count samples taken for this treatment on day 18 contained viable CFUs at concentrations not significantly different from those immediately following the initial inoculation, indicating that by the end of sampling, the B. claussenii culture was viable but abstaining from metabolism of fermentable carbon sources. These findings propose an interesting direction for future research to help understand the carbon metabolism and metabolic regulation exhibited specifically by B. claussenii. This knowledge may be relevant in industrial processes that aim for a selective fermentation for the development of novel beverages generated from YAW, in which context, with the utilization of the proper lactase, glucose could be rapidly converted to ethanol or other metabolites, while the galactose that remains could provide supplemental properties (e.g., contributions to flavor, texture, and functionality, etc.). As expected, results from the fermentations performed by K. marxianus and S. cerevisiae demonstrated full consumption of sugars in all treatments, except for that of S. cerevisiae in LAC.
Luo, Demarsh, deRiancho, Stelick and Alcaine [11] studied YAW fermentations and reported full consumption of lactose by B. claussenii and K. marxianus under anoxic conditions after 21 days and 20 days, respectively. Additionally, their results in S. cerevisiae fermentates, treated with a lactase for the purposes of lactose hydrolysis prior to the fermentation, showed complete consumption of glucose and galactose within 8 days [11]. Their observations suggest that YAW has intrinsic compositional factors, unaccounted for in the design of the current research, that affect the speed of fermentation in some species, as seen with K. marxianus.

3.3. Production of Ethanol and Organic Acids

As stated previously, samples for analyses of ethanol and organic acids were collected at the beginning and at the end of each fermentation; the results are presented in Table 2 and Table 3.

3.3.1. Ethanol

B. claussenii produced an equivalent amount of ethanol in each fermentation medium, with the exception of GLU:GAL, in which galactose consumption was minimally observed (Table 1). Fermentation of this substrate yielded less than 0.8% v/v of ethanol, compared to an average of 1.8% v/v for other fermentable carbon sources. Such results translate to an efficiency rate of 31% for GLU:GAL, and an average rate of 77% for the other sugars, as compared to the maximum achievable ethanol yields presented in Table S3. Brettanomyces spp. are known to be effective acetic acid producers [40] thus, the lower ethanol yields seen in GLU:GAL could be the result of a combination of influences, including the total concentration of sugars consumed, and the conversion of a portion of those sugars to acetic acid, rather than ethanol (see Section 3.3.2).
K. marxianus achieved an ethanol concentration of around 2% v/v in all substrates. These results are in accordance with the ones observed by Luo, Demarsh, deRiancho, Stelick and Alcaine [11]; in their study, YAW with an initial lactose concentration of 32.9 g/L yielded 2.33% v/v ethanol upon being fermented anaerobically by K. marxianus. The values observed in the present study represent an average fermentation efficiency of 87%, as compared to the maximum achievable ethanol yields; the fraction of consumed sugar that is unaccounted for was potentially diverted to the formation of biomass or the generation of other metabolites.
S. cerevisiae exhibited similar levels of ethanol production for GLU, GAL, and GLU:GAL (around 2% v/v, and 84% efficiency). As has been demonstrated in innumerable previous studies, this species is well known to dependably produce ethanol in a variety of matrices.

3.3.2. Organic Acids

Table 3 presents the concentrations of lactic acid and acetic acid at the beginning and end of each fermentation. With B. claussenii, complete depletion of initial lactic acid was observed, suggesting utilization of this compound as part of its metabolism. Production of acetic acid was not significantly different between carbon sources, in spite of the lower level of sugar consumption observed in GLU:GAL for this species.
With K. marxianus, lactic acid consumption was also detected. Even though we found a residual amount of lactic acid in GLU:GAL, we considered it to be negligible. The transport of lactate anions was observed by Fonseca, et al. [41] in this species, which seems to occur by means of a monocarboxylate uniporter. Following fermentation, the concentration of acetic acid produced by K. marxianus in each substrate was lower than that produced by B. claussenii in the same substrate; this, combined with the opposite scenario for ethanol, suggests an intrinsic inclination of K. marxianus’ metabolism toward ethanol formation, at the expense of the production of acetic acid.
Of all the carbon sources, S. cerevisiae only depleted lactic acid when in the presence of lactose, in contrast to the metabolisms of the other species. Assimilable sugars in the medium could act as repressors of lactate’s transport in this yeast; such repression has already been demonstrated to occur in the presence of glucose, as reported by Cássio, Leão and van Uden [36]. Regarding acetic acid, S. cerevisiae exhibited minimal synthesis in all treatments except in LAC, in which no acetic acid was produced. Overall, our results indicate that, in this treatment, S. cerevisiae remained viable due to its ability to metabolize lactic acid, showing no indications of sugar consumption, replication, nor production of ethanol nor organic acids.

4. Conclusions

This work aimed to describe the processes of fermentation of dairy-relevant sugars by S. cerevisiae, K. marxianus, and B. claussenii, along with each’s relative potential to produce ethanol in media adjusted to the initial sugar concentration and pH conditions characteristic of YAW. Our results indicated that these species showed distinct sugar utilization rates and ethanol yields in the various substrates. Although K. marxianus and S. cerevisiae displayed rapid sugar consumption with consistent ethanol yield efficiencies in all media, B. claussenii showed variable rates of sugar utilization and variable ethanol yields. Additionally, our results revealed a difference in the sugar uptake of B. claussenii in LAC as compared to that in GLU:GAL, in which this organism displayed a strong propensity toward fermentation of glucose to the almost complete exclusion of galactose. These observations point to the possibility of developing versatile biomanufacturing processes that could target glucose for ethanol production, while leaving available residual galactose that could confer resulting products with additional properties, or that could be used as an input for potentially cost-effective galactose powder production. They also elicit questions regarding the sugar metabolism of B. claussenii and offer openings to expand the existing body of literature related to this species. Overall, these results provide a deeper understanding of dairy sugar utilization by relevant yeasts, allowing for future work to optimize fermentations in order to improve valued-added beverage and ingredient production from YAW. Further studies should investigate the profiles of these fermentations under oxic conditions for potential organic acid synthesis, as well as the optimal operational parameters that maximize ethanol production from YAW and other dairy byproducts.

Supplementary Materials

The following are available online at https://doi.org/10.7298/v23f-9x12, Table S1: Prediction models for density curves of anaerobic fermentations by different yeasts, in non-selective medium supplemented with sugars commonly found in acid whey, Table S2: Estimated parameters of fitted models for density curves of anaerobic fermentations by different yeasts, Figure S1: Model plots for density curves of anaerobic fermentations by different yeasts, in non-selective medium supplemented with sugars commonly found in acid whey, Figure S2: Analysis of Mean (ANOM) of growth rate parameters obtained per carbon source for each yeast species, Table S3: Estimated maximum achievable ethanol yields in each treatment (in% v/v), as calculated using Equation (1).

Author Contributions

Conceptualization, S.D.A. and V.K.R.F.; methodology, V.K.R.F., T.A.D. and S.D.A.; software, V.K.R.F.; validation, V.K.R.F. and T.A.D.; formal analysis, V.K.R.F. and T.A.D.; investigation, V.K.R.F. and T.A.D.; resources, S.D.A.; data curation, V.K.R.F. and T.A.D.; writing—original draft preparation, V.K.R.F. and T.A.D.; writing—review and editing, V.K.R.F., T.A.D., S.D.A. and P.A.G.; visualization, V.K.R.F. and T.A.D.; supervision, S.D.A. and P.A.G.; project administration, S.D.A.; funding acquisition, S.D.A. All authors have read and agreed to the published version of the manuscript.

Funding

This research was funded by the New York State Dairy Promotion Advisory Board, appointed by the New York State Department of Agriculture and Markets (Albany, NY, USA).

Institutional Review Board Statement

Not applicable.

Informed Consent Statement

Not applicable.

Data Availability Statement

The data presented in this study are available on request from the corresponding author.

Acknowledgments

We would like to thank the New York State Dairy Promotion Advisory Board, appointed by the New York State Department of Agriculture and Markets (Albany, NY, USA), for funding this study. We also acknowledge the Cornell Craft Beverage Analytical Laboratory (Geneva, NY, USA), particularly Pamela Raes, for her valuable assistance executing the HPLC analyses that allowed for the quantification of fermentation metabolites.

Conflicts of Interest

The principal investigator of this research, Sam Alcaine, is the cofounder of the startup company Norwhey Brewing, which aims to transform yogurt whey into low-alcohol seltzers.

References

  1. Statista Dossier on Greek Yogurt in the U.S. Available online: https://www-statista-com.proxy.library.cornell.edu/study/25622/greek-yogurt-statista-dossier/ (accessed on 4 August 2020).
  2. Erickson, B. Acid Whey: Is the Waste Product an Untapped Goldmine? Available online: https://cen.acs.org/articles/95/i6/Acid-whey-waste-product-untapped.html (accessed on 8 February 2019).
  3. Menchik, P.; Zuber, T.; Zuber, A.; Moraru, C.I. Short communication: Composition of coproduct streams from dairy processing: Acid whey and milk permeate. J. Dairy Sci. 2019, 102, 3978–3984. [Google Scholar] [CrossRef] [PubMed]
  4. Jelen, P. Whey Processing|Utilization and Products. In Encyclopedia of Dairy Sciences, 2nd ed.; Fuquay, J.W., Ed.; Elsevier: Amsterdam, The Netherlands, 2011; pp. 731–737. [Google Scholar]
  5. Ketterings, Q.; Czymmek, K.; Gami, S.; Godwin, G.; Ganoe, K. Guidelines for Land Application of Acid Whey; Department of Animal Science Publication Series; Cornell University: Ithaca, NY, USA, 2017. [Google Scholar]
  6. Mano, J.; Liu, N.; Hammond, J.H.; Currie, D.H.; Stephanopoulos, G. Engineering Yarrowia lipolytica for the utilization of acid whey. Metab. Eng. 2020, 57, 43–50. [Google Scholar] [CrossRef] [PubMed]
  7. United States Environmental Protection Agency. Food Recovery Hierarchy. Available online: https://www.epa.gov/sustainable-management-food/food-recovery-hierarchy#about (accessed on 7 July 2021).
  8. Rocha-Mendoza, D.; Kosmerl, E.; Krentz, A.; Zhang, L.; Badiger, S.; Miyagusuku-Cruzado, G.; Mayta-Apaza, A.; Giusti, M.; Jiménez-Flores, R.; García-Cano, I. Invited review: Acid whey trends and health benefits. J. Dairy Sci. 2021, 104, 1262–1275. [Google Scholar] [CrossRef] [PubMed]
  9. Skryplonek, K.; Dmytrow, I.; Mituniewicz-Malek, A. Probiotic fermented beverages based on acid whey. J. Dairy Sci. 2019, 102, 7773–7780. [Google Scholar] [CrossRef] [PubMed]
  10. Kovtuna, K.; Martynova, J.; Krēķe, S.I.; Scherbaka, R.; Vigants, A. The sweet and acidic whey as substrates for probiotics biomass production. J. Biotechnol. 2019, 305, S53–S54. [Google Scholar] [CrossRef]
  11. Luo, S.; Demarsh, T.A.; deRiancho, D.; Stelick, A.; Alcaine, S.D. Characterization of the fermentation and sensory profiles of novel yeast-fermented acid whey beverages. Foods 2021, 10, 1204. [Google Scholar] [CrossRef] [PubMed]
  12. Fior Markets. Global Functional Beverages Market Is Expected to Reach USD 216.7 Billion by 2028: Fior Markets. Available online: https://www.globenewswire.com/en/news-release/2021/05/24/2234940/0/en/Global-Functional-Beverages-Market-Is-Expected-to-Reach-USD-216-7-billion-by-2028-Fior-Markets.html (accessed on 13 August 2021).
  13. Conway, J. Market Size of Non-Alcoholic Beer Worldwide from 2016 to 2024; Statista: Paris, France, 2020. [Google Scholar]
  14. Lawton, M.R.; deRiancho, D.L.; Alcaine, S.D. Lactose utilization by Brettanomyces claussenii expands potential for valorization of dairy by-products to functional beverages through fermentation. Curr. Opin. Food Sci. 2021, 42, 93–101. [Google Scholar] [CrossRef]
  15. Steensels, J.; Daenen, L.; Malcorps, P.; Derdelinckx, G.; Verachtert, H.; Verstrepen, K.J. Brettanomyces yeasts—From spoilage organisms to valuable contributors to industrial fermentations. Int. J. Food Microbiol. 2015, 206, 24–38. [Google Scholar] [CrossRef] [Green Version]
  16. Karim, A.; Gerliani, N.; Aïder, M. Kluyveromyces marxianus: An emerging yeast cell factory for applications in food and biotechnology. Int. J. Food Microbiol. 2020, 333, 108818. [Google Scholar] [CrossRef]
  17. Roman, W. Yeasts, 1st ed.; Junk: The Hague, The Netherlands, 1957. [Google Scholar]
  18. Rivera Flores, V.K.; Alcaine, S.D. Cornell University, Ithaca, NY, USA. Unpublished work. 2019. [Google Scholar]
  19. Salaün, F.; Mietton, B.; Gaucheron, F. Buffering capacity of dairy products. Int. Dairy J. 2005, 15, 95–109. [Google Scholar] [CrossRef]
  20. O′Connell, J.E.; Fox, P.F. Effect of beta-lactoglobulin and precipitation of calcium phosphate on the thermal coagulation of milk. J. Dairy Res. 2001, 68, 81–94. [Google Scholar] [CrossRef] [PubMed]
  21. Gonzalez-Chavez, S.A.; Arevalo-Gallegos, S.; Rascon-Cruz, Q. Lactoferrin: Structure, function and applications. Int. J. Antimicrob. Agents 2009, 33, 301.e301–301.e308. [Google Scholar] [CrossRef]
  22. Painting, K.; Kirsop, B. A quick method for estimating the percentage of viable cells in a yeast population, using methylene blue staining. World J. Microbiol. Biotechnol. 1990, 6, 346–347. [Google Scholar] [CrossRef]
  23. Sandhu, D.K.; Waraich, M.K. Conversion of cheese whey to single-cell protein. Biotechnol. Bioeng. 1983, 25, 797–808. [Google Scholar] [CrossRef] [PubMed]
  24. Marcus, J.F.; DeMarsh, T.A.; Alcaine, S.D. Upcycling of whey permeate through yeast- and mold-driven fermentations under anoxic and oxic conditions. Fermentation 2021, 7, 16. [Google Scholar] [CrossRef]
  25. Li, B.; Wang, Z.; Li, S.; Donelan, W.; Wang, X.; Cui, T.; Tang, D. Preparation of lactose-free pasteurized milk with a recombinant thermostable β-glucosidase from Pyrococcus furiosus. BMC Biotechnol. 2013, 13, 73. [Google Scholar] [CrossRef] [PubMed] [Green Version]
  26. Vervoort, Y.; Herrera-Malaver, B.; Mertens, S.; Guadalupe Medina, V.; Duitama, J.; Michiels, L.; Derdelinckx, G.; Voordeckers, K.; Verstrepen, K.J. Characterization of the recombinant Brettanomyces anomalus β-glucosidase and its potential for bioflavouring. J. Appl. Microbiol. 2016, 121, 721–733. [Google Scholar] [CrossRef] [Green Version]
  27. Moktaduzzaman, M.; Galafassi, S.; Capusoni, C.; Vigentini, I.; Ling, Z.; Piškur, J.; Compagno, C. Galactose utilization sheds new light on sugar metabolism in the sequenced strain Dekkera bruxellensis CBS 2499. FEMS Yeast Res. 2015, 15, fou009. [Google Scholar] [CrossRef] [Green Version]
  28. Tiukova, I.A.; Møller-Hansen, I.; Belew, Z.M.; Darbani, B.; Boles, E.; Nour-Eldin, H.H.; Linder, T.; Nielsen, J.; Borodina, I. Identification and characterisation of two high-affinity glucose transporters from the spoilage yeast Brettanomyces bruxellensis. FEMS Microbiol. Lett. 2019, 366, fnz222. [Google Scholar] [CrossRef] [Green Version]
  29. Johnston, M. A model fungal gene regulatory mechanism: The GAL genes of Saccharomyces cerevisiae. Microbiol. Rev. 1987, 51, 458–476. [Google Scholar] [CrossRef]
  30. Sellick, C.A.; Campbell, R.N.; Reece, R.J. Chapter 3 galactose metabolism in yeast—Structure and regulation of the leloir pathway enzymes and the genes encoding them. In International Review of Cell and Molecular Biology; Jeon, K.W., Ed.; International Review of Cell and Molecular Biology; Elsevier: Amsterdam, The Netherlands, 2008; Volume 269, pp. 111–150. [Google Scholar]
  31. Silveira, W.B.; Passos, F.J.V.; Mantovani, H.C.; Passos, F.M.L. Ethanol production from cheese whey permeate by Kluyveromyces marxianus UFV-3: A flux analysis of oxido-reductive metabolism as a function of lactose concentration and oxygen levels. Enzyme Microb. Technol. 2005, 36, 930–936. [Google Scholar] [CrossRef]
  32. Ozmihci, S.; Kargi, F. Ethanol production from cheese whey powder solution in a packed column bioreactor at different hydraulic residence times. Biochem. Eng. J. 2008, 42, 180–185. [Google Scholar] [CrossRef]
  33. Diniz, R.H.S.; Rodrigues, M.Q.R.B.; Fietto, L.G.; Passos, F.M.L.; Silveira, W.B. Optimizing and validating the production of ethanol from cheese whey permeate by Kluyveromyces marxianus UFV-3. Biocatal. Agric. Biotechnol. 2014, 3, 111–117. [Google Scholar] [CrossRef]
  34. Speers, R.A.; Rogers, P.; Smith, B. Non-linear modelling of industrial brewing fermentations. J. Inst. Brew. 2003, 109, 229–235. [Google Scholar] [CrossRef]
  35. Coote, N.; Kirsop, B.H. Factors responsible for the decrease in pH during beer fermentations. J. Inst. Brew. 1976, 82, 149–153. [Google Scholar] [CrossRef]
  36. Cássio, F.; Leão, C.; van Uden, N. Transport of lactate and other short-chain monocarboxylates in the yeast Saccharomyces cerevisiae. Appl. Environ. Microbiol. 1987, 53, 509–513. [Google Scholar] [CrossRef] [PubMed] [Green Version]
  37. Werner-Washburne, M.; Braun, E.; Johnston, G.C.; Singer, R.A. Stationary phase in the yeast Saccharomyces cerevisiae. Microbiol. Rev. 1993, 57, 383–401. [Google Scholar] [CrossRef]
  38. Ariyanti, D.; Hadiyanto, H. Ethanol production from whey by Kluyveromyces marxianus in batch fermentation system: Kinetics parameters estimation. Bull. Chem. React. Eng. Catal. 2013, 7, 179. [Google Scholar] [CrossRef]
  39. Zafar, S.; Owais, M. Ethanol production from crude whey by Kluyveromyces marxianus. Biochem. Eng. J. 2006, 27, 295–298. [Google Scholar] [CrossRef]
  40. Custer, M. Onderzoekingen over Het Gistgeslacht. Ph.D. Thesis, TU Delft, Delft, The Netherlands, 3 May 1940. [Google Scholar]
  41. Fonseca, A.; Spencer-Martins, I.; Van Uden, N. Transport of lactic acid in Kluyveromyces marxianus: Evidence for a monocarboxylate uniport. Yeast 1991, 7, 775–780. [Google Scholar] [CrossRef]
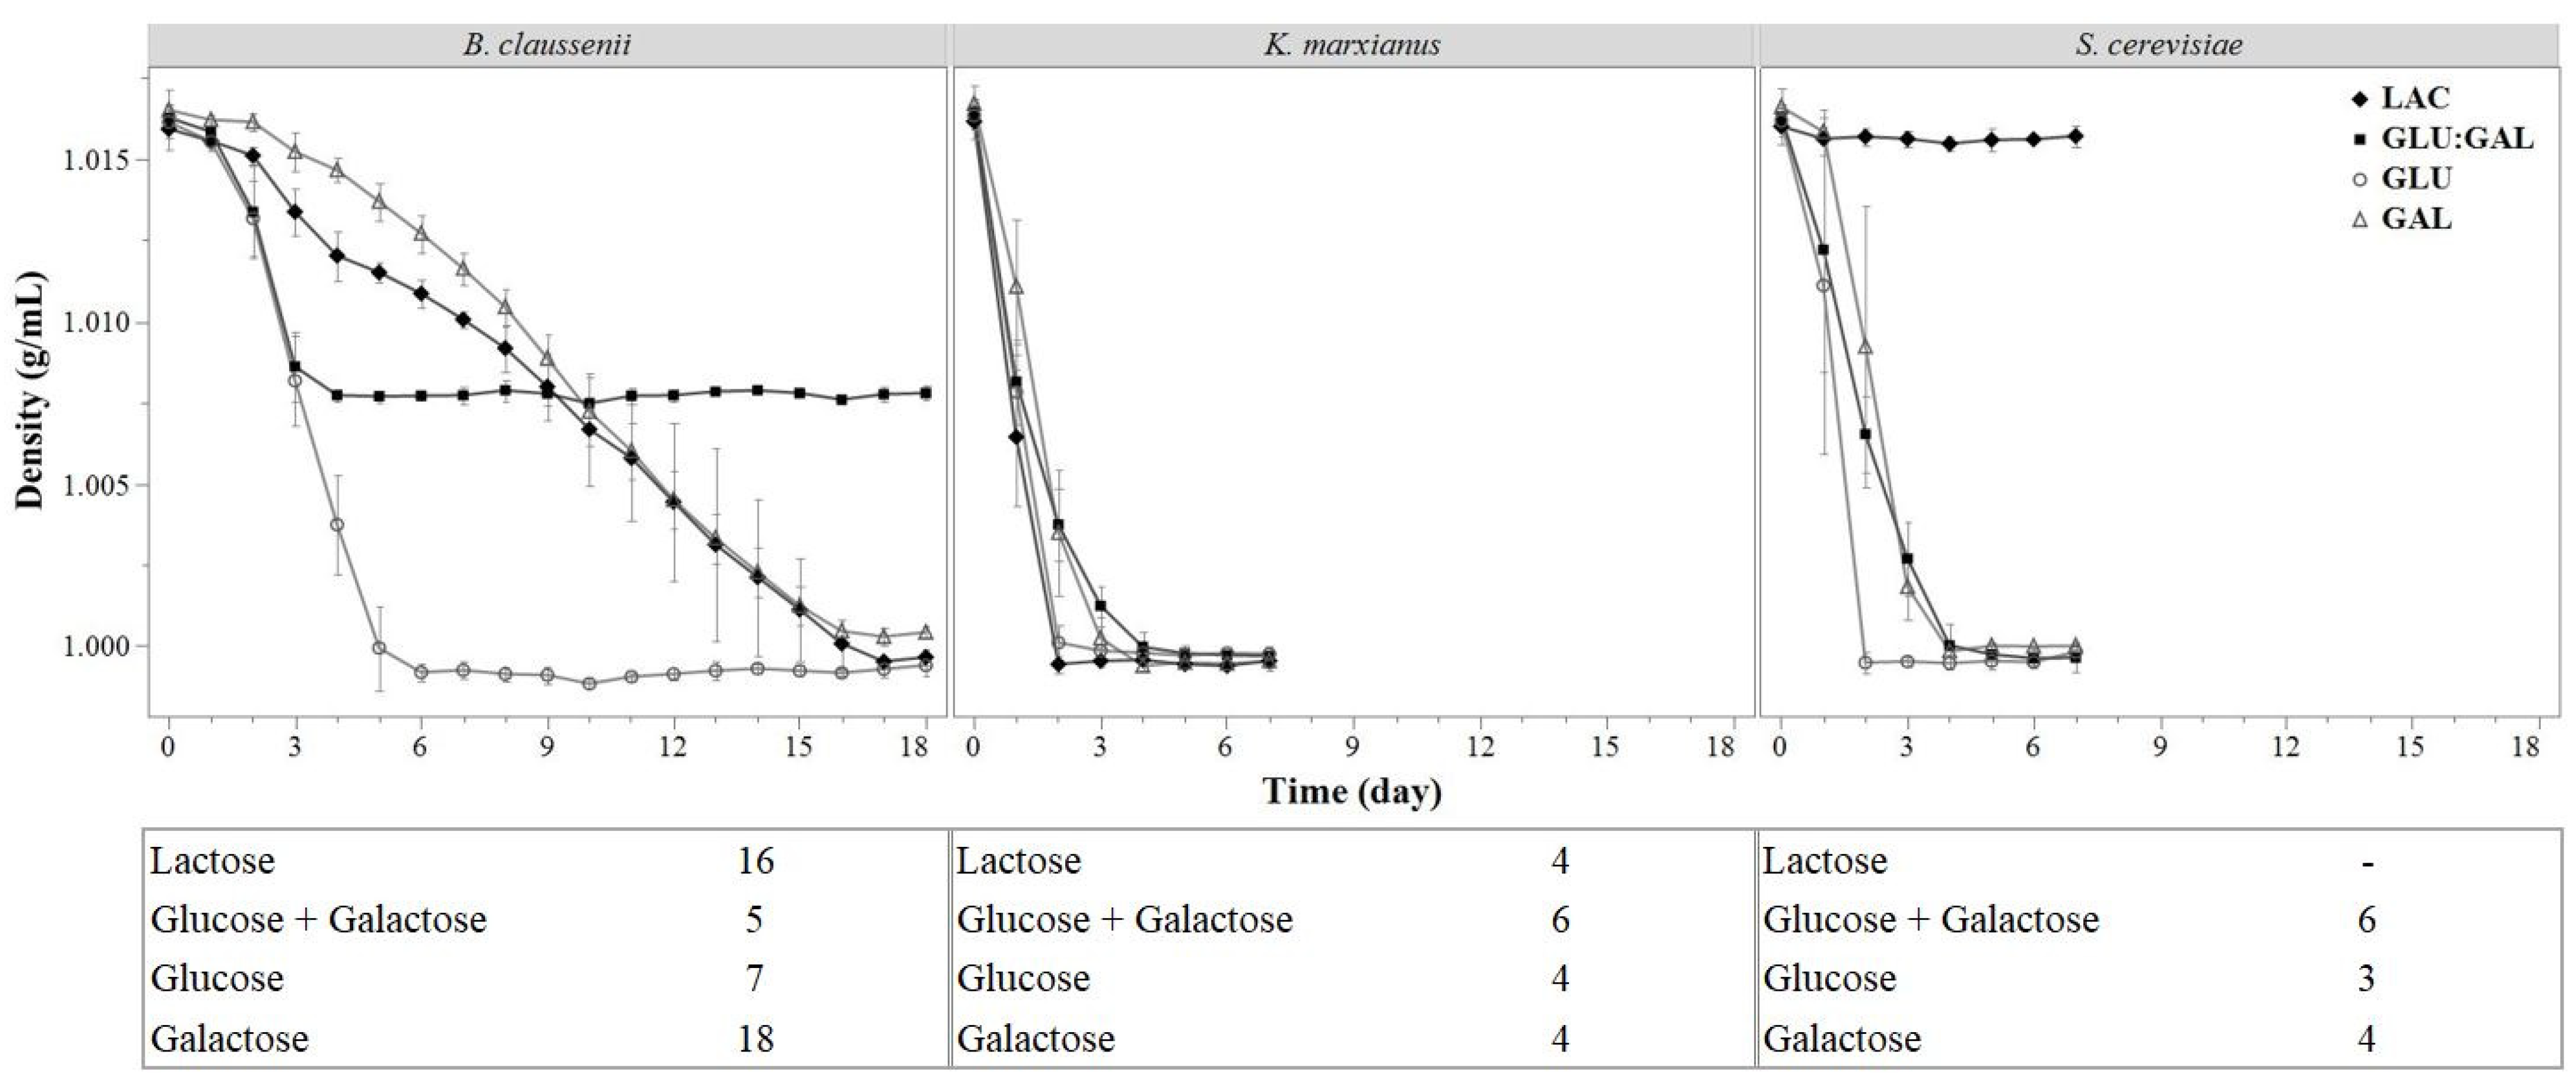
Figure 1. Density profiles for anaerobic fermentations of sugars commonly found in acid whey, incubated at 25 °C. Error bars represent the standard deviation of 3 biological replicates. Supplemented sugars at 40 g/L: lactose (LAC), 1:1 glucose/galactose mixture (GLU:GAL), glucose (GLU), and galactose (GAL). For each species, the box below the graph presents the duration of fermentation (in days) in each substrate. To define the final day of each fermentation, paired t-tests were performed. On the final day of a 3-consecutive-day period for which none of the possible pairs of days displayed a significant difference (p > 0.05), the fermentation in question was considered concluded.
Fermentation 07 00266 g001
Figure 2. pH profiles for anaerobic fermentations of sugars commonly found in acid whey, incubated at 25 °C. Error bars represent the standard deviation of 3 biological replicates. Supplemented sugars at 40 g/L: lactose (LAC), 1:1 glucose/galactose mixture (GLU:GAL), glucose (GLU), and galactose (GAL).
Fermentation 07 00266 g002
Figure 3. Yeast cell concentration profiles for anaerobic fermentations of sugars commonly found in acid whey, incubated at 25 °C. Top: lactose (LAC); 1:1 glucose/galactose mixture (GLU:GAL). Bottom: glucose (GLU); galactose (GAL). Dotted lines represent targeted cell concentration at time of inoculation. Error bars represent the standard deviation of 3 biological replicates.
Fermentation 07 00266 g003
Table 1. Concentrations of sugars at the beginning and at the end of the fermentation of sugars commonly found in acid whey, incubated at 25 °C. Displayed data represent the mean and standard deviation of 3 biological replicates.
Supplemented Medium
Lactose *Glucose + GalactoseGlucoseGalactose
SpeciesTimepointLactose (g/L)Glucose (g/L)Galactose (g/L)Glucose (g/L)Galactose (g/L)
B. clausseniiDay 032.86 ± 1.9519.07 ± 0.1518.84 ± 0.4937.12 ± 0.5135.03 ± 0.34
Day 18NDND15.28 ± 0.56ND0.01 ± 0.02
K. marxianusDay 033.17 ± 1.5518.95 ± 0.1218.39 ± 0.2938 ± 1.0534.95 ± 0.49
Day 7NDNDNDNDND
S. cerevisiaeDay 032.87 ± 2.0518.64 ± 0.1718.45 ± 0.3237.42 ± 0.1235.58 ± 0.63
Day 734.16 ± 0.61NDNDNDND
* Glucose and galactose that could potentially result from this treatment were not detected in any sample; ND: Non-detectable. Limits of detection, in g/L: lactose 0.003, glucose 0.004, and galactose 0.005.
Table 2. Concentration of ethanol [% v/v] at the end of the fermentation of sugars commonly found in acid whey, incubated at 25 °C. Displayed data represent the mean and standard deviation of 3 biological replicates. Within each row, different superscripts indicate instances in which the fermentation of the four different media by the same species resulted in fermentates with significantly different (p < 0.05) ethanol concentrations.
SpeciesTimepointSupplemented Medium
LactoseGlucose + GalactoseGlucoseGalactose
B. clausseniiDay 181.78 ± 0.07 a0.77 ± 0.10 b1.86 ± 0.09 a1.66 ± 0.10 a
K. marxianusDay 72.05 ± 0.03 a,b1.99 ± 0.01 b1.99 ± 0.03 b2.11 ± 0.04 a
S. cerevisiaeDay 7ND2.00 ± 0.09 a2.02 ± 0.06 a1.94 ± 0.03 a
ND: Non-detectable. Limit of detection: 0.009% v/v.
Table 3. Concentrations of organic acids (lactic acid and acetic acid) at the beginning and at the end of the fermentation of sugars commonly found in acid whey, incubated at 25 °C. Displayed data represent the mean and standard deviation of 3 biological replicates. Within each row, different superscripts indicate instances in which the fermentation of the four different media by the same species resulted in fermentates with significantly different (p < 0.05) organic acid concentrations.
SpeciesTimepointLactoseGlucose + GalactoseGlucoseGalactose
Lactic Acid (g/L)
B. clausseniiDay 00.101 ± 0.0020.102 ± 0.0080.104 ± 0.0040.104 ± 0.003
Day 18NDNDNDND
K. marxianusDay 00.1 ± 0.0040.102 ± 0.0060.116 ± 0.0160.102 ± 0.007
Day 7ND0.048 ± 0.041NDND
S. cerevisiaeDay 00.101 ± 0.0020.104 ± 0.0030.104 ± 0.0020.105 ± 0.001
Day 7ND0.099 ± 0.011 a,b0.132 ± 0.018 a0.096 ± 0.014 b
Acetic Acid (g/L)
B. clausseniiDay 0NDND0.013 ± 0.023ND
Day 182.728 ± 0.425 a2.305 ± 0.77 a1.66 ± 0.339 a3.096 ± 0.696 a
K. marxianusDay 0NDND0.014 ± 0.024ND
Day 70.184 ± 0.033 a0.326 ± 0.082 a0.311 ± 0.042 a0.299 ± 0.08 a
S. cerevisiaeDay 0NDNDNDND
Day 7ND0.513 ± 0.382 a0.348 ± 0.139 a0.547 ± 0.309 a
ND: Non-detectable. Limit of detection: 0.091 g/L (lactic acid) and 0.001 g/L (acetic acid).
Publisher’s Note: MDPI stays neutral with regard to jurisdictional claims in published maps and institutional affiliations.