Article

Influence of Cultivation pH on Composition, Diversity, and Metabolic Production in an In Vitro Human Intestinal Microbiota

Chair of Food and Bioprocess Engineering, ZIEL-Institute for Food & Health, Technical University of Munich, 85354 Freising, Germany
*
Author to whom correspondence should be addressed.
Fermentation 2021, 7(3), 156; https://doi.org/10.3390/fermentation7030156
Submission received: 21 June 2021 / Revised: 22 July 2021 / Accepted: 13 August 2021 / Published: 17 August 2021
(This article belongs to the Section Microbial Metabolism, Physiology & Genetics)

Abstract

:
Fecal microbiota transplantation, an alternative treatment method for gastrointestinal diseases, has a high recovery rate, but comes with disadvantages, such as high donor requirements and the low storability of stool. A solution to overcome these problems is the cultivation of an in vitro microbiota. However, the influence of cultivation conditions on the pH are yet unknown. In this study, the influence of the cultivation pH (6.0–7.0) on the system’s behavior and characteristics, including cell count, metabolism, and microbial composition, was investigated. With an increasing cultivation pH, an increase in cell count, total amount of SCFAs, acetate, propionate, and the abundance of Bacteroidetes and Verrucomicrobia were observed. For the concentration of butyrate and the abundance of Actinobacteria and Firmicutes, a decrease with increasing pH was determined. For the concentration of isovalerate, the abundance of Proteobacteria and diversity (richness and Shannon effective), no effect of the pH was observed. Health-promoting genera were more abundant at lower pH levels. When cultivating an in vitro microbiota, all investigated pH values created a diverse and stable system. Ultimately, therefore, the choice of pH creates significant differences in the established in vitro microbiota, but no clear recommendations for a special value can be made.

1. Introduction

The human gut hosts a large and complex ecosystem, known as the intestinal microbiota. Due to the high retention time of food and the resulting high level of nutrients, a high abundance of microbial cells (up to 1014 CFU mL−1) and 400–1000 different species can be found in the human colon [1,2]. These microorganisms belong to different phyla: 40% to 50% of gut microorganisms belong to the phylum Firmicutes, while approximately 40% belong to the phylum Bacteroidetes. The minor phylum Actinobacteria make up around 2.5% of the gut microbiota, while the phyla Proteobacteria and Verrucomicrobia make up 0.1–1% and 0.1%, respectively [1,3]. The intestinal microbiota has several functions, including transforming indigestible food components into bioactive compounds. These metabolites include short-chain fatty acids (SCFAs), which provide defense against pathogens, regulate glucose homeostasis, and metabolize lipids [4,5,6]. Alterations or decreases in variety, diversity, and composition of the intestinal microbiota (dysbalance) can cause various diseases [7]. These diseases are often associated with the gastric system, such as inflammatory bowel [8], Chron’s [9], and celiac disease [10], but altered microbiota are also observed in patients with obesity and type 2 diabetes [11,12,13]. Furthermore, neurological diseases, such as Parkinson’s disease and cancer, were also reported to be associated with changes in the intestinal microbiota [14,15,16]. A decrease in the microbial diversity and cell count is also linked to Clostridium difficile infections [17]. These infections are traditionally treated with antibiotics, such as vancomycin or metronidazole [18], but the occurrence of relapses and multi-resistant strains are a threat. Fecal microbiota transplantation (FMT) offers an alternative treatment method to antibiotics, with recovery rates up to 90% [19,20]. In FMT, purified stool from a healthy donor is transferred into the patient’s gut via colonoscopy, nasogastric tube, or enema. In advance, the donor must undergo extensive screening, must be healthy, and must not have taken any antibiotics before FMT [21]. The extensive screening protocol, as well as safety concerns, acceptability, and the lack of a standardized treatment procedure, are the main constraints of the FMT method.
By mimicking gut conditions in vitro, the production of a controlled and stable artificial colonic microbiota would be possible and could replace traditional FMT. In vitro models have already been applied successfully to reveal the mechanistic effects of probiotics, drug absorption and transport [22,23,24,25]. These models offer advantages including easy set-up and operation, and possibilities for variation and adaption of the system and further the lack of ethical considerations. Compared to multi-component systems [26,27], single component systems are easier to set up and handle, and have been studied and applied in previous reports [28,29,30,31,32,33,34,35]. To provide conditions to mimic those in vivo, the cultivation systems are supplied with CO2, N2, or forming gas, and the temperature is set to +37 °C. To simulate the passage of food, nutrients are supplied in a continuous flow cultivation with a mean retention times of 24 h in the form of a complex growth medium [28,30,32,36]. These conditions reflect the mean retention time in the human colon [37]. In a previous study, the establishment of a simplified system as well as the influence of different donor stool characteristics were investigated [38]. For gas supply conditions and cultivation temperature, all existing systems suggest similar parameters. Within the accessible range of physiological pH conditions, huge differences can be observed when it comes to the cultivation pH value between existing cultivation systems, where the applied pH varies from 5.5 [30] or 5.7 [29] up to 7.0 [28]. Therefore, a comparison of the results from these studies is hardly possible. The cultivation pH is known to have a major impact on the composition of the microbiota as well as single-cell cultivations [31,39]. The optimal pH values for the growth of Bifidobacteria [39] and Bacteroides [40] have been investigated previously. Nevertheless, results regarding pH for single-cell cultures cannot be transferred to multi-strain cultivations of the whole microbiota. However, its influence on the system’s behavior is great, as the abundance of microbial cells, as well as cell count and production of metabolites are dependent on the cultivation pH. With setting the pH value to different physiological values, different systems may be established. This study was conducted to investigate the composition, diversity, and variety of microbes of an in vitro microbiota dependent on the set cultivation pH value. For the success of FMT, the transfer of a high amount of SCFAs is also required [41]. The aim was to find a cultivation pH where a high number of overall as well as health-promoting microorganisms are abundant, and to establish a microbial composition considered healthy with a high amount of metabolites. For a successful FMT therapy stool after defecation, representing the region of the last part of the intestine is used. Consequently, for this study as a range of pH, the physiological value of the distal colon is investigated [42,43]. This study was conducted to identify a pH value in the physiological range of 6.0 to 7.0, which can be preferentially used for the cultivation of an artificial colonic microbiota for FMT.

2. Materials and Methods

2.1. Donor Stool

For this study, stools from three different donors (one defecation per donor) were used. The donors were chosen according to the criteria, as described previously [21]. To prevent the transfer of disease, the donor stool was tested for bacterial, viral, and eucaryotic pathogens that are relevant for in vitro cultivation by the Institute for Medical Microbiology and Hygiene, University of Regensburg. The stool was obtained in-house and stored immediately at −80 °C until use.
All donors were in the same age group, ethnic group (Caucasian), and social environment; they all ate a Western diet and had a normal body mass index (BMI). Their last antibiotic treatment was at least 12 months ago. Before performing the experiments, the stool was characterized (Table 1).

2.2. In Vitro Cultivation System

Continuous flow fermentation medium (CFF) was used for the preparation of the inoculum as well as in the cultivation system itself. The composition and production of CFF medium were already described in previous studies [38]. After preparation, the final medium was stored at + 4 °C and used within 72 h for either preparation of the inoculum or the medium for the cultivation system. For the cultivation experiments, a BioStat B bioreactor (Sartorius AG, Göttingen, Germany) was used. To start the cultivation, 120 mL of inoculum was transferred aseptically into a glass vessel which contained 730 mL of anaerobic CFF medium. The cultivation conditions were set to +37 °C with a stirring rate of 200 rpm (Table 2). Anaerobic conditions were provided by sparging the medium with 8 ccm forming gas. After 24 h of processing time, the system became continuous by supplying fresh medium with an inflow of 0.5 mL min−1 and removing the same amount of broth to keep the volume constantly at 850 mL.
Adding fresh CFF medium generated a mean retention time of 28.3 h, comparable to the human colon transit time [37]. During processing, samples were collected by pumping broth anaerobically into prepared sample tubes (Greiner Bio-One, Sigma Aldrich, St. Louis, MO, USA). The broth was either used immediately for further analysis (cell count, SCFAs) or stored at −80 °C (16S rRNA sequencing).

2.3. Analysis of Cell Count

To determine the cell count in the broth, samples were collected and diluted with 0.25-strength Ringer’s solution. To analyze the cell count, the solution was either plated on Wilkins–Chalgren anaerobe agar plates (anaerobic cell count) or plate count agar plates (facultative aerobic cell count). The plates were incubated either aerobically or anaerobically for 48 h at +37 °C. Only plates with 30–300 colonies were included in the analysis. The number of colony-forming units N per mL of sample (CFU mL−1) was calculated according to the following equation:
N   =   c n 1 + ( 0.1   ·   n 2 )
where c is the sum of colonies of the subsequent dilutions; n1 is the number of colonies in the less diluted cell suspensions; and n2 is the number of colonies in the more diluted solution.

2.4. Analysis of Short-Chain Fatty Acids by High Performance Liquid Chromatography

To reveal the metabolic behavior, nutritional sugars (glucose, galactose) as well as metabolic intermediates (succinate and lactate) and the end products were analyzed. The main short-chain fatty acids (SCFAs), acetate, propionate, butyrate, and iso-valeric acid were identified and measured by a high-performance liquid chromatography (HPLC; Agilent Technologies Inc., Santa Clara, CA, USA) system equipped with an Aminex HPXH-87H ion exclusion column (Bio-Rad Laboratories, Hercules, CA, USA) and a G1362A refractive index detector (Agilent Technologies Inc., Santa Clara, CA, USA). Separation was performed with 0.0005 mol L−1 H2SO4 at a flow rate of 0.45 mL min−1 and a 20–100-µL injection volume. After centrifugation (Hermle-Z233 M-2, Hermle Labortechnik GmbH, Wehingen, Germany) at 6000× g at +20 °C for 30 min, the supernatant was filtrated (0.22 µm) and used for measurements. SCFAs were identified and quantified using external standards (Sigma Aldrich, St. Louis, MO, USA) and the software Agilent ChemStation Instrument 1 Offline (Agilent Technologies Inc., Santa Clara, CA, USA).

2.5. Microbiota Profiling with 16S rRNA Sequencing

The microbial community, richness, and diversity were analyzed at several time points during cultivation by sequencing the V3/V4 region of 16S rRNA. High-throughput 16S rRNA gene amplicon sequencing was performed by the Microbiome Core Facility, ZIEL, TU Munich, according to the protocol previously described [44]. The raw data were preprocessed using the IMNGS pipeline [45]. Operative taxonomic units (OTUs) with a relative abundance of less than 0.25% across all samples were removed to prevent the analysis of spurious OTUs [46]. Five nucleotides were trimmed on the 5ʹ and 3ʹ ends for the R1/R2 read, with an expected error rate of 3 (trim score 3). The read length only considered nucleotides between 300 and 600 base pairs. Taxonomy and alpha-diversity were analyzed by running the provided R script, Rhea [47,48]. The alpha-diversity richness, representing the total number of OTUs in the community and the Shannon effective index, which accounts for evenness and abundance of species in the community, were calculated automatically by the software.

2.6. Statistical Analysis

All analyses were repeated at least in triplicate. The mean values are shown as the arithmetic mean x ¯ of the number n of all samples xi. The distribution of the values was calculated from the standard deviation s due to the random error. All graphs show the arithmetic means ± standard deviations. Statistical significance was tested using a one-way ANOVA (p ≤ 0.05) followed by a Tukey post-hoc analysis with the software OriginPro 2019 (OriginLab Corporation, Northampton, MA, USA).

3. Results and Discussion

For the cultivation of the human intestinal microbiota, a stable in vitro system was used [38]. The aim of this study was to reveal the influence of the pH value on the cultivation outcome in the stable system. The pH was adapted to 6.0, 6.5, or 7.0 in three separate cultivations and the behavior of the system was observed. The impact of cultivation pH on cell count, metabolic profile, and SCFAs production as well as microbial community composition, richness, and diversity was examined.

3.1. Influence of Cultivation pH

3.1.1. Standardization of the Stable State

To compare and evaluate the in vitro system, standardized values for the above parameters were required. In this study, the stable system was defined as the point in time when the investigated value did not change by more than 1% per h of processing time. Consequently, these values obtained during the stable state were used for comparison and tested with a one-way ANOVA followed by a Tukey post-hoc test to reveal statistically significant differences.
The establishment of the stable state was detected for cell count as well as acetate, propionate, butyrate, and isovalerate for all three systems. For donor A, the stable system was reached between 31.3 ± 0.0 h (values for butyrate and anaerobic cell count at pH 6.5) and 76.2 ± 0.1 h (values for propionate and aerobic cell count at pH 6.5). For donor B, the stable system was reached after 75.9 ± 1.0 h (pH 6.0), and after 74.1 ± 0.2 h (pH 6.5) for donor C. Consequently, a stable system can be reached for each pH value and system after 77 h the latest. These results are in accordance with former studies, where the system used here was established [38]. When comparing systems, only values in the stable system after 77–120 h of processing time were considered. The influence of the cultivation pH on the stable system was described by the cultivation of stool A. The same experiments were also performed for donors B and C but will not be described in detail since their behavior was comparable.

3.1.2. Cell Count

To analyze the number of colony-forming units, the anaerobic as well as the facultative anaerobic cell counts were determined. After inoculation (<1 h processing time), the anaerobic cell count for system A was between 4 ± 3 × 10⁵ CFU mL−1 (pH 6.0) and 10 ± 6 × 10⁵ CFU mL−1 (pH 6.5). The anaerobic cell count increased in the following processing time until a stable system was formed. As it can be seen in Figure 1, in the stable state, a cell count between 6 ± 3 × 10⁹ CFU mL−1 at cultivation with pH 6.0 and 9 ± 4 × 10⁹ CFU mL−1 at cultivation at pH 7.0 was reached.
The count of aerobic cells was higher at the beginning of cultivation, with values between 3 ± 3 × 10³ CFU mL−1 (pH 6.5) and 4 ± 5 × 10³ CFU mL−1 (pH 6.0), but as the process continued, the aerobic cell count reached lower values compared to the anaerobic cell count. In the stable system, the cell count was between 1 ± 0 × 108 CFU mL−1 (pH 6.0) and 1 ± 1 × 10⁸ CFU mL−1 (pH 6.5). The influence of the cultivation pH on the overall cell count was tested by a one-way ANOVA with a p-value of 0.05. For system A, neither for the anaerobic nor the aerobic CFUs, a significant difference in cell counts was detected. For system B, an increase in anaerobic cells in line with pH value was detected, but the aerobic cell count did not differ with the change in pH. For system C, an increase in both the aerobic and anaerobic cell counts was observed. The cell count tended to increase with the pH value, although this trend was not obvious for all systems. In total, all cell counts determined in the in vitro system were comparable with the donor stools (Table 1) as well as with an average human intestine [49].

3.1.3. Short-Chain Fatty Acid Production and Metabolic Profile

When performing FMT, not only is the transfer of a high number of cells important, but also the transfer of metabolic products is too [41]. We tested the influence of the cultivation pH on the production of short-chain fatty acids via HPLC. In system A, the overall production of SCFAs increased from a concentration of 7.85 ± 0.94 mg mL−1 at pH 6.0 to 8.29 ± 0.55 mg mL−1 at pH 6.5, with a further slight increase to 8.28 ± 0.52 mg mL−1 (pH 7.0). However, these differences were only statistically significant for cultivation pH 6.0. In system B, the overall sum of SCFAs increased with the cultivation pH from 8.16 ± 0.20 mg mL−1 at pH 6.0 to 9.03 ± 0.36 mg mL−1 at pH 7.0. Here, a cultivation at pH 6.0 resulted in a significant lower concentration of SCFAs. System C showed the same results. A cultivation at the pH value of 6.0 had the lowest concentration of SCFAs (7.00 ± 1.15 mg mL−1), which increased to 8.12 ± 0.42 mg mL−1 at a cultivation at pH 7.0.
Regarding the major SCFAs, acetate, propionate, butyrate, and isovalerate, differences in concentration at different pH values were observed.
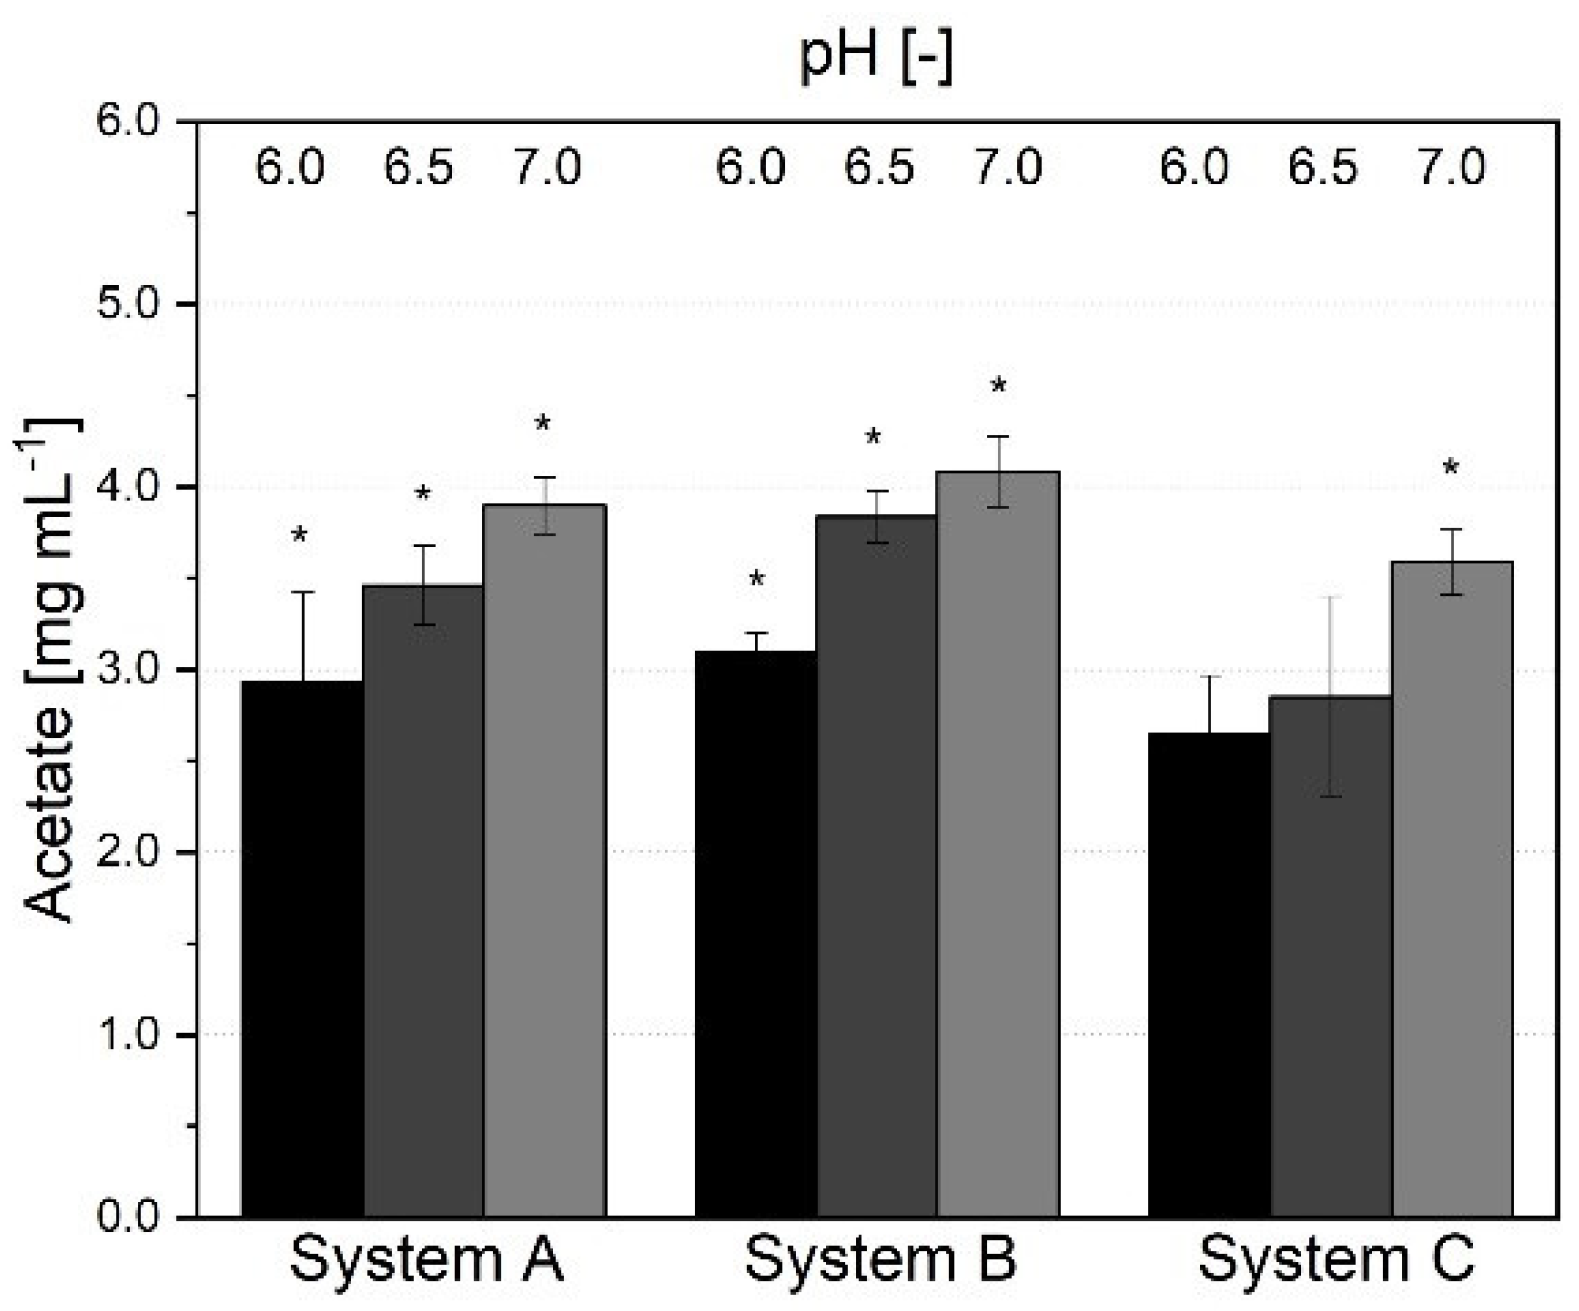
In system A, the concentration of acetate increased along with the pH value: from 2.93 ± 0.49 mg mL−1 (pH 6.0) to 3.90 ± 0.16 mg mL−1 (pH 7.0), and the concentration of acetate was significantly different between all pH values (Figure 2). The acetate concentration in the broth tended to increase with an increasing pH value for all three systems. Nevertheless, the difference was only statistically significant for systems A and B. System C showed an overall decreased concentration, but with the same trend. Nevertheless, only a significant difference of pH 7.0 and the other two values was observed.
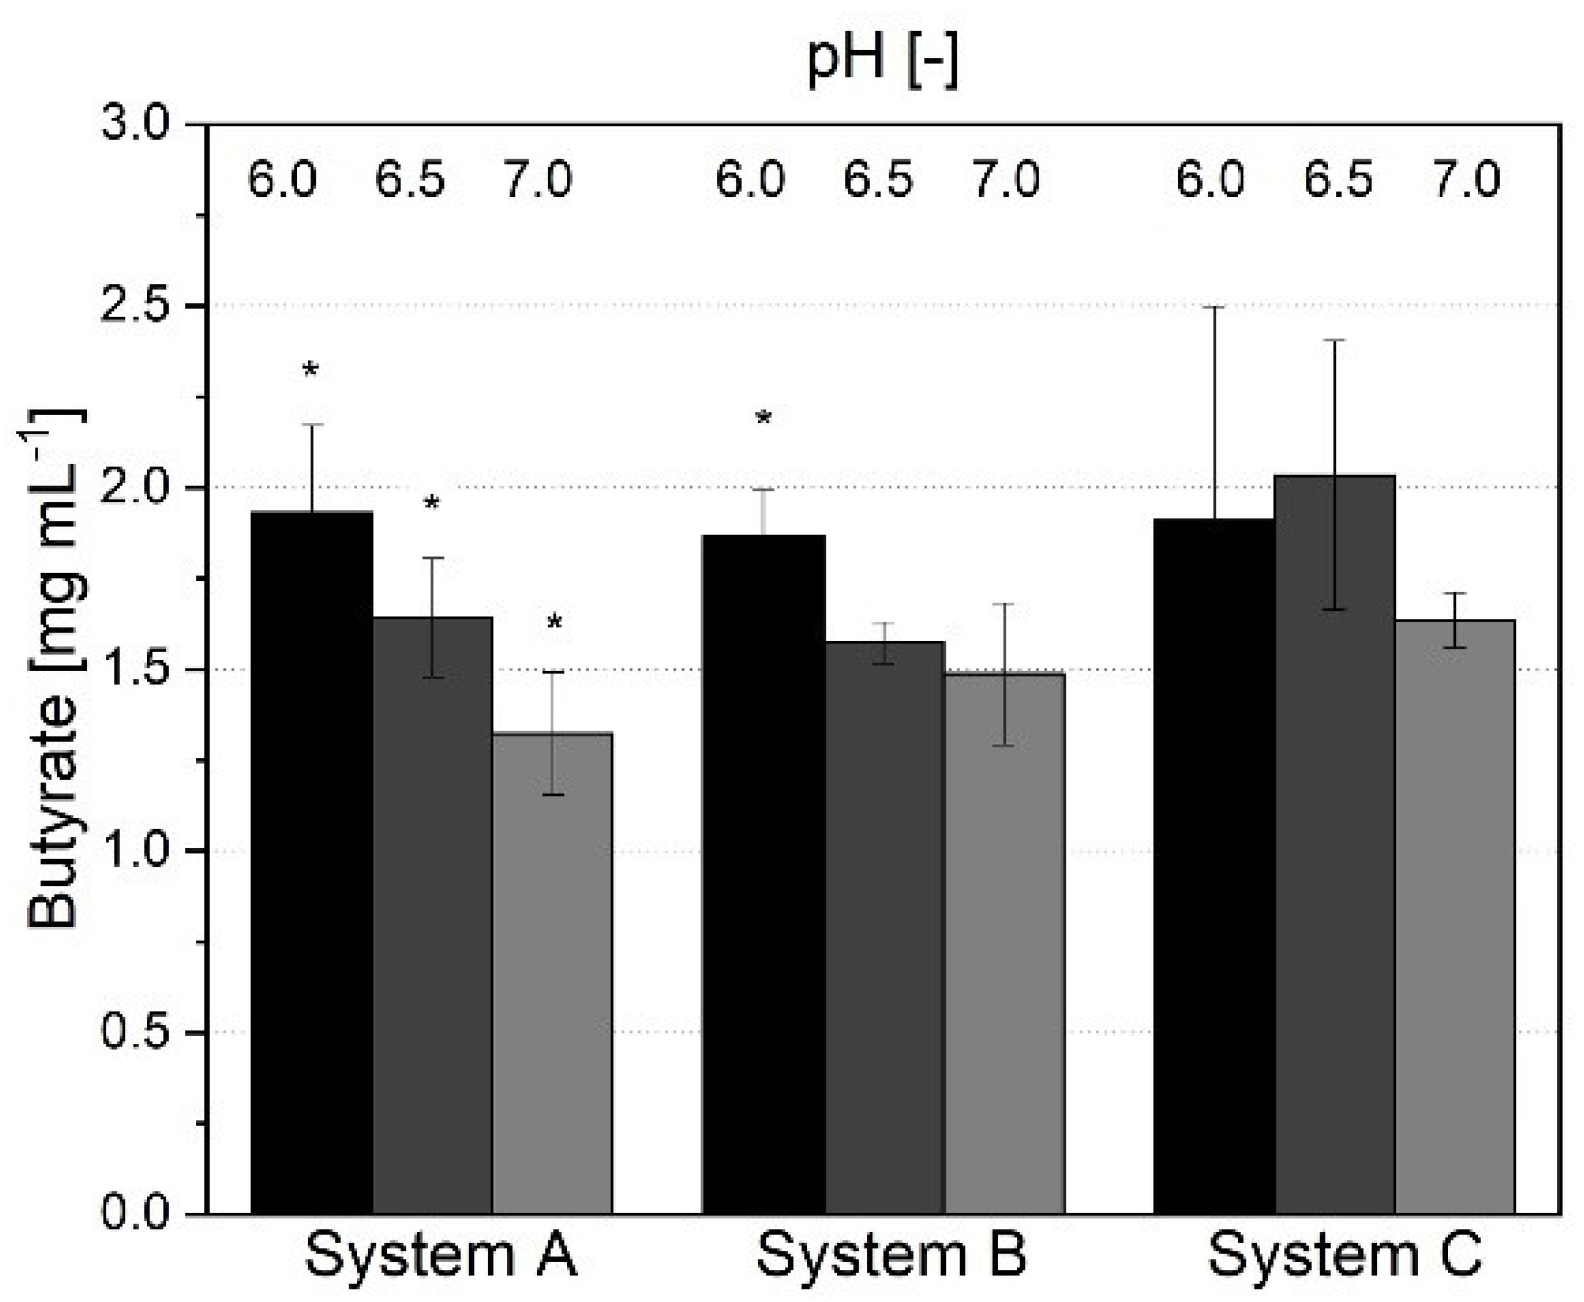
In contrast, the concentration of butyrate, as shown in Figure 3, decreased with an increasing pH value for all three systems. In the pH 6.0 cultivation of system A, a butyrate concentration of 1.93 ± 0.24 mg mL−1 was detected, which decreased to 1.32 ± 0.17 mg mL−1 at pH 7.0. This behavior is probably due to more abundant gram-positive bacteria, which promote the production of butyrate [31]. The difference in concentration was significant for system A, whereas in system B only the concentration in the pH 6.0 cultivation differed from the two other values. System C showed no significant differences, but nevertheless the same trend as systems A and B. The concentration of butyrate in all three systems was between 1.32 ± 0.17 mg mL−1 (system A, pH 7.0) and 1.91 ± 0.59 mg mL−1 (system C, pH 6.0).
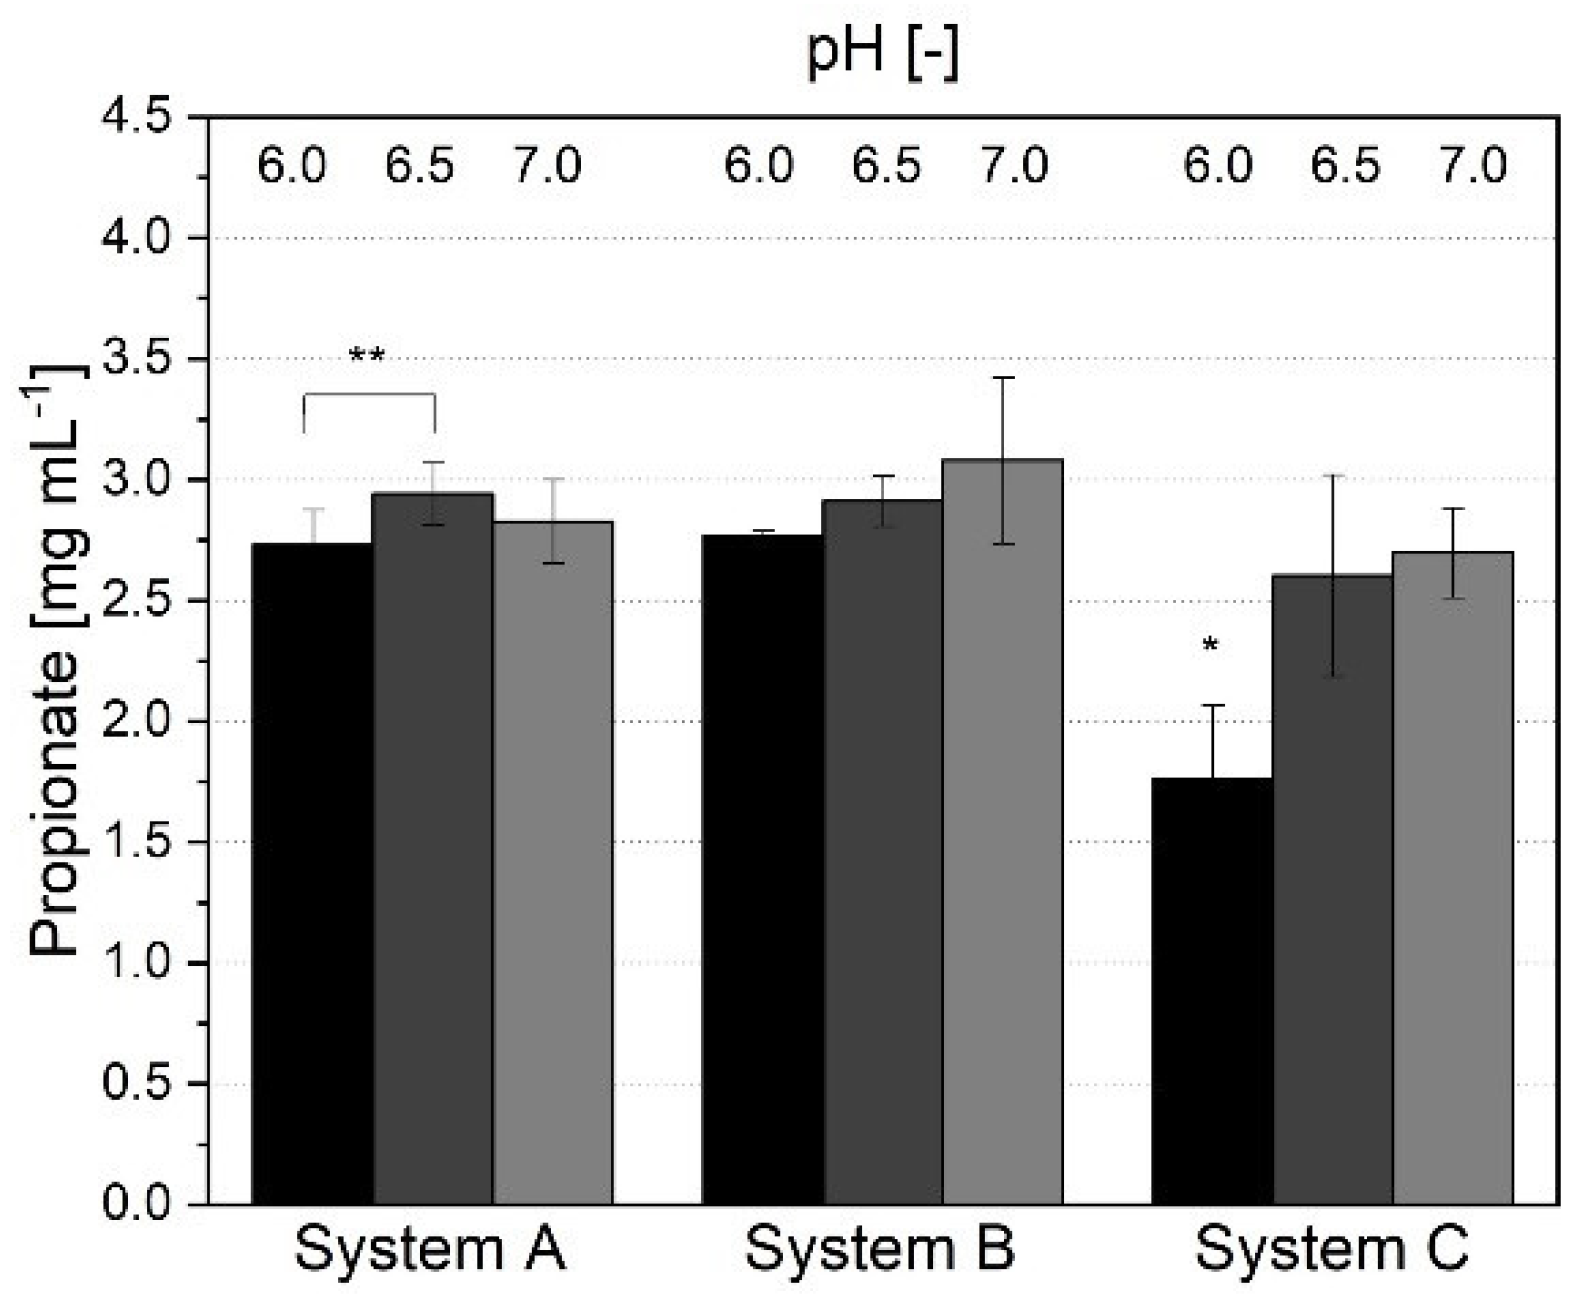
The concentration of propionate is shown in Figure 4. In system A, the concentration of propionate was between 2.73 ± 0.15 mg mL−1 (pH 6.0) and 2.94 ± 0.13 mg mL−1 (pH 6.5). Consequently, only the cultivations at pH 6.0 and 6.5 showed a significant difference tested on a p-value of 0.05. In system B, the concentration ranged from 2.77 ± 0.02 mg mL−1 (pH 6.0) to 3.08 ± 0.34 mg mL−1 (pH 7.0), and therefore showed no difference in the concentration between the three pH values. For system C, only the concentration during cultivation at pH 6.0 was significantly lowered (1.76 ± 0.30 mg mL−1) compared to pH 6.5 (2.60 ± 0.42 mg mL−1) and pH 7.0 (2.70 ± 0.19 mg mL−1).
As Figure 5 shows, the concentration of isovalerate in system A ranged from 0.23 ± 0.02 mg mL−1 at pH 7.0 to 0.26 ± 0.06 mg mL−1 at pH 6.0, with no significant differences found between all tested pH values. The production of isovalerate in system B also showed no significant difference. Nevertheless, higher concentrations were reached (0.43 ± 0.03 mg mL−1 at pH 6.0 to 0.45 ± 0.06 mg mL−1 at pH 7.0). In system C, the concentration was comparable to system A. Here, only the concentration at pH 7.0 was significantly lowered (2.70 ± 0.19 mg mL−1).
The results show that cultivation at different pH values creates different metabolic profiles, and the pH value affects the production of SCFAs. While acetate increases with the cultivation pH value, butyrate decreased. Propionate and isovalerate, in contrast, showed only a slight dependence on the cultivation pH value. Overall, the concentration of acetate and butyrate in each cultivation system, as well as isovalerate in systems A and C, were in the range of a healthy human with normal body weight [50]. The concentration of propionate was increased compared to the concentration detected by Schwiertz et al. [50]. Nevertheless, these results are comparable with former studies [38] as well as other in vitro studies [29]. Bircher et al. detected similar concentrations for acetate and butyrate in their in vitro microbiome.
Next to the absolute concentration, the ratio between acetate, propionate, and butyrate in the intestine is a marker for human health. We found that the ratio in system A was between 3:3:2 (pH 6.0), 4:3:2 (pH 6.5), and 4:3:1 (pH 7.0). In System B, the ratio was found to be 3:3:2 (pH 6.0) and 4:3:1 (pH 6.5 and 7.0), whereas at system C it differed from 4:2:2 (pH 6.0) to 4:3:2 (pH 6.5 and 7.0). Consequently, despite differences in the concentration of the single SCFAs, the overall profile, measured by the ratio, is comparable for all systems and cultivation pH values. Previous researchers have stated that a ratio between 3:1:1 and 10:2:1 is healthy [51,52]. Therefore, each cultivation pH value supports the growth of a healthy in vitro microbiota regarding the acetate–propionate–butyrate ratio as well as the single and overall concentration of metabolic products.

3.1.4. Microbial Composition

In addition to the metabolic profile, the microbial abundance and compositional changes in the systems were investigated.
Clear differences for several single phyla were observed at different pH values in all systems. For Actinobacteria in system A (Figure 6), a decreasing trend in abundance with increasing pH was observed from 0.33 ± 0.09% at pH 6.0 to 0.04 ± 0.04% at pH 7.0.
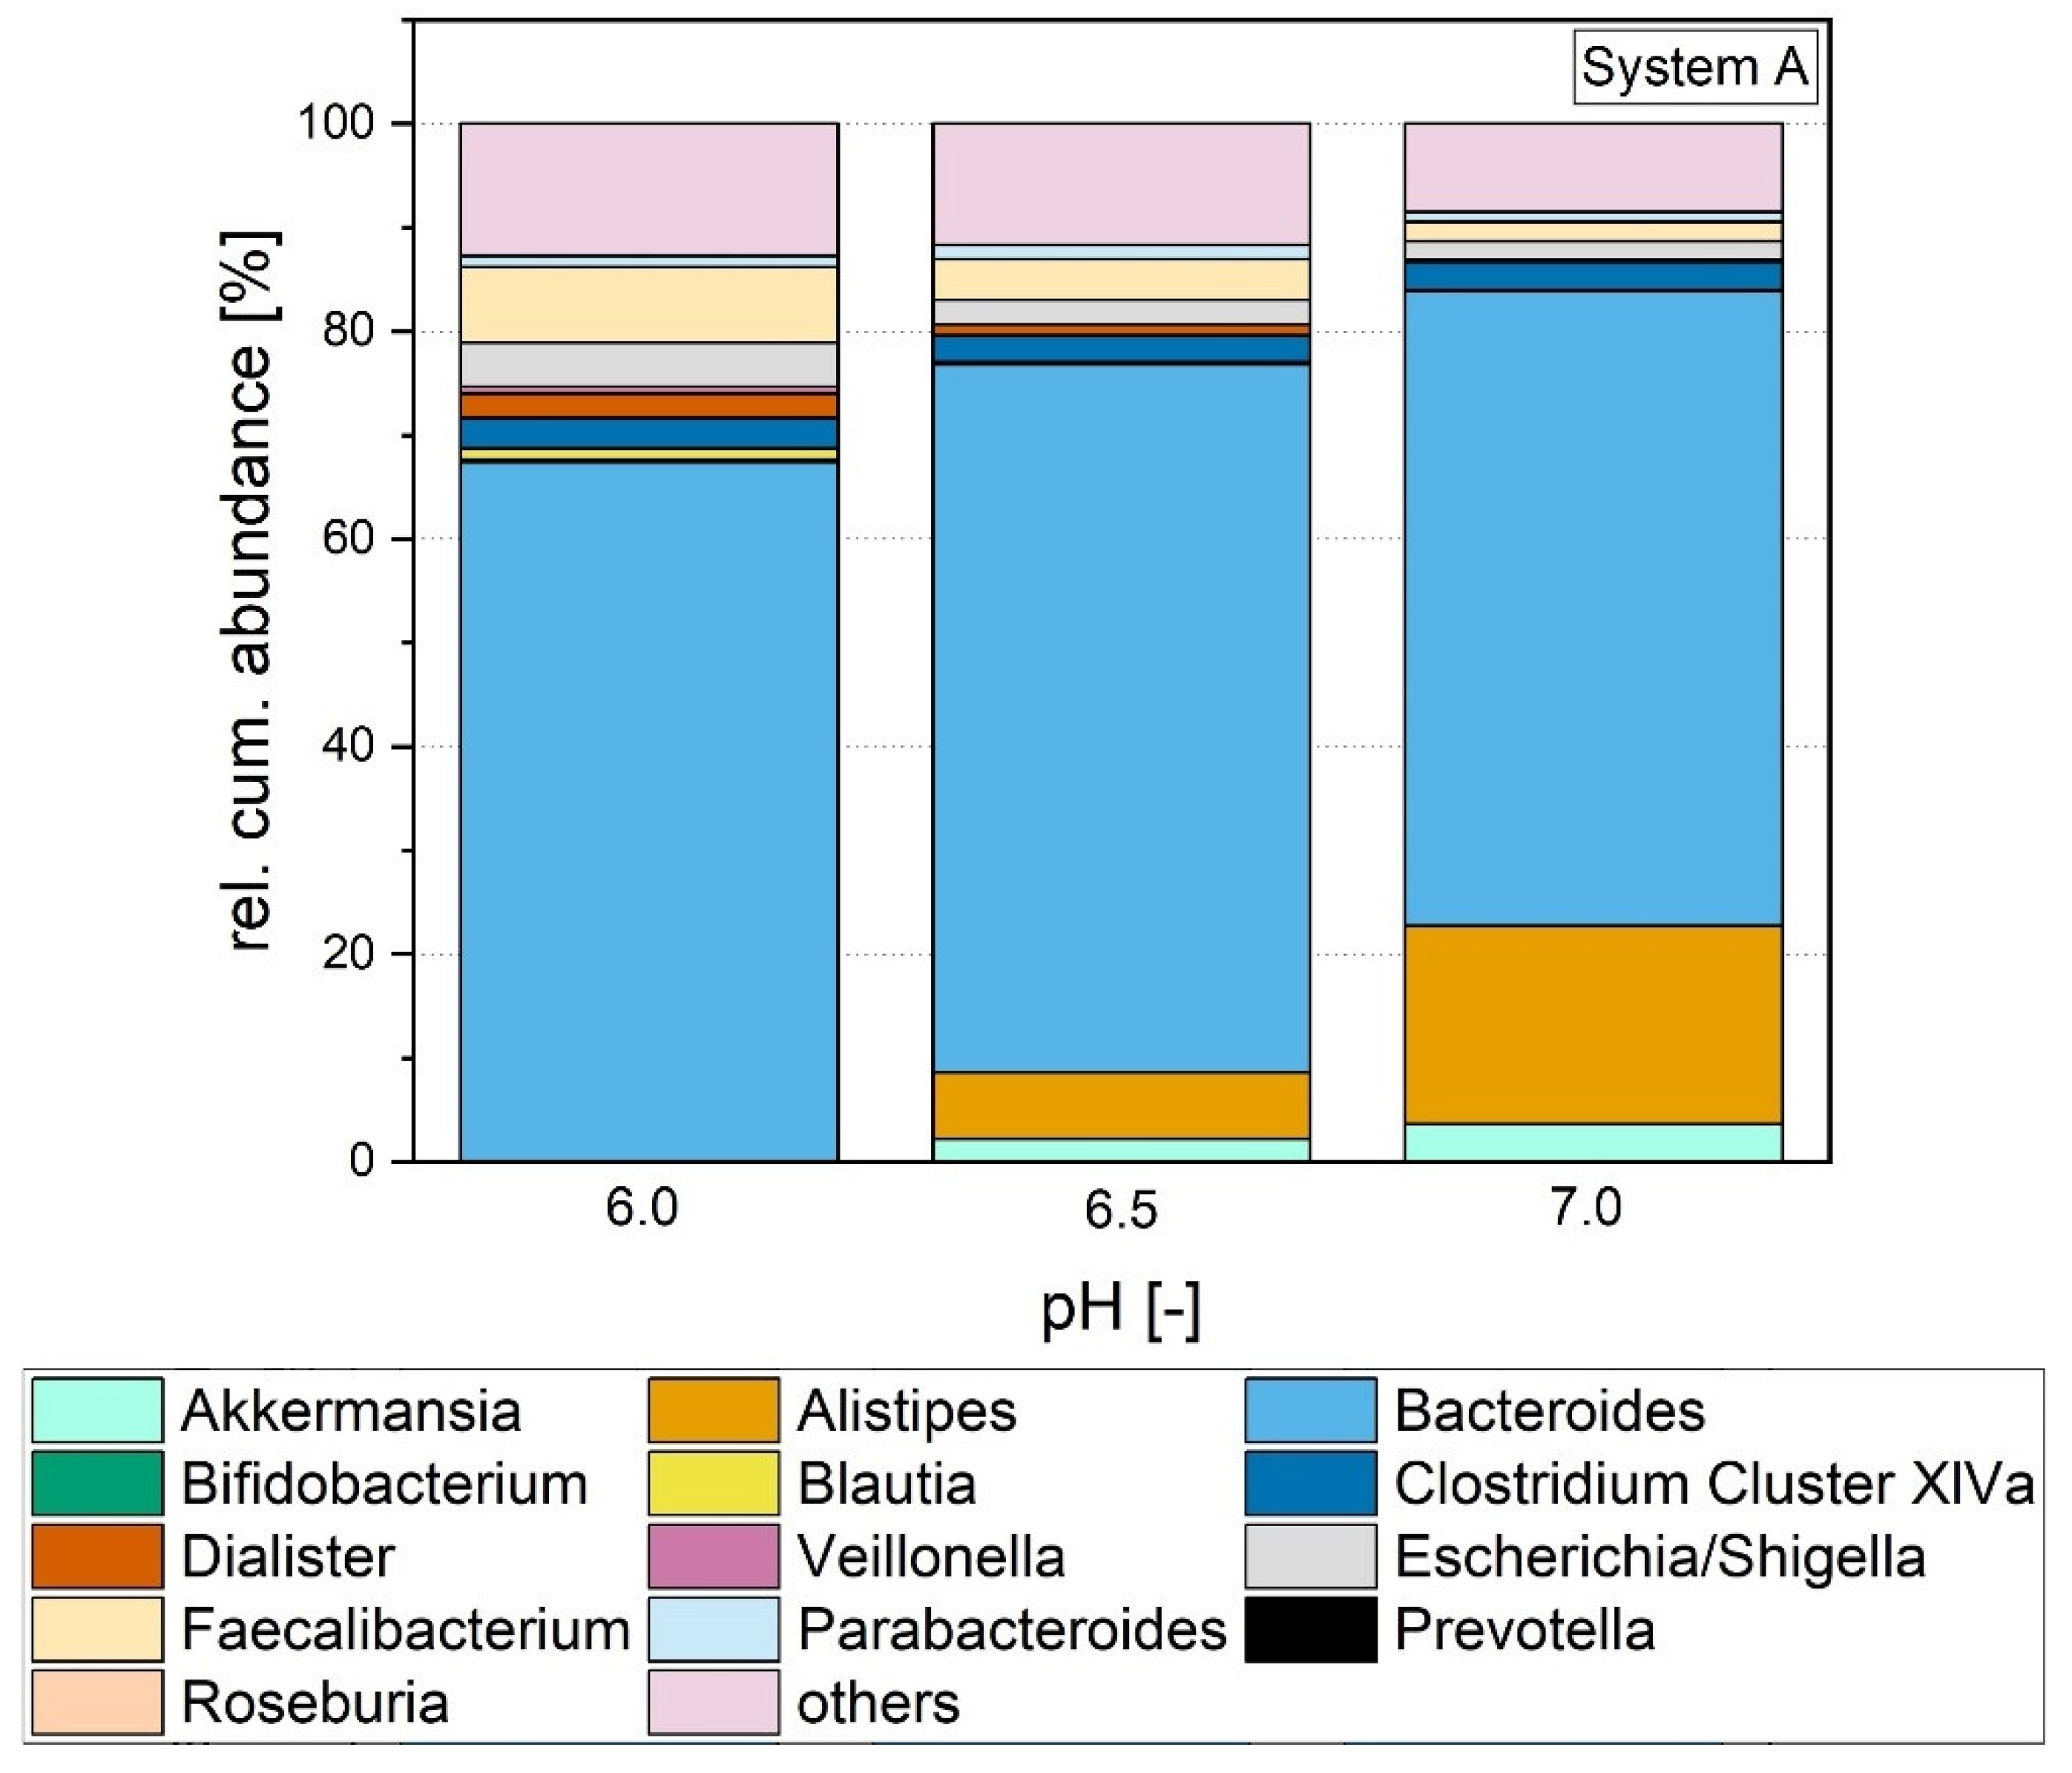
The same trend was observed in systems B and C; however, the differences were not statistically significant. Actinobacteria were mainly represented by the genus Bifidobacterium in all systems. Typical strains, such as Bifidobacterium longum, prefer a lower pH value [39]. One-way ANOVA revealed statistically significant higher abundances of Bifidobacterium at pH 6.0 for system A. Figure 11 shows the rel. cum. abundance of genera in the stable system A dependent on the cultivation pH. For a better readability, only genera discussed in this study are shown; the remaining genera are summed up as “others”. For systems B and C, the same trend in the abundance of Bifidobacterium was observed, but the differences were not statistically significant.
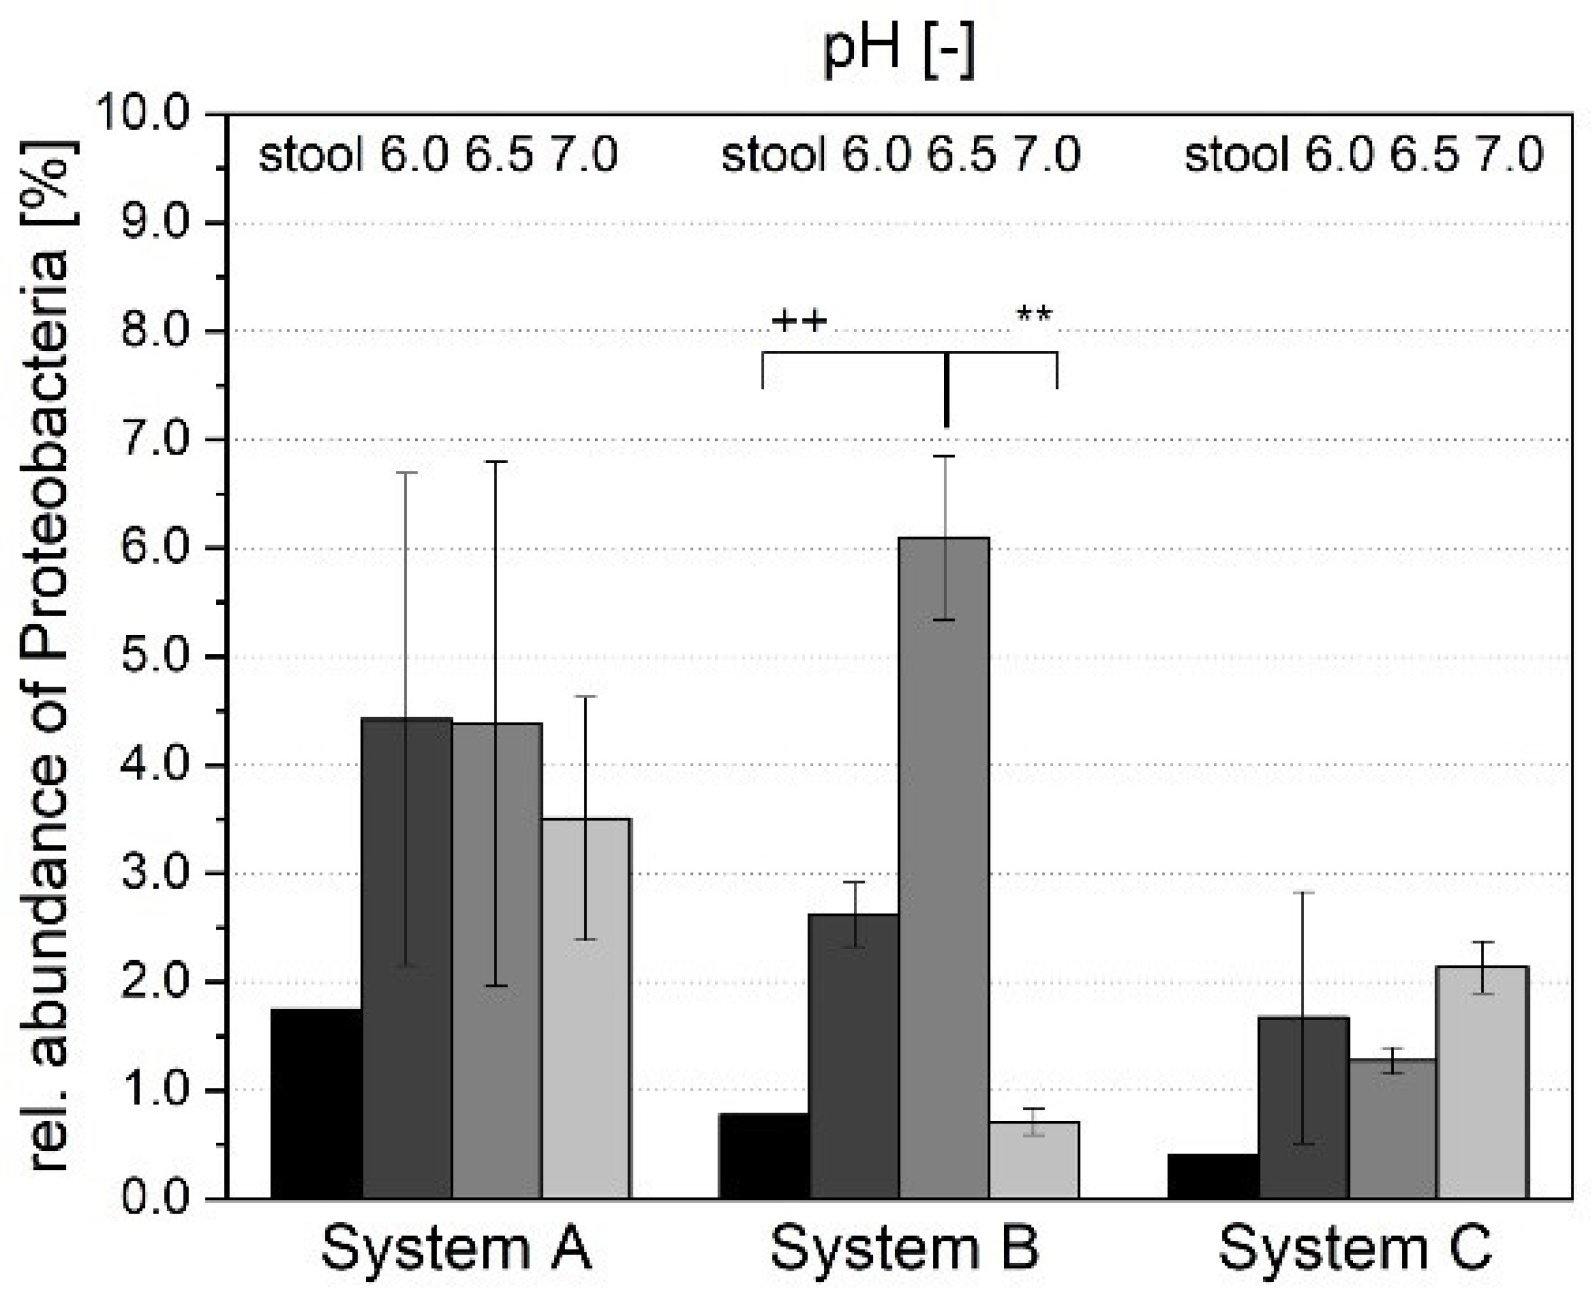
For Proteobacteria, no clear trend of abundance in connection with pH was observed (Figure 7). The abundance of Proteobacteria in system A ranged from 4.38 ± 2.42% at pH 6.5 to 3.51 ± 1.12% at pH 7.0. Systems B and C behaved comparably. In system B, the abundance in the cultivation pH 6.5 was significant higher than in cultivation 7.0. Proteobacterial genera such as Escherichia and Shigella are able to grow at a wide range of pH [53,54]. The Tukey post-hoc test revealed a significant influence on the abundance of Escherichia and Shigella in the low pH range of 6.0–6.5 for system A (Figure 11). For system B, a significant difference between all three pH values was observed, whereas no differences were detected for system C. These differences may have originated from different abundances in the donor stool. In donor stools, Escherichia and Shigella were more abundant in the stools from donors A (0.02%) and B (0.24%) compared to donor C (0.004%). These higher abundances may explain the significant differences in the stable in vitro systems.
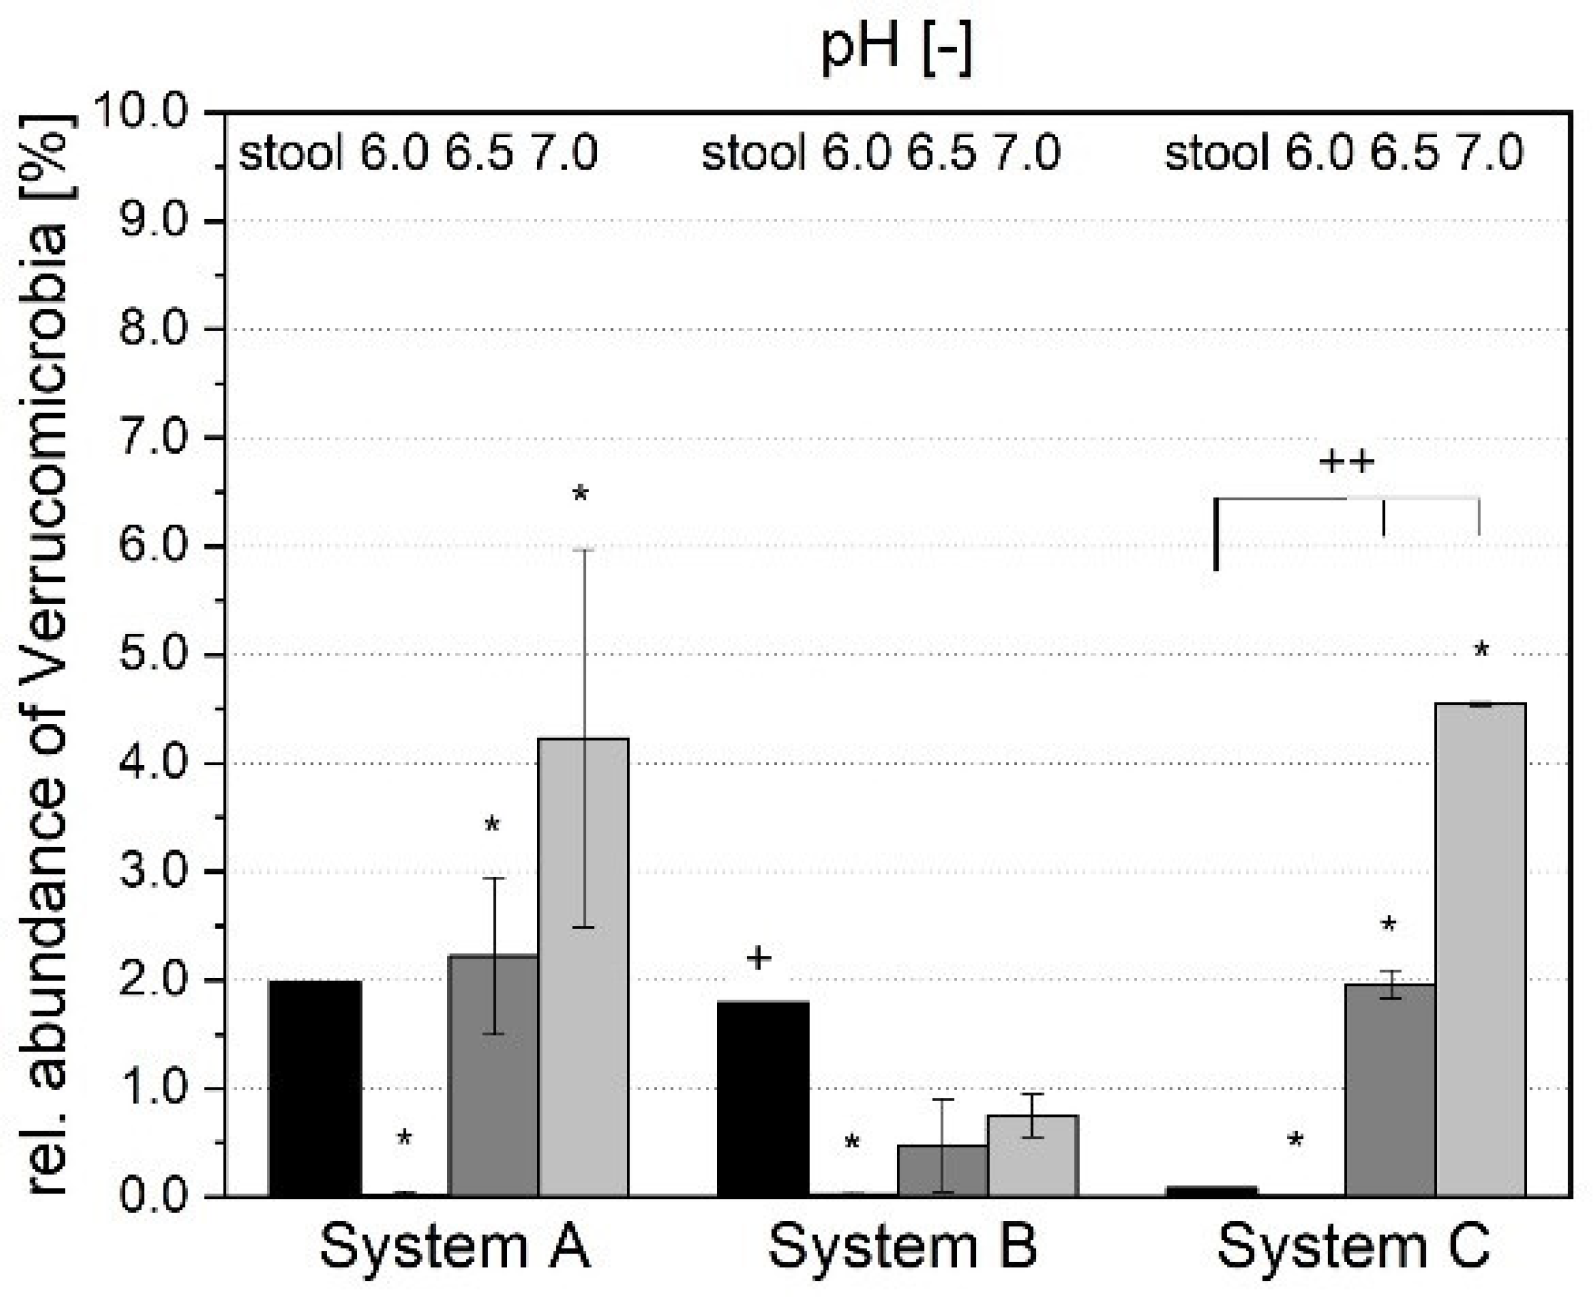
Verrucomicrobia, a minor phylum of the microbiota, increased with a rising pH (Figure 8). In system A, an abundance of 0.02 ± 0.03% at pH 6.0 was detected, which rose to 4.23 ± 1.74% at a pH value of 7.0 (Figure 11). Here, the differences were significant within all three systems, based on a p-value of 0.05. In system B, only a significant lower abundance at pH 6.0 was detected. Verrucomicrobia were represented by the genus Akkermansia, which show pH dependency in all three systems. The abundance of Akkermansia increased with the cultivation pH, which was already proven by other researchers [55]. For system B, the same trend in Akkermansia was observed, but was not statistically significant.
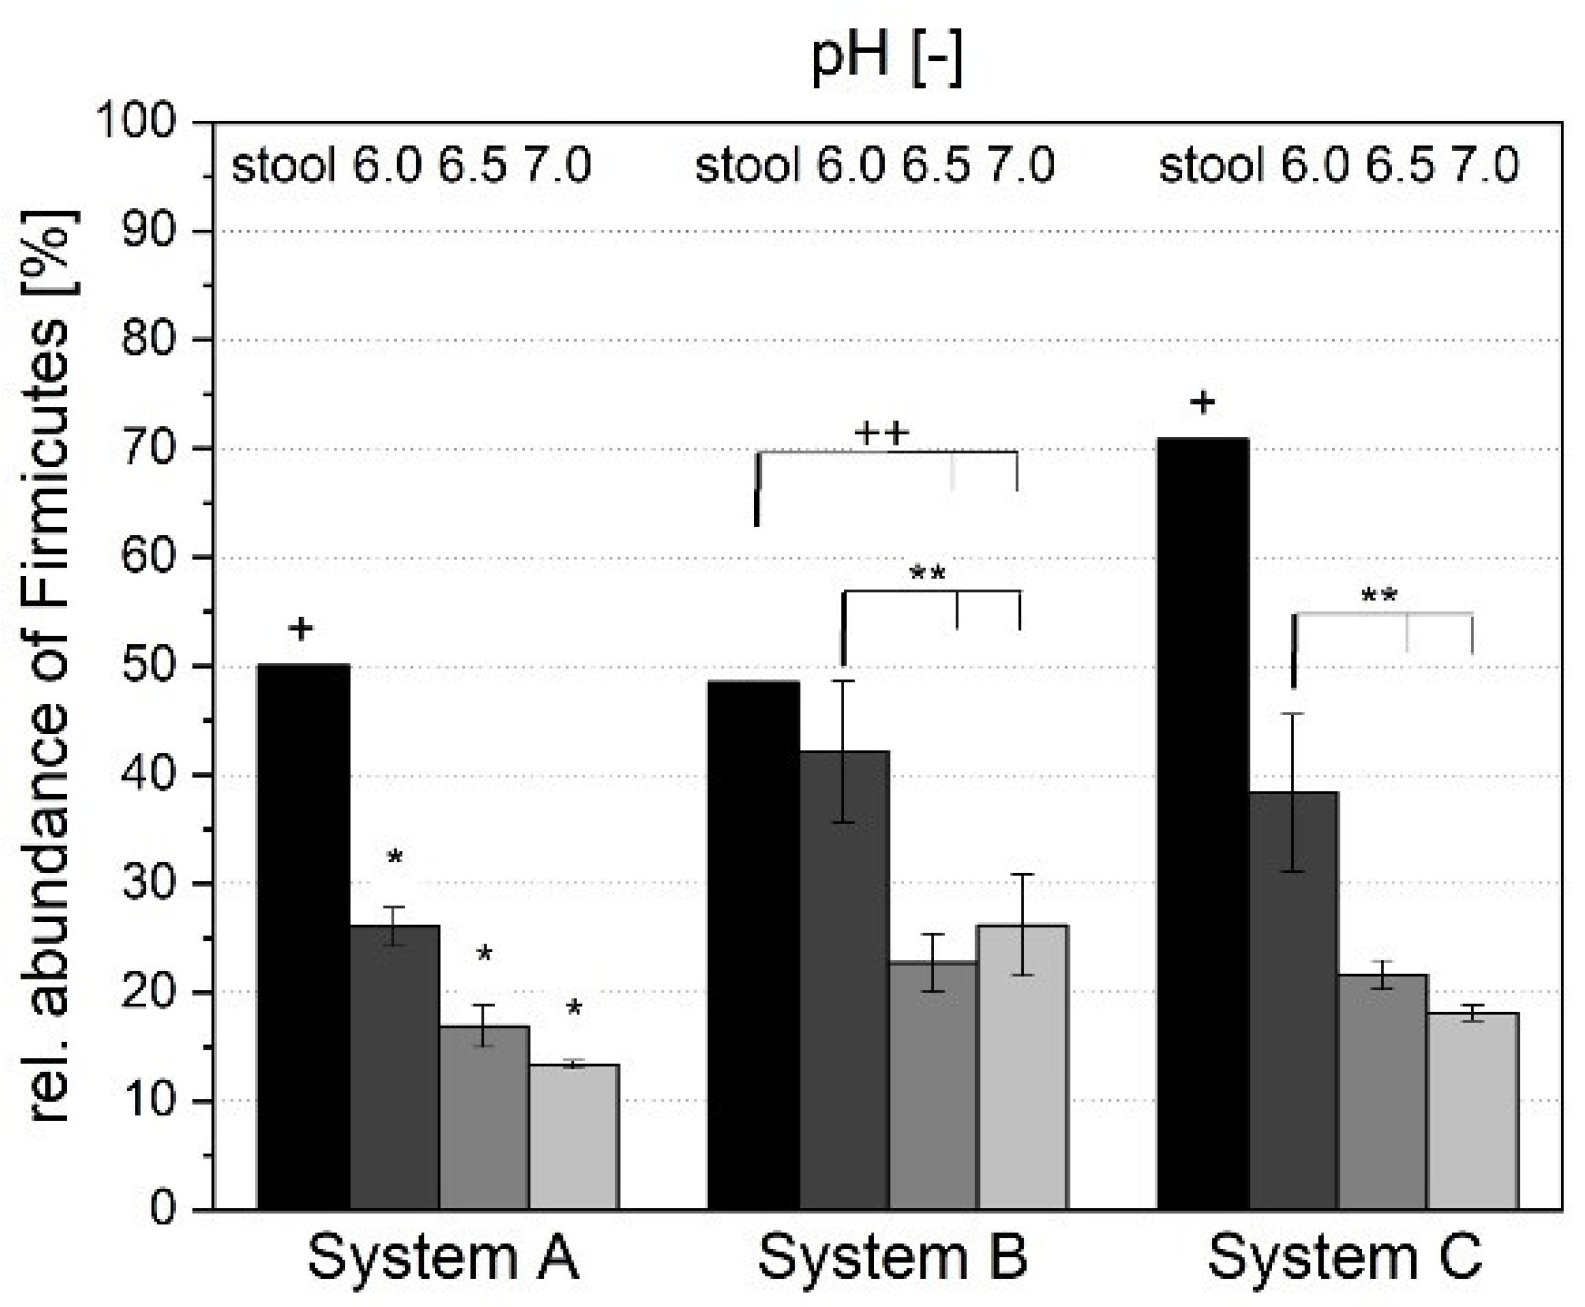
The two major phyla in the in vitro microbiome were Firmicutes and Bacteroidetes. The abundance of Firmicutes decreased with increasing pH in all systems (Figure 9). For system A, at pH 6.0, an abundance of 26.04 ± 1.76% was reached, compared to 16.92 ± 1.96% at pH 6.5 and 13.35 ± 0.36% at pH 7.0. The differences between all pH values in system A were significant based on a p-value of 0.05. In systems B and C, only cultivation at pH 6.0 was significantly different from the others, but followed the overall trend of a decrease. Abundant genera within the phylum Firmicutes were Clostridium Cluster XIVa, Dialister, Faecalibacterium, Roseburia, Blautia, and Veillonella (Figure 11). Clostridium Cluster XIVa and Roseburia showed no pH-dependent abundance for all systems. The abundance of Faecalibacterium decreased with an increasing pH and showed a significant dependence on pH for all three systems. Faecalibacterium is an important marker of gastrointestinal health [56]. This genus prefers a pH range of 5.7–6.7 for growth [57], which is in accordance with this study. Blautia and Veillonella showed similar behavior as Faecalibacterium both genera decreased in abundance with an increasing cultivation pH. This trend was statistically significant for both genera for systems A and B, but not for system C. Nevertheless, system C showed a similar trend in the abundance of Blautia and Veillonella. Representatives of the phylum Firmicutes, such as Roseburia, Clostridium Cluster XIVa, and Faecalibacterium, are the main butyrate-producing bacteria in the human intestinal microbiota [58,59]. In this study, the highest concentration of butyrate was reached at a cultivation pH of 6.0. This relates to the high abundance of Firmicutes at pH 6.0 in all systems.
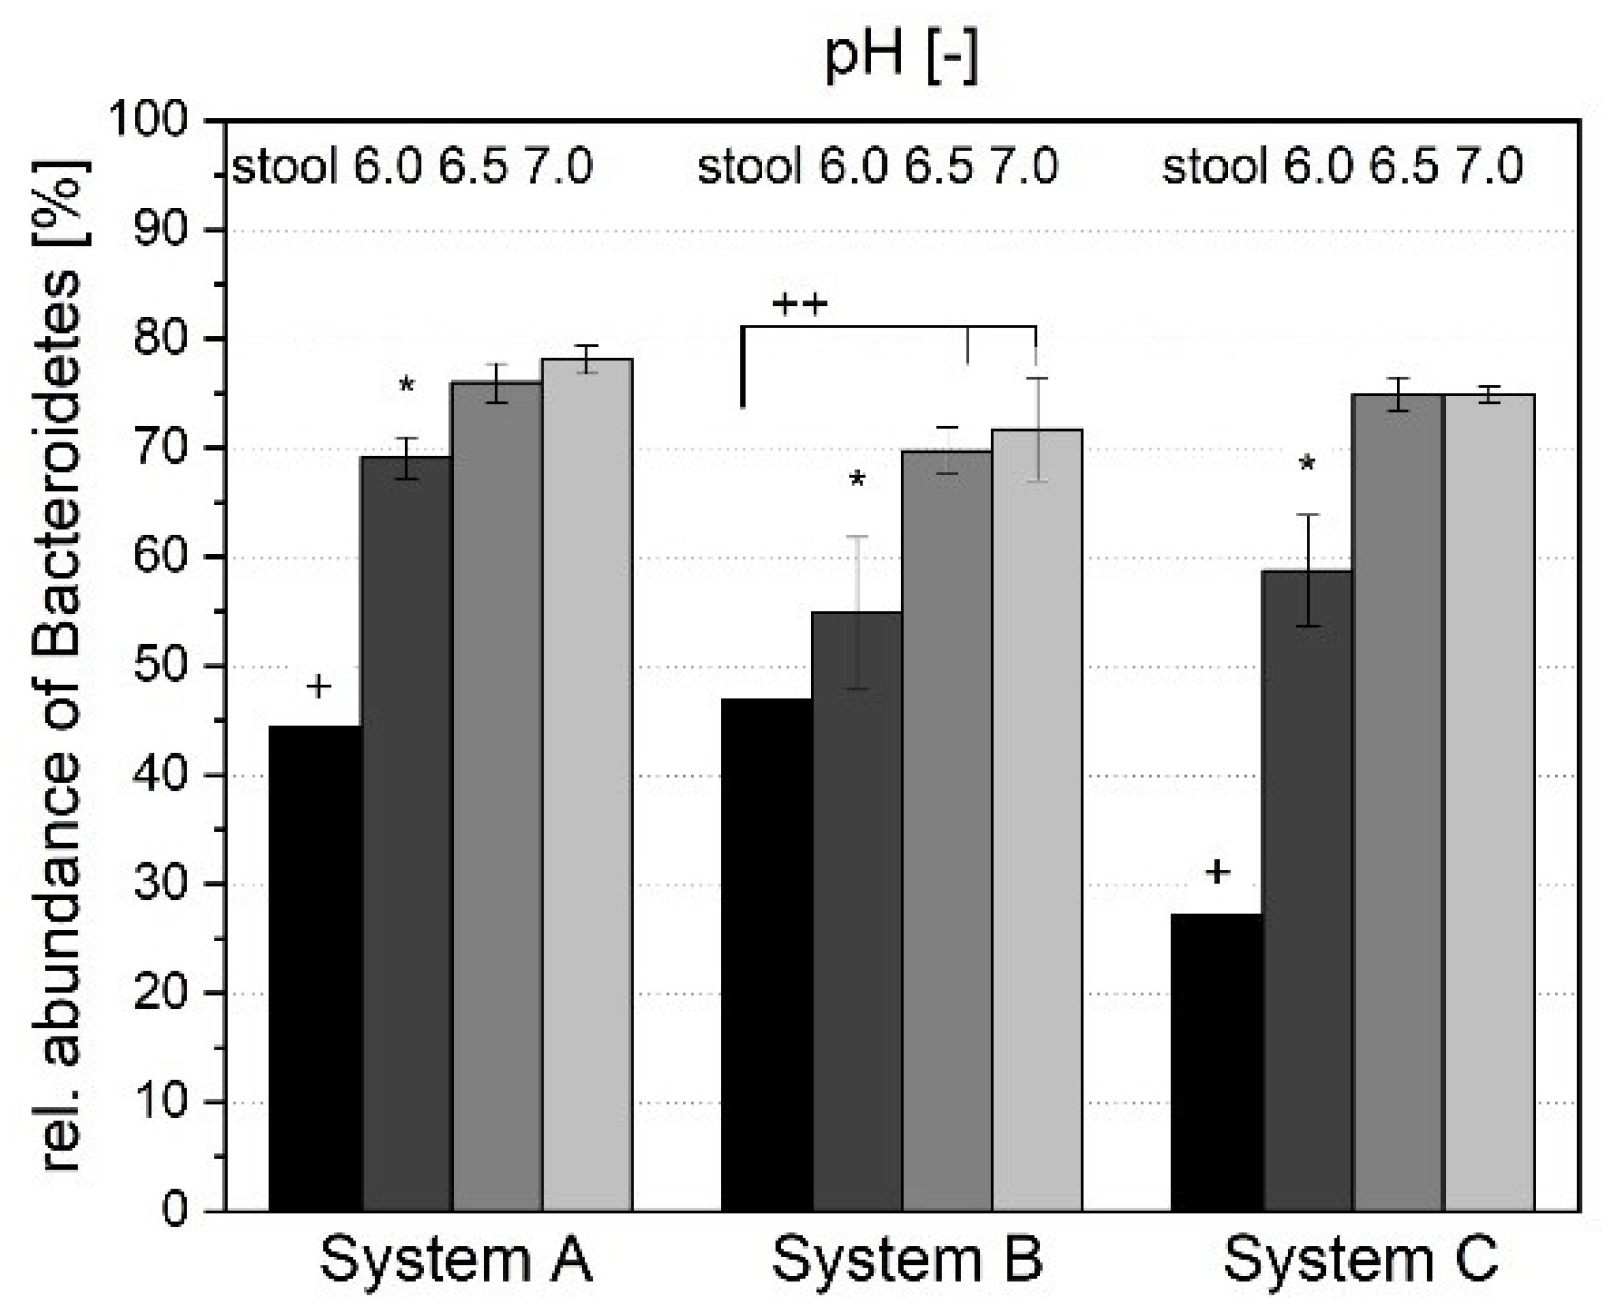
Conversely, the abundance of Bacteroidetes was found to increase with an increasing cultivation pH for all three systems (Figure 10). For system A, the relative abundance at pH 6.0 was 69.08 ± 1.88% and increased to 75.99 ± 1.78% at pH 6.5 and to 78.11 ± 1.28% at pH 7.0. This trend has also been observed by previous researchers [31,60]. In the current study, the influence of cultivation pH on the abundance of Bacteroidetes was found to be significant. Nevertheless, for all three systems, only the abundance at pH 6.0 showed a significant difference by the subsequent Tukey post-hoc test.
The main genera within the phylum Bacteroidetes were found to be Alistipes, Parabacteroides, Bacteroides, and Prevotella (Figure 11). Alistipes and Parabacteroides showed no dependance on pH for all three systems. Conversely, the abundance of Bacteroides was not dependent on pH in system A (61.12 ± 5.62% at pH 7.0; 68.17 ± 5.05% at pH 6.5; 67.35 ± 2.10% at pH 6.0), but was found to be statistically significant between pH values in system B and C. However, in all systems, the abundance of Bacteroides increased with the cultivation pH value.
An outlier occurred for the genus Prevotella. While this genus was not abundant in the stable systems A and B, system C showed high abundances of Prevotella from 1.58 ± 1.34% at pH 7.0 up to 31.28 ± 11.05% at pH 6.0. In system C, the abundance was statistically dependent on the cultivation pH. The abundance of Prevotella itself originated from the donor stool, as this genus was also only abundant in the stool from donor C.
The ratio between Firmicutes and Bacteroidetes is an important measurement for human health. In general, a lower ratio is considered healthy. In a previous study, a ratio of around 0.5 was identified for a healthy control group [61]. All in vitro microbiotas in the current study showed low, i.e., healthy, ratios. The ratio in system A was 0.38 at pH 6.0, 0.22 at pH 6.5, and 0.17 at pH 7.0. The same trend was observed for system B (0.77 at pH 6.0, 0.33 at pH 6.5, 0.32 at pH 7.0) and system C (0.65 at pH 6.0, 0.29 at pH 6.5, 0.24 at pH 7.0). Overall, a significant increase in the ratio at pH 6.0 was detected.
Roseburia, Bifidobacterium, and Faecalibacterium are genera of the intestinal microbiota that are known as health markers [62,63,64,65]. In the in vitro microbiota of system A, the genus Roseburia was present in low abundance (0.00 to 0.14%) and showed no statistical dependence on the pH value during cultivation. In contrast, the abundance of Faecalibacterium decreased significantly with an increasing cultivation pH. As described above, the highest abundance (7.26 ± 0.28%) in system A was reached at a pH value of 6.0. In accordance, the genus Bifidobacterium was most abundant at pH 6.0 (0.21 ± 0.10%).
Duncan et al. [31] investigated the influence of the in vitro cultivation pH on 33 representative human colonic bacteria. At a mildly acid pH value, less Bacteroides grew compared to a neutral pH value. At low pH values, more gram-positive bacteria were detected, which promote the production of butyrate. Nevertheless, gram-positive bacteria had a wildly varying tolerance for pH. For several representatives of Clostridium Cluster XIVa, a reduced growth at lower pH values was observed, whereas Bifidobacterium grew well at low values. Gram-negative bacteria, especially Bacteroidetes, were inhibited at reduced pH values. Consequently, Roseburia were more abundant at a lower pH value, whereas they were out-competed, especially by Bacteroides, at a neutral pH value. Even though these findings were investigated through in vitro cultivation of a defined microbiota, they are in accordance with the results in our study, where a whole complex microbiota was cultivated.

3.1.5. Microbial Richness and Diversity

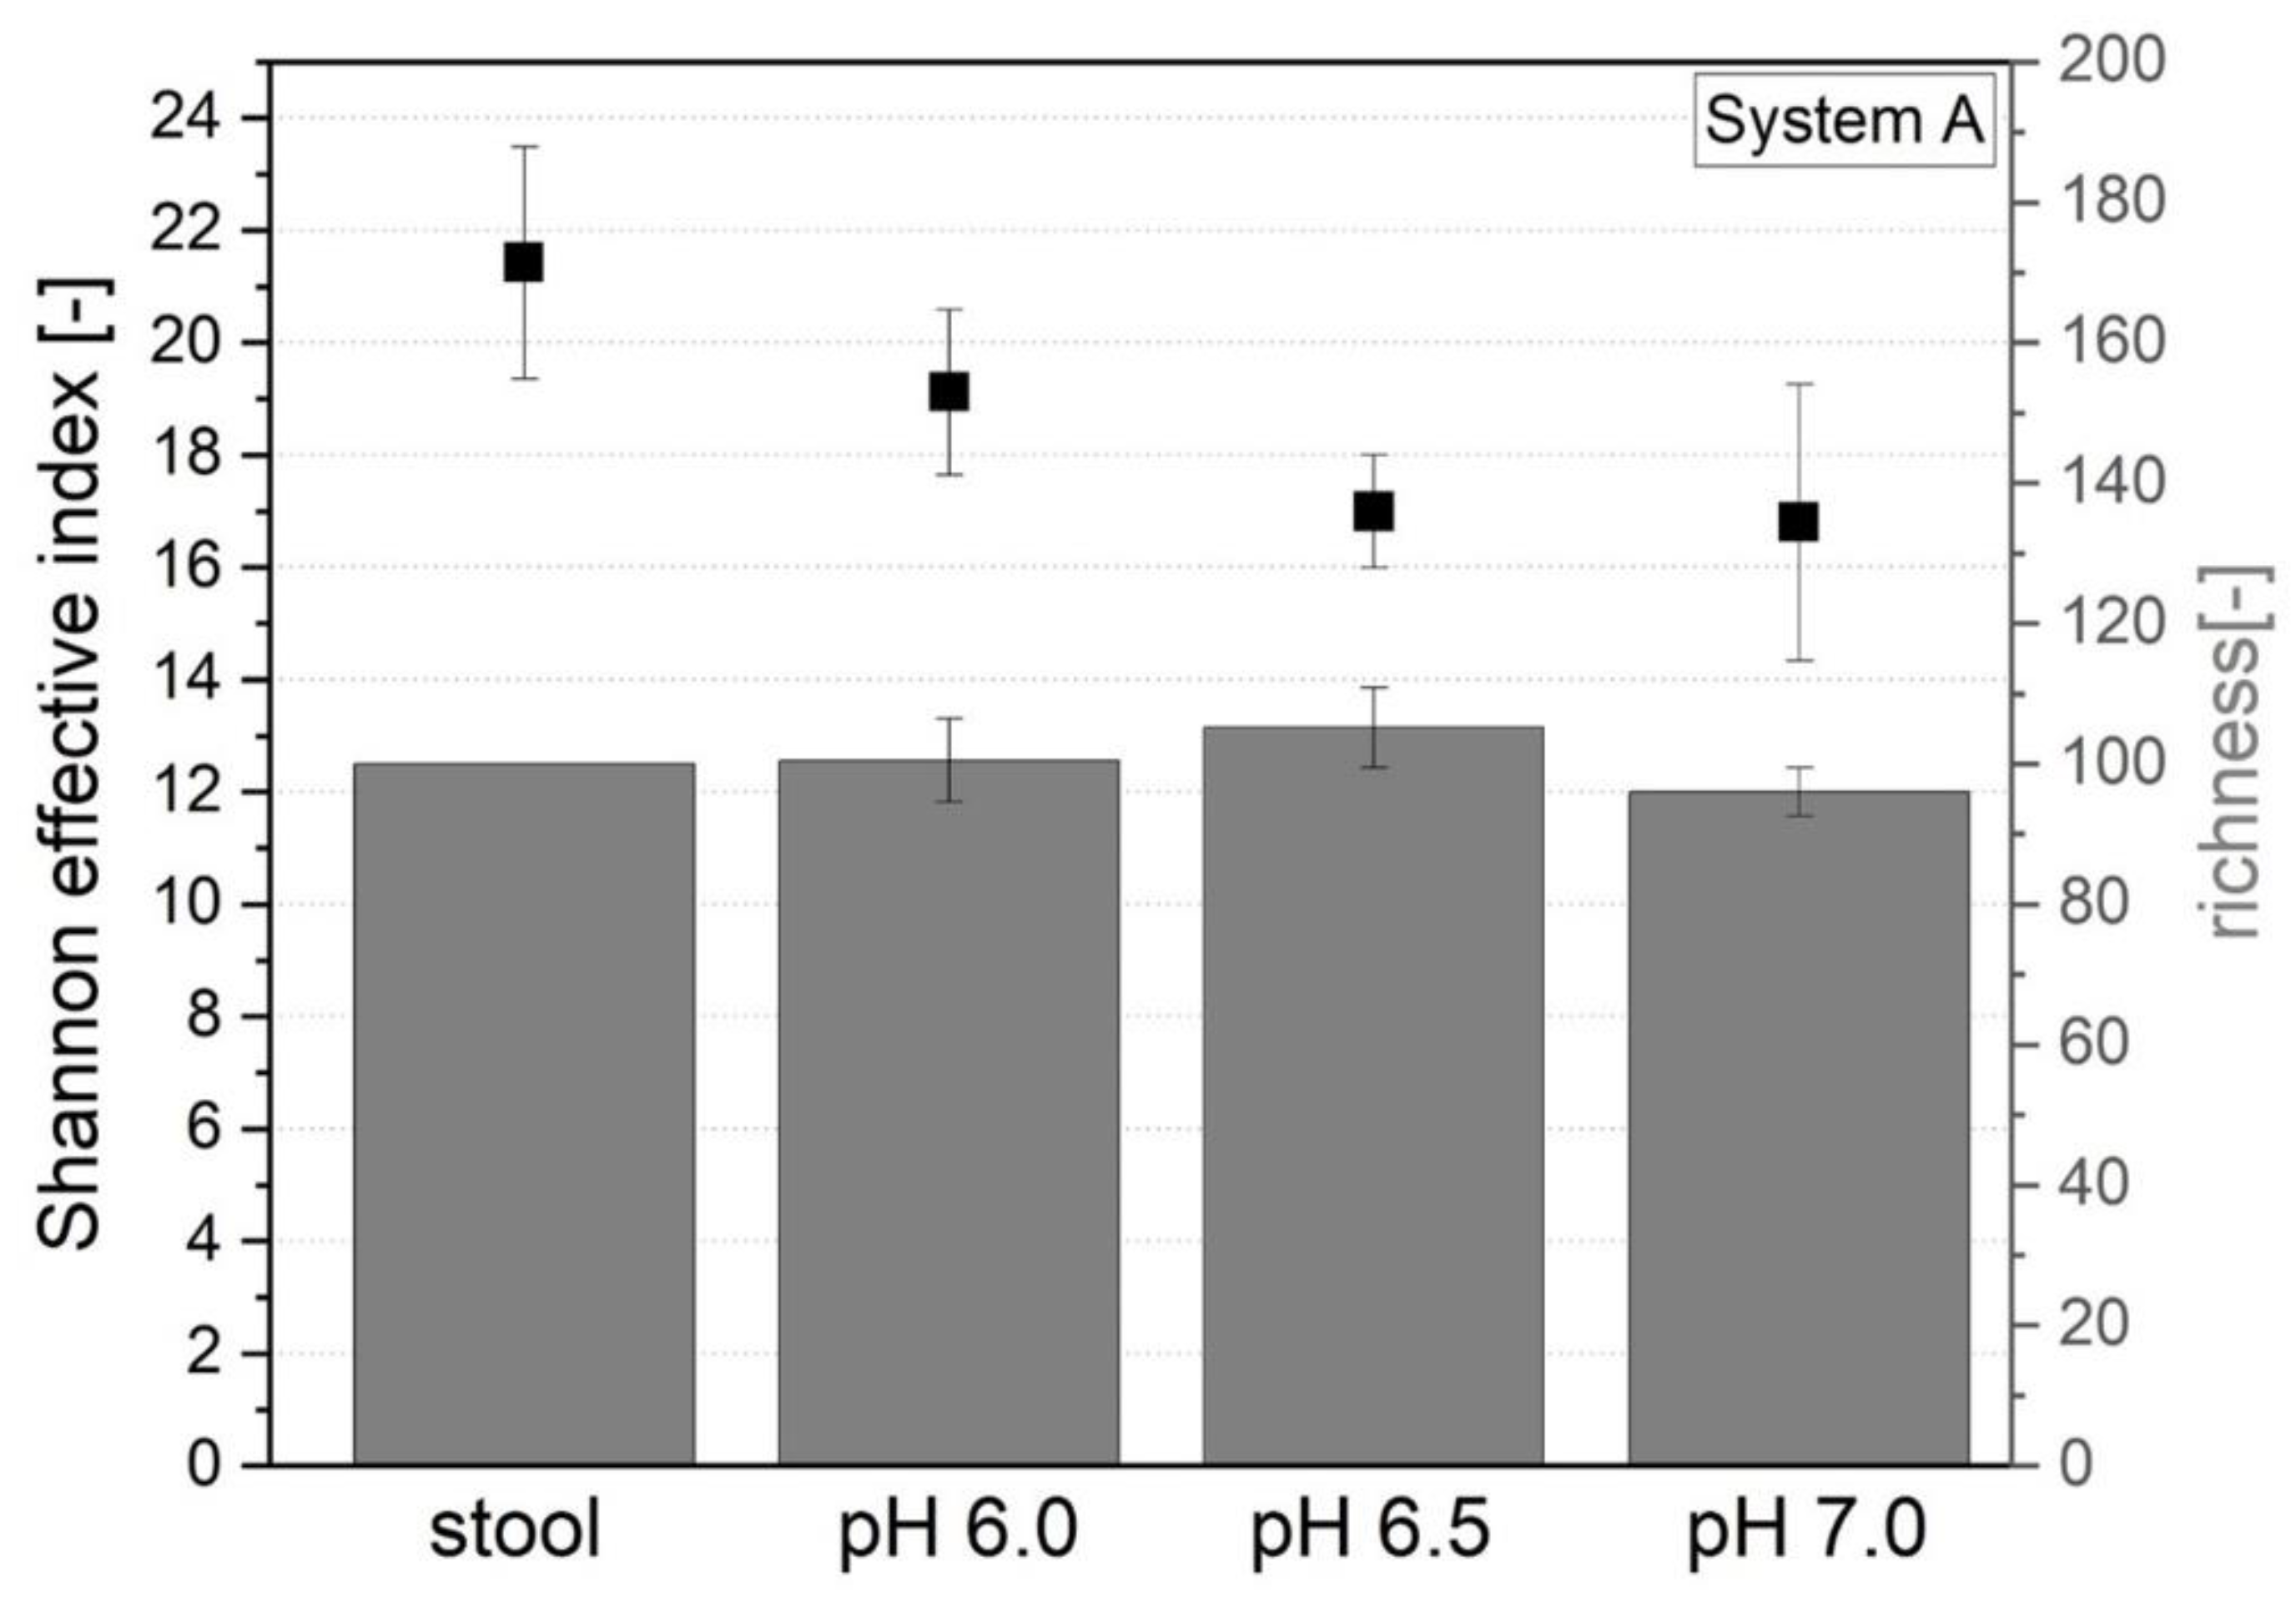
The richness and diversity of microorganisms in the systems were measured by the Shannon effective index. Microbial richness and diversity are important for a functional, healthy microbiota. The richness of the in vitro microbiota of system A differed from 96.00 ± 3.46 at pH 7.0 to 105.17 ± 5.71 at pH 6.5 (Figure 12). At a cultivation pH of 6.0, a richness of 100.50 ± 5.96 was reached. No significant difference between the three systems was observed.
For systems B and C, no significantly different richness based on the cultivation pH was observed. However, the Shannon effective index in system A decreased from 19.12 ± 1.47 at pH 6.0 to 15.94 ± 1.43 at pH 7.0. The one-way ANOVA followed by a Tukey post-hoc test revealed a significant difference between the two pH values. The index of 17.28 ± 1.14 at pH 6.5 was not significantly different from the other values. The systems of donors B and C showed a similar trend in diversity, but the differences were not statistically significant. Consequently, the highest diversity was reached at lower pH values. This may be explained by the fact that Bacteroides dominate communities at higher pH values. Walker et al. [30] detected an abundance of approximately 80% Bacteroides of total bacteria at an increased pH value, while only 20% were detected at lower pH values. These results may explain the reduced diversity at higher pH values in this study. Further, other researchers detected a higher diversity of abundant species at lower pH values when cultivating a microbiota of a defined composition of several representative bacteria [31].

3.2. Comparison with Original Donor Stool

When cultivating an in vitro microbiota, as well as the functionality, a high similarity with the original system is desirable. Regarding the abundance of Proteobacteria and Verrucomicrobia in system A, no significant differences between the donor stool and the cultivated broth were observed.
However, the phyla Actinobacteria in all three conditions (pH 6.0, 6.5, and 7.0) in all three systems differed significantly from the original sample (Figure 6). In system A, the abundance of Actinobacteria in the stool was 2.02%, whereas it was lower in the cultivated system (e.g., 0.33 ± 0.09% at pH 6.0). Systems B and C showed a similar behavior. The abundance of Proteobacteria showed no dependency on the pH for systems A and C, and further no significant difference from the abundance in the donor stool (Figure 7). System B showed slight differences, as the abundance at the pH 6.5 cultivation was increased compared to pH 7.0 and the donor stool. Overall, the in vitro cultivation at different pH values only has a slight influence on the abundance of Proteobacteria. The abundance of Verrucomicrobia showed an increase with the cultivation pH for systems A and C. For system B, the same trend was observed, but only the abundance at pH 6.0 was significantly lowered. When comparing the abundance of Verrucomicrobia with the donor stool, different observations for the systems are made (Figure 8). For system A, no significant difference was observable. The abundance of Verrucomicrobia in donor stool B was significantly higher compared to the cultivated microbiotas. At system C, however, the abundance in the donor stool was significantly lower compared to cultivations at pH 6.5 and 7.0. It seems that Verrucomicrobia is abundant in higher numbers at a higher pH value, but compared to the donor stool, the behavior is individual.
As Figure 9 shows, the abundance of Firmicutes was significantly lower in the cultivated system compared to the original value in the stool (26.04 ± 1.76% at pH 6.0 vs. 48.52%) in system A. System C showed the same effect, whereas the abundance of Firmicutes in the donor stool B was only significantly higher than systems 6.5 and 7.0. Conversely, the abundance of Bacteroidetes in system A at pH 6.0 was 69.08 ± 1.88% compared to 46.89% in the donor stool (Figure 10). Systems A and C showed significantly higher abundances of Bacteroidetes than in the donor stool. For system B, only the abundance in the cultivations 6.5 and 7.0 was significantly higher, although the abundance in all three systems tended to be increased.
Consequently, all systems experienced a decrease in Actinobacteria and Firmicutes due to cultivation (Figure 12). Contrary, the abundance of Bacteroidetes and Proteobacteria increased during the cultivation process. The behavior of Verrucomicrobia was individual and dependent on the donor stool.
As Table 1 shows, the ratio of Firmicutes and Bacteroidetes in the donor stool was 1.13 (donor A), 1.03 (donor B), and 2.60 (donor C). During cultivation, the ratios dropped. In system A, ratios of 0.38 (pH 6.0), 0.22 (pH 6.5), and 0.17 (pH 7.0) were calculated. In system B, a cultivation at pH 6.0 led to an ratio of 0.77, whereas it was lower during cultivation at pH 6.5 (0.33) and 7.0 (0.32). For system C, ratios of 0.65 (pH 6.0), 0.29 (pH 6.5), and 0.24 (pH 7.0) were reached. As a ratio around 0.5 is claimed as healthy [61], a lower cultivation pH is recommendable to reach a healthy in vitro contribution of Firmicutes and Bacteroidetes.
Regarding α-diversity, an in vitro cultivation had no influence on the richness in systems A and B. For system A, the richness in the donor stool (100) was comparable to the richness of 101 (pH 6.0), 105 (pH 6.5), and 96 (pH 7.0) in the cultivated systems (Figure 11). For systems B and C, no difference was observed. Further, the Shannon effective index in system A was decreased for the cultivation at pH 6.5 (17.00) and 7.0 (16.80) compared to the donor stool (21.42). A cultivation at pH 6.0 showed no significant difference (19.12). For system B, no difference in the Shannon effective index was detected, whereas the diversity was lowered for all cultivations in system C. Here, it seems that the richness can be preserved in vitro in big parts, whereas the diversity (Shannon effective) is decreased, especially at higher cultivation pH values.
We concluded from these results that the original microbiota from the donor stool cannot be replicated precisely. However, all systems represented functioning in vitro microbiotas. Regarding the distribution of phyla (Figure 12), the pH 6.0 cultivation showed the highest similarity with the original stool. At low cultivation pH values, the growth of Bacteroidetes is reduced, whereas more gram-positive bacteria as Firmicutes are abundant [31], resulting in a healthy ratio of Firmicutes to Bacteroidetes. Further, health-promoting representatives were found to be abundant at pH 6.0 compared to a value of 7.0. Regarding richness and diversity, a cultivation at a lower pH is also recommendable. The physiological pH value in the intestine increases from a value of 5.4–5.9 in the proximal colon up to 6.1–6.9 in the distal colon [42]. It seemed that a pH value of 7.0 is already too high to create a system similar to the in vivo characteristics. A cultivation at pH 6.0 provides conditions that support the growth of the phylum Firmicutes and consequently results in a system more similar to the donor stool.

4. Conclusions

In the current study, the influence of the cultivation pH on the in vitro microbiota systems created with the stool of three different donors was assessed. From the results obtained, we concluded that the microbiota differs dependent on the set pH value.
With an increasing cultivation pH, an increase in cell count; the total amount of SCFAs, acetate, and propionate; and the abundance of Bacteroidetes and Verrucomicrobia was observed. For the concentration of butyrate and the abundance of Actinobacteria and Firmicutes, a decrease with a higher pH was determined. For the concentration of isovalerate, the abundance of Proteobacteria and diversity, measured by richness and Shannon effective, no effect of the cultivation pH was observed.
The aim of this study was to detect the cultivation pH where a system with a high functionality as well as comparability with the donor stool forms. This question cannot be answered completely, as the system, and therefore the choice of pH, is dependent on the individual requirements. If a high cell count is desired, a pH of 7.0 is desirable, as this pH level promotes the growth of a higher number of cells. A higher concentration of SCFAs, including acetate and propionate, were also reached at pH 7.0. However, higher concentrations of butyrate were present at pH 6.0. When comparing the distribution of phyla in the stable systems, the composition was closer to the original system when cultivation was conducted at pH 6.0. Regarding the ratio of Firmicutes to Bacteroidetes, a cultivation at lower pH values is recommendable. Furthermore, a higher abundance of health-promoting bacteria, including Roseburia, Bifidobacteria, and Faecalibacterium, was detected at pH 6.0. In general, all investigated pH values created stable systems, with the factors of the ratio of SCFAs and the phylogenic distribution considered as being indicative of a healthy microbiota. If a microbiota with a high cell count and a high amount of total SCFAs is required, the cultivation pH should be set to 7.0. On the other hand, if high concentrations of butyrate and a higher similarity with the donor stool are targeted, a cultivation pH of 6.0 would lead to the desired results. Ultimately, therefore, the choice of pH creates significant differences in the established in vitro microbiota, but no clear recommendations for a special value can be made.

Author Contributions

R.H., U.K. conceived of and designed the experiments. R.H., S.S. performed the experiments and analysis. R.H. prepared the figures, made statistical analysis and wrote the manuscript. S.S., R.H. and U.K. revised the manuscript. All authors have read and agreed to the published version of the manuscript.

Funding

The project was supported by funds of the ZIEL–Institute for Food and Health at the Technical University of Munich (project cultivation and preservation of the human intestinal microbiota).

Institutional Review Board Statement

Not applicable.

Informed Consent Statement

Informed consent was obtained from all subjects involved in the study.

Data Availability Statement

Raw sequencing data are available at the Sequence Read Archive under the accession number PRJNA739060.

Acknowledgments

We gratefully acknowledge the donors as well as all members of the ZIEL Core Facility Microbiome for their technical and analytical support during the experiments. The Institute for Medical Microbiology and Hygiene, University of Regensburg is thanked for the testing of the donor stools.

Conflicts of Interest

The authors declare that they have no conflict of interest.

References

  1. Eckburg, P.B.; Bik, E.M.; Bernstein, C.N.; Purdom, E.; Dethlefsen, L.; Sargent, M.; Gill, S.R.; Nelson, K.E.; Relman, D.A. Diversity of the Human Intestinal Microbial Flora. Science 2005, 308, 1635–1638. [Google Scholar] [CrossRef] [PubMed] [Green Version]
  2. Gill, S.R.; Pop, M.; Deboy, R.T.; Eckburg, P.B.; Turnbaugh, P.J.; Samuel, B.S.; Gordon, J.I.; Relman, D.A.; Fraser-Liggett, C.M.; Nelson, K.E. Metagenomic Analysis of the Human Distal Gut Microbiome. Science 2006, 312, 1355–1359. [Google Scholar] [CrossRef] [PubMed] [Green Version]
  3. Dethlefsen, L.; Mcfall-Ngai, M.; Relman, D.A. An Ecological and Evolutionary Perspective on Human-Microbe Mutualism and Disease. Nature 2007, 449, 811–818. [Google Scholar] [CrossRef]
  4. Rios-Covian, D.; Salazar, N.; Gueimonde, M.; De Los Reyes-Gavilan, C.G. Shaping the Metabolism of Intestinal Bacteroides Population through Diet to Improve Human Health. Front. Microbiol. 2017, 8, 376. [Google Scholar] [CrossRef] [Green Version]
  5. Vadder, F.; De Kovatcheva-Datchary, P.; Goncalves, D.; Vinera, J.; Zitoun, C.; Duchampt, A.; Bäckhed, F.; Mithieux, G. Microbiota-Generated Metabolites Promote Metabolic Benefits Via Gut-Brain Neural Circuits. Cell 2014, 156, 84–96. [Google Scholar] [CrossRef] [PubMed] [Green Version]
  6. Kumar, R.; Grover, S.; Batish, V.K. Hypocholesterolaemic Effect of Dietary Inclusion of Two Putative Probiotic Bile Salt Hydrolase-Producing Lactobacillus Plantarum Strains in Sprague-Dawley Rats. Br. J. Nutr. 2011, 105, 561–573. [Google Scholar] [CrossRef] [Green Version]
  7. Holmes, E.; Li, J.V.; Athanasiou, T.; Ashrafian, H.; Nicholson, J.K. Understanding the Role of Gut Microbiome-Host Metabolic Signal Disruption in Health and Disease. Trends Microbiol. 2011, 19, 349–359. [Google Scholar] [CrossRef]
  8. Schreiber, S.; Nikolaus, S.; Rosenstiel, P. Microbiome and Nutrition. The Way to a Future Therapy for Chronic Inflammatory Bowel Diseases? Internist 2014, 55, 889–897. [Google Scholar] [CrossRef]
  9. Manichanh, C.; Rigottier-Gois, L.; Bonnaud, E.; Gloux, K.; Pelletier, E.; Frangeul, L.; Nalin, R.; Jarrin, C.; Chardon, P.; Marteau, P.; et al. Reduced Diversity of Faecal Microbiota in Crohn’s Disease Revealed by a Metagenomic Approach. Gut 2006, 55, 205–211. [Google Scholar] [CrossRef] [Green Version]
  10. Collado, M.C.; Calabuig, M.; Sanz, Y. Differences between the Fecal Microbiota of Coeliac Infants and Healthy Controls. Curr. Issues Intest. Microbiol. 2007, 8, 9–14. [Google Scholar]
  11. Larsen, N.; Vogensen, F.K.; Van Den Berg Frans, W.J.; Nielsen, D.S.; Andreasen, A.S.; Pedersen, B.K.; Al-Soud, W.A.; Sorensen, S.J.; Hansen, L.H.; Jakobsen, M. Gut Microbiota in Human Adults with Type 2 Diabetes Differs From Non-Diabetic Adults. PLoS ONE 2010, 5, E9085. [Google Scholar] [CrossRef]
  12. Koliada, A.; Syzenko, G.; Moseiko, V.; Budovska, L.; Puchkov, K.; Perederiy, V.; Gavalko, Y.; Dorofeyev, A.; Romanenko, M.; Tkach, S.; et al. Association between Body Mass Index and Firmicutes/Bacteroidetes Ratio in an Adult Ukrainian Population. BMC Microbiol. 2017, 17, 1–6. [Google Scholar] [CrossRef] [PubMed] [Green Version]
  13. Ley, R.E.; Bäckhed, F.; Turnbaugh, P.; Lozupone, C.A.; Knight, R.D.; Gordon, J.I. Obesity Alters Gut Microbial Ecology. Proc. Natl. Acad. Sci. USA 2005, 102, 11070–11075. [Google Scholar] [CrossRef] [Green Version]
  14. Hill-Burns, E.M.; Debelius, J.W.; Morton, J.T.; Wissemann, W.T.; Lewis, M.R.; Wallen, Z.D.; Peddada, S.D.; Factor, S.A.; Molho, E.; Zabetian, C.P.; et al. Parkinson’s Disease and Parkinson’s Disease Medications Have Distinct Signatures of the Gut Microbiome. Mov. Disord. 2017, 32, 739–749. [Google Scholar] [CrossRef]
  15. Helmink, B.A.; Khan, M.A.W.; Hermann, A.; Gopalakrishnan, V.; Wargo, J.A. The Microbiome, Cancer, and Cancer Therapy. Nat. Med. 2019, 25, 377–388. [Google Scholar] [CrossRef] [PubMed]
  16. Tremlett, H.; Bauer, K.C.; Appel-Cresswell, S.; Finlay, B.B.; Waubant, E. The Gut Microbiome in Human Neurological Disease: A Review. Ann. Neurol. 2017, 81, 369–382. [Google Scholar] [CrossRef] [PubMed]
  17. Lagier, J.-C.; Million, M.; Hugon, P.; Armougom, F.; Raoult, D. Human Gut Microbiota: Repertoire and Variations. Front. Cell. Infect. Microbiol. 2012, 2, 136. [Google Scholar] [CrossRef] [Green Version]
  18. Zar, F.A.; Bakkanagari, S.R.; Moorthi, K.M.L.S.T.; Davis, M.B. A Comparison of Vancomycin and Metronidazole for the Treatment of Clostridium Difficile-Associated Diarrhea, Stratified by Disease Severity. Clin. Infect. Dis. 2007, 45, 302–307. [Google Scholar] [CrossRef]
  19. Aroniadis, O.C.; Brandt, L.J. Fecal Microbiota Transplantation: Past, Present and Future. Curr. Opin. Gastroenterol. 2013, 29, 79–84. [Google Scholar] [CrossRef]
  20. Gough, E.; Shaikh, H.; Manges, A.R. Systematic Review of Intestinal Microbiota Transplantation (Fecal Bacteriotherapy) for Recurrent Clostridium Difficile Infection. Clin. Infect. Dis. 2011, 53, 994–1002. [Google Scholar] [CrossRef] [Green Version]
  21. Terveer, E.M.; Van Beurden, Y.H.; Goorhuis, A.; Seegers, J.F.M.L.; Bauer, M.P.; Van Nood, E.; Dijkgraaf, M.G.W.; Mulder, C.J.J.; Vandenbroucke-Grauls, C.M.J.E.; Verspaget, H.W.; et al. How To: Establish and Run a Stool Bank. Clin. Microbiol. Infect. 2017, 23, 924–930. [Google Scholar] [CrossRef] [Green Version]
  22. Mennigen, R.; Bruewer, M. Effect of Probiotics on Intestinal Barrier Function. Ann. N. Y. Acad. Sci. 2009, 1165, 183–189. [Google Scholar] [CrossRef]
  23. Le Blay, G.; Rytka, J.; Zihler, A.; Lacroix, C. New In Vitro Colonic Fermentation Model for Salmonella Infection in the Child Gut. Fems Microbiol. Ecol. 2009, 67, 198–207. [Google Scholar] [CrossRef] [PubMed]
  24. Meunier, V.; Bourrié, M.; Berger, Y.; Fabre, G. The Human Intestinal Epithelial Cell Line Caco-2; Pharmacological and Pharmacokinetic Applications. Cell Biol. Toxicol. 1995, 11, 187–194. [Google Scholar] [CrossRef]
  25. Hemarajata, P.; Versalovic, J. Effects of Probiotics on Gut Microbiota: Mechanisms of Intestinal Immunomodulation and Neuromodulation. Ther. Adv. Gastroenterol. 2013, 6, 39–51. [Google Scholar] [CrossRef] [PubMed] [Green Version]
  26. Minekus, M.; Smeets-Peeters, M.; Bernalier, A.; Marol-Bonnin, S.; Havenaar, R.; Marteau, P.; Alric, M.; Fonty, G. A Computer-Controlled System to Simulate Conditions of the Large Intestine with Peristaltic Mixing, Water Absorption and Absorption of Fermentation Products. Appl. Microbiol. Biotechnol. 1999, 53, 108–114. [Google Scholar] [CrossRef]
  27. Molly, K.; Woestyne, M.V.; Smet, I.; De Verstraete, W. Validation of the Simulator of the Human Intestinal Microbial Ecosystem (Shime) Reactor Using Microorganism-Associated Activities. Microb. Ecol. Health Dis. 1994, 7, 191–200. [Google Scholar] [CrossRef]
  28. Mcdonald, J. Development of an In Vitro Fermentation Model to Culture the Human Distal Gut Microbiota. Ph.D. Thesis, University of Guelph, Guelph, ON, Canada, 2013. [Google Scholar]
  29. Bircher, L.; Schwab, C.; Geirnaert, A.; Lacroix, C. Cryopreservation of Artificial Gut Microbiota Produced with In Vitro Fermentation Technology. Microb. Biotechnol. 2018, 11, 163–175. [Google Scholar] [CrossRef]
  30. Walker, A.W.; Duncan, S.H.; Mcwilliam Leitch, E.C.; Child, M.W.; Flint, H.J. pH and Peptide Supply Can Radically Alter Bacterial Populations and Short-Chain Fatty Acid Ratios Within Microbial Communities from the Human Colon. Appl. Environ. Microbiol. 2005, 71, 3692–3700. [Google Scholar] [CrossRef] [Green Version]
  31. Duncan, S.H.; Louis, P.; Thomson, J.M.; Flint, H.J. The Role of pH in Determining the Species Composition of the Human Colonic Microbiota. Environ. Microbiol. 2009, 11, 2112–2122. [Google Scholar] [CrossRef]
  32. Duncan, S.H.; Scott, K.P.; Ramsay, A.G.; Harmsen, H.J.M.; Welling, G.W.; Stewart, C.S.; Flint, H.J. Effects of Alternative Dietary Substrates On Competition Between Human Colonic Bacteria in an Anaerobic Fermentor System. Appl. Environ. Microbiol. 2003, 69, 1136–1142. [Google Scholar] [CrossRef] [Green Version]
  33. Takagi, R.; Sasaki, K.; Sasaki, D.; Fukuda, I.; Tanaka, K.; Yoshida, K.-I.; Kondo, A.; Osawa, R. A Single-Batch Fermentation System to Simulate Human Colonic Microbiota for High-Throughput Evaluation of Prebiotics. PLoS ONE 2016, 11, E0160533. [Google Scholar] [CrossRef] [PubMed] [Green Version]
  34. Zamora-Gasga, V.M.; Cárdenas-Castro, A.P.; Montalvo-González, E.; Loarca-Piña, M.G.F.; Pedro Alberto, V.-L.; Tovar, J.; Sáyago-Ayerdi, S.G. In Vitro Human Colonic Fermentation of Indigestible Fraction Isolated From Lunch Menus: Impact on the Gut Metabolites and Antioxidant Capacity. Int. J. Food Sci. Nutr. 2018, 69, 718–728. [Google Scholar] [CrossRef] [PubMed]
  35. Campos-Vega, R.; Reynoso-Camacho, R.; Pedraza-Aboytes, G.; Acosta-Gallegos, J.A.; Guzman-Maldonado, S.H.; Paredes-Lopez, O.; Oomah, B.D.; Loarca-Piña, G. Chemical Composition and In Vitro Polysaccharide Fermentation of Different Beans (Phaseolus vulgaris L.). J. Food Sci. 2009, 74, T59–T65. [Google Scholar] [CrossRef] [PubMed]
  36. Macfarlane, G.T.; Macfarlane, S.; Gibson, G.R. Validation of a Three-Stage Compound Continuous Culture System for Investigating the Effect of Retention Time on the Ecology and Metabolism of Bacteria in the Human Colon. Microb. Ecol. 1998, 35, 180–187. [Google Scholar] [CrossRef] [PubMed]
  37. Kim, E.R.; Rhee, P.-L. How to Interpret a Functional or Motility Test-Colon Transit Study. J. Neurogastroenterol. Motil. 2012, 18, 94–99. [Google Scholar] [CrossRef]
  38. Haindl, R.; Engel, J.; Kulozik, U. Establishment of an In Vitro System of the Human Intestinal Microbiota: Effect of Cultivation Conditions and Influence of Three Donor Stool Samples. Microorganisms 2021, 9, 1049. [Google Scholar] [CrossRef]
  39. Kiviharju, K.; Leisola, M.; Eerikainen, T. Optimization of a Bifidobacterium Longum Production Process. J. Biotechnol. 2005, 117, 299–308. [Google Scholar] [CrossRef]
  40. Dalland, E.; Hofstad, T. Growth of Bacteroides Fragilis in Continuous Culture and in Batch Cultures at Controlled pH. Appl. Microbiol. 1974, 28, 856–860. [Google Scholar] [CrossRef]
  41. Baktash, A.; Terveer, E.M.; Zwittink, R.D.; Hornung, B.V.H.; Corver, J.; Kuijper, E.J.; Smits, W.K. Mechanistic Insights in the Success of Fecal Microbiota Transplants for the Treatment of Clostridium Difficile Infections. Front. Microbiol. 2018, 9, 1242. [Google Scholar] [CrossRef]
  42. Payne, A.N.; Zihler, A.; Chassard, C.; Lacroix, C. Advances and Perspectives in In Vitro Human Gut Fermentation Modeling. Trends Biotechnol. 2012, 30, 17–25. [Google Scholar] [CrossRef] [PubMed]
  43. Evans, D.F.; Pye, G.; Bramley, R.; Clark, A.G.; Dyson, T.J.; Hardcastle, J.D. Measurement of Gastrointestinal pH Profiles in Normal Ambulant Human Subjects. Gut 1988, 29, 1035–1041. [Google Scholar] [CrossRef] [PubMed] [Green Version]
  44. Reitmeier, S.; Kiessling, S.; Neuhaus, K.; Haller, D. Comparing Circadian Rhythmicity in the Human Gut Microbiome. Star Protoc. 2020, 1, 100148. [Google Scholar] [CrossRef]
  45. Lagkouvardos, I.; Joseph, D.; Kapfhammer, M.; Giritli, S.; Horn, M.; Haller, D.; Clavel, T. Imngs: A Comprehensive Open Resource of Processed 16s Rrna Microbial Profiles for Ecology and Diversity Studies. Sci. Rep. 2016, 6, 33721. [Google Scholar] [CrossRef]
  46. Reitmeier, S.; Hitch, T.C.A.; Fikas, N.; Hausmann, B.; Ramer-Tait, A.E.; Neuhaus, K.; Berry, D.; Haller, D.; Lagkouvardos, I.; Clavel, T. Handling of Spurious Sequences Affects the Outcome of High-Throughput 16s rRNA Gene Amplicon Profiling. ISME Commun. 2021, 1, 1–12. [Google Scholar] [CrossRef]
  47. Reitmeier, S.; Kiessling, S.; Clavel, T.; List, M.; Almeida, E.L.; Ghosh, T.S.; Neuhaus, K.; Grallert, H.; Linseisen, J.; Skurk, T.; et al. Arrhythmic Gut Microbiome Signatures Predict Risk of Type 2 Diabetes. Cell Host Microbe 2020, 28, 258–272. [Google Scholar] [CrossRef]
  48. Lagkouvardos, I.; Fischer, S.; Kumar, N.; Clavel, T. Rhea: A Transparent and Modular R Pipeline for Microbial Profiling Based On 16s Rrna Gene Amplicons. PeerJ 2017, 5, E2836. [Google Scholar] [CrossRef] [Green Version]
  49. Sender, R.; Fuchs, S.; Milo, R. Revised Estimates for the Number of Human and Bacteria Cells in the Body. PLoS Biol. 2016, 14, E1002533. [Google Scholar] [CrossRef] [Green Version]
  50. Schwiertz, A.; Taras, D.; Schäfer, K.; Beijer, S.; Bos, N.A.; Donus, C.; Hardt, P.D. Microbiota and Scfa in Lean and Overweight Healthy Subjects. Obesity 2010, 18, 190–195. [Google Scholar] [CrossRef]
  51. Macfarlane, G.T.; Gibson, G.R.; Cummings, J.H. Comparison of Fermentation Reactions in Different Regions of the Human Colon. J. Appl. Bacteriol. 1992, 72, 57–64. [Google Scholar] [CrossRef]
  52. Rowland, I.; Gibson, G.; Heinken, A.; Scott, K.; Swann, J.; Thiele, I.; Tuohy, K. Gut Microbiota Functions: Metabolism of Nutrients and Other Food Components. Eur. J. Nutr. 2018, 57, 1–24. [Google Scholar] [CrossRef] [Green Version]
  53. Schwan, W.R.; Lee, J.L.; Lenard, F.A.; Matthews, B.T.; Beck, M.T. Osmolarity and pH Growth Conditions Regulate Fim Gene Transcription and Type 1 Pilus Expression in Uropathogenic Escherichia Coli. Infect. Immun. 2002, 70, 1391–1402. [Google Scholar] [CrossRef] [PubMed] [Green Version]
  54. Small, P.; Blankenhorn, D.; Welty, D.; Zinser, E.; Slonczewski, J.L. Acid and Base Resistance in Escherichia Coli and Shigella Flexneri: Role of Rpos and Growth pH. J. Bacteriol. 1994, 176, 1729–1737. [Google Scholar] [CrossRef] [PubMed] [Green Version]
  55. Van Herreweghen, F.; Van Den Abbeele, P.; De Mulder, T.; De Weirdt, R.; Geirnaert, A.; Hernandez-Sanabria, E.; Vilchez-Vargas, R.; Jauregui, R.; Pieper, D.H.; Belzer, C.; et al. In Vitro Colonisation of the Distal Colon by Akkermansia Muciniphila Is Largely Mucin and pH Dependent. Benef. Microbes 2017, 8, 81–96. [Google Scholar] [CrossRef] [PubMed] [Green Version]
  56. Cheema, Z.M. The Role of Faecalibacterium Prausnitzii in Health and Disease. Catalyst 2019, 3, 11–17. [Google Scholar]
  57. Licht, T.R.; Hansen, M.; Bergström, A.; Poulsen, M.; Krath, B.N.; Markowski, J.; Dragsted, L.O.; Wilcks, A. Effects of Apples and Specific Apple Components on the Cecal Environment of Conventional Rats: Role of Apple Pectin. BMC Microbiol. 2010, 10, 13. [Google Scholar] [CrossRef] [PubMed] [Green Version]
  58. Barcenilla, A.; Pryde, S.E.; Martin, J.C.; Duncan, S.H.; Stewart, C.S.; Henderson, C.; Flint, H.J. Phylogenetic Relationships of Butyrate-Producing Bacteria from the Human Gut. Appl. Environ. Microbiol. 2000, 66, 1654–1661. [Google Scholar] [CrossRef] [Green Version]
  59. Louis, P.; Flint, H.J. Diversity, Metabolism and Microbial Ecology of Butyrate-Producing Bacteria from the Human Large Intestine. FEMS Microbiol. Lett. 2009, 294, 1–8. [Google Scholar] [CrossRef] [Green Version]
  60. Zihler Berner, A.; Fuentes, S.; Dostal, A.; Payne, A.N.; Vazquez Gutierrez, P.; Chassard, C.; Grattepanche, F.; Vos, W.M.; De Lacroix, C. Novel Polyfermentor Intestinal Model (Polyferms) for Controlled Ecological Studies: Validation and Effect of pH. PLoS ONE 2013, 8, E77772. [Google Scholar] [CrossRef] [Green Version]
  61. Lopetuso, L.R.; Petito, V.; Graziani, C.; Schiavoni, E.; Paroni Sterbini, F.; Poscia, A.; Gaetani, E.; Franceschi, F.; Cammarota, G.; Sanguinetti, M.; et al. Gut Microbiota in Health, Diverticular Disease, Irritable Bowel Syndrome, and Inflammatory Bowel Diseases: Time for Microbial Marker of Gastrointestinal Disorders. Dig. Dis. 2018, 36, 56–65. [Google Scholar] [CrossRef]
  62. Tamanai-Shacoori, Z.; Smida, I.; Bousarghin, L.; Loreal, O.; Meuric, V.; Fong, S.B.; Bonnaure-Mallet, M.; Jolivet-Gougeon, A. Roseburia Spp.: A Marker of Health? Future Microbiol. 2017, 12, 157–170. [Google Scholar] [CrossRef]
  63. Tojo, R.; Suárez, A.; Clemente, M.G.; Los Reyes-Gavilán, C.G.; De Margolles, A.; Gueimonde, M.; Ruas-Madiedo, P. Intestinal Microbiota in Health and Disease: Role of Bifidobacteria in Gut Homeostasis. World J. Gastroenterol. 2014, 20, 15163–15176. [Google Scholar] [CrossRef]
  64. Tamaki, H.; Nakase, H.; Inoue, S.; Kawanami, C.; Itani, T.; Ohana, M.; Kusaka, T.; Uose, S.; Hisatsune, H.; Tojo, M.; et al. Efficacy of Probiotic Treatment with Bifidobacterium Longum 536 for Induction of Remission in Active Ulcerative Colitis: A Randomized, Double-Blinded, Placebo-Controlled Multicenter Trial. Dig. Endosc. 2016, 28, 67–74. [Google Scholar] [CrossRef] [Green Version]
  65. Miquel, S.; Martín, R.; Rossi, O.; Bermúdez-Humarán, L.G.; Chatel, J.M.; Sokol, H.; Thomas, M.; Wells, J.M.; Langella, P. Faecalibacterium Prausnitzii and Human Intestinal Health. Curr. Opin. Microbiol. 2013, 16, 255–261. [Google Scholar] [CrossRef]
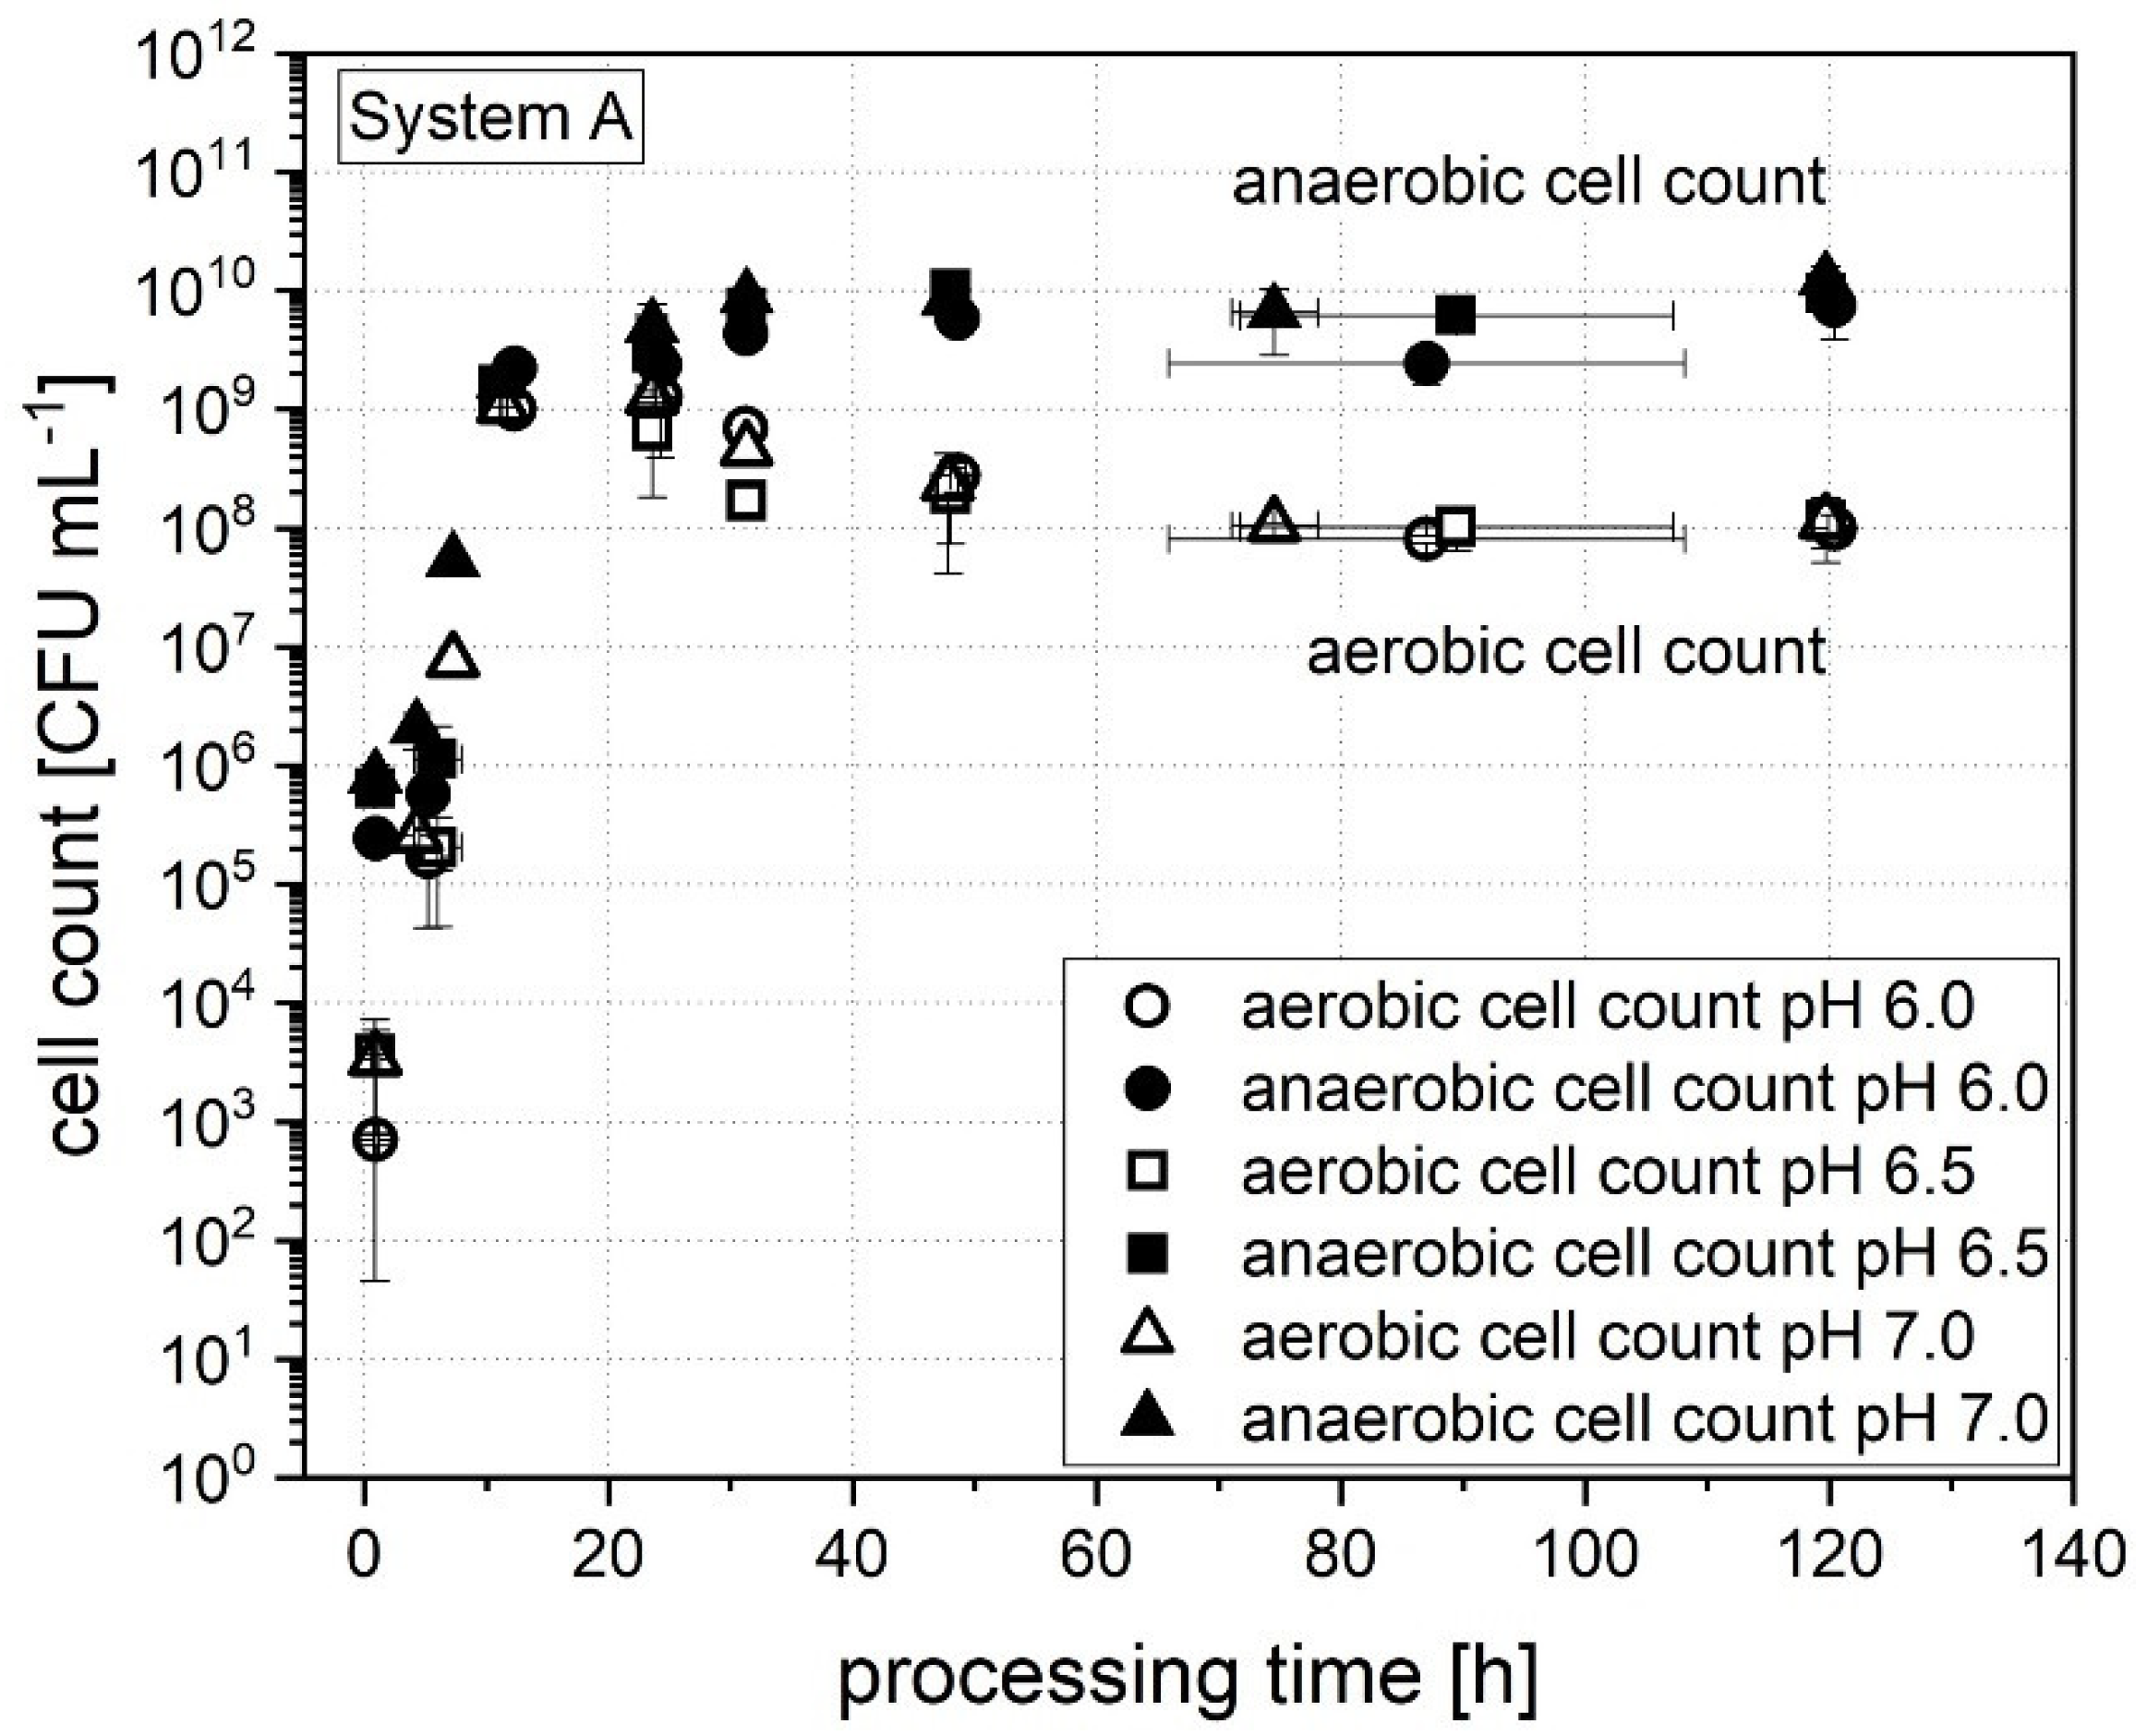
Figure 1. Number of aerobic and anaerobic cell counts over processing time for all examined cultivation pH values (system A).
Fermentation 07 00156 g001
Figure 2. Concentration of acetate in the stable system of all three donors depending on the cultivation pH (black column: pH 6.0; dark grey column: pH 6.5; light grey column: pH 7.0); * marks statistical difference between marked pH and the other values.
Fermentation 07 00156 g002
Figure 3. Concentration of butyrate in the stable system of all three donors depending on the cultivation pH (black column: pH 6.0; dark grey column: pH 6.5; light grey column: pH 7.0); * marks statistical difference between marked pH and the other values.
Fermentation 07 00156 g003
Figure 4. Concentration of propionate in the stable system of all three donors depending on the cultivation pH (black column: pH 6.0; dark grey column: pH 6.5; light grey column: pH 7.0); * marks statistical difference between marked pH and the other values; ** marks statistical difference between the two marked values.
Fermentation 07 00156 g004
Figure 5. Concentration of isovalerate in the stable system of all three donors depending on the cultivation pH (black column: pH 6.0; dark grey column: pH 6.5; light grey column: pH 7.0); * marks statistical difference between marked pH and the other values.
Fermentation 07 00156 g005
Figure 6. Rel. abundance of Actinobacteria in the donor stool and of all three systems depending on the cultivation pH (black column: stool; dark grey column: pH 6.0; grey column: pH 6.5; light grey column: pH 7.0); * marks statistical difference between marked pH and the other values; + marks statistical difference of donor stool and all cultivation pH values.
Fermentation 07 00156 g006
Figure 7. Rel. abundance of Proteobacteria in the donor stool and of all three systems depending on the cultivation pH (black column: stool; dark grey column: pH 6.0; grey column: pH 6.5; light grey column: pH 7.0); ** marks statistical difference between the two marked values; ++ marks statistical difference between the donor stool and the other marked values.
Fermentation 07 00156 g007
Figure 8. Rel. abundance of Verrucomicrobia in the donor stool and of all three systems depending on the cultivation pH (black column: stool; dark grey column: pH 6.0; grey column: pH 6.5; light grey column: pH 7.0); * marks statistical difference between marked pH and the other values; + marks statistical difference of donor stool and all cultivation pH values; ++ marks statistical difference between the donor stool and the other marked values.
Fermentation 07 00156 g008
Figure 9. Rel. abundance of Firmicutes in the donor stool and of all three systems depending on the cultivation pH (black column: stool; dark grey column: pH 6.0; grey column: pH 6.5; light grey column: pH 7.0); * marks statistical difference between marked pH and the other values; ** marks statistical difference between the two marked values; + marks statistical difference of donor stool and all cultivation pH values; ++ marks statistical difference between the donor stool and the other marked values.
Fermentation 07 00156 g009
Figure 10. Rel. abundance of Bacteroidetes in the donor stool and of all three systems depending on the cultivation pH (black column: stool; dark grey column: pH 6.0; grey column: pH 6.5; light grey column: pH 7.0); * marks statistical difference between marked pH and the other values; + marks statistical difference of donor stool and all cultivation pH values; ++ marks statistical difference between the donor stool and the other marked values.
Fermentation 07 00156 g010
Figure 11. Rel. cum. abundance of genera in dependence on the cultivation pH value in system A; for a better readability only genera discussed in this study are depicted, other genera are summed up as others.
Fermentation 07 00156 g011
Figure 12. Comparison of Shannon effective index (black) and richness (grey) between the stool and cultivated system of donor A.
Fermentation 07 00156 g012
Table 1. Characterization of donor stools [38].
Donor ADonor BDonor C
Ageyears282527
BMI-232121
Cell countAerobic (105 CFU mL−1)0.7 ± 0.410 ± 99 ± 1
Anaerobic (108 CFU mL−1)4 ± 32 ± 0.024 ± 0.6
Metabolic profileAcetate (mg mL−1)3.17 ± 0.212.74 ± 0.072.59 ± 0.54
Propionate (mg mL−1)2.00 ± 0.161.15 ± 0.041.02 ± 0.16
Butyrate (mg mL−1)1.48 ± 0.080.99 ± 0.032.14 ± 0.26
Isovalerate (mg mL−1)0.15 ± 0.020.24 ± 0.000.34 ± 0.04
Σ SCFAs (mg mL−1)6.80 ± 0.475.12 ± 0.146.09 ± 1.00
Microbial profileRichness (-)100123122
Shannon effective (-)21.4238.4346.34
Ratio
Firmicutes:Bacteroidetes
1.031.132.60
Table 2. Cultivation conditions for continuous flow fermentation.
Cultivation ParameterSet Condition
Temperature+37 °C
Stirring rate200 rpm
Aeration8 ccm forming gas (95% N2, 5% H2)
pH value6.0/6.5/7.0
regulated with 1.25 M NaOH and 0.5 M HCl
Medium inflow0.5 mL min−1
Volume850 mL
Publisher’s Note: MDPI stays neutral with regard to jurisdictional claims in published maps and institutional affiliations.