Article

Temporal Comparison of Microbial Community Structure in an Australian Winery

by
Cristian Varela
1,2,*,
Kathleen Cuijvers
1 and
Anthony Borneman
1,2
1
The Australian Wine Research Institute, Adelaide, SA 5064, Australia
2
Faculty of Sciences, School of Agriculture, Food & Wine, University of Adelaide, Adelaide, SA 5005, Australia
*
Author to whom correspondence should be addressed.
Fermentation 2021, 7(3), 134; https://doi.org/10.3390/fermentation7030134
Submission received: 2 July 2021 / Revised: 22 July 2021 / Accepted: 22 July 2021 / Published: 27 July 2021
(This article belongs to the Special Issue Enological Repercussions of Non-Saccharomyces Species 3.0)

Abstract

:
Most modern fermented foods and beverages are produced in fit-for-purpose facilities which are designed to ensure not only a reliable product, but also one safe for consumption. Despite careful hygiene, microorganisms can colonise these facilities and establish resident populations that can potentially contribute to the fermentation process. Although some microorganisms may not negatively affect the final product, spoilage microorganisms can be detrimental for quality, generating substantial economic losses. Here, amplicon-based phylotyping was used to map microbial communities within an Australian winery, before, during and after the 2020 vintage. Resident bacterial and yeast populations were shown to change over time, with both relative abundance and location within the winery varying according to sampling date. The bacterial family Micrococcaceae, and the genera Sphingomonas and Brevundimonas were the most abundant bacterial taxonomies, while Naganishia, Pyrenochaeta and Didymella were the most abundant fungal genera. Mapping the spatial distributions of the microbial populations identified the main locations that harboured these resident microorganisms, that include known wine spoilage yeasts and bacteria. Wine spoilage microorganisms, including the genefugura Lactobacillus, Acetobacter, Gluconobacter and Brettanomyces showed very low relative abundance and were found only in a couple of locations within the winery. Microbial populations detected in this facility were also compared to the resident microbiota identified in other fermented food facilities, revealing that microbial population structures may reflect the nature of the product created in each facility.

1. Introduction

Fermentation is one of the oldest practices for food preservation. Indeed, archaeological evidence suggests that the oldest fermented beverage, which was made of grapes, hawthorn berries, honey, and rice, was produced between 7000 and 6650 BCE [1]. Nowadays, approximately 5000 different fermented foods and beverages are estimated to be produced around the world [2]. Alcoholic and non-alcoholic fermented products are made from a wide range of sources, including meat and dairy products, grains, fruits and vegetables [2,3].
Microbial activity is inherent to all fermented products, with microorganisms either introduced deliberately by direct inoculation, or unintentionally via raw materials and/or the processing environment [4]. Most modern fermented products are created in specially designed facilities and while these are devised to reduce the risk of spoilage, food facilities are not abiotic [5,6]. These facilities are susceptible to colonisation by microorganisms from various sources, including raw materials, air and humans [6].
Currently, there is an increasing interest in understanding the microbial communities that inhabit food processing facilities [6,7,8,9], as well as those involved in the fermentation of traditional and/or indigenous foods and beverages [10,11,12] using culture-independent techniques. Linking bacterial and/or fungal populations to production outcomes enables mitigation of safety and spoilage risks and the delivery of consistent products with desirable qualities for consumers [8]. Resident microbial communities have been studied in breweries [13,14], cheese making facilities [4,15,16], meat processing facilities [9,17,18], a vegetable fermentation facility [8] and wineries [7,19].
During winemaking, grape bunches are transported to the winery, crushed, pressed, fermented and aged prior to bottling [19]. Numerous fungal species live on the surfaces of vines and grapes and inhabit the vineyard soil [20,21], while many others reside in the winery/cellar environment [19,22,23,24,25]. Wine fermentation is conducted by a consortium of wine yeast and bacteria that establish themselves either from the grape surface or from the winery via shared equipment or other vectors such as insects [26]. Thus, vineyard and winery microbial communities have the potential to participate during fermentation and influence wine flavour and aroma [26]. However, several microorganisms within these communities are known to have the potential to spoil wine [27,28,29] generating significant economic costs to reduce the risk of infection and to treat infected wines [30].
Here, amplicon-based microbial profiling (phylotyping) was used to map the microbial communities that inhabit an Australian winery. Population structure was determined at three different dates, before, during and after vintage, and compared to the microbiota found in other fermentation facilities, including two wineries.

2. Materials and Methods

2.1. Winery Sampling

Samples were collected from the Hickinbotham Roseworthy Wine Science Laboratory (HRWSL) located on the Waite campus of the University of Adelaide, Adelaide, Australia, mean annual temperature 15–22 °C. This winery and research facility has a capacity of 200 tonnes and is used for teaching, research and commercial wine production. HRWSL floors were pressure cleaned with cold water before and after vintage and no chemicals were used in this process. During vintage, excess grape material was removed by hosing down with cold water every night. Samples were taken from 40 locations spread across the concrete floor of the main HRWSL operations/fermentation area (Figure 1A), using sterile, cotton-tipped swabs moistened with NRS medium (NRSII Transwab, Rowe Scientific, Adelaide, Australia). Each swab was streaked over a 10 cm2 area, with sampling locations set out in a 5 × 8 grid pattern that covered a total area of 622 m2 (Figure 1B). Sampling occurred at three different dates, before vintage (December 2019), during vintage (March 2020) and after vintage (June 2020). After sampling, tubes containing NRS media were centrifuged for 5 min at 16,000× g, with pellets stored at −20 °C.

2.2. Determination of Microbial Populations

Total DNA was isolated from each sample using the DNeasy PowerFood Microbial kit (Qiagen, Hilden, Germany). Bead-beating was carried out using a combination of 0.1 mm and 0.5 mm zirconia/silica beads (BioSpec Products, Oklahoma, OK, USA) in a Precellys Evolution homogenizer (Bertin Instruments, Montigny-le-Bretonneux, France) at 8000 RPM for 4 × 60 s. Then, 1 ng of total DNA from each sample was subjected to a three-step PCR process targeting either the V3–V4 region of the bacterial 16S rRNA [31] or the ITS2 locus from the fungal ribosomal internal transcribed spacer (ITS) region [32] while adding both custom in-line barcodes and sequences necessary for Illumina sequencing (including compatible Illumina dual-indexes) Sequencing was performed using 2 × 300 bp chemistry on an Illumina MiSeq sequencer (Ramaciotti Centre for Genomics, Sydney, Australia). Following sequencing, paired-end reads were quality trimmed (Trimmomatic v0.38) [33], adaptor trimmed (Cutadapt v1.16) [34] and merged into single synthetic reads (FLASH2 v2.2.00) [35]. Merged reads were de-replicated (USEARCH v10.0.240) [36] and clustered (Swarm v2.2.2) [37] into operational taxonomic units (OTUs) as presented previously [38]. Fungal taxonomic annotation was performed against the UNITE database (qiime_ver8_dynamic_02.02.2019) using a 98% similarity cut off and the assign_taxonomy.py module of QIIME v1.9.1 [39], while bacterial taxonomy used the SILVA 16S database (version 132 QIIME release) as a reference. Abundances for all bacterial and fungal OTUs identified in this study are listed in Tables S1 and S2, respectively. Raw reads are available from the BioProject website (accession number PRJNA742433).

2.3. Data Analysis

Data analysis and graphical representation for yeast populations were performed using the R packages phyloseq [40], microbiome [41], vegan [42], microbiomeViz [43], plotly [44], ggtree [45], ggtreeExtra [46], ggpubr [47], ggplot2 [48] and viridis [49] in R version 4.0.2 [50]. Samples were filtered for read depth (1000 reads minimum) and OTUs were filtered by abundance (0.001% minimum). OTU counts were then standardized to the median sequencing depth and then proportionally normalized by dividing the genus level OTU count by the sum of all OTUs within a sample. Alpha diversity indexes were obtained with the command alpha from the microbiome package [41]. Distance-based redundancy analysis (DBRDA) was undertaken using the proportionally normalized data with location and sampling date as major factors. Analysis of variance (ANOVA) was run on the resulting DBRDA analysis using the function aov from the R package stats [50]. Mapping of microbial populations to the winery floor plan was performed using the plot_ly and add_trace commands of the package plotly [44]. Cladograms were first obtained using the commands fix_duplicate_tax, parsePhyloseq and tree.backbone from the package microbiomeViz [43] and ggtree from the ggtree package [45], and then annotated using the commands clade.anno from the microbiomeViz package [43] and geom_fruit from the ggtreeExtra package [46].
Statistical differences for relative abundances between species according to location and sampling date were evaluated using Kruskal–Wallis tests with the command plot_taxa_boxplot from the microbiomeutilities package [51]. Phylotyping data from other studies, including a brewery [5], two cheese making facilities [4] and two wineries [7,19,52], were used to compare microbial community structure between food and beverage facilities. It was not possible to obtain the raw sequences for other studies and assign taxonomies to different OTUs using the same database. Therefore, taxonomy tables from each study were used for comparison. Taxonomy tables from different studies were combined into a single phyloseq object and then agglomerated by family or genus depending on the analysis.

3. Results

Floor swab samples were collected from the HRWSL main operations/fermentation area at three different time points, before vintage (December 2019), during vintage (March 2020) and after vintage (June 2020). This represents the main area where grapes are received, crushed and fermented and where completed ferments are pressed and transferred to tanks and oak barrels.

3.1. Microbial Populations in the Winery

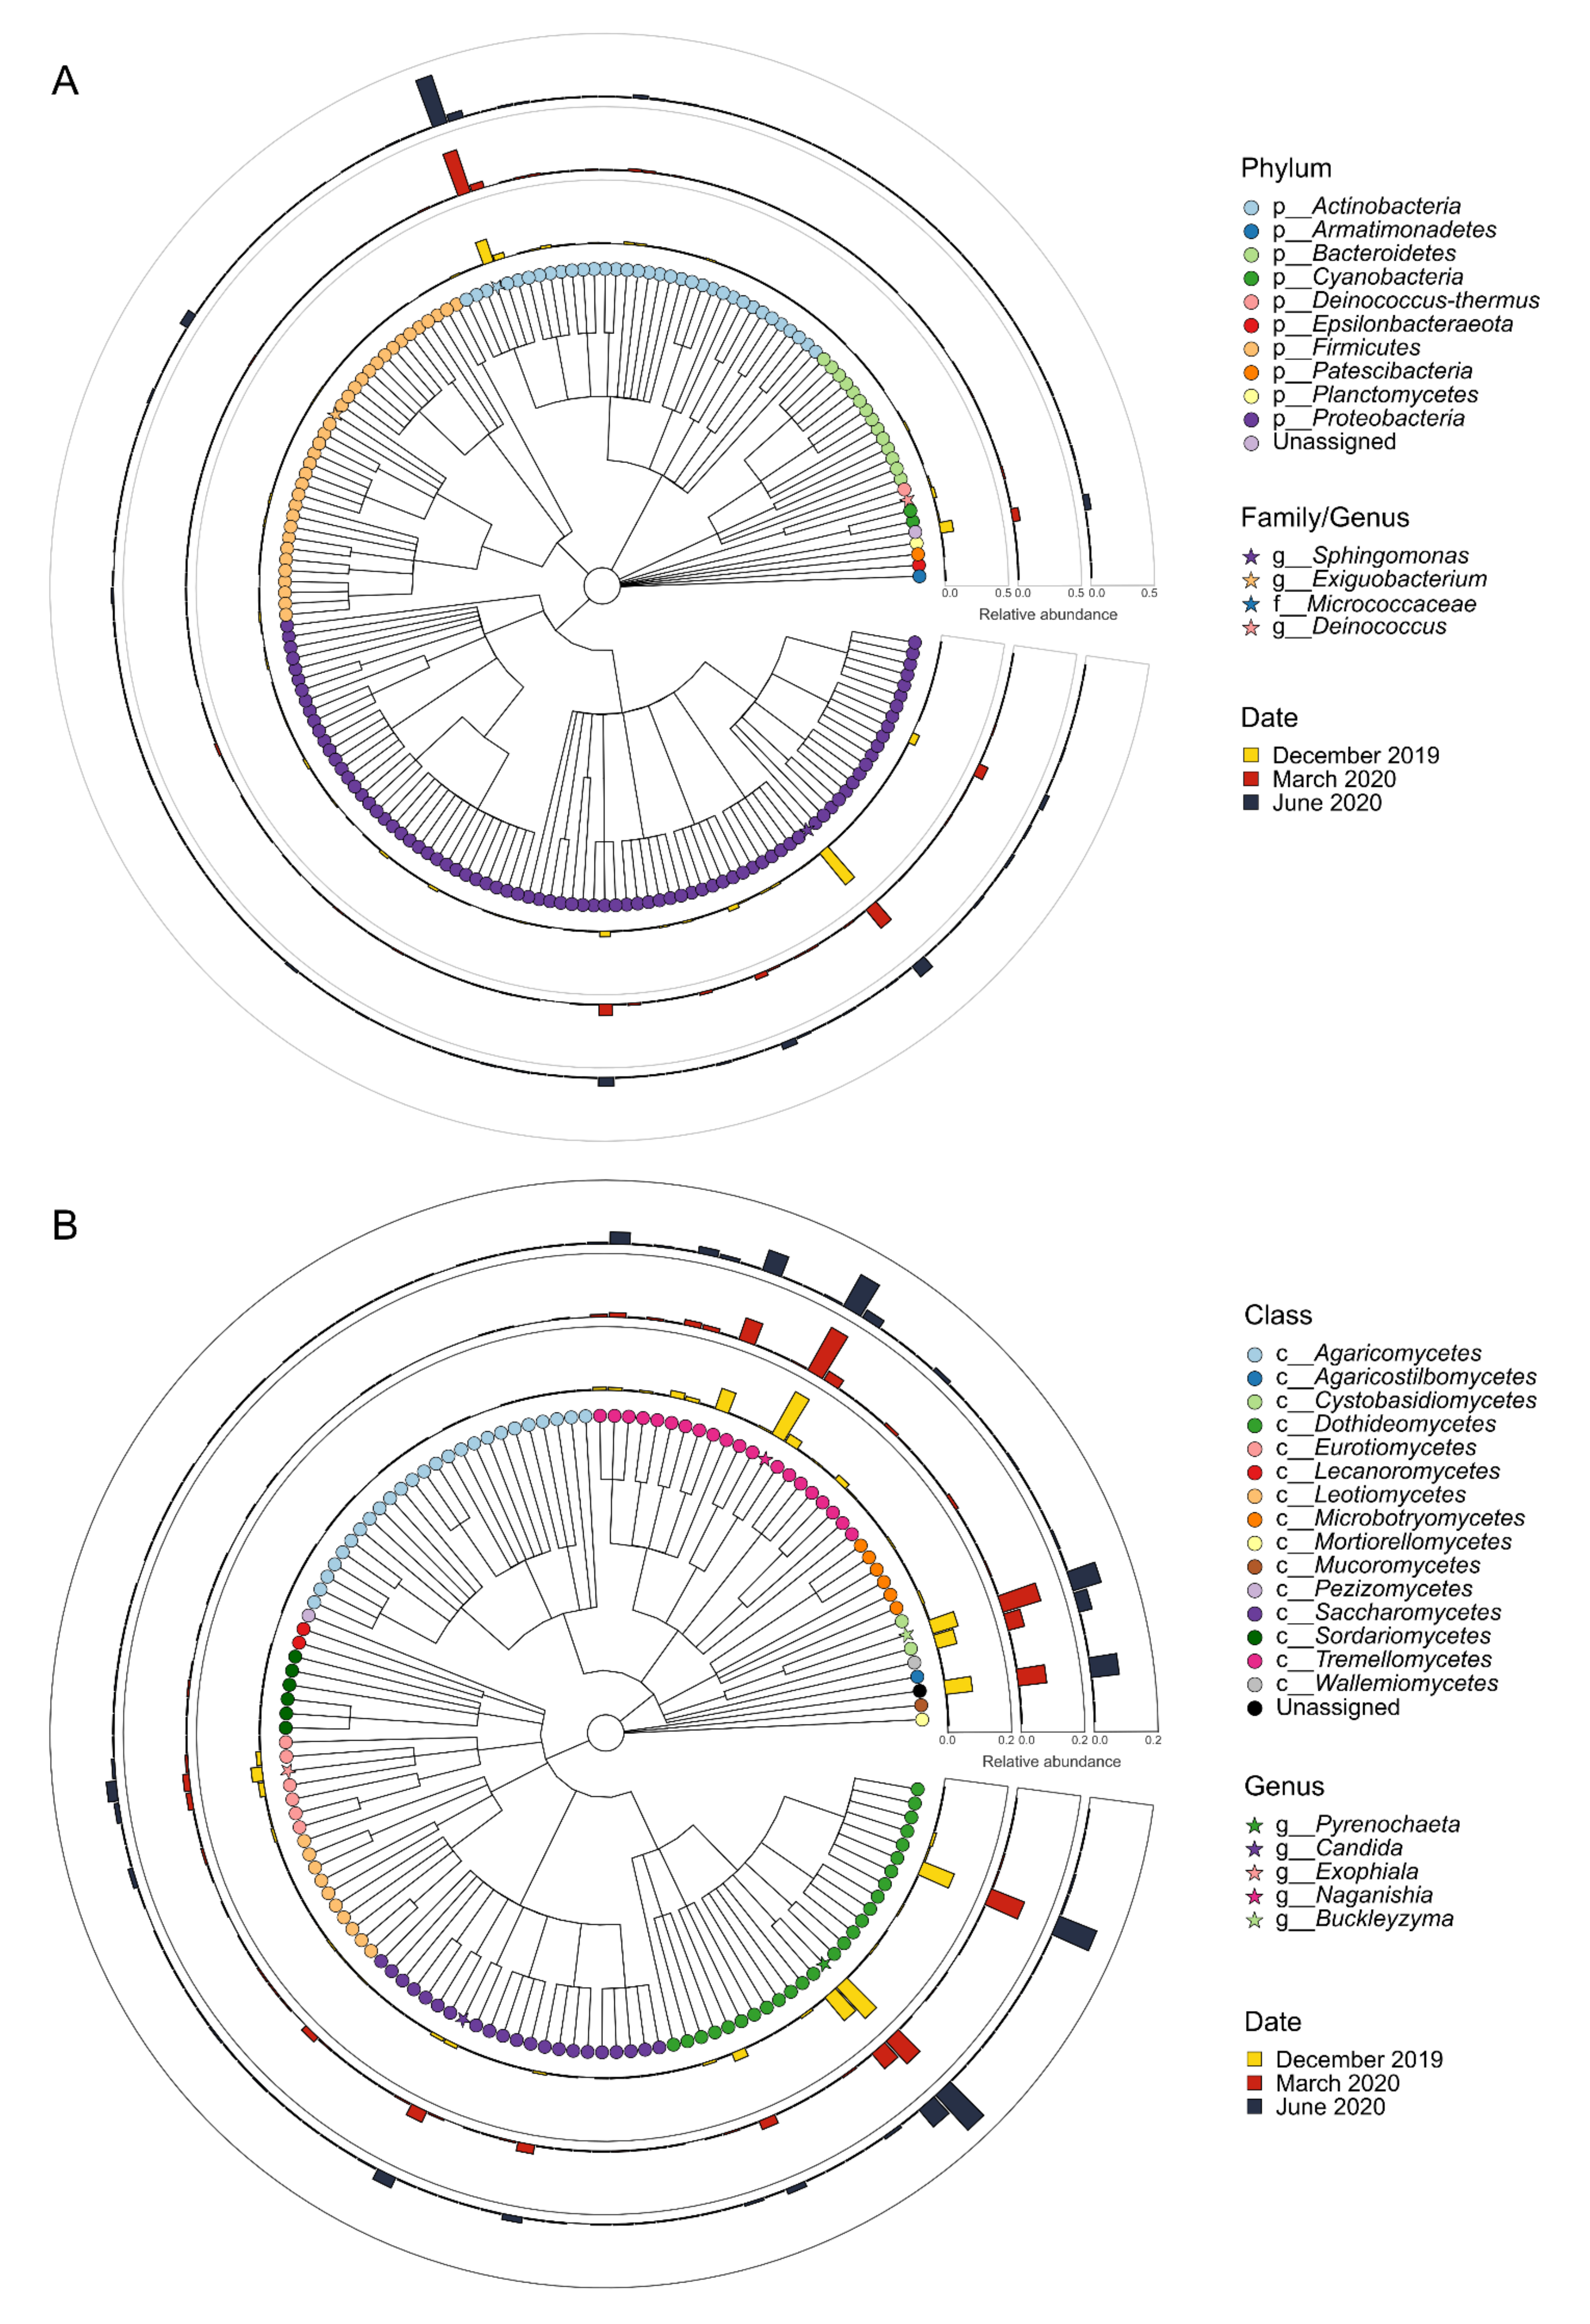
An overview of the microbial populations found in the HRWSL across the three sampling dates and their taxonomies is provided in Figure 2. A total of ten different bacterial phyla were identified, with Proteobacteria, Firmicutes, Actinobacteria and Bacteroidetes accounting for over 95% of total number of bacterial genera. These phyla showed great diversity involving 83, 35, 35 and 14 different genera, respectively (Figure 2A). Sphingomonas was the most abundant genera for the phylum Proteobacteria, while the genus Exiguobacterium and the family Micrococcaceae were the most abundant taxonomies for the phyla Firmicutes and Actinobacteria, respectively. Actinobacteria and Proteobacteria were the most abundant phyla accounting for more than 80% abundance regardless of sampling date (Table S3). The phyla Actinobacteria, Firmicutes and Patescibacteria showed a statistically significant increase in relative abundance according to sampling date (Kruskal–Wallis test, p < 0.05), while Cyanobacteria, Deinococcus-Thermus and Proteobacteria decreased in abundance (Figure S1A, Table S3). The increase in abundance found for Actinobacteria was driven by a significant increase in the family Micrococcaceae, whereas the genus Exiguobacterium was mainly responsible for the increase in Firmicutes (Figure S1B). Similarly, the genera Sphingomonas and Massilia and the family Enterobacteriaceae were responsible for the decreased abundance of Proteobacteria. The genus Acinetobacter showed increased abundance during vintage, while the family Burkholderiaceae showed high abundance before and after vintage (Figure S1B, Table S4).
Fifteen different fungal classes were found across all sampling dates, with Dothideomycetes, Agaricomycetes, Saccharomycetes and Tremellomycetes displaying the highest number of genera per class, with 27, 25, 22 and 21 different genera, respectively. Pyrenochaeta, Candida, Exophiala, Naganishia and Buckleyzyma were the most abundant genera across all sampling dates in their respective classes (Figure 2B). Dothideomycetes and Tremellomycetes were the most abundant classes overall, accounting for nearly 60% of observed read counts regardless of sampling date (Table S5). Microbotryomycetes, Saccharomycetes and Sordariomycetes showed significant increases (p < 0.05) in relative abundance during vintage, whereas Agaricomycetes and Eurotiomycetes decreased in abundance at the same sampling date (Figure S2A, Table S5). The increased abundance of Saccharomycetes, which includes most of the yeast genera of oenological interest, is explained by a rise in the relative abundance of the genera Candida, Metschnikowia and Saccharomyces during vintage. In contrast, the genera Cyphellophora, Guehomyces and Neocucurbitaria decreased during vintage and remained low after vintage (Figure S2B, Table S6). Hannaella was the only genus increasing in abundance over the three sampling times (Table S6).
Sampling date also had an impact on the diversity indices for both bacterial and yeast communities (Table 1). For bacterial communities, richness, diversity and evenness were highest before vintage, whereas dominance was lowest at the same sampling date. These findings suggest a great number of bacterial species with balanced abundance before vintage. For fungal populations, only richness changed according to sampling date showing lowest values during vintage. Distance-based redundancy analysis (DBRDA) showed that both sampling date and location significantly affected the composition of bacterial and fungal communities (Table 2).

3.2. Community Structure Differs Between Food and Beverage Facilities

Phylotyping data from other studies, including bacterial 16S and fungal ITS data from a brewery [5], two cheese making facilities [4] and a winery in the US [19] and fungal ITS data from a winery in France [7,52] were used to compare microbial community structure between food and beverage facilities. These studies included samples from different types of location within each facility including floors, walls, equipment, drains etc.
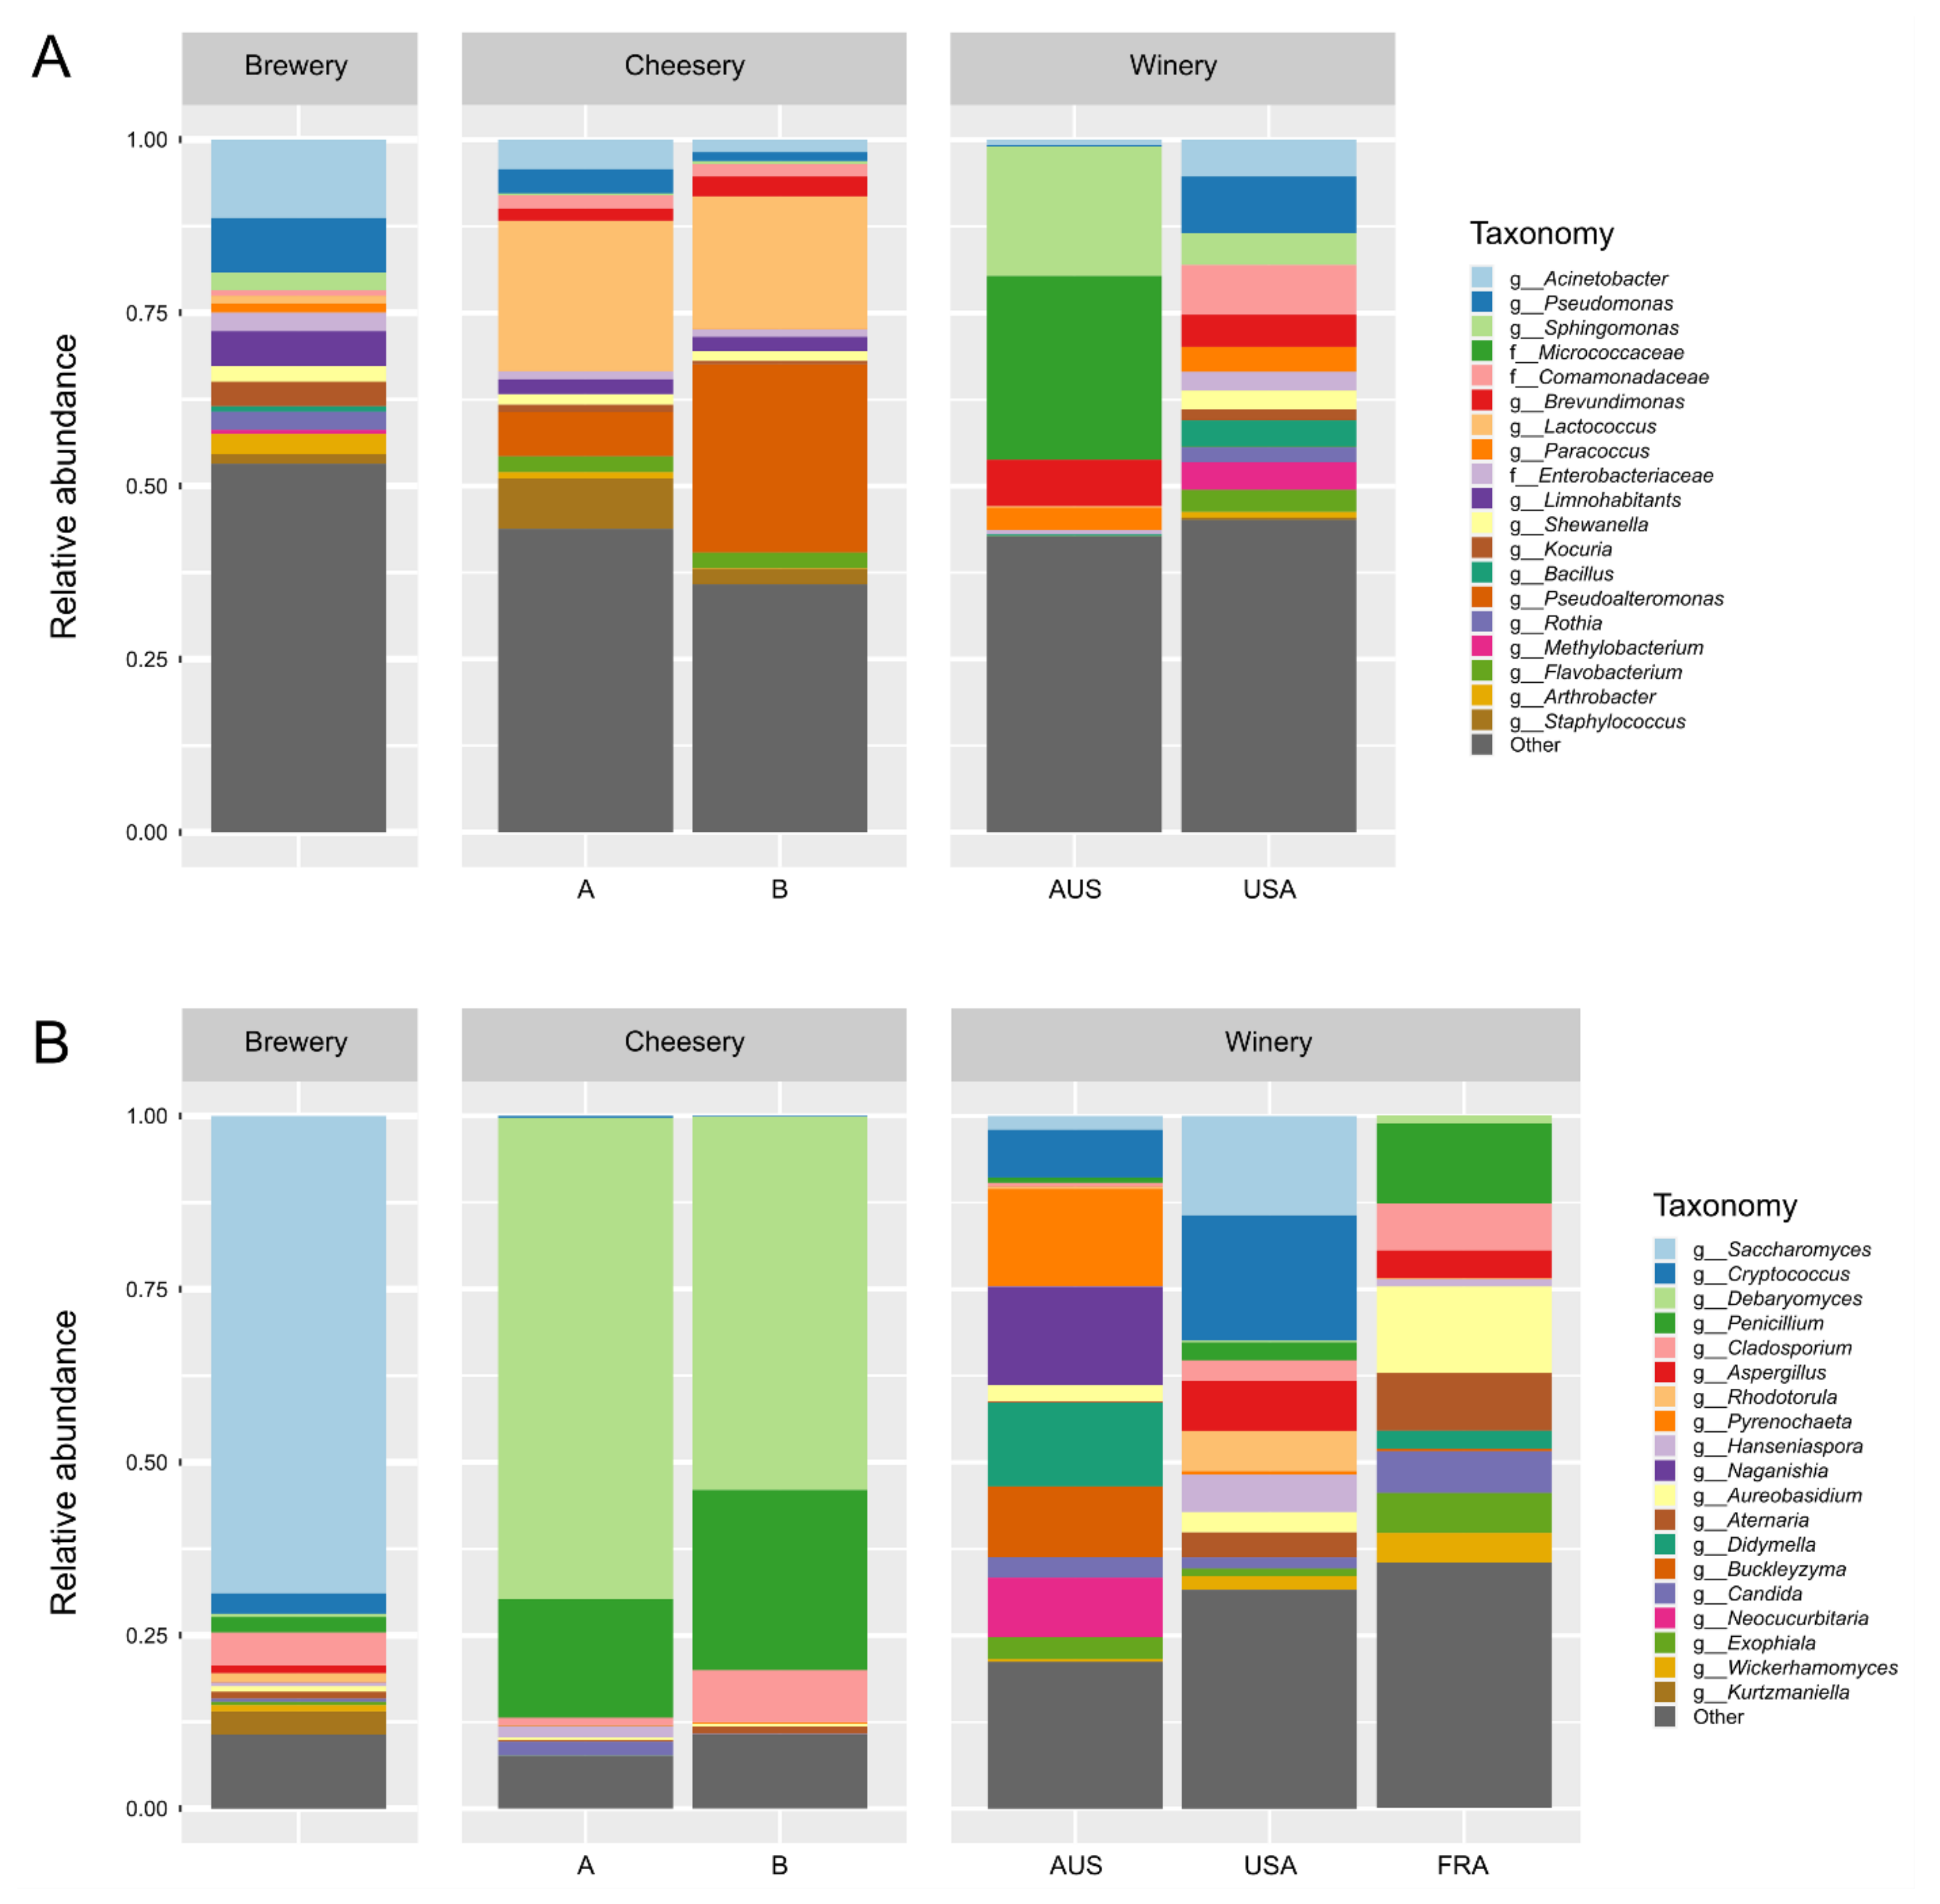
Although all the facilities showed a large proportion of low abundance bacterial terminal taxonomies, food and beverage facilities showed distinct bacterial population structures (Figure 3A). The genera Acinetobacter, Pseudomonas and Limnohabitans were the most abundant in the brewery, whereas Lactococcus, Pseudoalteromonas and Staphylococcus were the most abundant genera in the cheese making facilities. Although the relative abundance for these last two genera were different between both cheese making facilities, population structure was similar (Figure 3A). Bacterial populations in both wineries were distinct, not only the main final taxonomies representing each winery, but also in their relative abundance. The family Micrococcaceae and the genus Sphingomonas were the most abundant in the Australian winery, while several taxonomies showed similar abundance in the North American winery, with the genus Pseudomonas and the family Comamonadaceae being the most abundant (Figure 3A).
Fungal population structures were also distinct in each facility, including all three wineries (Figure 3B). Saccharomyces was the most abundant genus in the brewery, accounting for nearly 70% of all genera. Debaryomyces and Penicillium were the most abundant genera in the cheese making facilities. All three wineries showed different proportions for the most abundant genera. The genera Pyrenochaeta, Naganishia and Didymella were the most abundant in the Australian winery, whereas Cryptococcus, Saccharomyces and Aspergillus showed the highest abundance in the North American winery. The genera Aureobasidium, Penicillium and Alternaria were the most abundant in the French winery. Interestingly, only the North American winery had considerable abundance for the wine related genera Saccharomyces, Hanseniaspora and Rhodotorula (Figure 3B).

3.3. Mapping Microbial Abundance

The relative abundance for microbial and fungal populations according to sampling date and location are shown in Figures S3 and S4, respectively. Although some changes in abundance can be easily visualised, it is not straightforward to identify all changes in population structure from bar plots, therefore relative abundance was mapped to the winery floor plan.
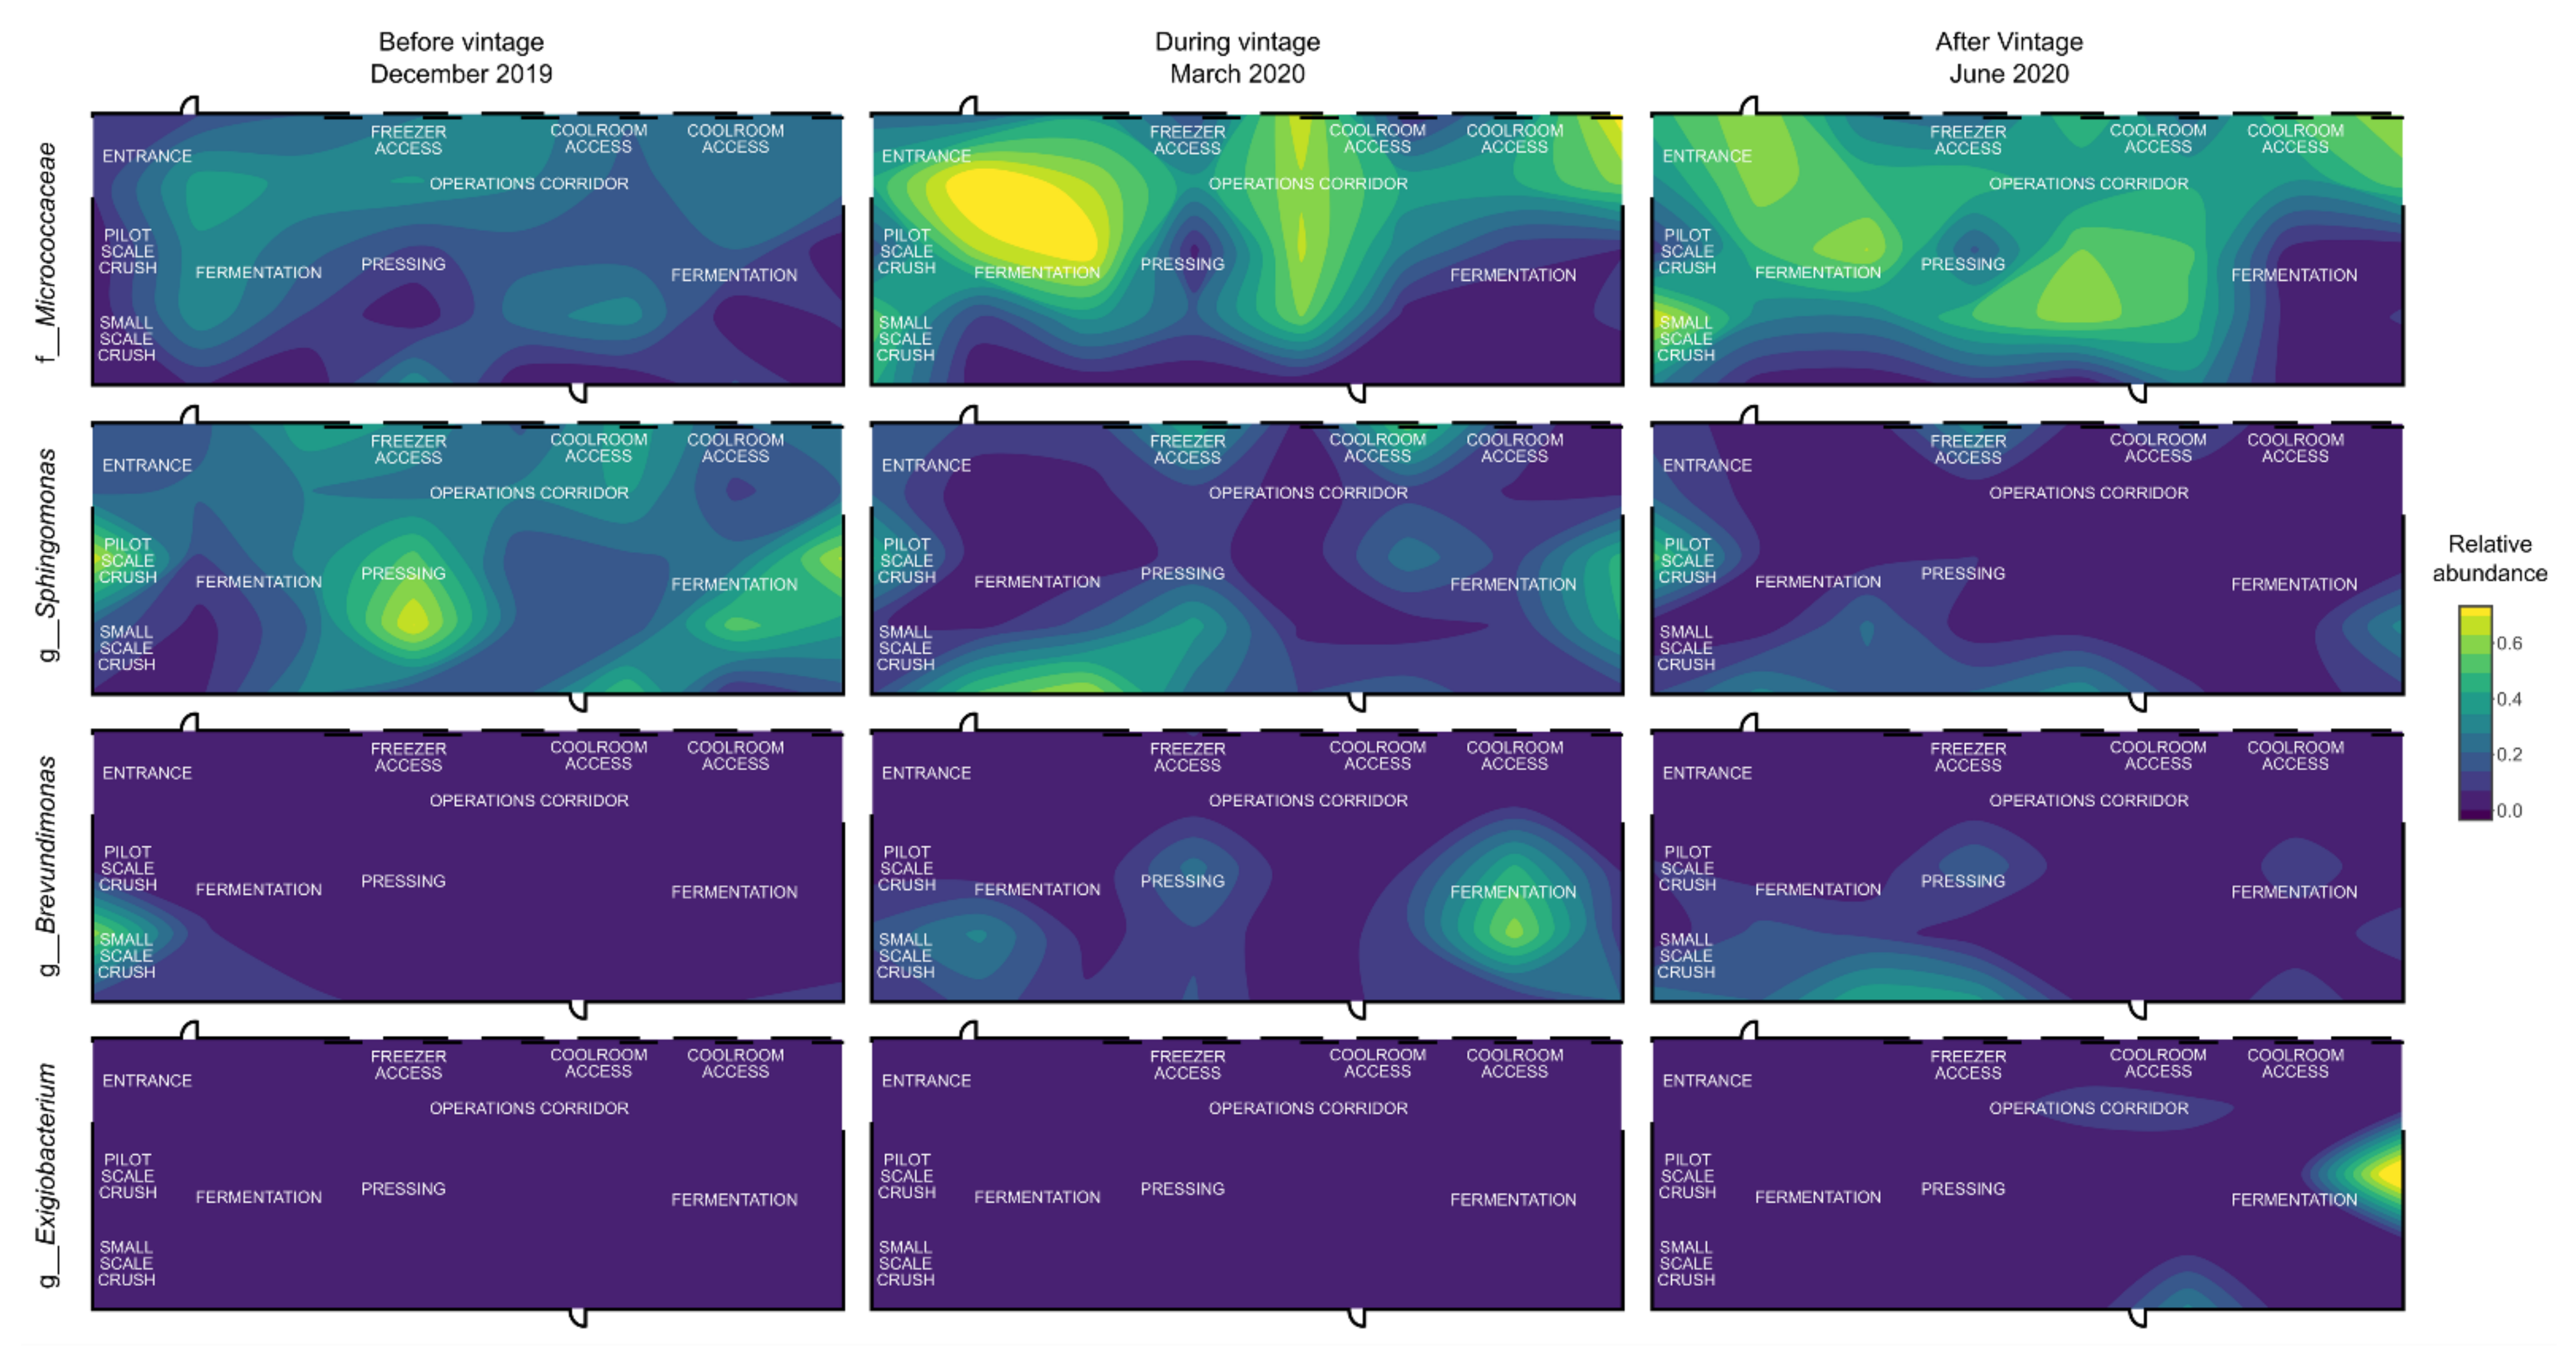
Mapping of the most abundant bacterial taxonomies to the winery floor plan is shown in Figure 4. The family Micrococcaceae was found in most locations in the winery operations area before, during and after vintage. Relative abundance increased considerably during vintage, particularly close to the entrance and on the operations corridor, and remained relatively high after vintage. The genus Sphingomonas was well distributed across the winery before vintage with high abundance in the pilot scale crush and pressing areas (Figure 4). Sphingomonas relative abundance and winery area coverage decreased during and after vintage, to be found mainly close to the winery walls. The genus Brevundimonas was only found in the small-scale crush area before vintage. Increased abundance was found during vintage in one of the fermentation areas, and in the pressing and on the second fermentation areas. Relative abundance for Brevundimonas decreased after vintage in all these areas (Figure 4). The genus Exigiobacterium was only found after vintage, mainly on the right wall of the winery showing very high abundance (Figure 4).
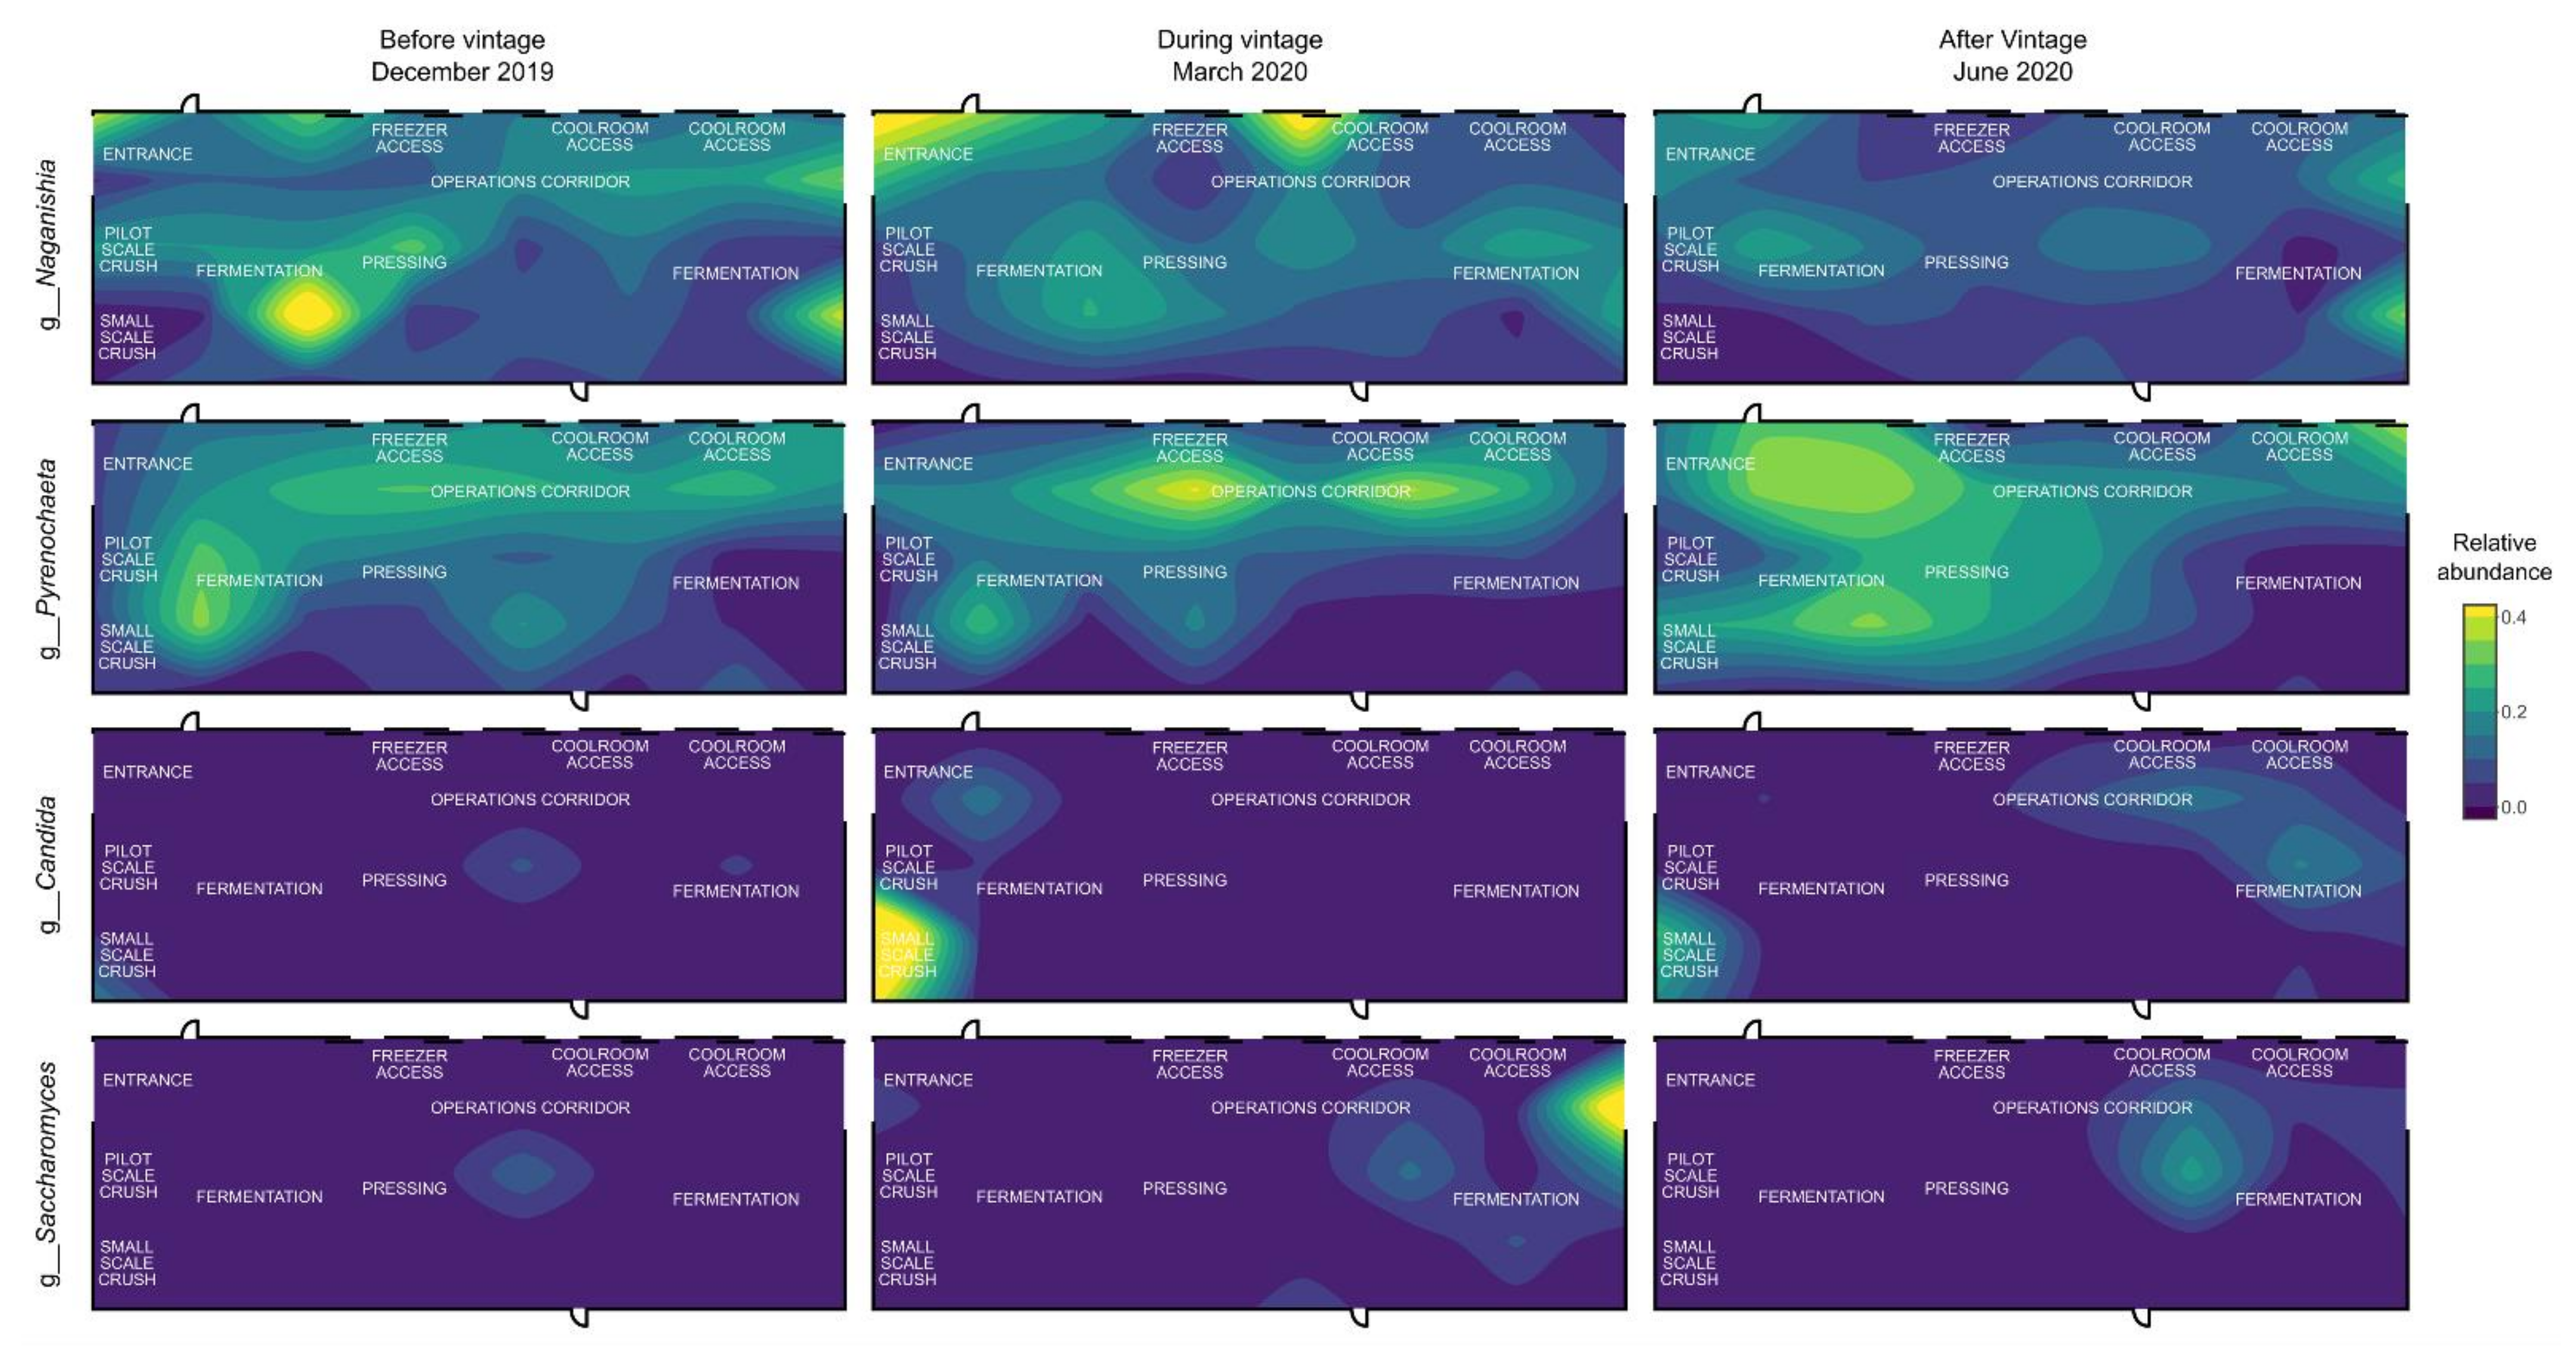
The fungal genera Naganishia and Pyrenochaeta were found ubiquitously in the winery before, during and after vintage (Figure 5). Relative abundance for both genera changed over time. Naganishia relative abundance during vintage increased on the entrance to the winery and close to one of the cool rooms. Pyrenochaeta abundance increased on the operations corridor (Figure 5). The genus Candida showed high abundance during vintage in the small-scale crushing area, suggesting a link to grape material, abundance in this area decreased after vintage. Similarly, Saccharomyces showed high abundance during vintage in the exit to the operations area which could be due to wine spillage (Figure 5).
The bacterial genera Leuconostoc and Oenococcus, which are associated with winemaking, showed very low abundance across all sampling dates (Figure S5). Whereas Leuconostoc was only found after vintage on the right wall of the winery, Oenococcus was associated with the different fermentation areas depending on sampling date. Some of the fungal genera associated with winemaking also showed differences in distribution depending on sampling date (Figure S6). The genus Metschnikowia was mainly found during vintage in the fermentation and pressing areas. Aureobasidium was found in one of the fermentation areas before vintage and on the bottom wall of the winery during vintage. Hanseniaspora showed increased relative abundance during vintage in one of the fermentation areas, whereas Torulaspora was mainly found after vintage with increased abundance close to the cool rooms and in one of the fermentation areas (Figure S6).
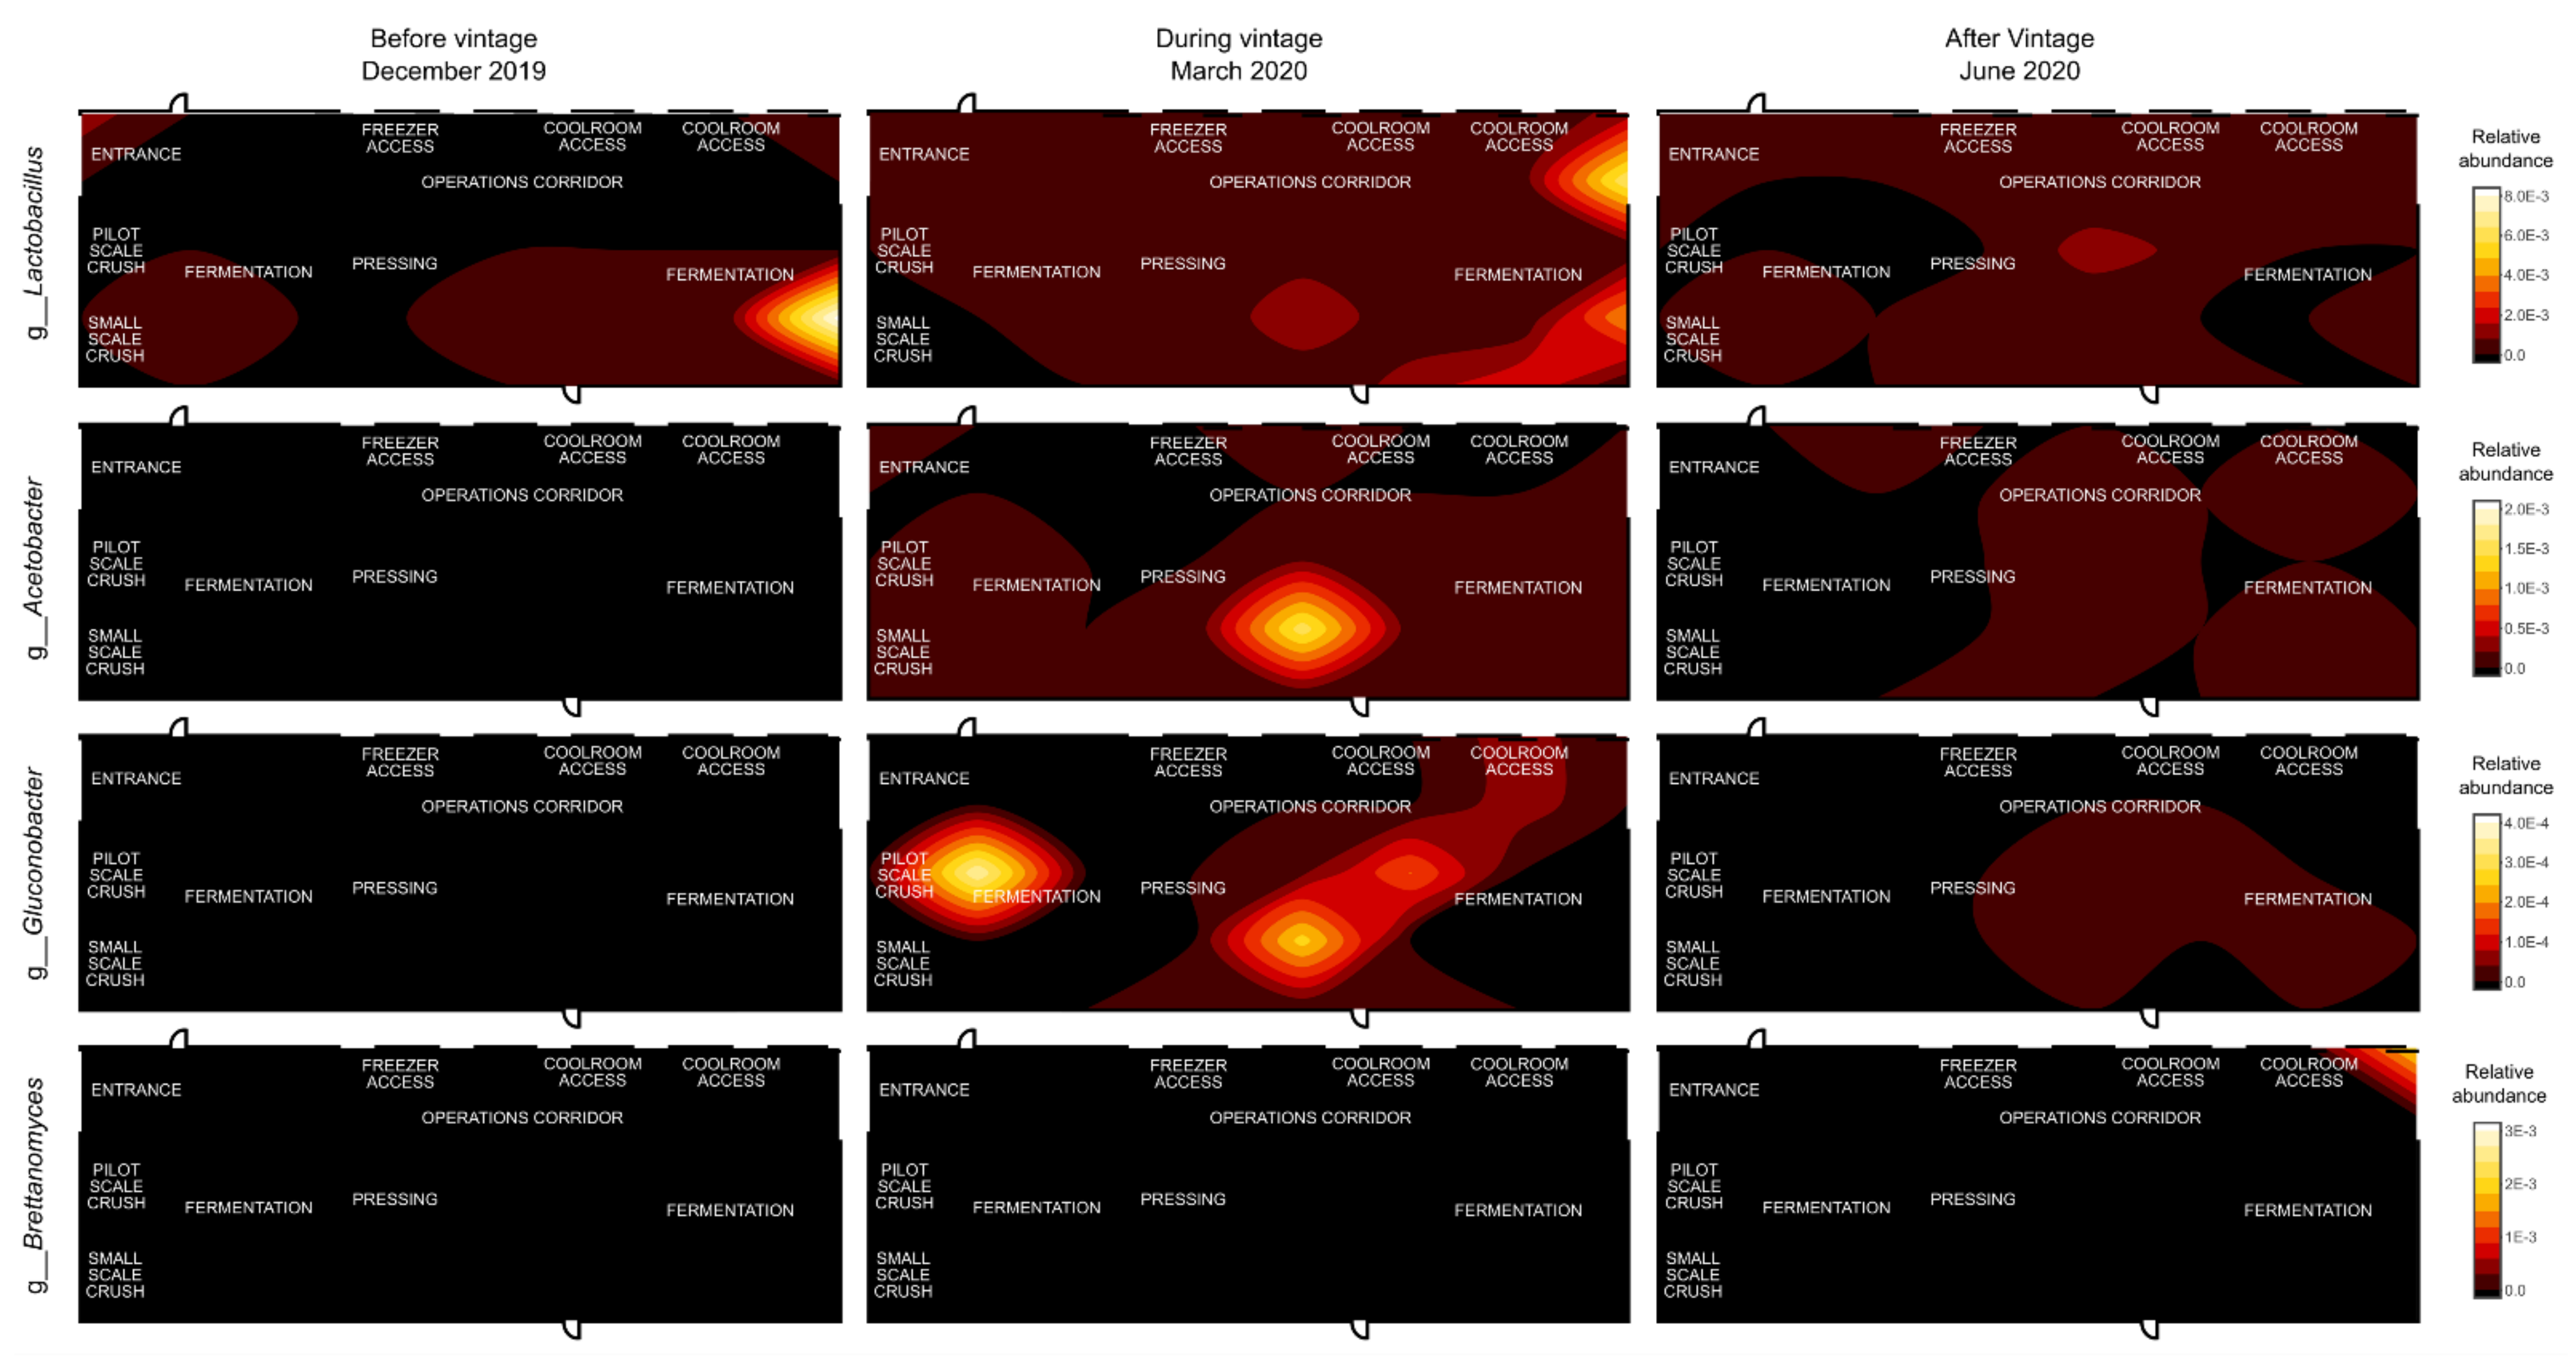
Wine spoilage microorganisms, including the genera Lactobacillus, Acetobacter, Gluconobacter and Brettanomyces showed very low relative abundance when mapped to the winery floor plan (Figure 6). Lactobacillus was the only spoilage microorganism found before vintage. All three spoilage bacteria, Lactobacillus, Acetobacter and Gluconobacter, showed increased abundance during vintage with each microorganism associated with different areas (Figure 6). Relative abundance for all three spoilage bacteria decreased noticeably after vintage. Brettanomyces was only found after vintage in the top right corner of the winery (Figure 6).

4. Discussion

Food processing facilities, like any other environment, contain thriving microbial ecosystems whose population structure is niche dependent [6]. These niches are colonised when they are exposed to raw substrates or other materials, then nutrient availability and production practices shape the growth and persistence of colonising microorganisms [6]. The winery environment is no exception, grapes bring into the winery different bacterial and fungal populations, depending on variety, origin and harvesting practices [53,54], which will then come in contact with winery surfaces, including crushers, pressers, floors, walls, fermentation vessels and barrels. These different winery surfaces show clear niche specialisation, with different microbial genera dominating each niche [19].
In this work we studied the microbial populations found on one particular winery niche, the winery floor. Microbial structure changed according to sampling time and location within the winery. Changes in the winery microbiome across time and winery equipment have been reported previously, highlighting the seasonal nature of the winemaking process [7,19]. Vintage, the period when grapes are being processed in the winery, caused most of the changes in microbial structure, particularly for bacterial populations. Thus, bacterial diversity indices and relative abundance for bacterial terminal taxonomies were both affected by vintage. Major changes in bacterial population structure during vintage have been reported previously, with aerobic bacteria, such as Pseudomonas, Flavobacterium, Enterobacteraceae, Brevundimonas and Bacillus dominating winery surfaces before vintage, whereas Sphingomonas, Methylobacterium and Nakamurellaceae dominated during vintage [19]. Although fungal communities also changed during vintage, these changes were smaller than those observed for bacterial populations. The exception being Saccharomycetes which showed approximately four-times higher relative abundance during vintage than prior to this period. Absolute abundance for both fungal and bacterial communities during vintage have been shown to increase significantly on all grape processing equipment compared to pre-harvest levels [19]. Although we did not determine the total bacterial or yeast cell concentrations, our results confirm that grape material is stimulating the growth of some microbial populations.
Different niches within the winery have been associated with particular microbial populations, but each ecosystem is subject to seasonal flux due to harvest disruption [19]. Thus, samples from similar surfaces, i.e., crush equipment, fermentation vessels, etc. showed comparable microbial populations, distinguishing them from other environments [7,19]. Winery floors and walls have been shown to have significant populations of Saccharomyces, Candida and Cryptococcus, as well as the fungi Aspergillus, Penicillium and Exophiala [7,19]. In this work, Naganishia, Pyrenochaeta and Didymella were the most abundant fungal populations found in the winery. As several Cryptococcus species are now classified as Naganishia [55], it is likely that changes in species databases explain some of the different abundances found for this genera in previous studies. Naganishia species are among the most resistant organisms to UV radiation, they show adaptation to low pH values and the ability to grow at temperatures below 0°C [56]. This last trait could explain the high relative abundance of this genera close to the cold room entrance. Pyrenochaeta species are mainly plant pathogens, including maize, tomato, eggplant and lettuce, and can survive in a broad range of pH, temperatures, and soil types [57,58]. Didymella species are also plant pathogens, attacking the cucurbits, including cucumber, pumpkin and zucchini [59]. Although Pyrenochaeta and Didymella have been found in other wineries [7,19], there are no reports associating either of them with grapevines, suggesting a source other than grape material. Indeed, other fungal genera which are associated with plants, soil, water and/or decaying wood material, such as Exophiala and Hannaella, can find their way into the winery [7].
Comparing the microbial communities found in this study to those observed in other fermented food and beverage facilities, revealed an association between community structure and substrate/facility. Indeed, previous studies have suggested the presence of distinct microbial niches in food facilities and highlighted the role of manufacturing practices in shaping microbial structure [4,5,15,16]. Thus, the microbiota in cheese making facilities has been shown to be dominated by microorganisms deliberately inoculated, including Lactococcus lactis, Debaryomyces hansenii and Penicillium camemberti [4], or when no starter is added, as is the case for Ragusano cheese, microorganisms from the wooden vat biofilm are then responsible for cheese fermentation [16]. Additionally, different bacterial genera have been found associated to different cheese types within the same facility [15]. In breweries it has been suggested that the distribution of the bacterial and fungal populations is driven by the raw materials used in the brewing process [5]. In the case of traditional lambic beer production where the wort is spontaneously fermented, the brewery environment, including the air and the wooden barrels used for the fermentation and maturation process, has been suggested as the source of the microbiota responsible for the production of this type of beer [14,60].
Although similar microbial genera were found in the wineries compared in this work, each showed distinct microbial population structures. Besides being located in different continents and having different climatic conditions, these wineries have different sizes (from approximately 600 to 2000 m2) and source different grape varieties, including Pinot Noir and Chardonnay in France, Cabernet Sauvignon, Barbera and Zinfandel in the US, and Chardonnay, Cabernet Sauvignon and Shiraz in Australia [7,19]. Although the main source for the winery microbiota is grape material, microorganisms found in food and beverage facilities can also originate from humans or other environmental sources [6]. It is possible that all these factors play a role in shaping microbial population structure in the three wineries analysed.
Several wine spoilage microorganisms were detected and mapped to specific locations within the winery mainly during and after vintage. Food production facilities are routinely tested for the presence of pathogens and spoilage microorganisms, with specific focus on particular species or phenotypes [6]. However, standard targeted and culture-based methods can fail at detecting these organisms [6,61]. In these cases, metagenomic approaches provide crucial information to identify such microorganisms [61]. Based on the near absence of spoilage-related microorganisms before vintage, it has been suggested that winery surfaces do not contain wine spoilage organisms under normal operating conditions, and that this is the result of microbial resident communities protecting against colonization by spoilage microorganisms [19]. Indeed, competitive exclusion, the process by which species competing for identical resources are not able to coexist, has been successfully trialled in a poultry processing plant eliminating the pathogen Listeria monocytogenes in five of the six drains treated, which remained free of this pathogen for 13 weeks after treatment [62]. Thus, it has been suggested that surfaces within food processing facilities can be inoculated with organisms that prevent colonisation by pathogenic or spoilage microorganisms [6]. This may be particularly useful in cases when pathogens can survive the cleaning treatments implemented in the processing facility [17].
Many yeast species, including S. cerevisiae and non-Saccharomyces yeasts, in addition to the spoilage microorganisms Brettanomyces and Zygosaccharomyces have been shown to persist in the cellar over consecutive vintages [7,22,63]. Indeed, some of these yeasts can ‘inoculate’ fresh grape must in the winery and be part of the wine fermentation process [22,63]. Transfers of microorganisms between different surfaces can occur by direct contact, air flow and bioaerosols, which can transport whole organisms, spores, biopolymers, plant debris and decaying biomass [64]. Thus, the resident microorganisms in the winery can not only shape the microbiota during fermentation, but also alter the appearance, aroma, and flavour of wine.
In summary, we have shown that microbial communities inhabiting an Australian winery changed over time and space, and that some populations persisted over several months. Mapping microbial populations to the winery floor enabled identification of the locations where spoilage microorganisms reside. These locations should be targeted with effective cleaning procedures to reduce the risk of wine spoilage. Metagenomic techniques are therefore a powerful tool, wineries may use to evaluate their resident microbial communities and to assess their sanitation practices.

Supplementary Materials

The following are available online at https://www.mdpi.com/article/10.3390/fermentation7030134/s1. Figure S1: Boxplots showing relative abundance for the most abundant bacterial phyla and for the 20 most abundant bacterial final taxonomies. Figure S2: Boxplots showing relative abundance for the most abundant fungal classes and for the 20 most abundant fungal genera. Figure S3: Relative abundance for the most abundant bacterial final taxonomies found at the Hickinbotham Roseworthy Wine Science Laboratory according to location and sampling date. Figure S4: Relative abundance for the most abundant fungal genera found at the Hickinbotham Roseworthy Wine Science Laboratory according to location and sampling date. Figure S5: Mapping of the wine-related bacterial genera Leuconostoc and Oenoccocus, before, during and after vintage. Figure S6: Mapping of the wine-related fungal genera Metschnikowia, Aureobasidium, Hanseniaspora and Torulaspora, before, during and after vintage. Table S1: Abundance for bacterial OTUs. Table S2: Abundance for fungal OTUs. Table S3: Relative abundance (%) for bacterial phyla found at the Hickinbotham Roseworthy Wine Science Laboratory according to sampling date. Table S4: Relative abundance (%) for the top 20 bacterial terminal taxonomies found at the Hickinbotham Roseworthy Wine Science Laboratory according to sampling date. Table S5: Relative abundance (%) for fungal classes found at the Hickinbotham Roseworthy Wine Science Laboratory according to sampling date. Table S6: Relative abundance (%) for the top 20 fungal genera found at the Hickinbotham Roseworthy Wine Science Laboratory according to sampling date.

Author Contributions

Conceptualization, C.V. and A.B.; methodology, K.C. and C.V.; formal analysis, C.V. and A.B.; writing—original draft preparation, C.V.; writing—review and editing, all authors. All authors have read and agreed to the published version of the manuscript.

Funding

The AWRI is supported by Australia’s grape growers and winemakers through their investment body Wine Australia with matching funds from the Australian Government.

Institutional Review Board Statement

Not applicable.

Informed Consent Statement

Not applicable.

Data Availability Statement

Raw reads are available from the BioProject website (accession number PRJNA742433).

Acknowledgments

The authors would like to thank Paul Grbin for providing access to the winery and Nicholas Bokulich and Pietro D’Addabbo for providing the phylotyping data. The AWRI is a member of the Wine Innovation Cluster in Adelaide.

Conflicts of Interest

The authors declare that they have no conflicts of interest.

References

  1. McGovern, P.E.; Zhang, J.; Tang, J.; Zhang, Z.; Hall, G.R.; Moreau, R.; Nunez, A.; Butrym, E.D.; Richards, M.P.; Wang, C.S.; et al. Fermented beverages of pre- and proto-historic China. Proc. Natl. Acad. Sci. USA 2004, 101, 17593–17598. [Google Scholar] [CrossRef] [PubMed] [Green Version]
  2. Tamang, J.P.; Holzapfel, W.H.; Shin, D.H.; Felis, G.E. Microbiology of ethnic fermented foods and alcoholic beverages of the world. Front. Microbiol. 2017, 8, 1377. [Google Scholar] [CrossRef] [PubMed] [Green Version]
  3. Amato, K.R.; Chaves, O.M.; Mallott, E.K.; Eppley, T.M.; Abreu, F.; Baden, A.L.; Barnett, A.A.; Bicca-Marques, J.C.; Boyle, S.A.; Campbell, C.J.; et al. Fermented food consumption in wild nonhuman primates and its ecological drivers. Am. J. Phys. Anthropol. 2021, 175, 513–530. [Google Scholar] [CrossRef]
  4. Bokulich, N.A.; Mills, D.A. Facility-specific “house” microbiome drives microbial landscapes of artisan cheesemaking plants. Appl. Environ. Microbiol. 2013, 79, 5214–5223. [Google Scholar] [CrossRef] [Green Version]
  5. Bokulich, N.A.; Bergsveinson, J.; Ziola, B.; Mills, D.A. Mapping microbial ecosystems and spoilage-gene flow in breweries highlights patterns of contamination and resistance. elife 2015, 4, e04634. [Google Scholar] [CrossRef]
  6. Doyle, C.J.; O’Toole, P.W.; Cotter, P.D. Metagenome-based surveillance and diagnostic approaches to studying the microbial ecology of food production and processing environments. Environ. Microbiol. 2017, 19, 4382–4391. [Google Scholar] [CrossRef] [PubMed] [Green Version]
  7. Abdo, H.; Catacchio, C.R.; Ventura, M.; D’Addabbo, P.; Alexandre, H.; Guilloux-Benatier, M.; Rousseaux, S. The establishment of a fungal consortium in a new winery. Sci. Rep. 2020, 10, 7962. [Google Scholar] [CrossRef]
  8. Einson, J.E.; Rani, A.; You, X.M.; Rodriguez, A.A.; Randell, C.L.; Barnaba, T.; Mammel, M.K.; Kotewicz, M.L.; Elkins, C.A.; Sela, D.A. A vegetable fermentation facility hosts distinct microbiomes reflecting the production environment. Appl. Environ. Microbiol. 2018, 84, e01680-18. [Google Scholar] [CrossRef] [PubMed] [Green Version]
  9. Zwirzitz, B.; Wetzels, S.U.; Dixon, E.D.; Stessl, B.; Zaiser, A.; Rabanser, I.; Thalguter, S.; Pinior, B.; Roch, F.F.; Strachan, C.; et al. The sources and transmission routes of microbial populations throughout a meat processing facility. Npj Biofilms Microbiomes 2020, 6, 26. [Google Scholar] [CrossRef]
  10. Chacon-Vargas, K.; Torres, J.; Giles-Gomez, M.; Escalante, A.; Gibbons, J.G. Genomic profiling of bacterial and fungal communities and their predictive functionality during pulque fermentation by whole-genome shotgun sequencing. Sci. Rep. 2020, 10, 15115. [Google Scholar] [CrossRef] [PubMed]
  11. Jung, M.J.; Nam, Y.D.; Roh, S.W.; Bae, J.W. Unexpected convergence of fungal and bacterial communities during fermentation of traditional Korean alcoholic beverages inoculated with various natural starters. Food Microbiol. 2012, 30, 112–123. [Google Scholar] [CrossRef]
  12. Varela, C.; Sundstrom, J.; Cuijvers, K.; Jiranek, V.; Borneman, A. Discovering the indigenous microbial communities associated with the natural fermentation of sap from the cider gum Eucalyptus gunnii. Sci. Rep. 2020, 10, 14716. [Google Scholar] [CrossRef]
  13. Bokulich, N.A.; Bamforth, C.W.; Mills, D.A. Brewhouse-resident microbiota are responsible for multi-stage fermentation of American coolship ale. PLoS ONE 2012, 7, e35507. [Google Scholar] [CrossRef] [PubMed]
  14. Spitaels, F.; Wieme, A.D.; Janssens, M.; Aerts, M.; Daniel, H.-M.; Van Landschoot, A.; De Vuyst, L.; Vandamme, P. The microbial diversity of traditional spontaneously fermented lambic beer. PLoS ONE 2014, 9, e95384. [Google Scholar] [CrossRef] [PubMed]
  15. Calasso, M.; Ercolini, D.; Mancini, L.; Stellato, G.; Minervini, F.; Di Cagno, R.; De Angelis, M.; Gobbetti, M. Relationships among house, rind and core microbiotas during manufacture of traditional Italian cheeses at the same dairy plant. Food Microbiol. 2016, 54, 115–126. [Google Scholar] [CrossRef]
  16. Lortal, S.; Di Blasi, A.; Madec, M.N.; Pediliggieri, C.; Tuminello, L.; Tanguy, G.; Fauquant, J.; Lecuona, Y.; Campo, P.; Carpino, S.; et al. Tina wooden vat biofilm: A safe and highly efficient lactic acid bacteria delivering system in PDO Ragusano cheese making. Int. J. Food Microbiol. 2009, 132, 1–8. [Google Scholar] [CrossRef]
  17. Hultman, J.; Rahkila, R.; Ali, J.; Rousu, J.; Björkroth, K.J. Meat processing plant microbiome and contamination patterns of cold-tolerant bacteria causing food safety and spoilage risks in the manufacture of vacuum-packaged cooked sausages. Appl. Environ. Microbiol. 2015, 81, 7088–7097. [Google Scholar] [CrossRef] [Green Version]
  18. Spescha, C.; Stephan, R.; Zweifel, C. Microbiological contamination of pig carcasses at different stages of slaughter in two European Union-approved abattoirs. J. Food Prot. 2006, 69, 2568–2575. [Google Scholar] [CrossRef]
  19. Bokulich, N.A.; Ohta, M.; Richardson, P.M.; Mills, D.A. Monitoring seasonal changes in winery-resident microbiota. PLoS ONE 2013, 8, e66437. [Google Scholar] [CrossRef]
  20. Morrison-Whittle, P.; Goddard, M.R. Quantifying the relative roles of selective and neutral processes in defining eukaryotic microbial communities. ISME J. 2015, 9, 2003–2011. [Google Scholar] [CrossRef] [PubMed] [Green Version]
  21. Taylor, M.W.; Tsai, P.; Anfang, N.; Ross, H.A.; Goddard, M.R. Pyrosequencing reveals regional differences in fruit-associated fungal communities. Environ. Microbiol. 2014, 16, 2848–2858. [Google Scholar] [CrossRef] [Green Version]
  22. Grangeteau, C.; Gerhards, D.; von Wallbrunn, C.; Alexandre, H.; Rousseaux, S.; Guilloux-Benatier, M. Persistence of two non-Saccharomyces yeasts (Hanseniaspora and Starmerella) in the cellar. Front. Microbiol. 2016, 7, 268. [Google Scholar] [CrossRef] [PubMed]
  23. Ocon, E.; Gutierrez, A.R.; Garijo, P.; Lopez, R.; Santamaria, P. Presence of non-Saccharomyces yeasts in cellar equipment and grape juice during harvest time. Food Microbiol. 2010, 27, 1023–1027. [Google Scholar] [CrossRef]
  24. Pérez-Martín, F.; Seseña, S.; Fernández-González, M.; Arévalo, M.; Palop, M.L. Microbial communities in air and wine of a winery at two consecutive vintages. Int. J. Food Microbiol. 2014, 190, 44–53. [Google Scholar] [CrossRef] [PubMed]
  25. Sabate, J.; Cano, J.; Esteve-Zarzoso, B.; Guillamon, J.M. Isolation and identification of yeasts associated with vineyard and winery by RFLP analysis of ribosomal genes and mitochondrial DNA. Microbiol. Res. 2002, 157, 267–274. [Google Scholar] [CrossRef] [PubMed]
  26. Varela, C.; Borneman, A.R. Yeasts found in vineyards and wineries. Yeast 2017, 34, 111–128. [Google Scholar] [CrossRef]
  27. Curtin, C.; Varela, C.; Borneman, A. Harnessing improved understanding of Brettanomyces bruxellensis biology to mitigate the risk of wine spoilage. Aust. J. Grape Wine Res. 2015, 21, 680–692. [Google Scholar] [CrossRef]
  28. Loureiro, V.; Malfeito-Ferreira, M. Spoilage yeasts in the wine industry. Int. J. Food Microbiol. 2003, 86, 23–50. [Google Scholar] [CrossRef]
  29. Ribéreau-Gayón, P.; Dubourdieu Donéche, D.B.; Lonvaud, A. Red winemaking. In Handbook of Enology; Ribéreau-Gayón, P., Ed.; John Wiley & Sons, Ltd.: Chichester, UK, 2006. [Google Scholar]
  30. Alston, J.M.; Arvik, T.; Hart, J.; Lapsley, J.T. Brettanomics I: The cost of Brettanomyces in California wine production. J. Wine Econ. 2021, 16, 4–31. [Google Scholar] [CrossRef]
  31. Parker, M.; Onetto, C.; Hixson, J.; Bilogrevic, E.; Schueth, L.; Pisaniello, L.; Borneman, A.; Herderich, M.; de Barros Lopes, M.; Francis, L. Factors contributing to interindividual variation in retronasal odor perception from aroma glycosides: The tole of odorant sensory detection threshold, oral microbiota, and hydrolysis in saliva. J. Agric. Food Chem. 2019, 68, 10299–10309. [Google Scholar] [CrossRef]
  32. Bokulich, N.A.; Mills, D.A. Improved selection of internal transcribed spacer-specific primers enables quantitative, ultra-high-throughput profiling of fungal communities. Appl. Environ. Microbiol. 2013, 79, 2519–2526. [Google Scholar] [CrossRef] [PubMed] [Green Version]
  33. Bolger, A.M.; Lohse, M.; Usadel, B. Trimmomatic: A flexible trimmer for Illumina sequence data. Bioinformatics 2014, 30, 2114–2120. [Google Scholar] [CrossRef] [Green Version]
  34. Martin, M. Cutadapt removes adapter sequences from high-throughput sequencing reads. EMBnet J. 2011, 17, 1. [Google Scholar] [CrossRef]
  35. Magoc, T.; Salzberg, S.L. FLASH: Fast length adjustment of short reads to improve genome assemblies. Bioinformatics 2011, 27, 2957–2963. [Google Scholar] [CrossRef] [PubMed]
  36. Edgar, R.C. Search and clustering orders of magnitude faster than BLAST. Bioinformatics 2010, 26, 2460–2461. [Google Scholar] [CrossRef] [Green Version]
  37. Mahe, F.; Rognes, T.; Quince, C.; de Vargas, C.; Dunthorn, M. Swarm: Robust and fast clustering method for amplicon-based studies. Peer J. 2014, 2, e593. [Google Scholar] [CrossRef] [PubMed] [Green Version]
  38. Sternes, P.R.; Lee, D.; Kutyna, D.R.; Borneman, A.R. A combined meta-barcoding and shotgun metagenomic analysis of spontaneous wine fermentation. bioRxiv 2017, 6, gix040. [Google Scholar] [CrossRef] [Green Version]
  39. Caporaso, J.G.; Kuczynski, J.; Stombaugh, J.; Bittinger, K.; Bushman, F.D.; Costello, E.K.; Fierer, N.; Pena, A.G.; Goodrich, J.K.; Gordon, J.I.; et al. QIIME allows analysis of high-throughput community sequencing data. Nat. Methods 2010, 7, 335–336. [Google Scholar] [CrossRef] [Green Version]
  40. McMurdie, P.J.; Holmes, S. phyloseq: An R package for reproducible interactive analysis and graphics of microbiome census data. PLoS ONE 2013, 8, e61217. [Google Scholar] [CrossRef] [Green Version]
  41. Lahti, L.; Shetty, S. Tools for Microbiome Analysis in R. Version 1.9.1. Available online: http://microbiome.github.com/microbiome (accessed on 30 June 2019).
  42. Oksanen, J.; Blanchet, G.; Friendly, M.; Kindt, R.; Legendre, P.; McGlinn, D.; Minchin, P.; O’Hara, R.; Simpson, G.; Solymos, P.; et al. Vegan: Community Ecology Package. R Package Version 2.5.4. Available online: https://CRAN.R-project.org/package=vegan (accessed on 30 June 2019).
  43. Li, C.; Yu, G.; Zhu, C. microbiomeviz—An R Package for Visualizing Microbiome Data. Available online: https://github.com/lch14forever/microbiomeViz (accessed on 30 June 2019).
  44. Dash Enterprise, Collaborative Data Science. Available online: https://plot.ly (accessed on 30 June 2019).
  45. Yu, G.; Smith, D.; Zhu, H.; Guan, Y.; Lam, T.T. ggtree: An R package for visualization and annotation of phylogenetic trees with their covariates and other associated data. Methods. Ecol. Evol. 2017, 8, 28–36. [Google Scholar] [CrossRef]
  46. Xu, S.; Yu, G. ggtreeExtra: An R Package to Add Geom Layers on Circular or Other Layout Tree of “ggtree”. Available online: https://github.com/YuLab-SMU/ggtreeExtra/ (accessed on 30 June 2019).
  47. Kassambara, A. ggpubr: ‘ggplot2’ Based Publication Eady Plots. R Package Version 0.2. Available online: https://CRAN.R-project.org/package=ggpubr (accessed on 30 June 2019).
  48. Wickham, H. ggplot2: Elegant Graphics for Data Analysis; Springer: New York, NY, USA, 2009. [Google Scholar]
  49. Matplotlib. Default Color Maps from ‘Matplotlib’. Available online: https://github.com/sjmgarnier/viridis (accessed on 30 November 2020).
  50. R Core Team. R: A Language and Environment for Statistical Computing. Available online: http://www.R-project.org/ (accessed on 30 June 2019).
  51. Shetty, S.; Lahti, L. Microbiomeutilities: An R Package with Utility Functions for The Microbiome R Package. Available online: https://github.com/microsud/microbiomeutilities-shiny (accessed on 30 June 2019).
  52. Abdo, H.; Catacchio, C.R.; Ventura, M.; D’Addabbo, P.; Calabrese, F.M.; Laurent, J.; David-Vaizant, V.; Alexandre, H.; Guilloux-Benatier, M.; Rousseaux, S. Colonization of wild Saccharomyces cerevisiae strains in a new winery. Beverages 2020, 6, 9. [Google Scholar] [CrossRef] [Green Version]
  53. Bokulich, N.A.; Thorngate, J.H.; Richardson, P.M.; Mills, D.A. Microbial biogeography of wine grapes is conditioned by cultivar, vintage, and climate. Proc. Natl. Acad. Sci. USA 2014, 111, E139–E148. [Google Scholar] [CrossRef] [PubMed] [Green Version]
  54. Fleet, G.H.; Heard, G.M. Yeasts: Growth during fermentation. In Wine Microbiology and Biotechnology; Fleet, G.H., Ed.; Harwood Academic: Chur, Switzerland, 1993; pp. 27–54. [Google Scholar]
  55. Liu, X.Z.; Wang, Q.M.; Göker, M.; Groenewald, M.; Kachalkin, A.V.; Lumbsch, H.T.; Millanes, A.M.; Wedin, M.; Yurkov, A.M.; Boekhout, T.; et al. Towards an integrated phylogenetic classification of the Tremellomycete. Stud. Mycol. 2015, 81, 85–147. [Google Scholar] [CrossRef] [Green Version]
  56. Schmidt, S.K.; Vimercati, L.; Darcy, J.L.; Arán, P.; Gendron, E.M.S.; Solon, A.J.; Porazinska, D.; Dorador, C.A. Naganishia in high places: Functioning populations or dormant cells from the atmosphere? Mycology 2017, 8, 153–163. [Google Scholar] [CrossRef] [Green Version]
  57. Infantino, A.; Aragona, M.; Brunetti, A.; Lahoz, E.; Oliva, A.; Porta-Puglia, A. Molecular and physiological characterization of Italian isolates of Pyrenochaeta lycopersici. Mycol. Res. 2003, 107, 707–716. [Google Scholar] [CrossRef] [PubMed]
  58. Lević, J.; Stanković, S.; Krnjaja, V.; Bočarov-Stančić, A. Simple and efficient method for detection and identification of Pyrenochaeta terrestris on maize root. Crop. Prot. 2012, 38, 66–71. [Google Scholar] [CrossRef]
  59. Keinath, A.P. From native plants in central Europe to cultivated crops worldwide: The emergence of Didymella bryoniae as a cucurbit pathogen. HortScience 2011, 46, 532. [Google Scholar] [CrossRef] [Green Version]
  60. De Roos, J.; Van der Veken, D.; De Vuyst, L. The interior surfaces of wooden barrels are an additional microbial inoculation source for lambic beer production. Appl. Environ. Microbiol. 2019, 85, e02226-18. [Google Scholar] [CrossRef] [Green Version]
  61. Quigley, L.; O’Sullivan, D.J.; Daly, D.; O’Sullivan, O.; Burdikova, Z.; Vana, R.; Beresford, T.P.; Ross, R.P.; Fitzgerald, G.F.; McSweeney, P.L.H.; et al. Thermus and the pink discoloration defect in cheese. mSystems 2016, 1, e00023-16. [Google Scholar] [CrossRef] [Green Version]
  62. Zhao, T.; Podtburg, T.C.; Zhao, P.; Chen, D.; Baker, D.A.; Cords, B.; Doyle, M.P. Reduction by competitive bacteria of Listeria monocytogenes in biofilms and Listeria bacteria in floor drains in a ready-to-eat poultry processing plant. J. Food Prot. 2013, 76, 601–607. [Google Scholar] [CrossRef]
  63. Santamaría, P.; Garijo, P.; López, R.; Tenorio, C.; Rosa Gutiérrez, A. Analysis of yeast population during spontaneous alcoholic fermentation: Effect of the age of the cellar and the practice of inoculation. Int J. Food Microbiol. 2005, 103, 49–56. [Google Scholar] [CrossRef] [PubMed]
  64. Theisinger, S.M.; de Smidt, O. Bioaerosols in the food and beverage industry. In Ideas and Applications toward Sample Preparation for Food and Beverage Analysis; InTech: Rijeka, Croatia, 2017. [Google Scholar]
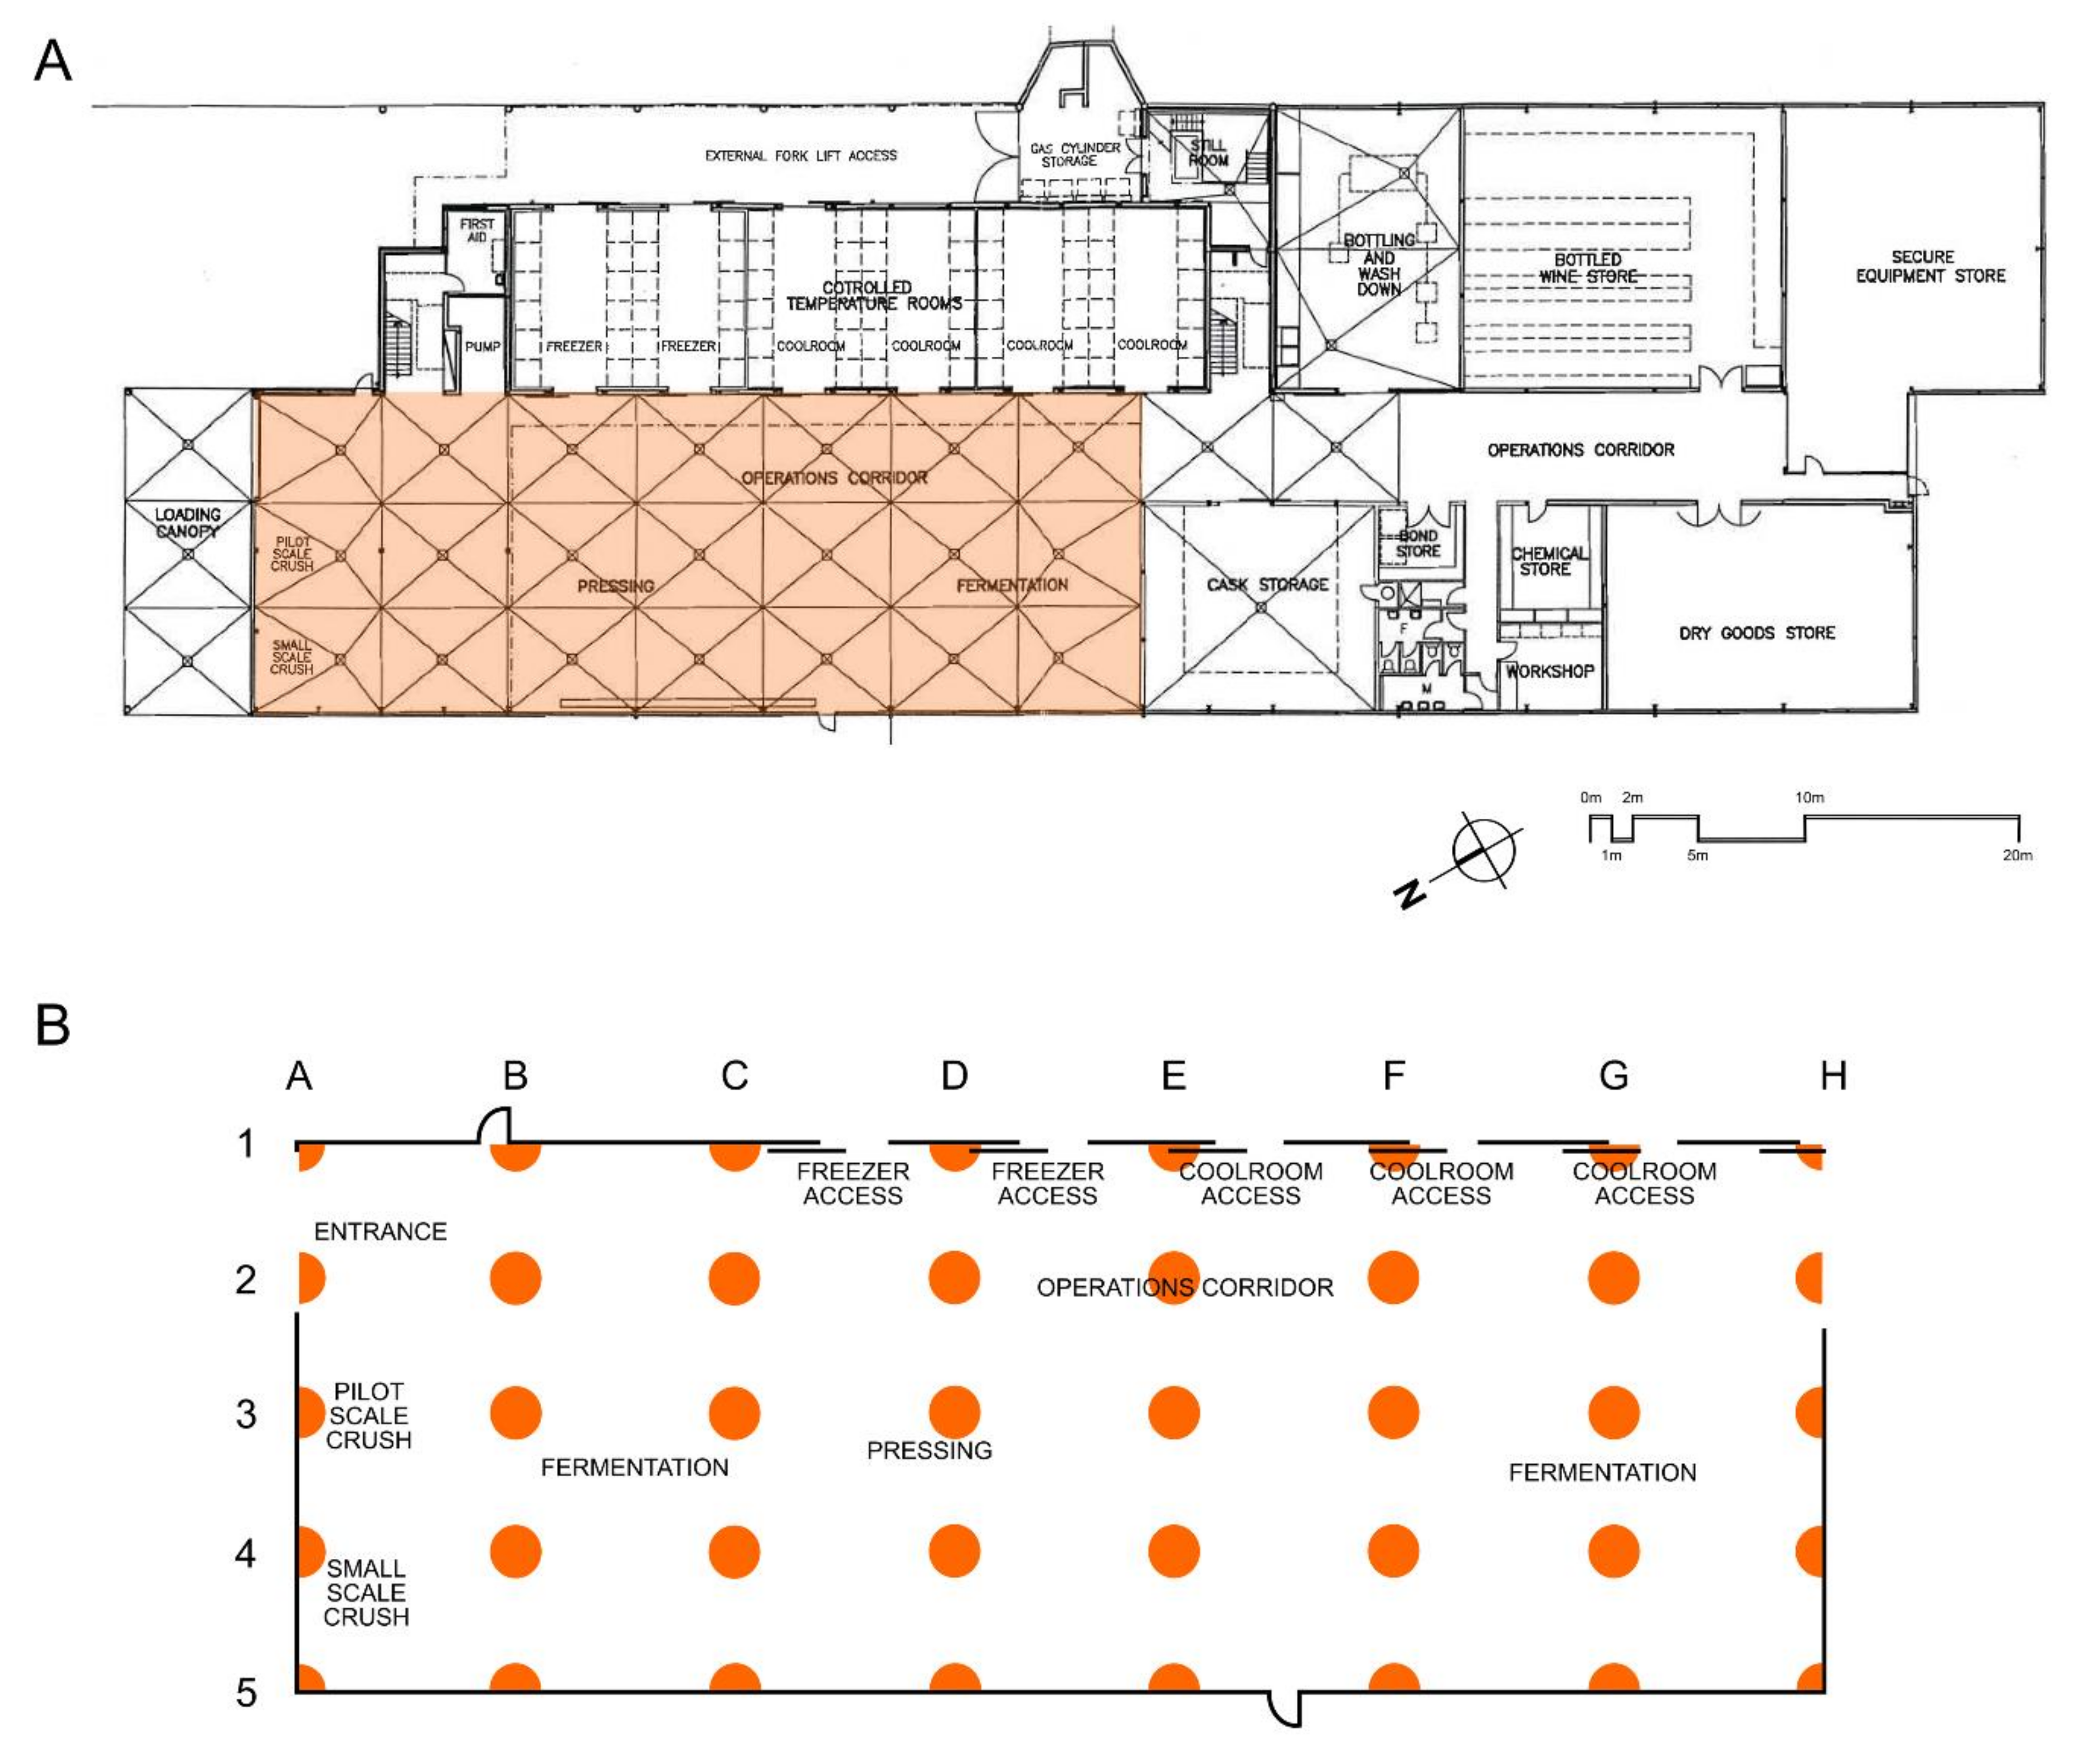
Figure 1. Sampling locations at the Hickinbotham Roseworthy Wine Science Laboratory (HRWSL). (A) Swab samples were taken from the floor of the main HRWSL operations/fermentation area (orange shade). (B) Samples were taken in a 5 × 8 grid pattern at three different time points, before vintage (December 2019), during vintage (March 2020) and after vintage (June 2020).
Fermentation 07 00134 g001
Figure 2. Microbial communities found in the Hickinbotham Roseworthy Wine Science Laboratory (HRWSL). Cladograms shows different taxonomy levels in concentric rings. From the centre, kingdom, phylum, class, order, family and genus are shown. (A) Bacterial communities with all identified phyla coloured, relative abundance for final taxonomies indicated in outer rings. (B) Fungal communities with all identified classes coloured, relative abundance for genera indicated in outer rings.
Fermentation 07 00134 g002
Figure 3. Microbial composition for the top 20 most abundant terminal taxonomies in different food and beverage facilities. (A) Bacterial community structure and (B) fungal community structure. Facilities include a brewery, two cheese making facilities (A,B) and three wineries located in different countries, Australia, USA and France.
Fermentation 07 00134 g003
Figure 4. Mapping of the most abundant bacterial final taxonomies found at the Hickinbotham Roseworthy Wine Science Laboratory, including the family Micrococcaceae, and the genera Sphingomonas, Brevundimonas and Exigiobacterium, before, during and after vintage.
Fermentation 07 00134 g004
Figure 5. Mapping of the most abundant fungal genera found at the Hickinbotham Roseworthy Wine Science Laboratory, including Naganishia, Pyrenochaeta, Candida and Saccharomyces, before, during and after vintage.
Fermentation 07 00134 g005
Figure 6. Mapping of the wine spoilage microorganisms, Lactobacillus, Acetobacter, Gluconobacter and Brettanomyces, before, during and after vintage found at the Hickinbotham Roseworthy Wine Science Laboratory.
Fermentation 07 00134 g006
Table 1. Diversity indices for bacterial and yeast communities found at the Hickinbotham Roseworthy Wine Science Laboratory according to sampling date.
Sampling Date
Before Vintage
December 2019
During Vintage
March 2020
After Vintage
June 2020
Bacterial communities
Richness549.90 a476.05 b494.03 b
Diversity 14.04 a3.50 b3.33 b
Dominance0.19 a0.26 b0.32 b
Evenness0.64 a0.57 b0.54 b
Fungal communities
Richness322.88 a292.63 b358.78 a
Diversity 12.84 a2.75 a2.86 a
Dominance0.27 a0.29 a0.29 a
Evenness0.49 a0.49 a0.49 a
1 Diversity estimated by the Shannon index. Different letters indicate significative differences (p < 0.05).
Table 2. Distance-based redundancy analysis (DBRDA) of Bray distances for microbial communities (999 permutations) found at the Hickinbotham Roseworthy Wine Science Laboratory.
Bacterial Communities
DfSSF Modelp ValueSignificance
Location3916.8652.8720.001***
Sampling date22.6388.7620.001***
Residuals7811.743
Fungal Communities
DfSSF Modelp ValueSignificance
Location3914.9904.0060.001***
Sampling date20.6083.1690.001***
Residuals737.004
Df, degrees of freedom; SS, sequential sum of squares. * p < 0.05; ** p < 0.01; *** p < 0.001.
Publisher’s Note: MDPI stays neutral with regard to jurisdictional claims in published maps and institutional affiliations.