
Complementing Digital Image Analysis and Laser Distance Meter in Beer Foam Stability Determination


Abstract
:
1. Introduction
2. Materials and Methods
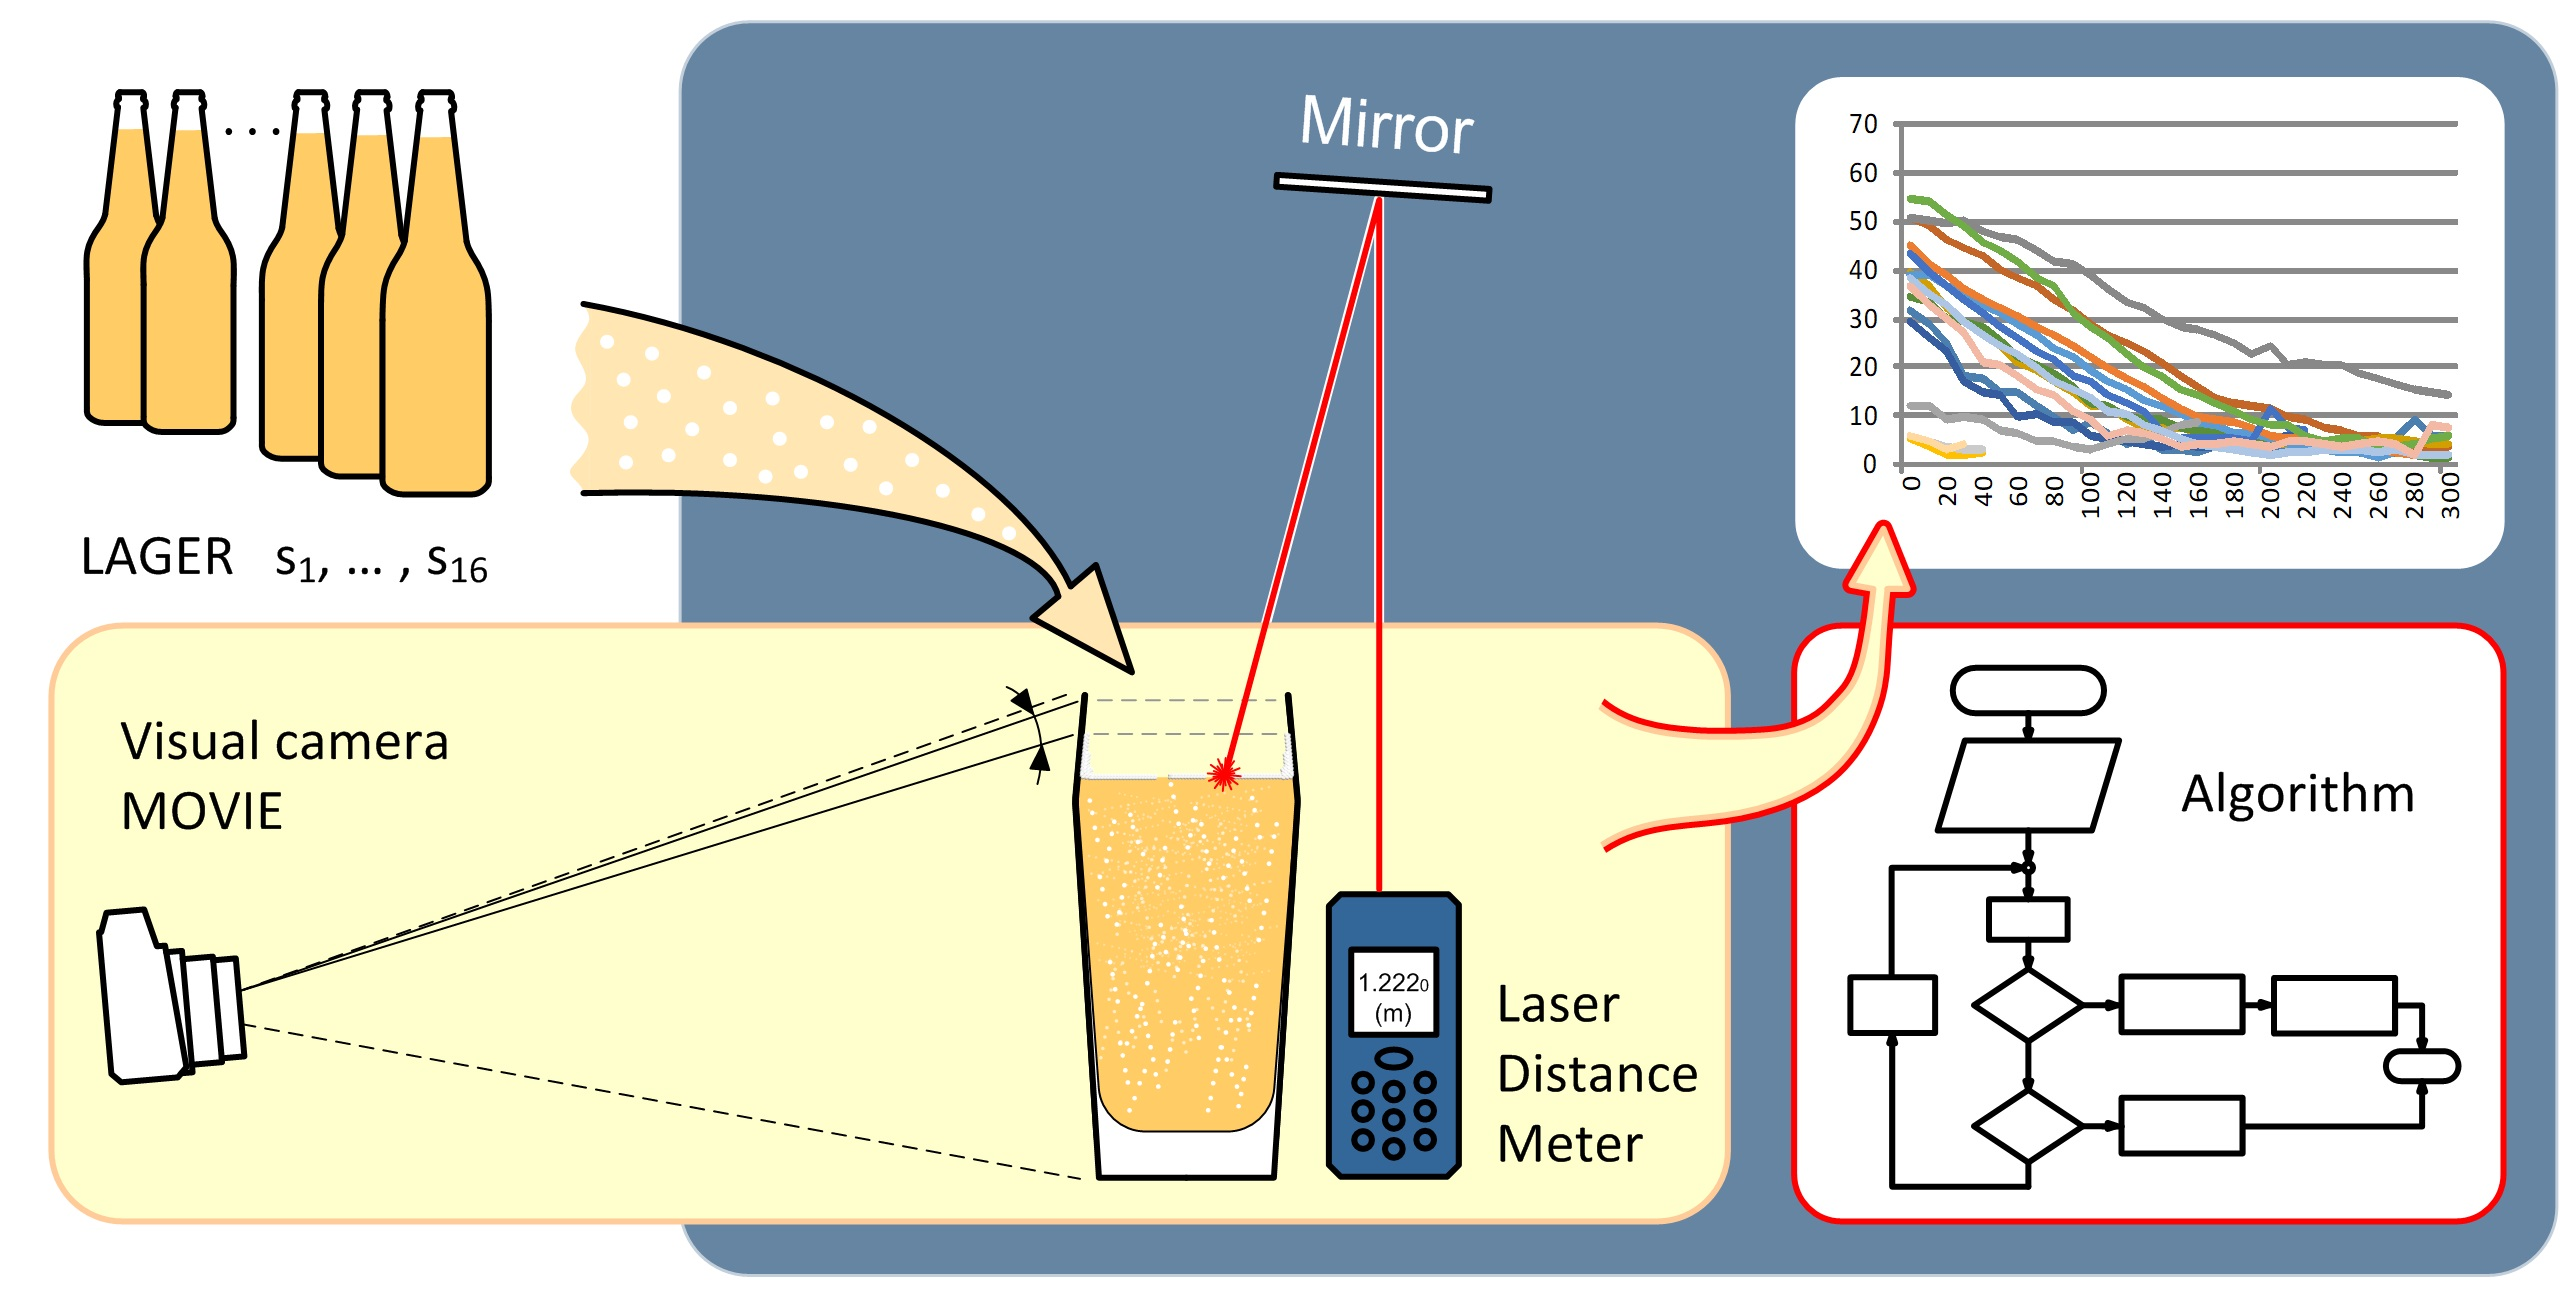
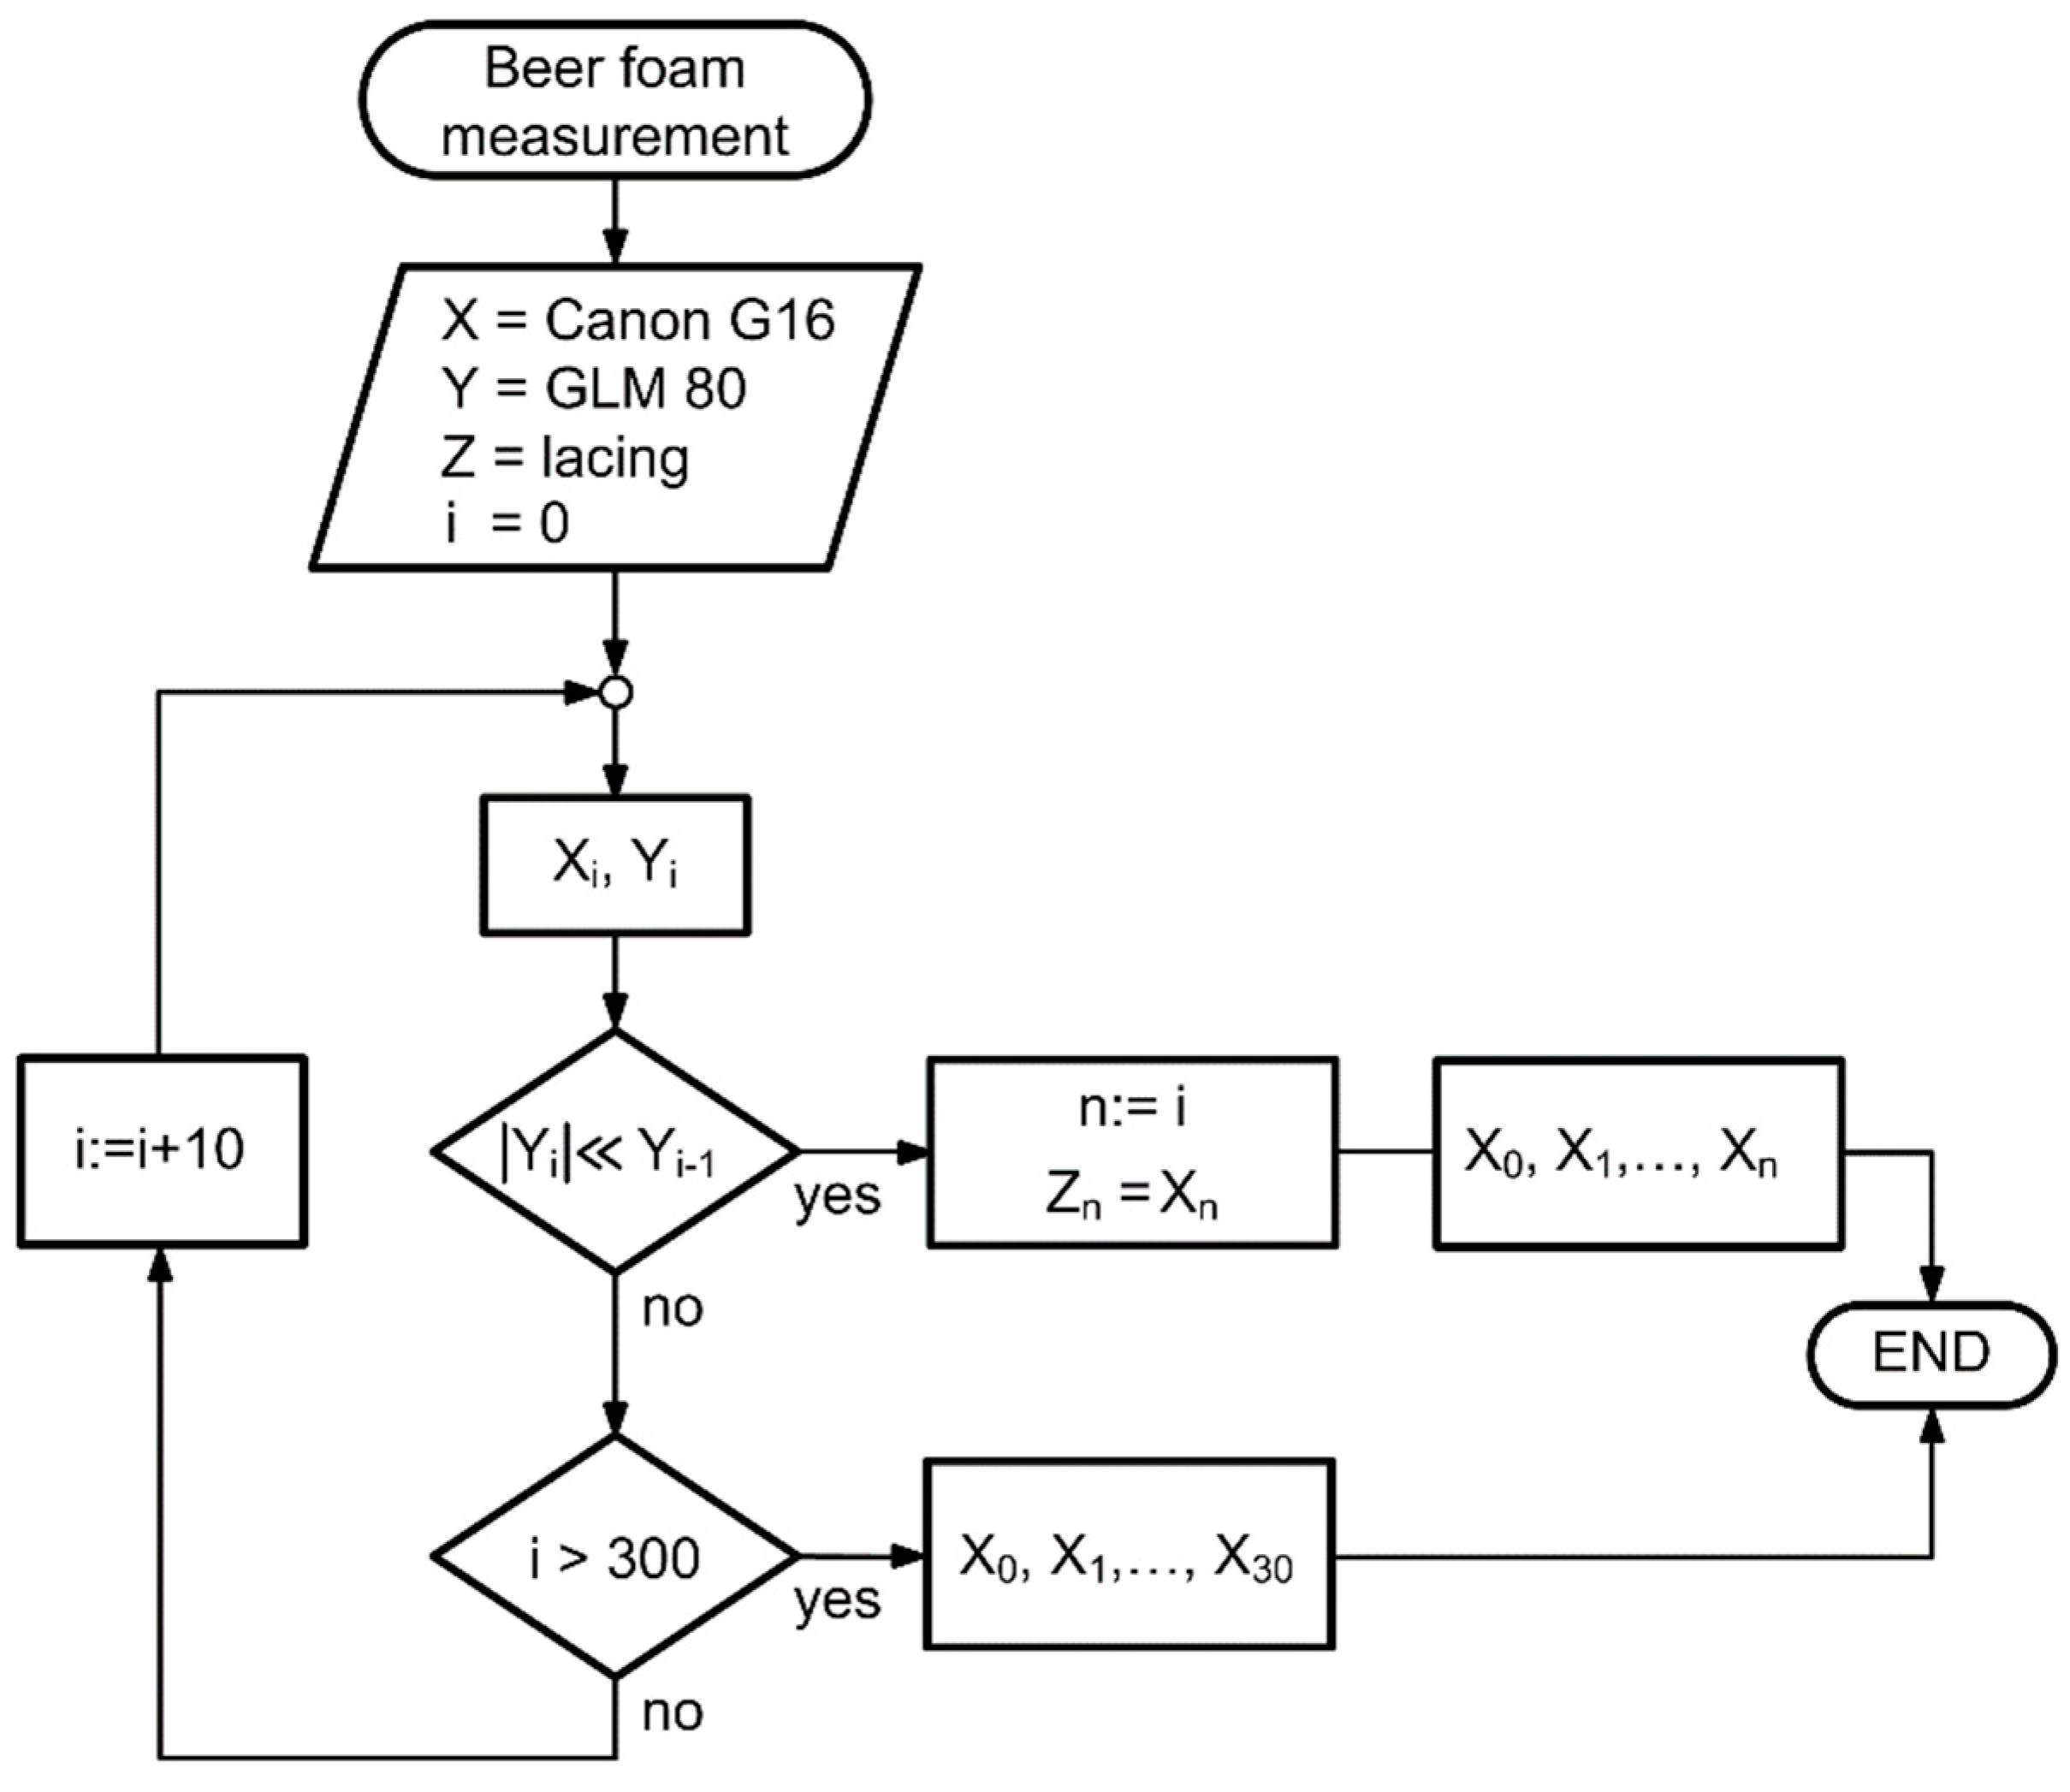
2.1. Image Analysis of Video
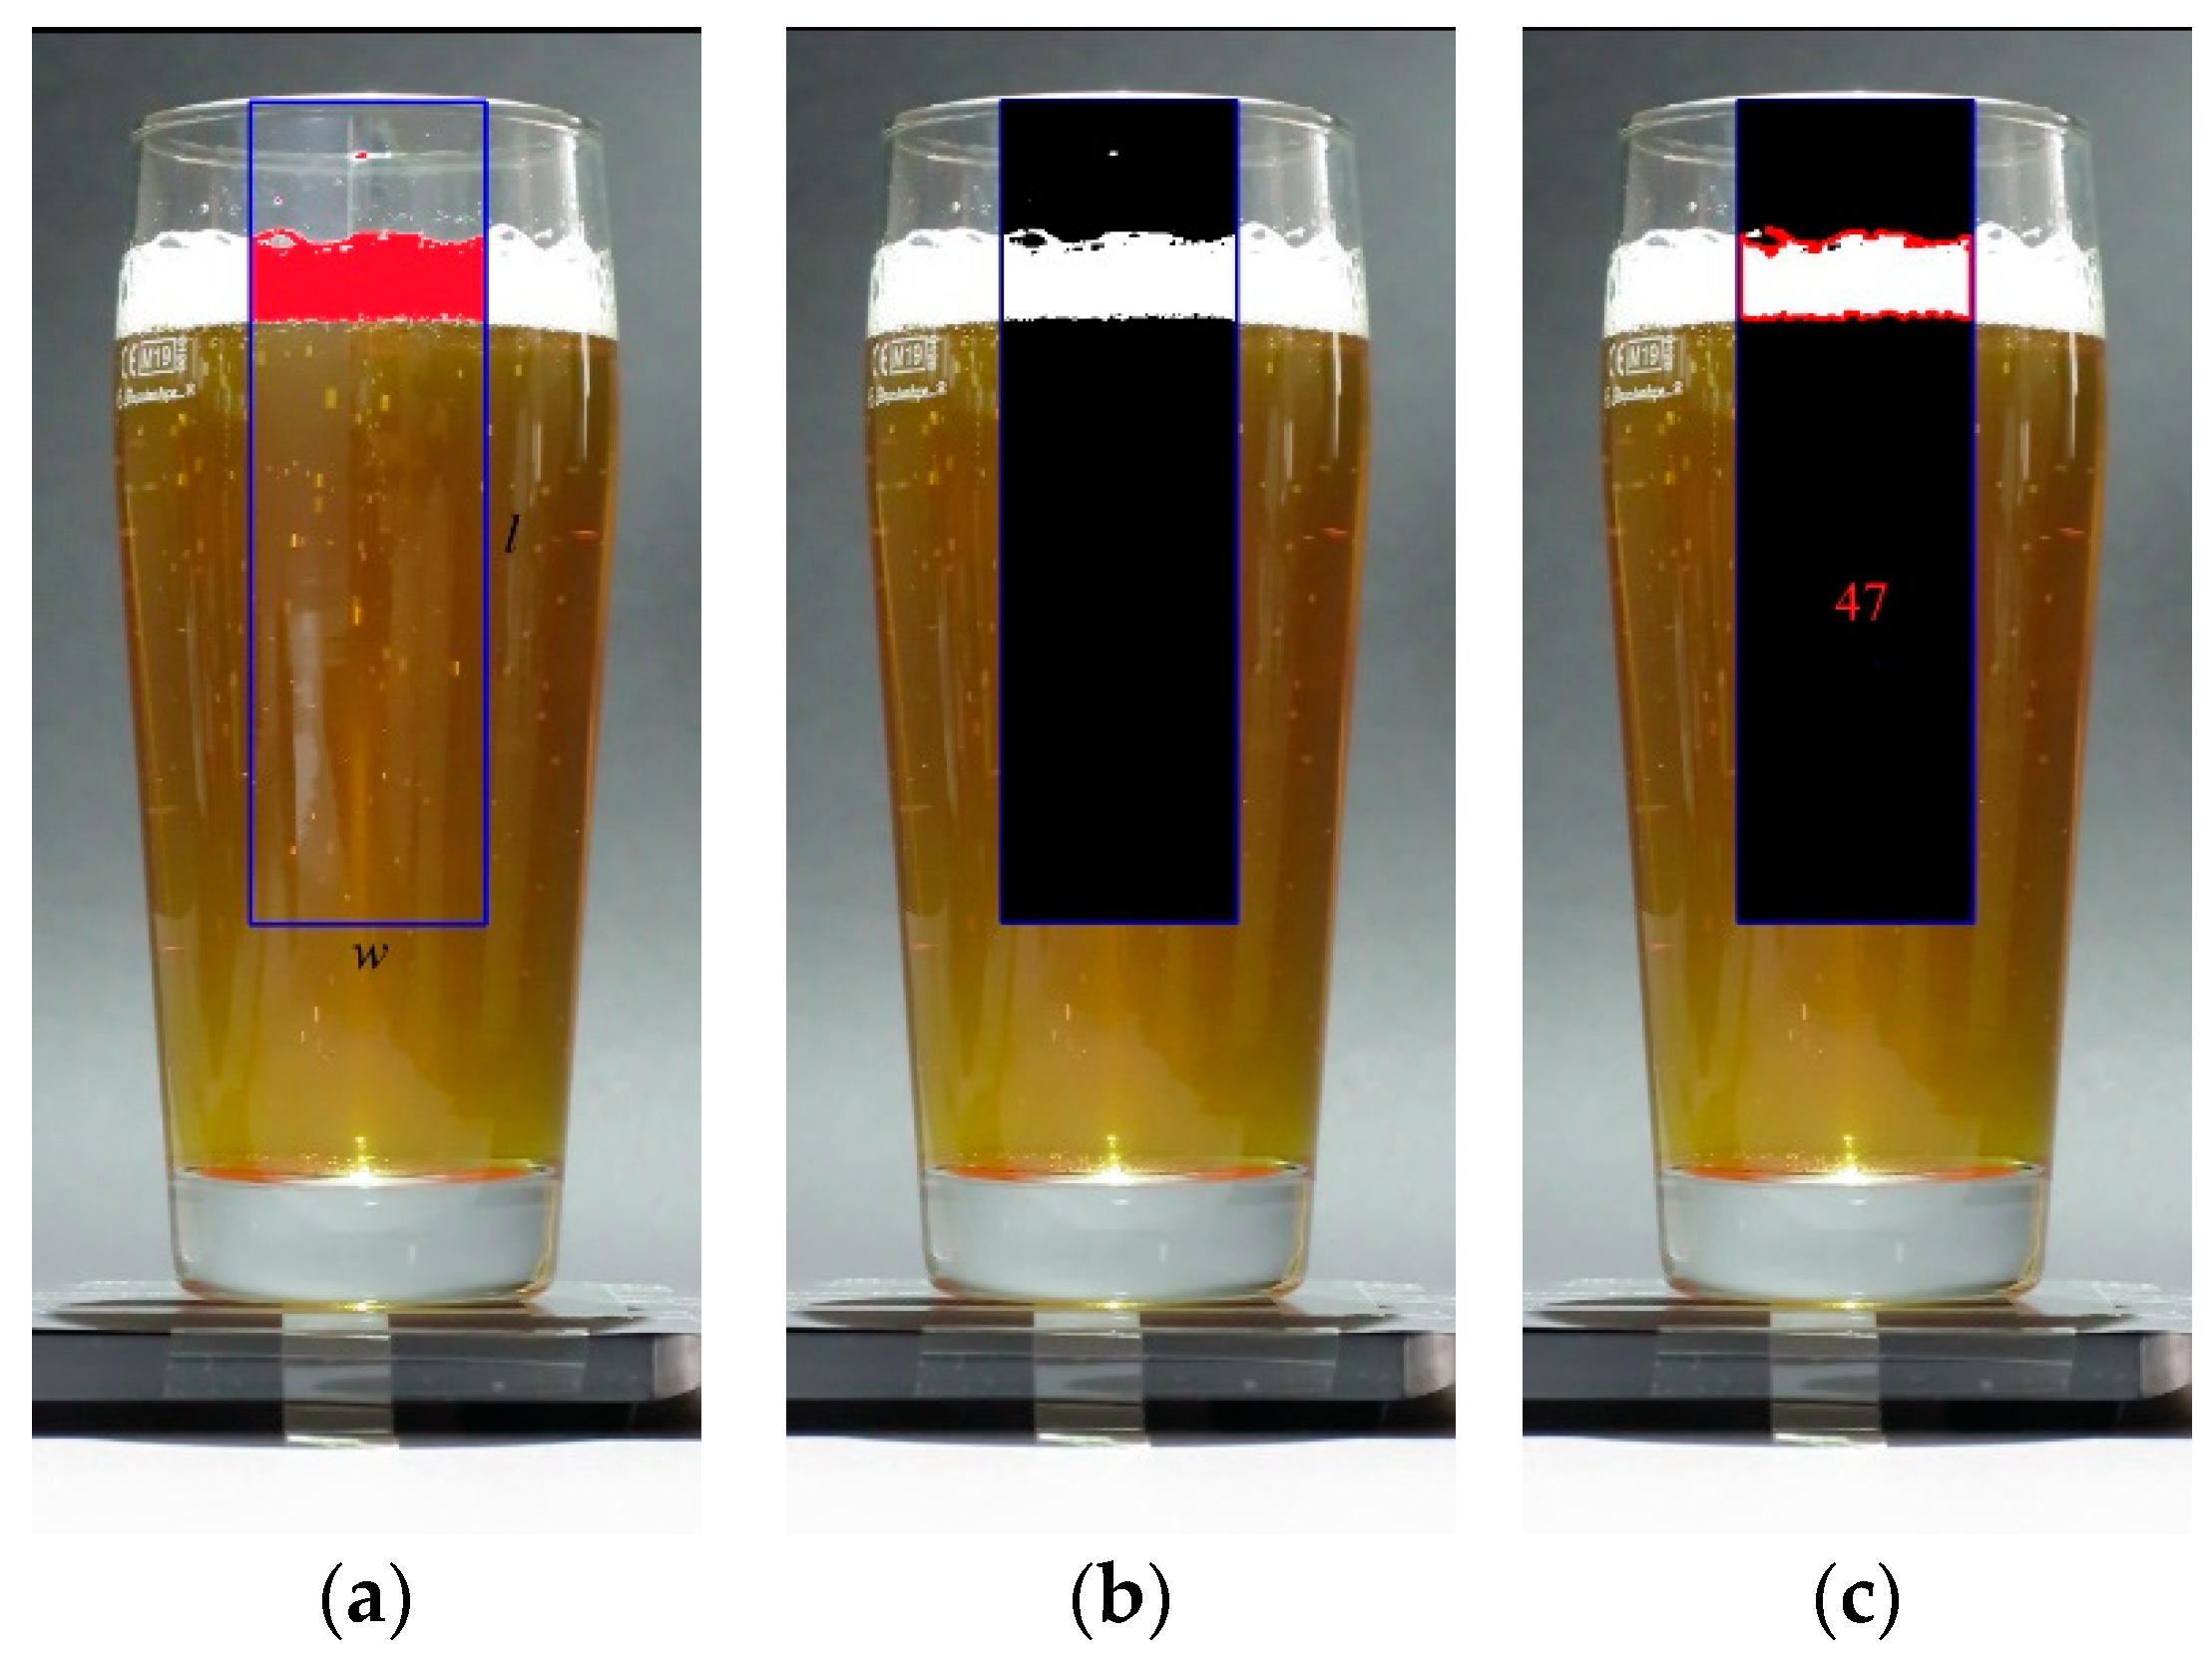
- A region of interest (ROI) of known width (w) and height (l) for a given frame of the recorded video is defined. It is imperative the whole height of the foam and part of the beer is covered by the ROI since all the next steps are performed only on this ROI.
- The ROI is color segmented in HSV color space by thresholding using previously defined lower and upper values of the foam color in the HSV color space.
- A binary image of the thresholded ROI in HSV color space is generated.
- Morphological operations of erosion followed by dilation are performed on the binary image to eliminate small white noises or artifacts that appear in the image.
- The largest contour on the binary image is determined. This contour marks the boundary of the foam/head.
- The area (A) of the region enclosed by the largest contour is determined.
- The average height (h) of the beer foam in pixels is then determined using Equation (1):
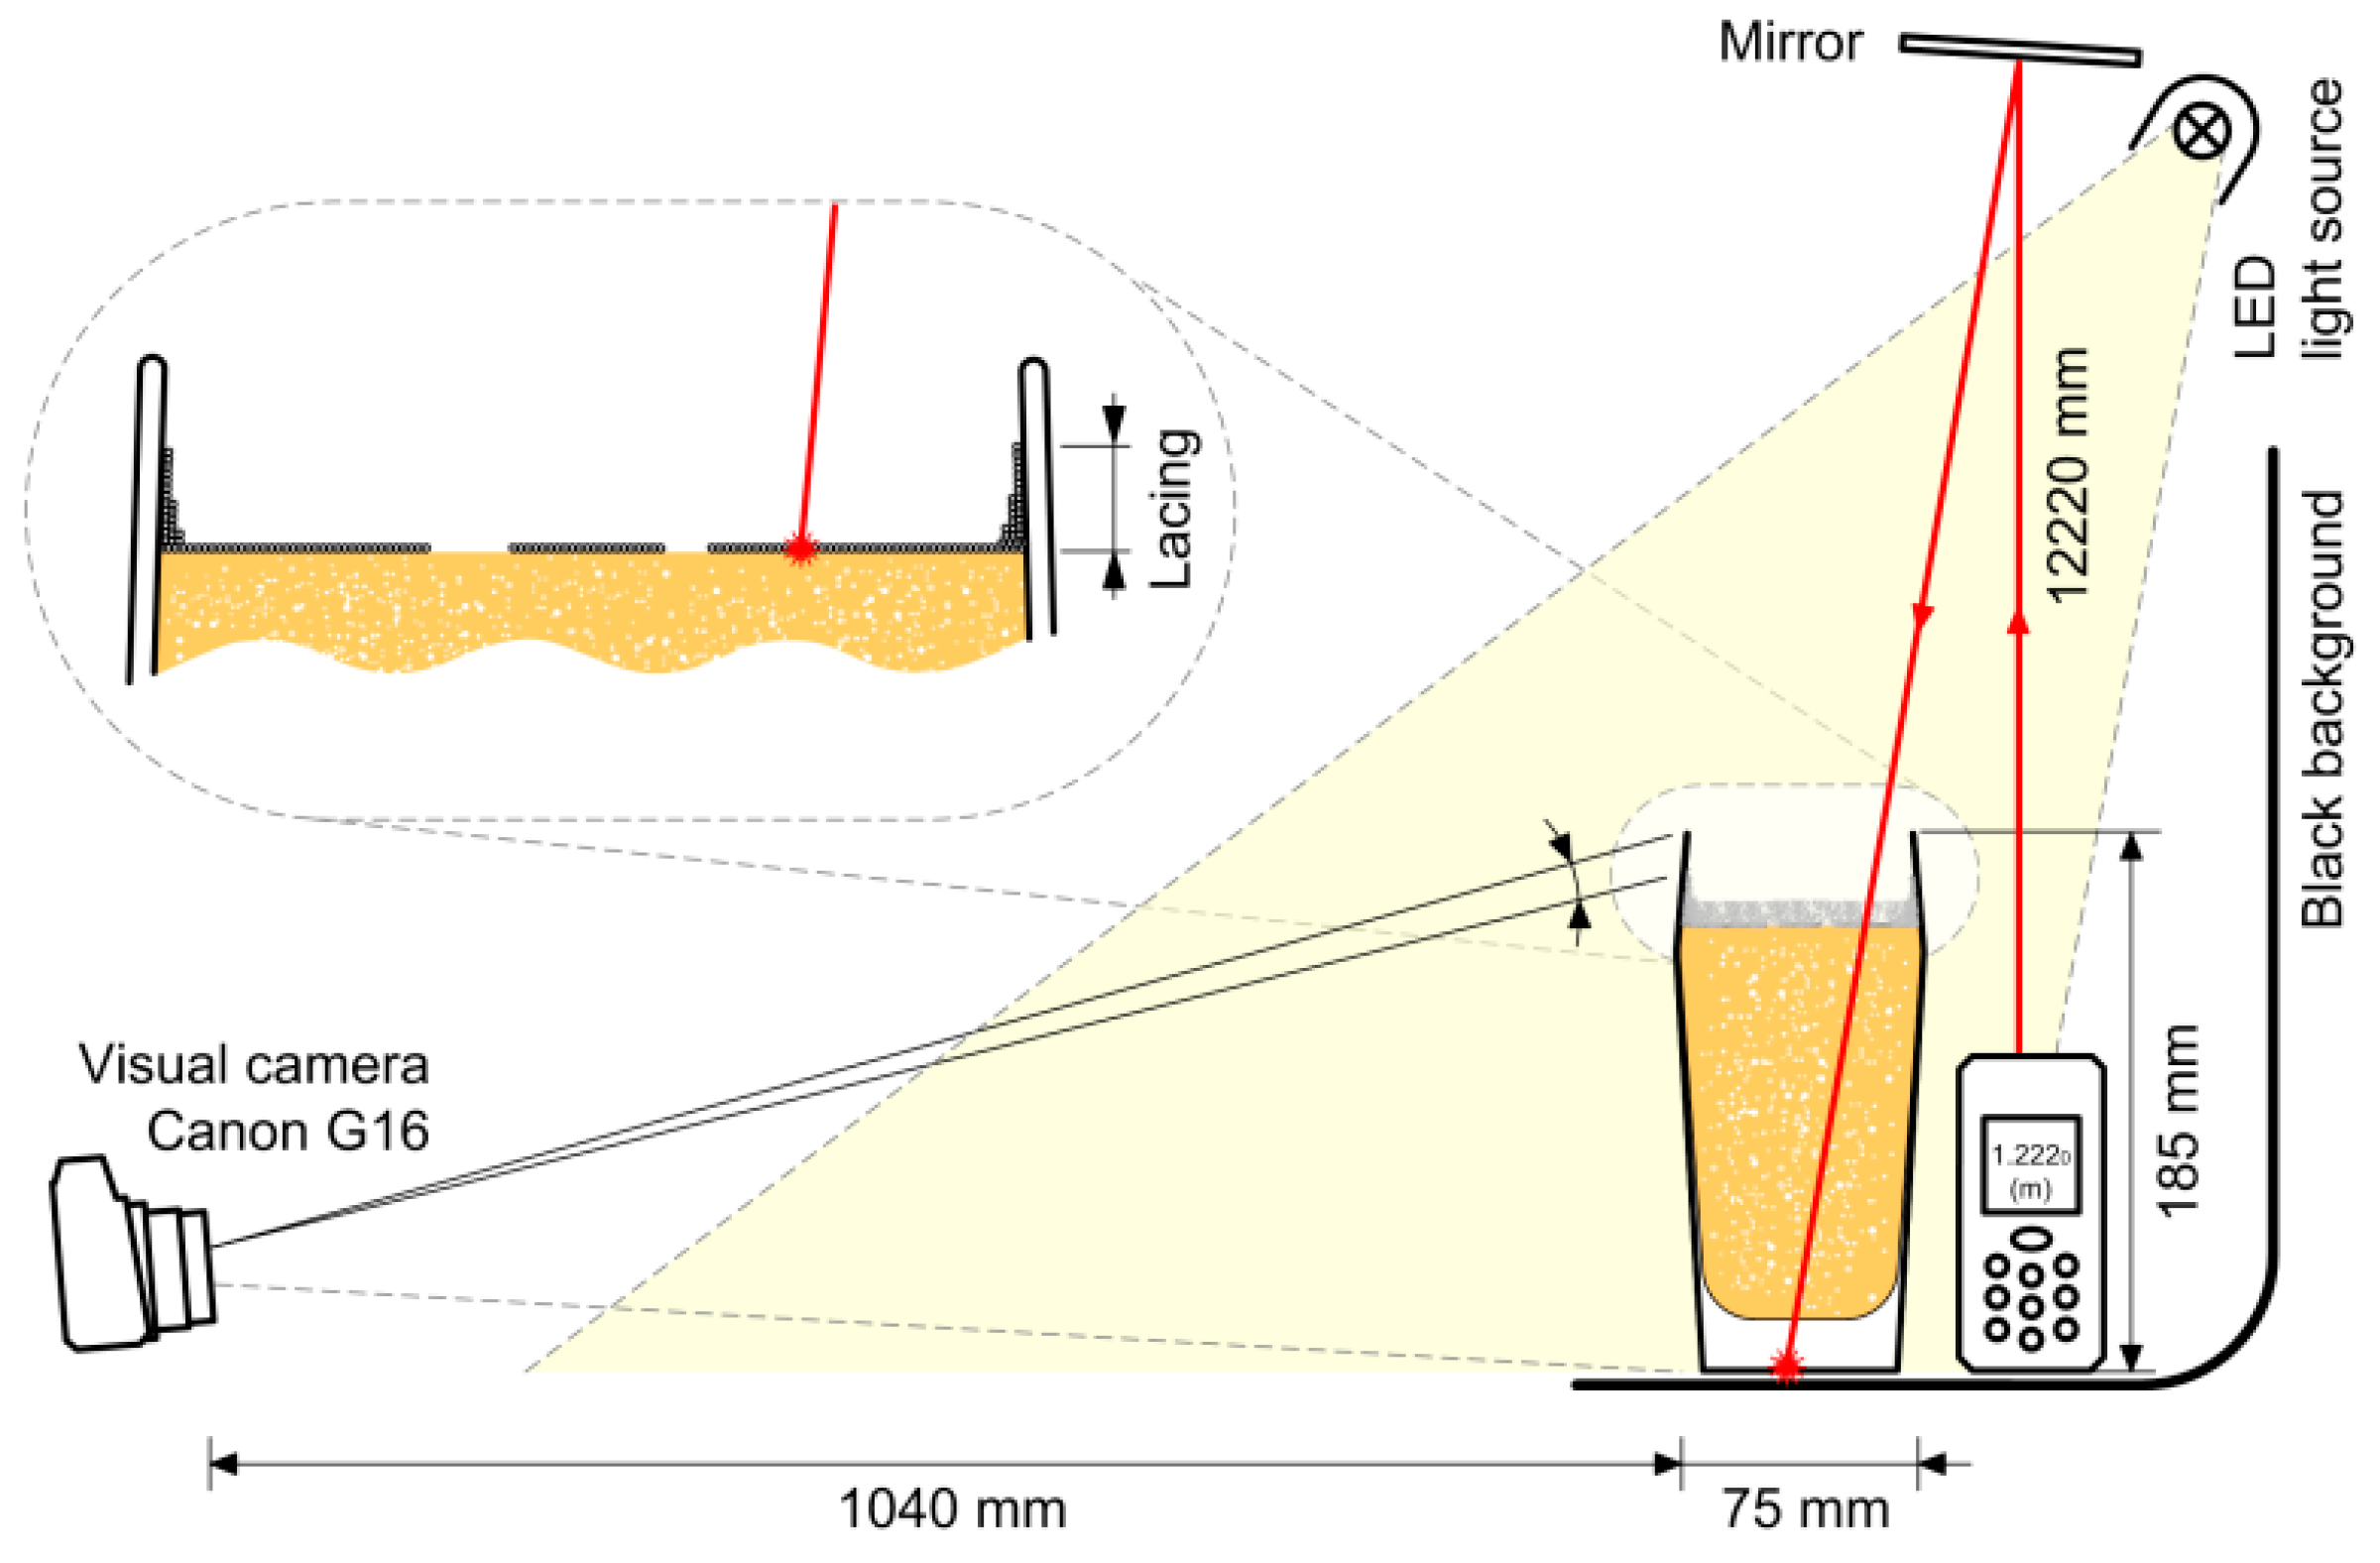
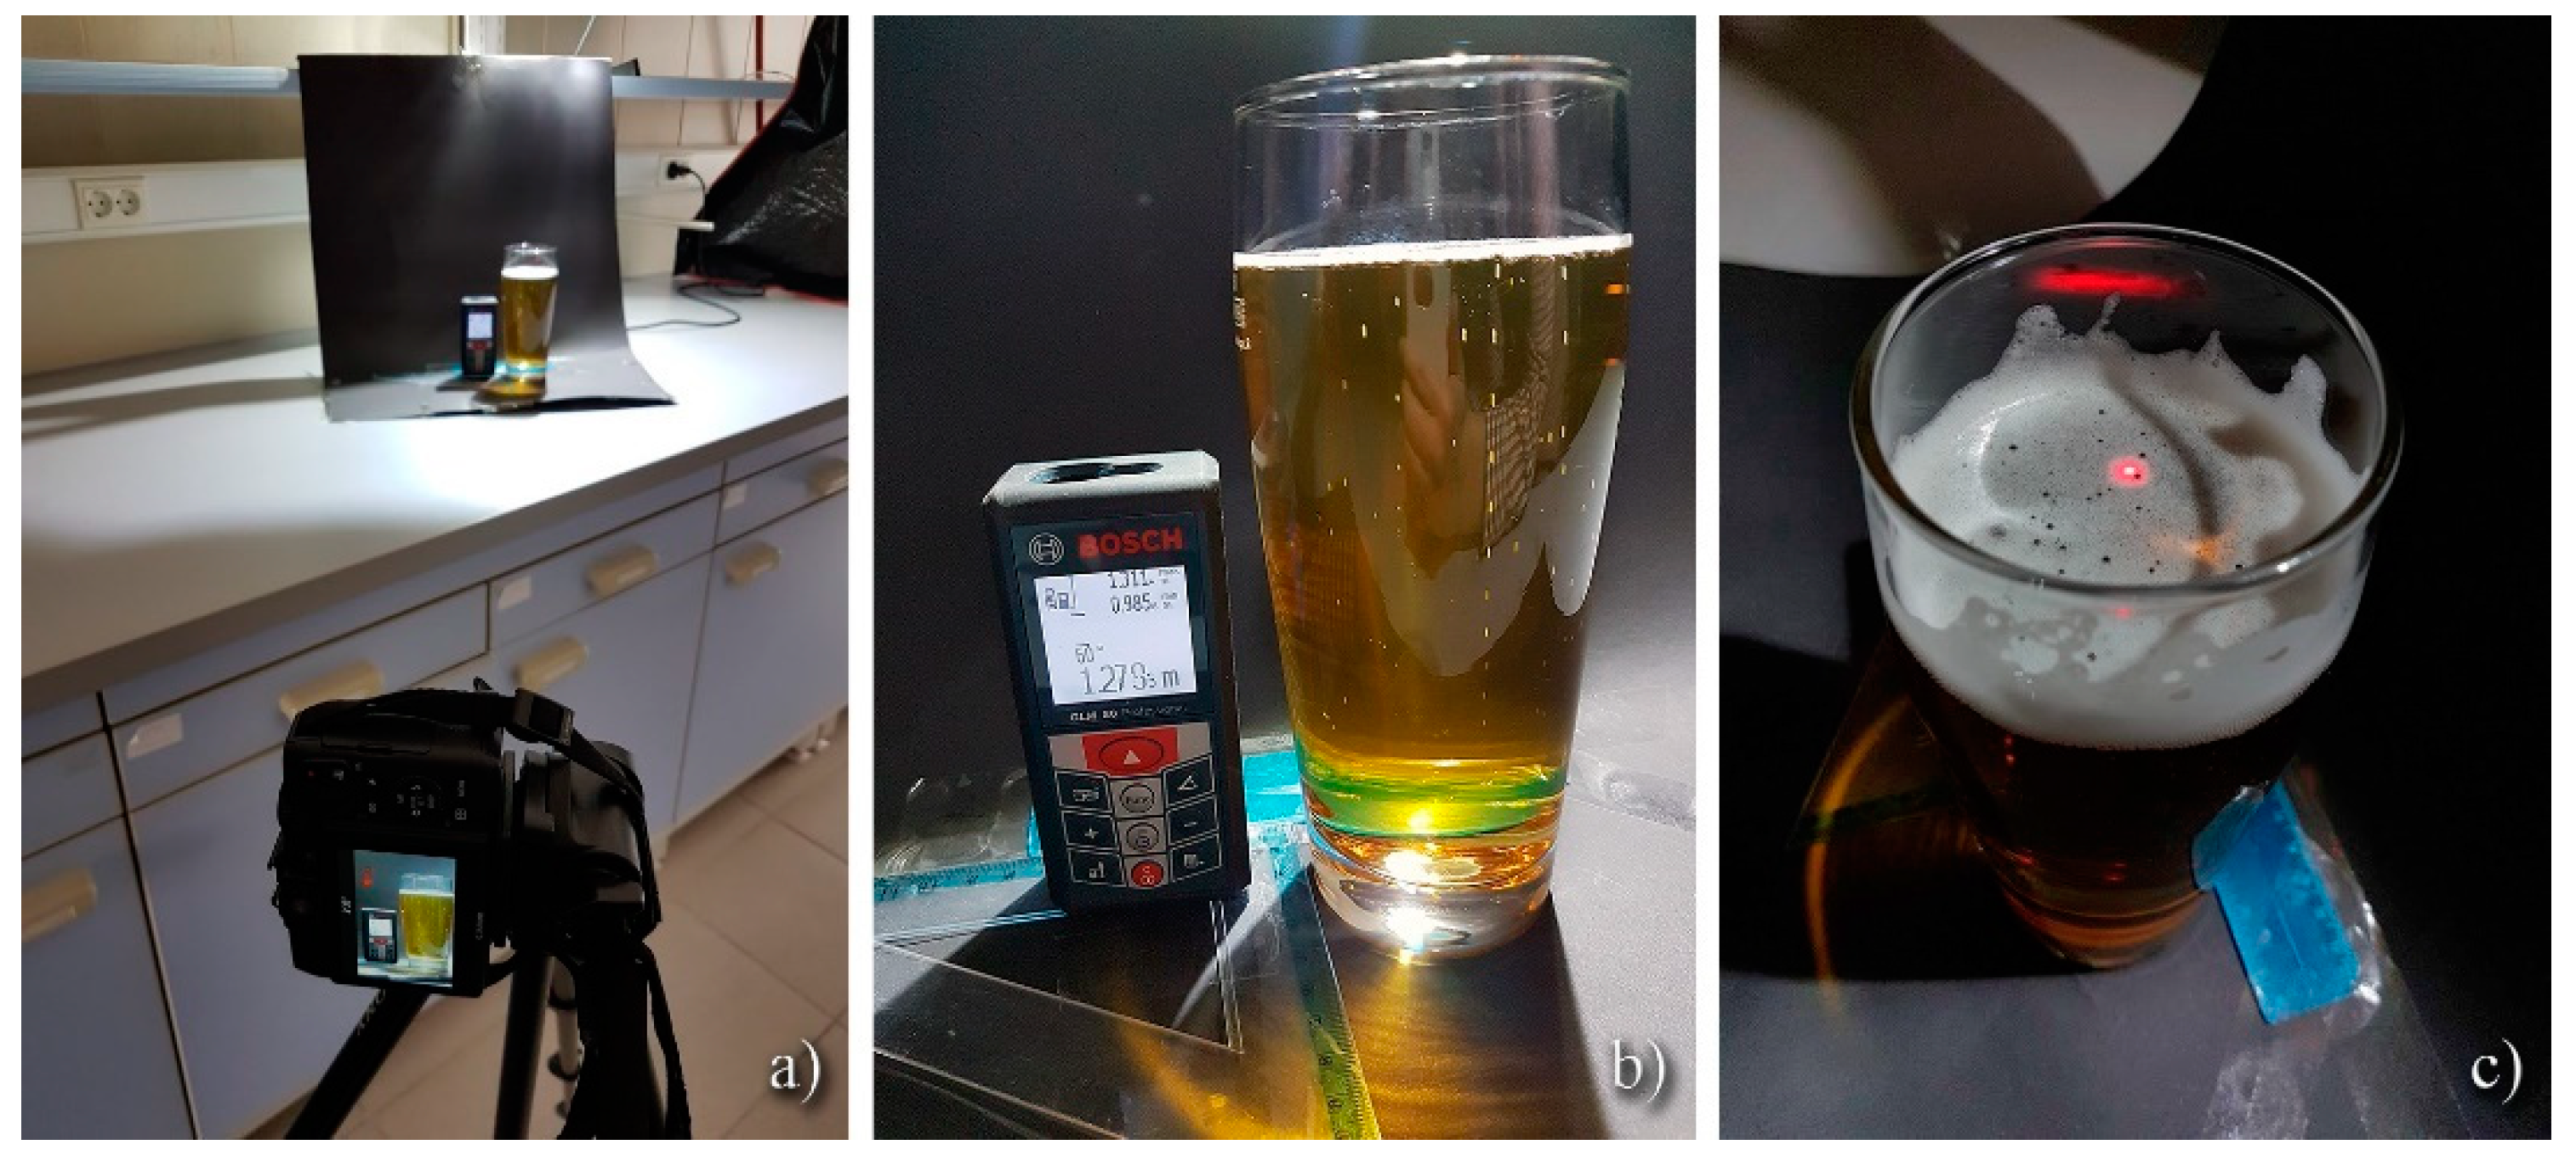
2.2. Measurement Using a Laser Distance Meter
3. Results and Discussion
4. Conclusions
Author Contributions
Funding
Institutional Review Board Statement
Informed Consent Statement
Data Availability Statement
Conflicts of Interest
References
- BJCP. Beer Style Guidelines; Gordon, S., Kristen, E., Eds.; Available online: www.bjcp.org (accessed on 6 March 2021).
- Bamforth, C.W. The foaming properties of beer. J. Inst. Brew. 1985, 91, 370–383. [Google Scholar] [CrossRef]
- Gonzalez, V.C.; Torrico, D.D.; Dunshea, F.R.; Fuentes, S. Bubbles, Foam Formation, Stability and Consumer Perception of Carbonated Drinks: A Review of Current, New and Emerging Technologies for Rapid Assessment and Control. Foods 2019, 8, 596. [Google Scholar] [CrossRef] [Green Version]
- Hackbarth, J.J. Multivariate Analyses of Beer Foam Stand. J. Inst. Brew. 2006, 112, 17–24. [Google Scholar] [CrossRef]
- Prins, A.; van Marle, J.T. Foam formation in beer: Some physics behind it. Monogr. Eur. Brew. Conv. 1999, 27, 26–36. [Google Scholar]
- Ronteltap, A.; Hollemans, M.; Bisperink, C.G.J.; Prims, A.R. Beer foam physics. Tech. Q. Master Brew. Assoc. Am. 1991, 28, 25–32. [Google Scholar]
- Fisher, S.; Hauser, G.; Sommer, K. Influence of dissolved gases on foam. Monogr. Eur. Brew. Conv. 1999, 27, 37–46. [Google Scholar]
- Evans, D.E.; Sheehan, M.C. Don’t Be Fobbed Off: The Substance of Beer Foam—A Review. J. Am. Soc. Brew. Chem. 2002, 60, 47–57. [Google Scholar] [CrossRef]
- ASBC. Methods of Analysis. Method Beer-22. Foam Collapse Rate; American Society of Brewing Chemists: St. Paul, MN, USA, 2018. [Google Scholar] [CrossRef]
- Klopper, W.J. Foam stability and foam cling. In Proceedings of the European Brewing Convention Congress, Salzburg, Austria, 21 May 1973; Elsevier Scientific: Amsterdam, The Netherlands, 1973; pp. 363–371. [Google Scholar]
- Rudin, A. Measurement of the foam stability of beers. J. Inst. Brew. 1957, 63, 506–509. [Google Scholar] [CrossRef]
- Rasmussen, J.N. Automated analysis of foam stability. Carlsberg Res. Commun. 1981, 46, 25–36. [Google Scholar] [CrossRef] [Green Version]
- Jackson, G.; Bamforth, C. The measurement of foam-lacing. J. Inst. Brew. 1982, 88, 378–381. [Google Scholar] [CrossRef]
- Constant, M. A practical method for characterizing poured beer foam quality. J. Am. Soc. Brew. Chem. 1992, 50, 37–47. [Google Scholar] [CrossRef]
- Vundla, W.; Torline, P. Steps toward the formulation of a model foam standard. J. Am. Soc. Brew. Chem. 2007, 65, 21–25. [Google Scholar] [CrossRef]
- Amerine, M.A.; Martini, L.; Mattei, W.D. Foaming Properties of Wine. Ind. Eng. Chem. 1942, 34, 152–157. [Google Scholar] [CrossRef]
- Wilson, P.; Mundy, A. An improved method for measuring beer foam collapse. J. Inst. Brew. 1984, 90, 385–388. [Google Scholar] [CrossRef]
- Evans, D.E.; Surrel, A.; Sheehy, M.; Stewart, D.C.; Robinson, L.H. Comparison of foam quality and the influence of hop α-acids and proteins using five foam analysis methods. J. Am. Soc. Brew. Chem. 2008, 66, 1–10. [Google Scholar] [CrossRef]
- Evans, D.E.; Oberdieck, M.; Red, K.S.; Newman, R. Comparison of the Rudin and NIBEM Methods for Measuring Foam Stability with a Manual Pour Method to Identify Beer Characteristics That Deliver Consumers Stable Beer Foam. J. Am. Soc. Brew. Chem. 2012, 70, 70–78. [Google Scholar] [CrossRef]
- Smith, R.J.; Davidson, D.; Wilson, R.J. Natural foam stabilizing and bittering compounds derived from hops. J. Am. Soc. Brew. Chem. 1998, 56, 52–57. [Google Scholar] [CrossRef]
- Cimini, A.; Pallottino, F.; Menesatti, P.; Moresi, M. A low-cost image analysis system to upgrade the rudin beer foam head retention meter. Food Bioprocess Technol. 2016, 9, 1587–1597. [Google Scholar] [CrossRef]
- Gonzalez, V.C.; Fuentes, S.; Li, G.; Collmann, R.; Condé, B.; Torrico, D. Development of a robotic pourer constructed with ubiquitous materials, open hardware and sensors to assess beer foam quality using computer vision and pattern recognition algorithms: RoboBEER. Food Res. Int. 2016, 89, 504–513. [Google Scholar] [CrossRef] [PubMed]
- Gonzalez, V.C.; Fuentes, S.; Torrico, D.D.; Howell, K.; Dunshea, F.R. Assessment of Beer Quality Based on a Robotic Pourer, Computer Vision, and Machine Learning Algorithms Using Commercial Beers. J. Food Sci. 2018, 83, 1381–1388. [Google Scholar] [CrossRef] [PubMed]
- Gonzalez Viejo, C.; Fuentes, S.; Howell, K.; Torrico, D.D.; Dunshea, F.R. Integration of non-invasive biometrics with sensory analysis techniques to assess acceptability of beer by consumers. Physiol. Behav. 2019, 200, 139–147. [Google Scholar] [CrossRef]
- Lukinac, J.; Mastanjević, K.; Mastanjević, K.; Nakov, G.; Jukić, M. Computer Vision Method in Beer Quality Evaluation—A Review. Beverages 2019, 5, 38. [Google Scholar] [CrossRef] [Green Version]
- Evans, D.E.; Sheehan, M.C.; Stewart, D.C. The impact of malt derived proteins on beer foam quality: Part II: The influence of malt foaming proteins and non-starch polysaccharides on beer foam quality. J. Inst. Brew. 1999, 105, 171–177. [Google Scholar] [CrossRef]
- Nyarko, E.K.; Glavaš, H.; Habschied, K.; Mastanjević, K. Determination of Foam Stability in Lager Beers Using Digital Image Analysis of Images Obtained Using RGB and 3D Cameras. Fermentation 2021, 7, 46. [Google Scholar] [CrossRef]
- Middle European Brewing Analysis Commission (MEBAK); Band II.n Brautechnische Middle European Brewing Analysis Commission (MEBAK). Band II.n Brautechnische Analysenmethoden, 3th ed.; Selbstverlag der MEBAK: Freising-Weihenstephan, Germany, 1997. [Google Scholar]
- RIEGL, Operation of a Pulsed Laser Distance Meter, General-Information-Distancemeter.pdf, Riegl Laser Measurement Systems GmbH, Application Note AN-GI002. 2001. Available online: http://www.riegl.com/uploads/tx_pxpriegldownloads/General-Information-Distancemeter.pdf (accessed on 16 April 2021).
- Python Programming Language. Available online: https://www.python.org/ (accessed on 21 January 2021).
- OpenCV. Available online: https://opencv.org/ (accessed on 21 January 2021).


| Material | Reflectivity |
|---|---|
| White paper | up to 100% |
| Newspaper with print | 69 |
| Dimension lumber | 94 |
| Snow | 80–90 |
| White masonry | 85 |
| Concrete, smooth | 24 |
| Beer foam | 88 |
| Sample | ||||||||||||||||
|---|---|---|---|---|---|---|---|---|---|---|---|---|---|---|---|---|
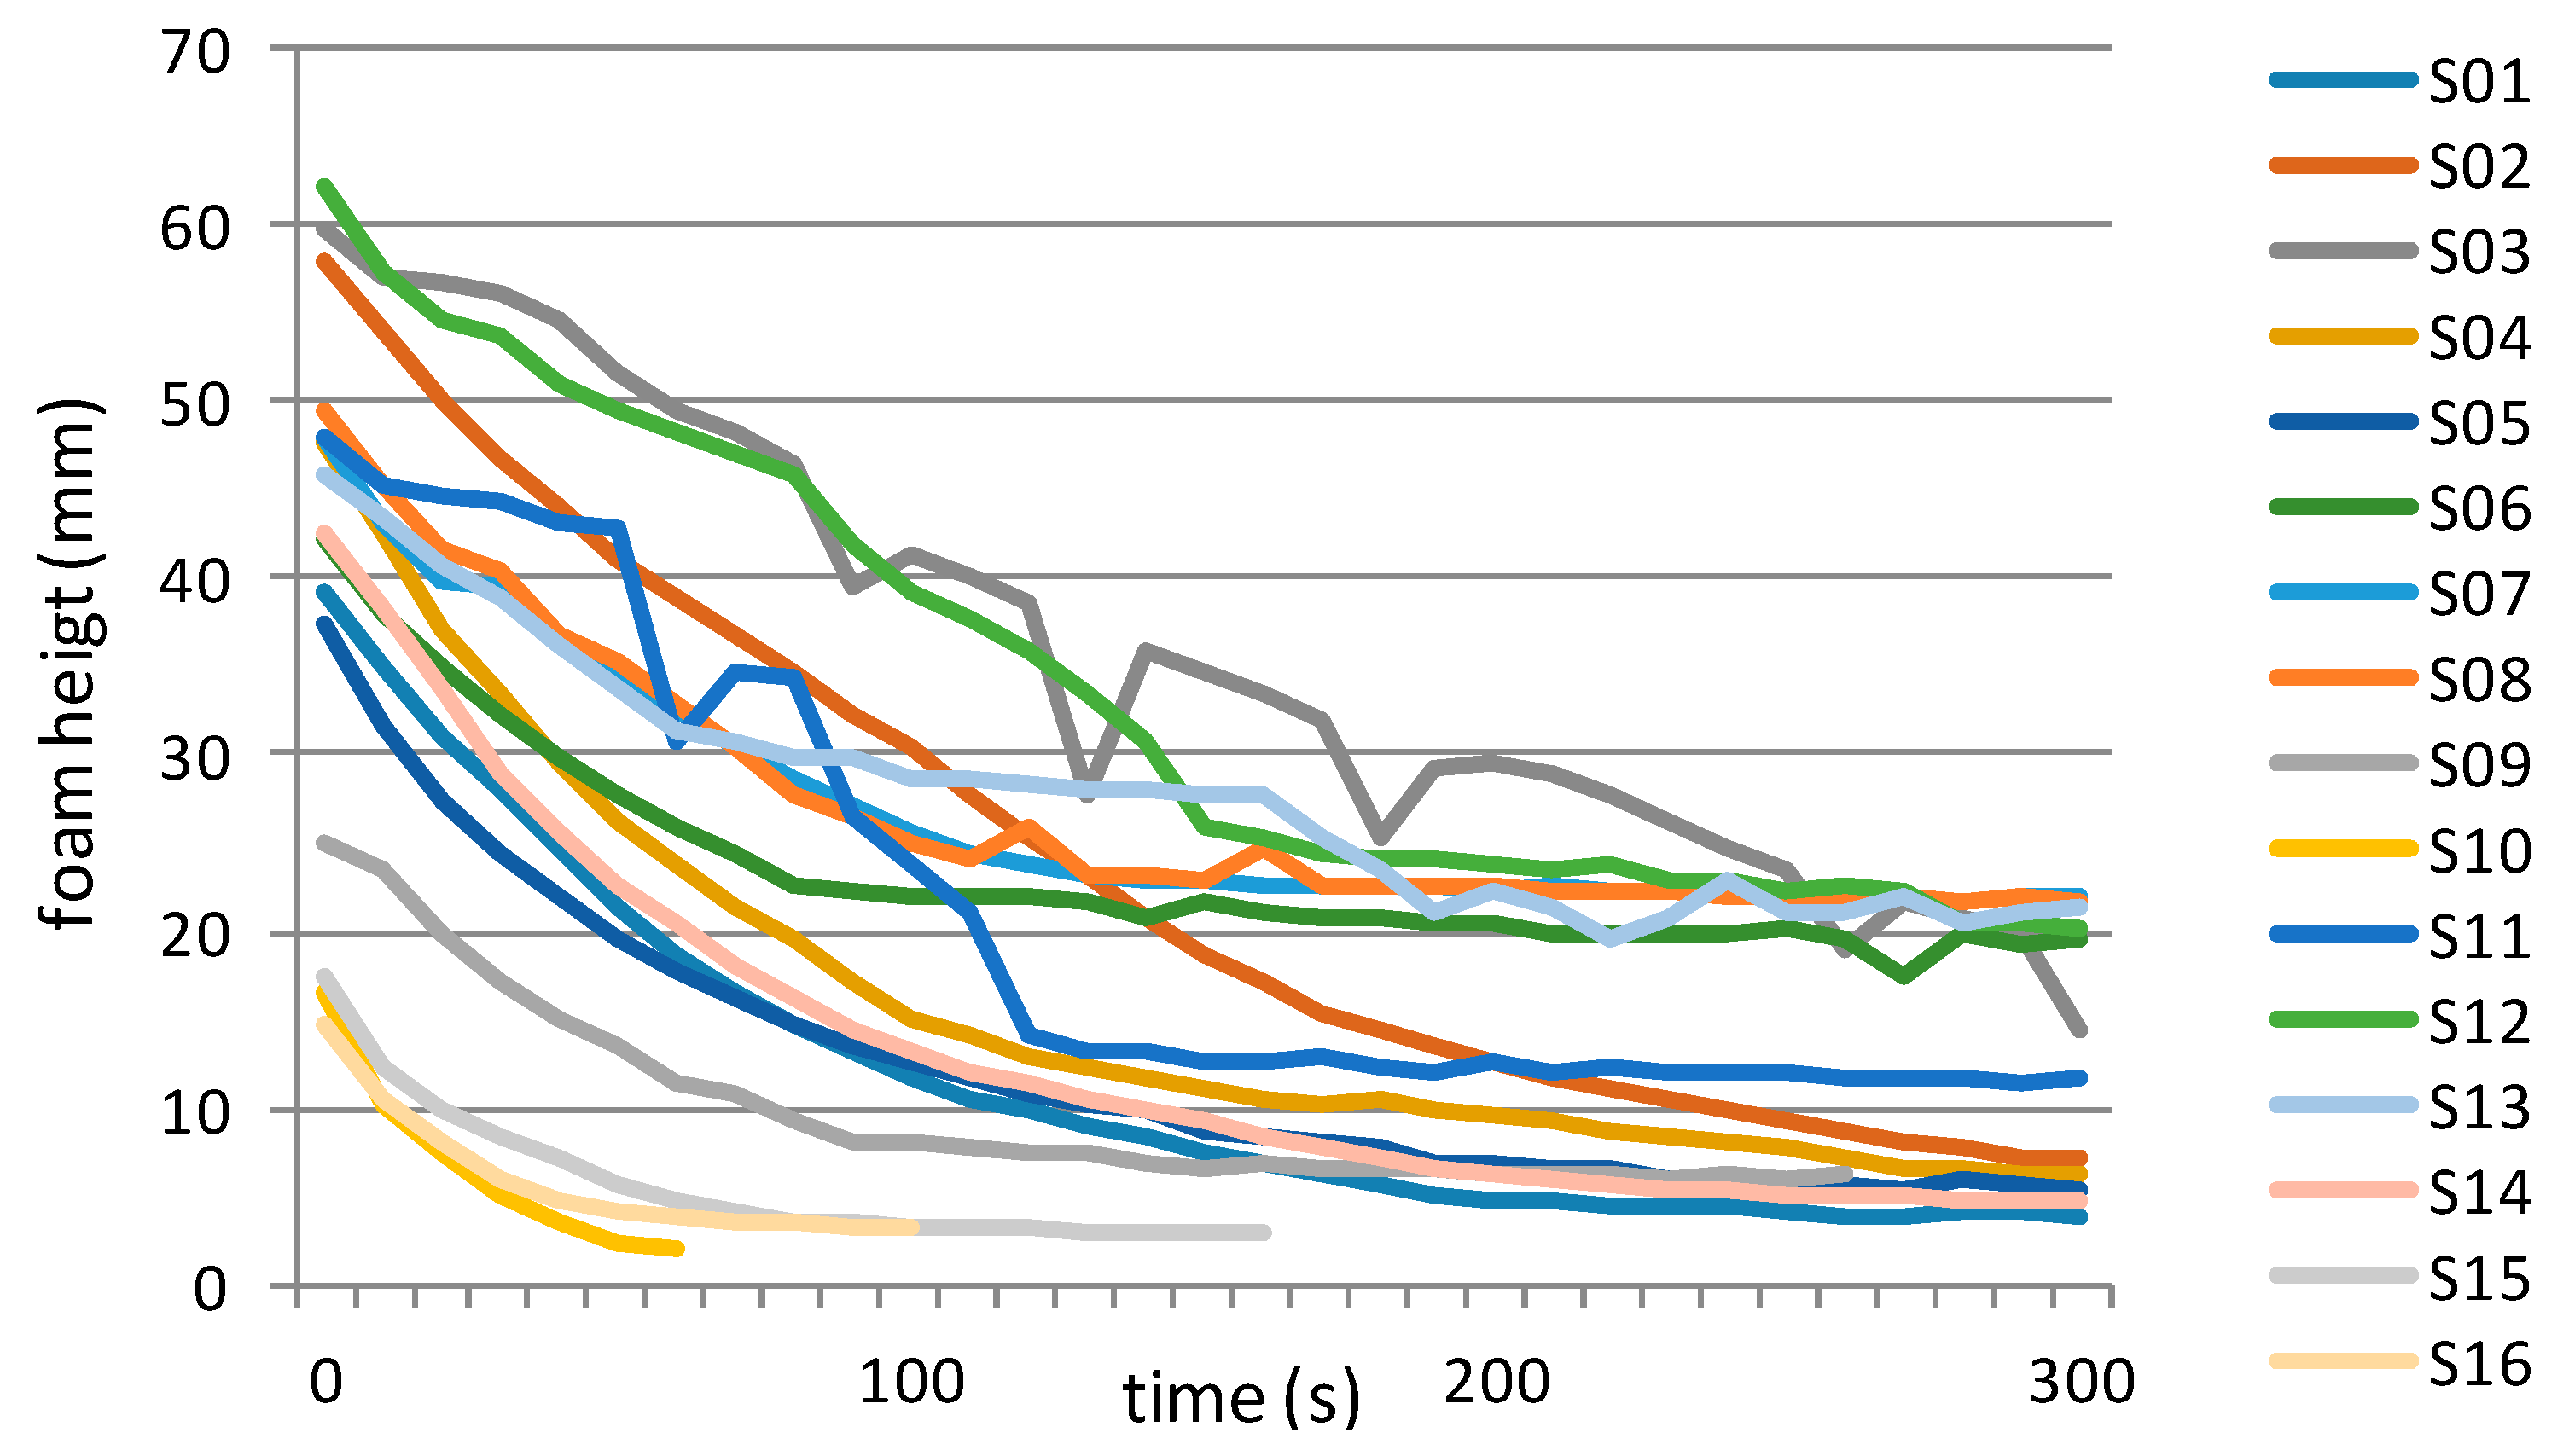
| Time | S01 | S02 | S03 | S04 | S05 | S06 | S07 | S08 | S09 | S10 | S11 | S12 | S13 | S14 | S15 | S16 |
| 0 | 39 | 58 | 60 | 48 | 37 | 42 | 48 | 49 | 25 | 17 | 48 | 62 | 46 | 43 | 18 | 15 |
| 10 | 35 | 54 | 57 | 42 | 32 | 38 | 43 | 45 | 23 | 10 | 45 | 57 | 43 | 38 | 12 | 11 |
| 20 | 31 | 50 | 57 | 37 | 28 | 35 | 40 | 42 | 20 | 8 | 45 | 55 | 41 | 34 | 10 | 8 |
| 30 | 28 | 47 | 56 | 33 | 24 | 32 | 39 | 40 | 17 | 5 | 44 | 54 | 39 | 29 | 8 | 6 |
| 40 | 25 | 44 | 55 | 30 | 22 | 30 | 36 | 37 | 15 | 4 | 43 | 51 | 36 | 26 | 7 | 5 |
| 50 | 21 | 41 | 52 | 26 | 20 | 28 | 34 | 35 | 13 | 2 | 43 | 49 | 34 | 23 | 6 | 4 |
| 60 | 19 | 39 | 50 | 24 | 18 | 26 | 33 | 33 | 11 | 2 | 31 | 48 | 31 | 20 | 5 | 4 |
| 70 | 17 | 37 | 48 | 21 | 16 | 24 | 31 | 30 | 11 | - | 35 | 47 | 31 | 18 | 4 | 3 |
| 80 | 15 | 35 | 47 | 19 | 15 | 23 | 29 | 28 | 9 | - | 34 | 46 | 30 | 16 | 4 | 3 |
| 90 | 13 | 32 | 40 | 17 | 14 | 22 | 27 | 26 | 8 | - | 26 | 42 | 30 | 15 | 4 | 3 |
| 100 | 12 | 30 | 41 | 15 | 13 | 22 | 26 | 25 | 8 | - | 24 | 39 | 29 | 13 | 3 | 3 |
| 110 | 10 | 28 | 40 | 14 | 12 | 22 | 24 | 24 | 8 | - | 21 | 38 | 29 | 12 | 3 | - |
| 120 | 10 | 25 | 39 | 13 | 11 | 22 | 24 | 26 | 8 | - | 14 | 36 | 28 | 11 | 3 | - |
| 130 | 9 | 23 | 28 | 12 | 10 | 22 | 23 | 23 | 7 | - | 13 | 33 | 28 | 11 | 3 | - |
| 140 | 8 | 21 | 36 | 12 | 10 | 21 | 23 | 23 | 7 | - | 13 | 31 | 28 | 10 | 3 | - |
| 150 | 8 | 19 | 35 | 11 | 9 | 22 | 23 | 23 | 7 | - | 13 | 26 | 28 | 9 | 3 | - |
| 160 | 7 | 17 | 34 | 11 | 8 | 21 | 23 | 25 | 7 | - | 13 | 25 | 28 | 8 | 3 | - |
| 170 | 6 | 15 | 32 | 10 | 8 | 21 | 23 | 23 | 7 | - | 13 | 24 | 25 | 8 | - | - |
| 180 | 6 | 14 | 25 | 10 | 8 | 21 | 22 | 23 | 7 | - | 12 | 24 | 23 | 7 | - | - |
| 190 | 5 | 14 | 29 | 10 | 7 | 21 | 23 | 23 | 7 | - | 12 | 24 | 21 | 7 | - | - |
| 200 | 5 | 13 | 30 | 10 | 7 | 21 | 22 | 22 | 6 | - | 13 | 24 | 22 | 6 | - | - |
| 210 | 5 | 12 | 29 | 9 | 7 | 20 | 23 | 22 | 6 | - | 12 | 23 | 21 | 6 | - | - |
| 220 | 4 | 11 | 28 | 9 | 7 | 20 | 22 | 22 | 6 | - | 12 | 24 | 20 | 6 | - | - |
| 230 | 4 | 10 | 26 | 8 | 6 | 20 | 22 | 22 | 6 | - | 12 | 23 | 21 | 6 | - | - |
| 240 | 4 | 10 | 25 | 8 | 6 | 20 | 23 | 22 | 6 | - | 12 | 23 | 23 | 5 | - | - |
| 250 | 4 | 9 | 24 | 8 | 6 | 20 | 22 | 22 | 6 | - | 12 | 22 | 21 | 5 | - | - |
| 260 | 4 | 9 | 19 | 7 | 6 | 20 | 22 | 22 | 6 | - | 12 | 22 | 21 | 5 | - | - |
| 270 | 4 | 8 | 22 | 7 | 6 | 17 | 22 | 22 | - | - | 12 | 22 | 22 | 5 | - | - |
| 280 | 4 | 8 | 21 | 7 | 6 | 20 | 22 | 22 | - | - | 12 | 20 | 21 | 5 | - | - |
| 290 | 4 | 7 | 20 | 6 | 6 | 19 | 22 | 22 | - | - | 11 | 20 | 21 | 5 | - | - |
| 300 | 4 | 7 | 14 | 6 | 5 | 20 | 22 | 22 | - | - | 12 | 20 | 21 | 5 | - | - |
| Sample | ||||||||||||||||
|---|---|---|---|---|---|---|---|---|---|---|---|---|---|---|---|---|
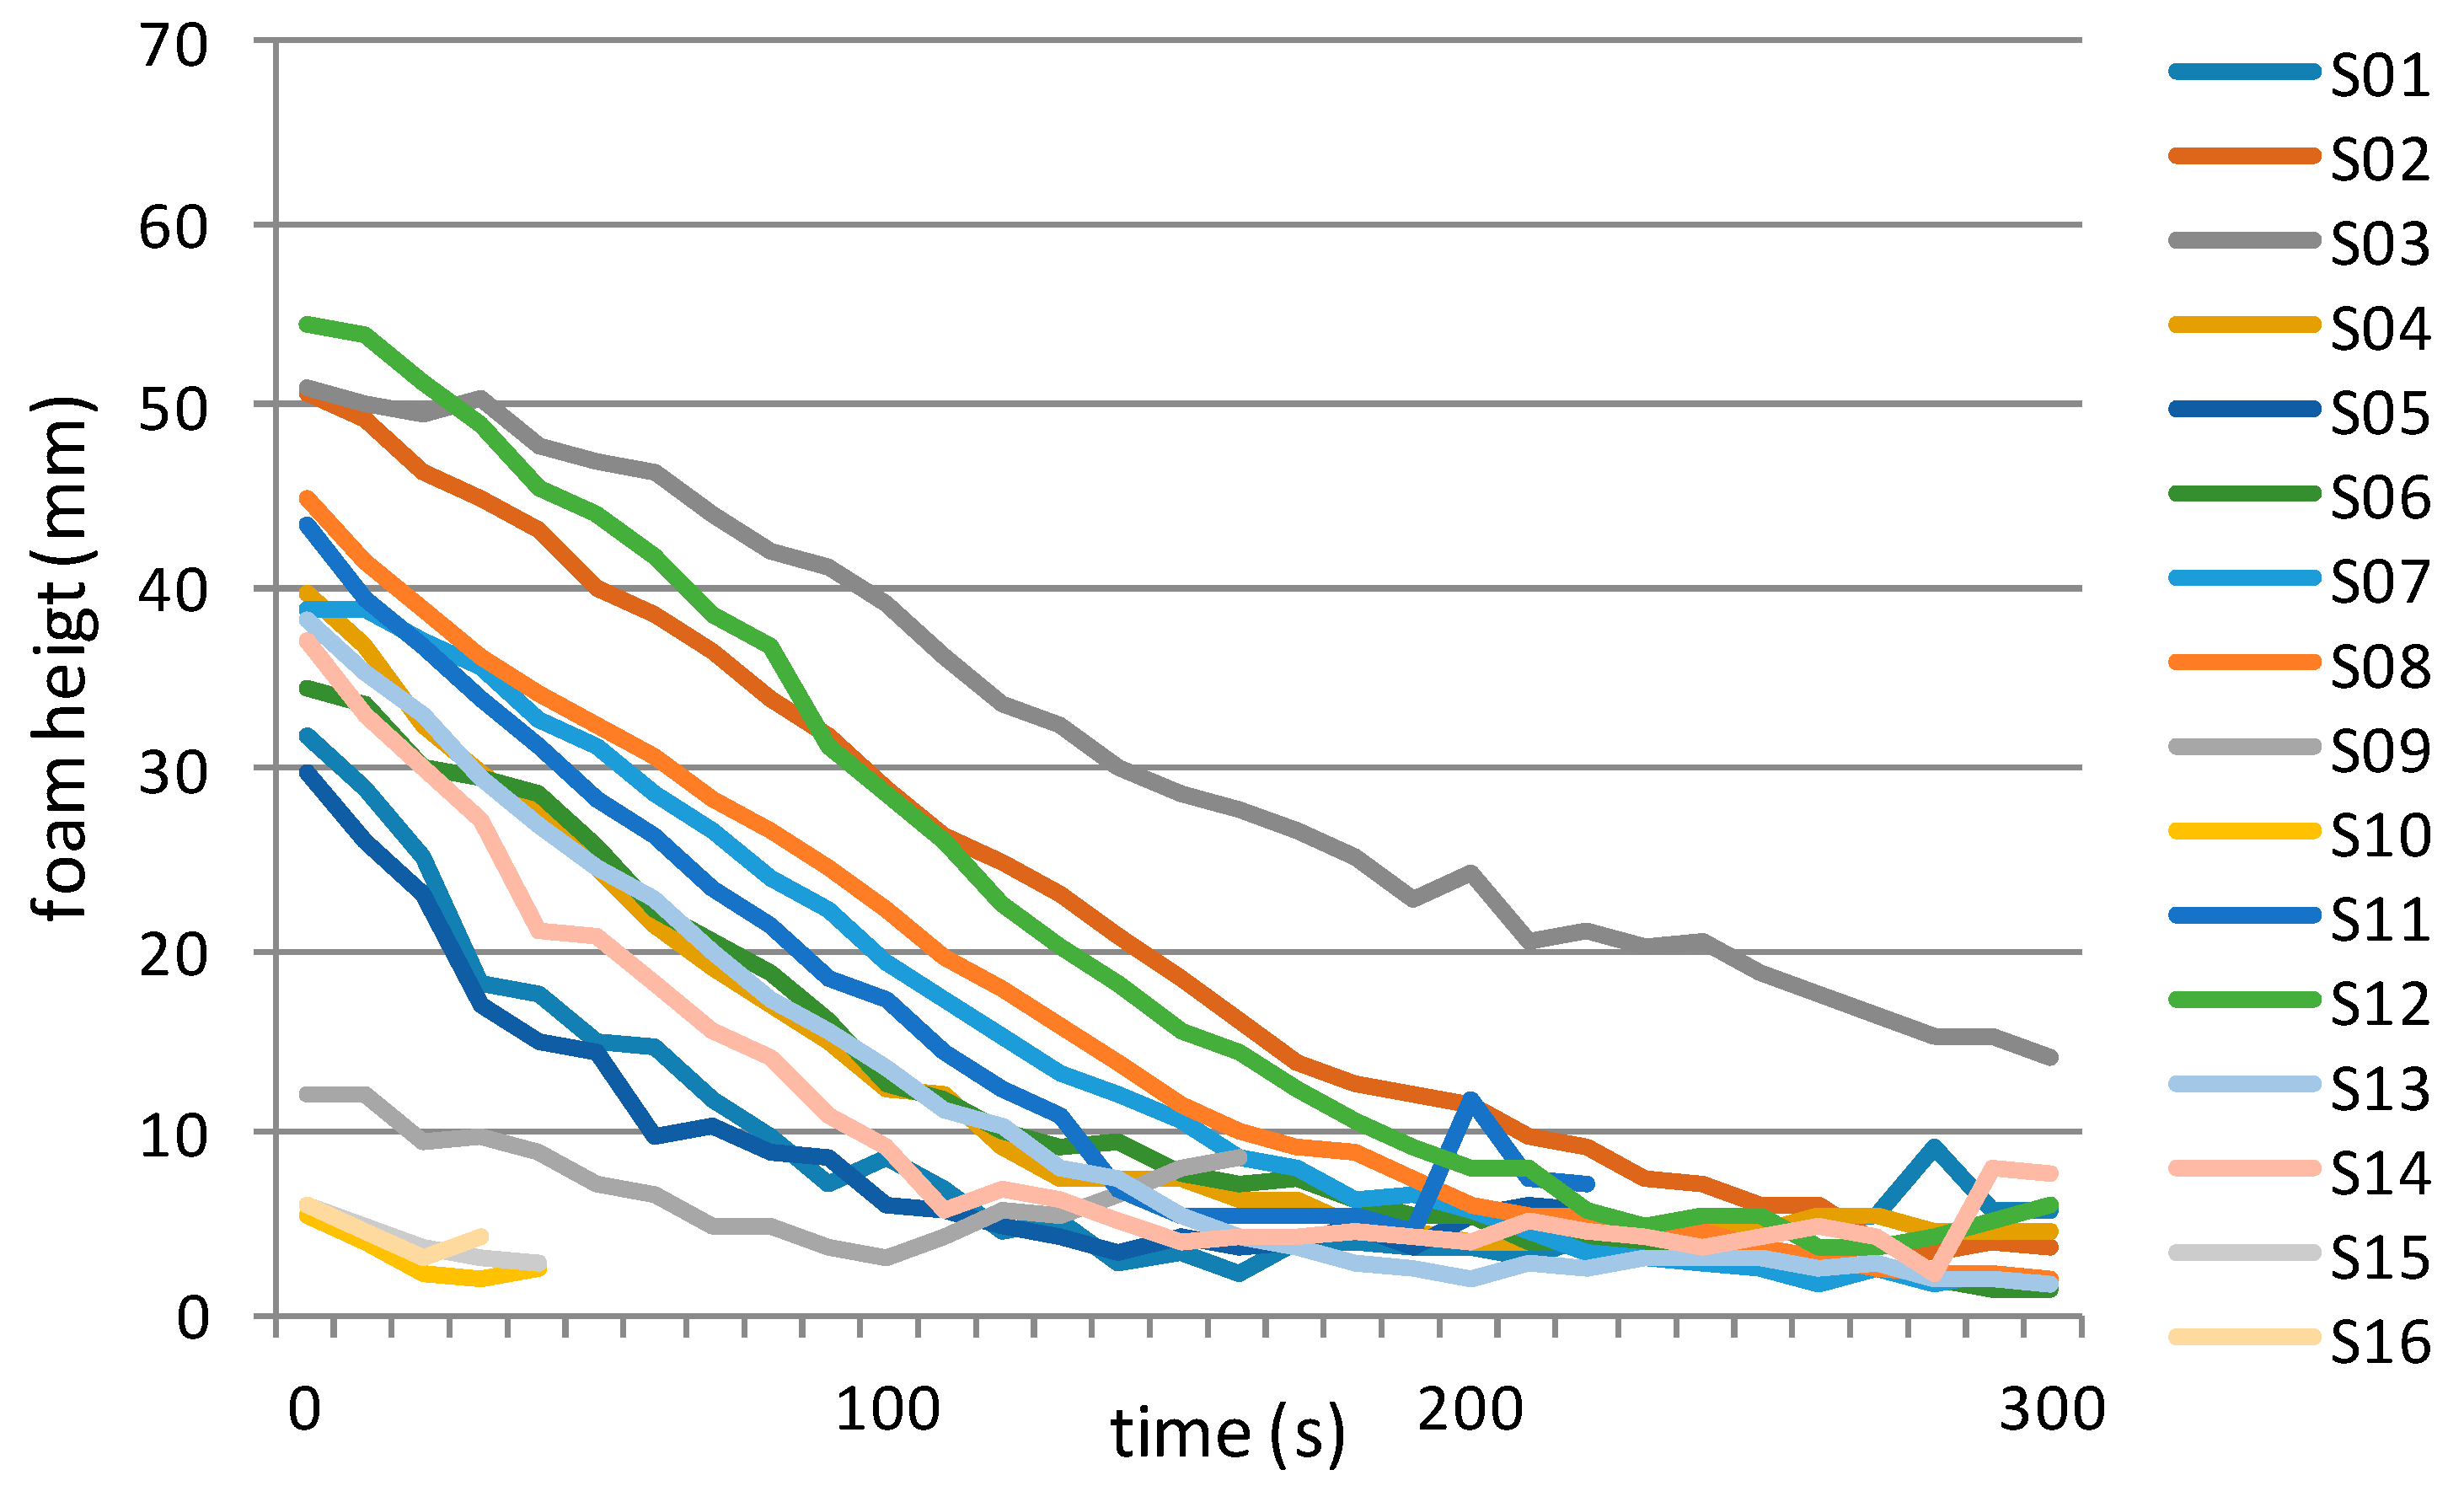
| Time | S01 | S02 | S03 | S04 | S05 | S06 | S07 | S08 | S09 | S10 | S11 | S12 | S13 | S14 | S15 | S16 |
| 0 | 32 | 51 | 51 | 40 | 30 | 34 | 39 | 45 | 12 | 6 | 43 | 55 | 38 | 37 | 6 | 6 |
| 10 | 29 | 49 | 50 | 37 | 26 | 33 | 39 | 41 | 12 | 4 | 39 | 54 | 35 | 33 | 5 | 5 |
| 20 | 25 | 46 | 49 | 33 | 23 | 30 | 37 | 39 | 9 | 2 | 37 | 51 | 33 | 30 | 4 | 3 |
| 30 | 18 | 45 | 50 | 30 | 17 | 29 | 36 | 36 | 10 | 2 | 34 | 49 | 30 | 27 | 3 | 4 |
| 40 | 18 | 43 | 48 | 27 | 15 | 28 | 33 | 34 | 9 | 3 | 31 | 45 | 27 | 21 | 3 | 10 |
| 50 | 15 | 40 | 47 | 25 | 14 | 26 | 31 | 32 | 7 | −211 | 28 | 44 | 24 | 21 | 7 | 12 |
| 60 | 15 | 39 | 46 | 21 | 10 | 22 | 29 | 31 | 7 | −212 | 26 | 42 | 23 | 18 | 21 | 25 |
| 70 | 12 | 37 | 44 | 19 | 10 | 21 | 27 | 28 | 5 | - | 23 | 39 | 20 | 16 | 25 | −210 |
| 80 | 10 | 34 | 42 | 17 | 9 | 19 | 24 | 27 | 5 | - | 21 | 37 | 17 | 14 | −236 | −210 |
| 90 | 7 | 32 | 41 | 15 | 9 | 16 | 22 | 25 | 4 | - | 18 | 31 | 16 | 11 | −244 | −204 |
| 100 | 9 | 29 | 39 | 12 | 6 | 13 | 19 | 22 | 3 | - | 17 | 29 | 14 | 9 | −217 | −205 |
| 110 | 7 | 26 | 36 | 12 | 6 | 12 | 17 | 20 | 4 | - | 14 | 26 | 11 | 6 | −220 | - |
| 120 | 4 | 25 | 34 | 9 | 5 | 10 | 15 | 18 | 6 | - | 12 | 23 | 10 | 7 | −223 | - |
| 130 | 5 | 23 | 32 | 7 | 4 | 9 | 13 | 16 | 5 | - | 11 | 20 | 8 | 6 | −226 | - |
| 140 | 3 | 21 | 30 | 8 | 3 | 10 | 12 | 14 | 7 | - | 7 | 18 | 7 | 5 | −247 | - |
| 150 | 3 | 19 | 29 | 7 | 4 | 8 | 11 | 12 | 8 | - | 6 | 16 | 5 | 4 | −261 | - |
| 160 | 2 | 16 | 28 | 6 | 4 | 7 | 9 | 10 | 9 | - | 6 | 14 | 4 | 4 | 32 | - |
| 170 | 4 | 14 | 27 | 6 | 4 | 7 | 8 | 9 | 15 | - | 5 | 12 | 4 | 4 | - | - |
| 180 | 4 | 13 | 25 | 5 | 5 | 6 | 6 | 9 | −213 | - | 5 | 11 | 3 | 5 | - | - |
| 190 | 4 | 12 | 23 | 5 | 4 | 5 | 7 | 8 | −213 | - | 5 | 9 | 3 | 4 | - | - |
| 200 | 4 | 12 | 24 | 4 | 5 | 5 | 6 | 6 | −213 | - | 12 | 8 | 2 | 4 | - | - |
| 210 | 3 | 10 | 21 | 4 | 6 | 4 | 5 | 5 | −213 | - | 7 | 8 | 3 | 5 | - | - |
| 220 | 4 | 9 | 21 | 4 | 6 | 4 | 3 | 5 | −213 | - | 7 | 6 | 2 | 5 | - | - |
| 230 | 4 | 7 | 20 | 5 | 21 | 4 | 3 | 5 | 42 | - | −205 | 5 | 3 | 4 | - | - |
| 240 | 5 | 7 | 20 | 4 | −183 | 3 | 3 | 5 | −212 | - | 11 | 5 | 3 | 4 | - | - |
| 250 | 4 | 6 | 19 | 5 | −183 | 3 | 2 | 4 | −211 | - | 7 | 5 | 3 | 4 | - | - |
| 260 | 5 | 6 | 18 | 5 | −184 | 2 | 2 | 3 | −213 | - | 15 | 4 | 3 | 5 | - | - |
| 270 | 5 | 4 | 17 | 5 | −181 | 3 | 2 | 2 | - | - | −216 | 4 | 3 | 4 | - | - |
| 280 | 9 | 4 | 15 | 5 | −181 | 2 | 2 | 2 | - | - | −200 | 4 | 2 | 2 | - | - |
| 290 | 6 | 4 | 15 | 4 | −179 | 1 | 2 | 2 | - | - | −202 | 5 | 2 | 8 | - | - |
| 300 | 6 | 4 | 14 | 4 | −179 | 1 | 2 | 2 | - | - | −202 | 6 | 2 | 8 | - | - |
Publisher’s Note: MDPI stays neutral with regard to jurisdictional claims in published maps and institutional affiliations. |
© 2021 by the authors. Licensee MDPI, Basel, Switzerland. This article is an open access article distributed under the terms and conditions of the Creative Commons Attribution (CC BY) license (https://creativecommons.org/licenses/by/4.0/).
Share and Cite
Habschied, K.; Glavaš, H.; Nyarko, E.K.; Mastanjević, K. Complementing Digital Image Analysis and Laser Distance Meter in Beer Foam Stability Determination. Fermentation 2021, 7, 113. https://doi.org/10.3390/fermentation7030113
Habschied K, Glavaš H, Nyarko EK, Mastanjević K. Complementing Digital Image Analysis and Laser Distance Meter in Beer Foam Stability Determination. Fermentation. 2021; 7(3):113. https://doi.org/10.3390/fermentation7030113
Chicago/Turabian StyleHabschied, Kristina, Hrvoje Glavaš, Emmanuel Karlo Nyarko, and Krešimir Mastanjević. 2021. "Complementing Digital Image Analysis and Laser Distance Meter in Beer Foam Stability Determination" Fermentation 7, no. 3: 113. https://doi.org/10.3390/fermentation7030113
APA StyleHabschied, K., Glavaš, H., Nyarko, E. K., & Mastanjević, K. (2021). Complementing Digital Image Analysis and Laser Distance Meter in Beer Foam Stability Determination. Fermentation, 7(3), 113. https://doi.org/10.3390/fermentation7030113