
Artificial Neural Networks and Gompertz Functions for Modelling and Prediction of Solvents Produced by the S. cerevisiae Safale S04 Yeast


Abstract
:1. Introduction
2. Materials and Methods
2.1. Wort Production, Fermentation Process and Data Acquisition
2.2. Sample Description and Experimental Data and Analysis of Solvents Using GC-FID
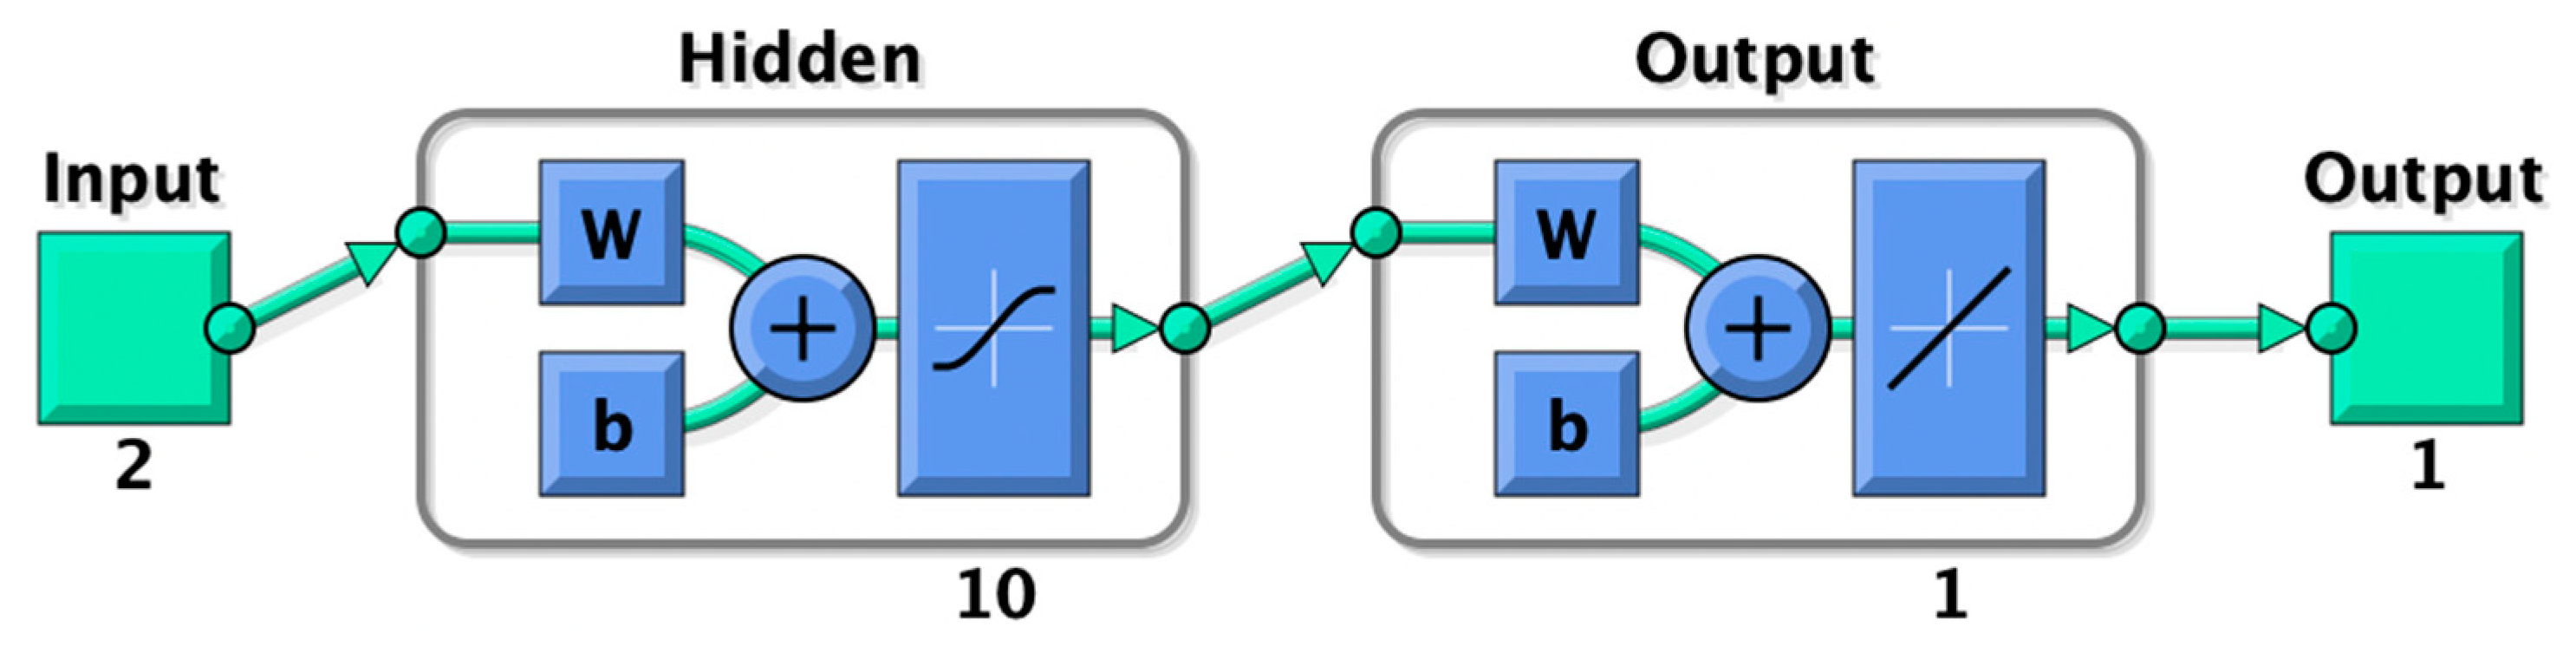
2.3. Mathematical Fitting Models: Gompertz Functions and ANNs
2.4. Statistical Analysis
3. Results and Discussion
4. Conclusions
Author Contributions
Funding
Data Availability Statement
Acknowledgments
Conflicts of Interest
References
- Beer Faults. Available online: https://dev.bjcp.org/education-training/education-resources/beer-faults/ (accessed on 25 August 2021).
- Viejo, C.G.; Fuentes, S.; Torrico, D.D.; Godbole, A.; Dunshea, F.R. Chemical characterization of aromas in beer and their effect on consumers liking. Food Chem. 2019, 293, 479–485. [Google Scholar] [CrossRef]
- Pires, E.J.; Teixeira, J.A.; Branyik, T.; Vicente, A.A. Yeast: The soul of beer’s aroma-a review of flavour-active esters and higher alcohols produced by the brewing yeast. Appl. Microbiol. Biotechnol. 2014, 98, 1937–1949. [Google Scholar] [CrossRef] [Green Version]
- Loviso, C.L.; Libkind, D. Synthesis and regulation of flavor compounds derived from brewing yeast: Esters. Rev. Argent. Microbiol. 2018, 50, 436–446. [Google Scholar] [CrossRef]
- Loviso, C.L.; Libkind, D. Synthesis and regulation of flavor compounds derived from brewing yeast: Fusel alcohols. Rev. Argent. Microbiol. 2019. [Google Scholar] [CrossRef]
- Membré, J.M.; Tholozan, J.L. Modeling growth and off-flavours production of spoiled beer bacteria, Pectinatus frisingensis. J. Appl. Bacteriol. 1994, 77, 456–460. Available online: https://onlinelibrary.wiley.com/doi/abs/10.1111/j.1365-2672.1994.tb03449.x (accessed on 10 September 2021). [CrossRef]
- Zhang, Y.; Jia, S.; Zhang, W. Predicting acetic acid content in the final beer using neural networks and support vector machine. J. Inst. Brew. 2012, 118, 361–367. [Google Scholar] [CrossRef]
- Trelea, I.C.; Titica, M.; Landaud, S.; Latrille, E.; Corrieu, G.; Cheruy, A. Predictive modelling of brewing fermentation: From knowledge-based to black-box models. Math. Comput. Simul. 2001, 56, 405–424. [Google Scholar] [CrossRef]
- Shi, Y.; Gong, F.; Wang, M.; Liv, J.; Wu, Y.; Men, H. A deep feature mining method of electronic nose sensor data for identifying beer olfactory information. J. Food Eng. 2019, 263, 437–445. [Google Scholar] [CrossRef]
- Siadat, M.; Losson, E.; Ghasemi-Varnamkhasti, M.; Mohtasebi, S.S. Application of Electronic Nose to Beer Recognition Using Supervised Artificial Neural Networks; IEEE: New York, NY, USA, 2014; p. 645. [Google Scholar]
- Sanchez, C.; Lozano, J.; Pedro Santos, J.; Azabal, A.; Ruiz-Valdepenas, S. Discrimination of aromas in beer with electronic nose. In Proceedings of the 2018 12th Spanish Conference on Electron. Devices (Cde), Salamanca, Spain, 14–16 November, 2018; Mateos, J.G.T., Ed.; IEEE: New York, NY, USA, 2018. [Google Scholar]
- Viejo, C.G.; Fuentes, S.; Godbole, A.; Widdicombe, B.; Unnithan, R.R. Development of a low-cost e-nose to assess aroma profiles: An artificial intelligence application to assess beer quality. Sens. Actuator B Chem. 2020, 308, 127688. [Google Scholar] [CrossRef]
- Brewing with E2U™: No More Rehydration Needed. Available online: https://fermentis.com/en/knowledge-center/expert-insights/beer/brewing-easy-2-use/ (accessed on 1 September 2021).
- Loira, I.; Vejarano, R.; Morata, A.; Ricardo-da-Silva, J.M.; Laureano, O.; González, M.C.; Suárez-Lepe, J.A. Effect of Saccharomyces strains on the quality of red wines aged on lees. Food Chem. 2013, 139, 1044–1051. Available online: https://www.sciencedirect.com/science/article/pii/S0308814613000423 (accessed on 10 September 2021). [CrossRef]
- Zwietering, M.H.; Jongenburger, I.; Rombouts, F.M.; Van’t Riet, K.J. Modeling of the Bacterial Growth Curve. Appl. Environ. Microbiol. 1990, 56, 1875–1881. [Google Scholar] [CrossRef] [Green Version]
- Singh, S.; Singh, K.N.; Mandjiny, S.; Holmes, L. Modeling the Growth of Lactococcus lactis NCIM 2114 under Differently Aerated and Agitated Conditions in Broth Medium. Fermentation 2015, 1, 86. [Google Scholar] [CrossRef]
- Benucci, I.; Cecchi, T.; Lombardelli, C.; Maresca, D.; Mauriello, G.; Esti, M. Novel microencapsulated yeast for the primary fermentation of green beer: Kinetic behavior, volatiles and sensory profile. Food Chem. 2021, 340, 127900. [Google Scholar] [CrossRef]
- Canonico, L.; Ciani, E.; Galli, E.; Comitini, F.; Ciani, M. Evolution of Aromatic Profile of Torulaspora delbrueckii Mixed Fermentation at Microbrewery Plant. Fermentation 2020, 6, 7. Available online: https://explore.openaire.eu/search/publication?articleId=dedup_wf_001::158f64d9bee437bd2369d2594d11e338 (accessed on 8 September 2021). [CrossRef] [Green Version]
- Garcia, A.I.; Garcia, L.A.; Diaz, M. Fusel Alcohols Production in Beer Fermentation Processes. Process. Biochem 1994, 29, 303–309. [Google Scholar] [CrossRef]
- Garcia, A.I.; Garcia, L.A.; Diaz, M. Prediction of ester production in industrial beer fermentation. Enzym. Microb. Technol. 1994, 16, 66–71. [Google Scholar] [CrossRef]
- Riverol, C.; Cooney, J. Estimation of the ester formation during beer fermentation using neural networks. J. Food Eng. 2007, 82, 585–588. [Google Scholar] [CrossRef]
- Stewart, G. The Production of Secondary Metabolites with Flavour Potential during Brewing and Distilling Wort Fermentations. Fermentation 2017, 3, 63. Available online: https://search.proquest.com/docview/2124628708 (accessed on 11 September 2021). [CrossRef] [Green Version]
- De Francesco, G.; Marconi, O.; Sileoni, V.; Freeman, G.; Lee, E.G.; Floridi, S.; Perretti, G. Influence of the dealcoholisation by osmotic distillation on the sensory properties of different beer types. J. Food Sci. Technol.-Mysore 2020, 58, 1488–1498. [Google Scholar] [CrossRef] [PubMed]
- Olaniran, A.O.; Hiralal, L.; Mokoena, M.P.; Pillay, B. Flavour-active volatile compounds in beer: Production, regulation and control. J. Inst. Brew. 2017, 123, 13–23. [Google Scholar] [CrossRef] [Green Version]
- Gonzalez Viejo, C.; Torrico, D.D.; Dunshea, F.R.; Fuentes, S. Development of Artificial Neural Network Models to Assess Beer Acceptability Based on Sensory Properties Using a Robotic Pourer: A Comparative Model Approach to Achieve an Artificial Intelligence System. Beverages 2019, 5, 33. Available online: https://explore.openaire.eu/search/publication?articleId=dedup_wf_001::0efb80f70f10e64e85f2ec0ba398dbd7 (accessed on 15 August 2021). [CrossRef] [Green Version]
- Tjorve, K.M.C.; Tjorve, E. The use of Gompertz models in growth analyses, and new Gompertz-model approach: An addition to the Unified-Richards family. PLoS ONE 2017, 12, e0178691. Available online: https://www.ncbi.nlm.nih.gov/pubmed/28582419 (accessed on 1 August 2021). [CrossRef] [PubMed]


| Dataset (Setpoints) | Max | Min | Mean | SD |
|---|---|---|---|---|
| 1 (15.0) | 15.0 | 14.4 | 14.5 | 0.225 |
| 2 (16.5) | 16.1 | 14.4 | 15.8 | 0.265 |
| 3 (18.0) | 17.8 | 16.7 | 17.2 | 0.225 |
| 4 (19.0) | 18.3 | 17.8 | 18.1 | 0.247 |
| 5 (21.0) | 20.6 | 20.0 | 20.1 | 0.183 |
| Dataset | Compound | Factor | Gompertz (with 95% Confidence Bounds) | ||||
|---|---|---|---|---|---|---|---|
| Temperature (°C) | a or A [mg L−1] | b | c [h−1] | kg [mg L−1 h−1] | λ [h] | ||
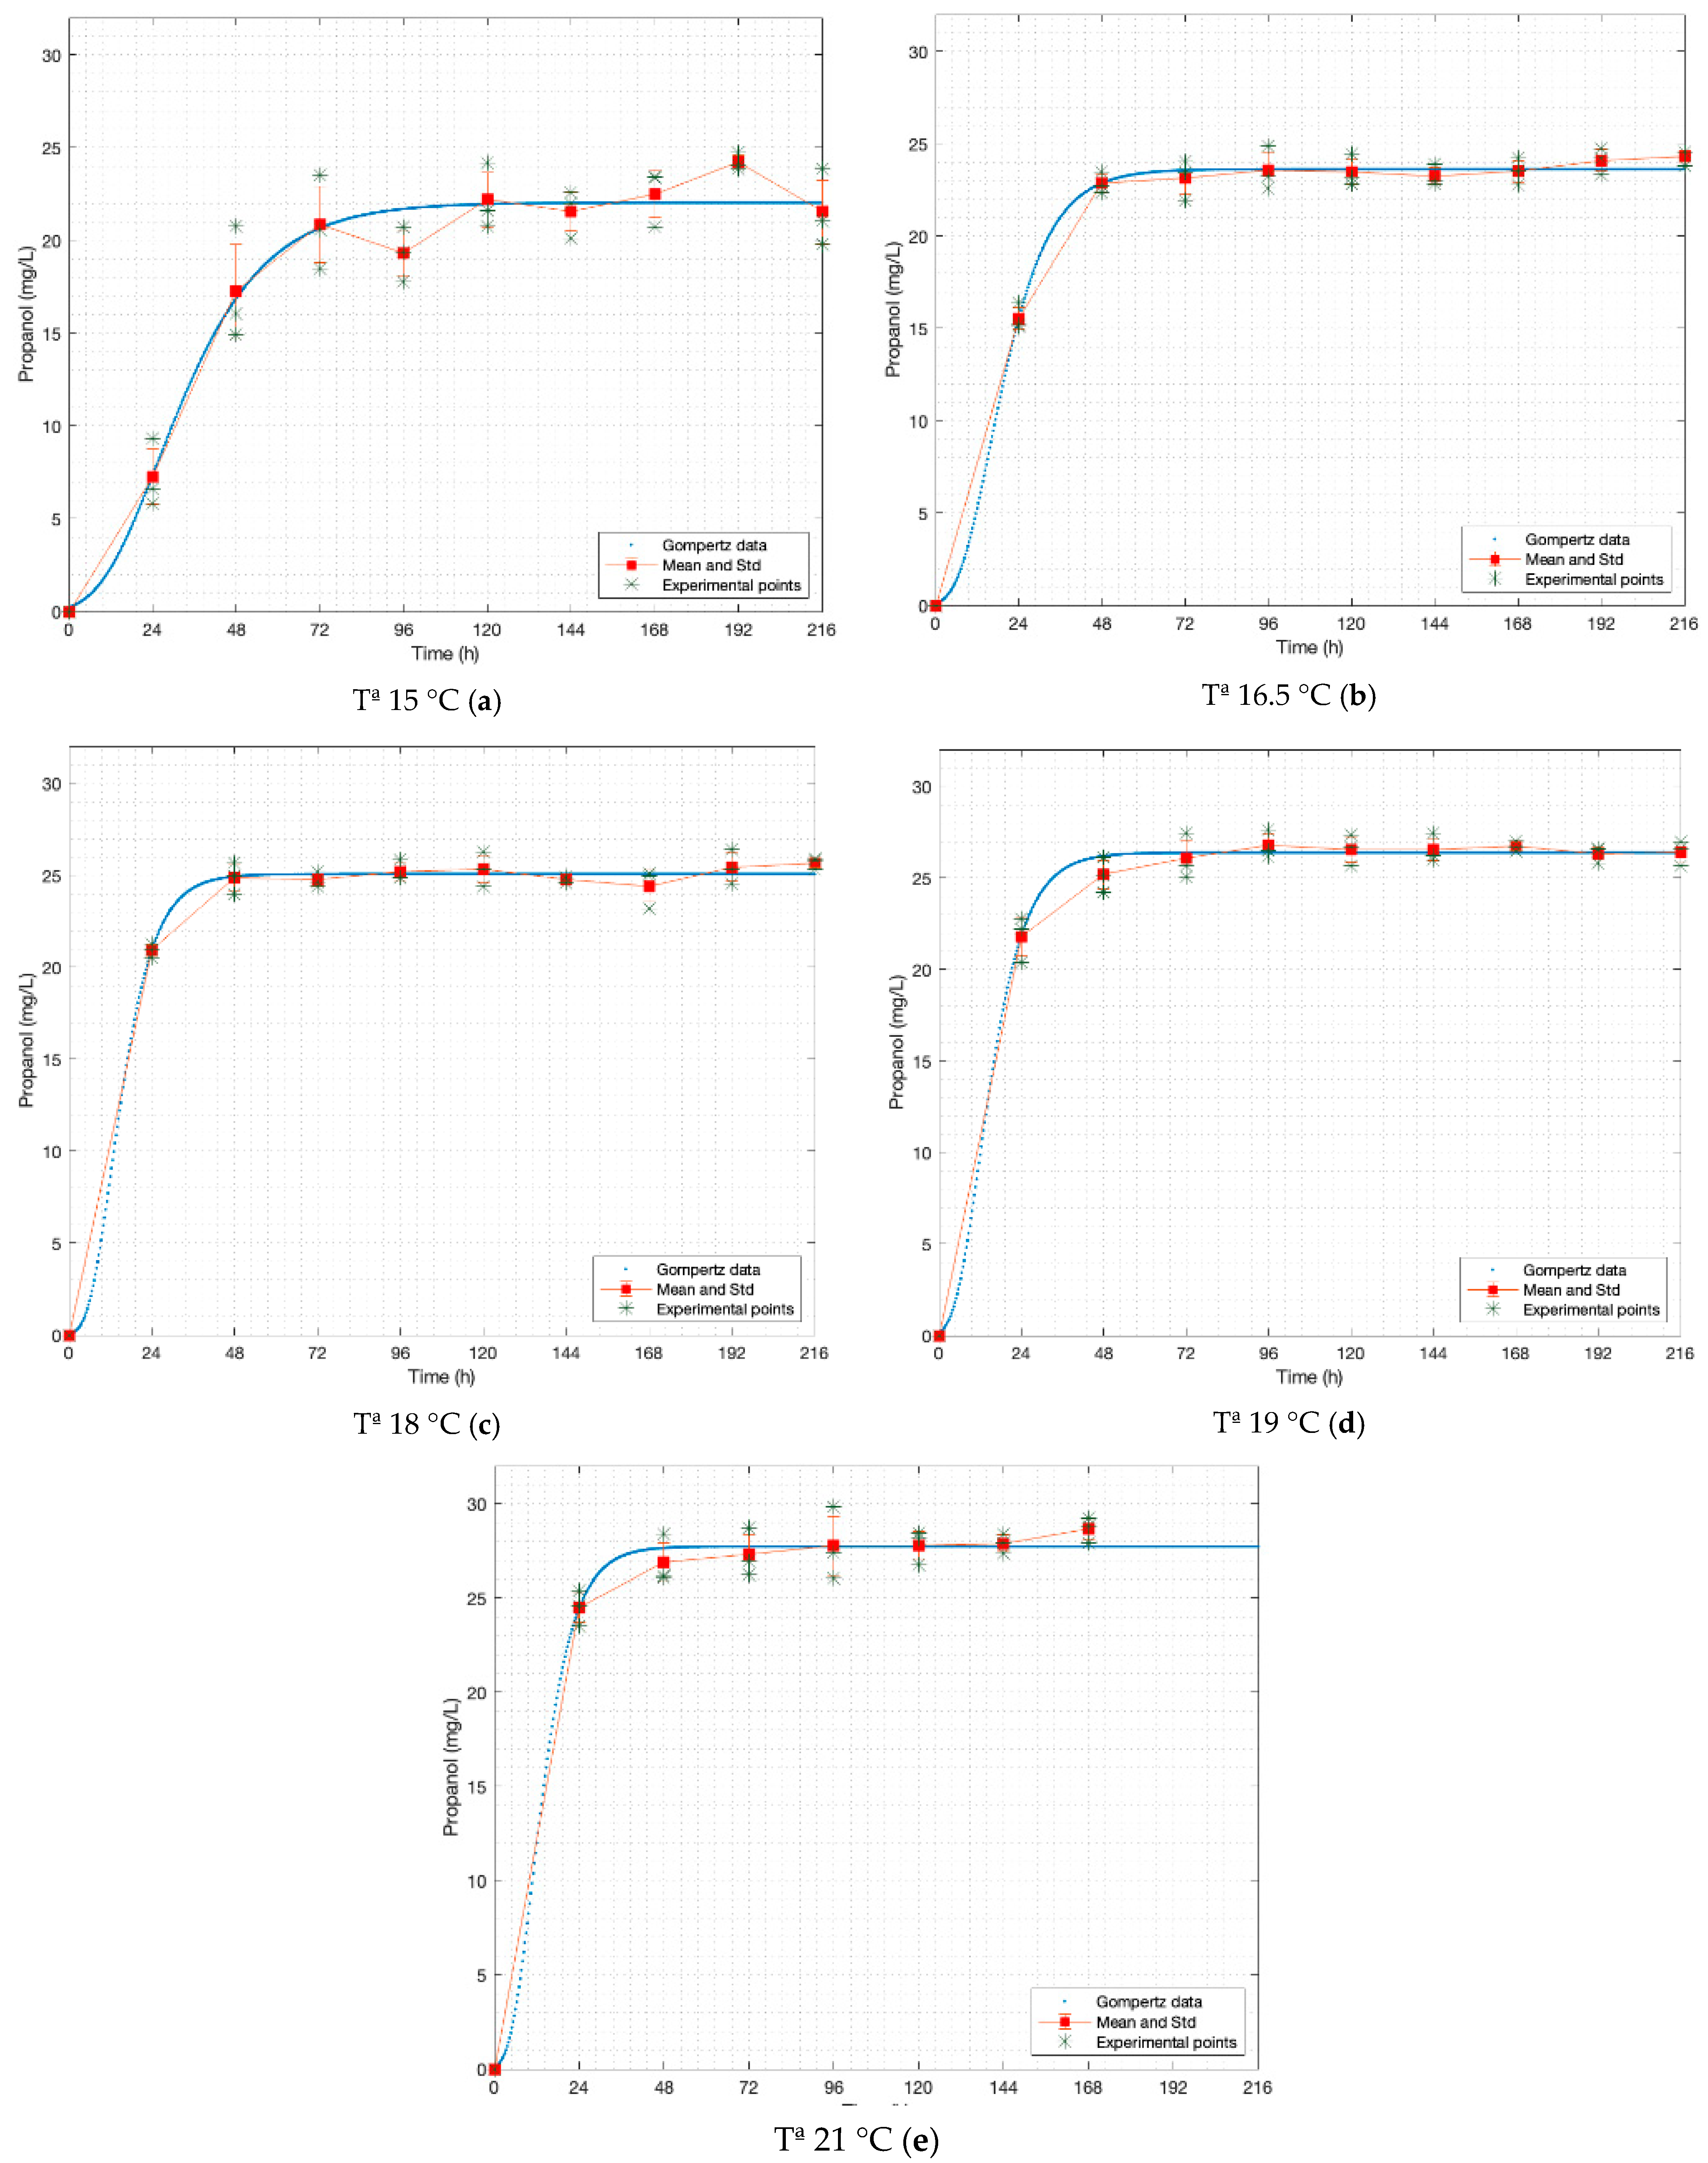
| 1 | n-propanol | 15.0 | 22.04 (21.07, 23.01) | 1.511 (0.842, 2.181) | 1.417 (0.897, 1.937) | 0.48 | 8.66 |
| 2 | 16.5 | 23.63 (23.30, 23.96) | 1.684 (0.726, 2.643) | 2.554 (1.598, 3.510) | 0.93 | 6.43 | |
| 3 | 18.0 | 25.08 (24.79, 25.37) | 1.839 (−0.699, 4.378) | 3.547 (0.995, 6.099) | 1.36 | 5.68 | |
| 4 | 19.0 | 26.39 (26.04, 26.75) | 1.628 (0.450, 2.806) | 3.291 (2.085, 4.497) | 1.33 | 4.58 | |
| 5 | 21.0 | 27.72 (27.20, 28.25) | 1.722 (−0.482, 3.926) | 3.799 (1.545, 6.054) | 1.61 | 4.56 | |
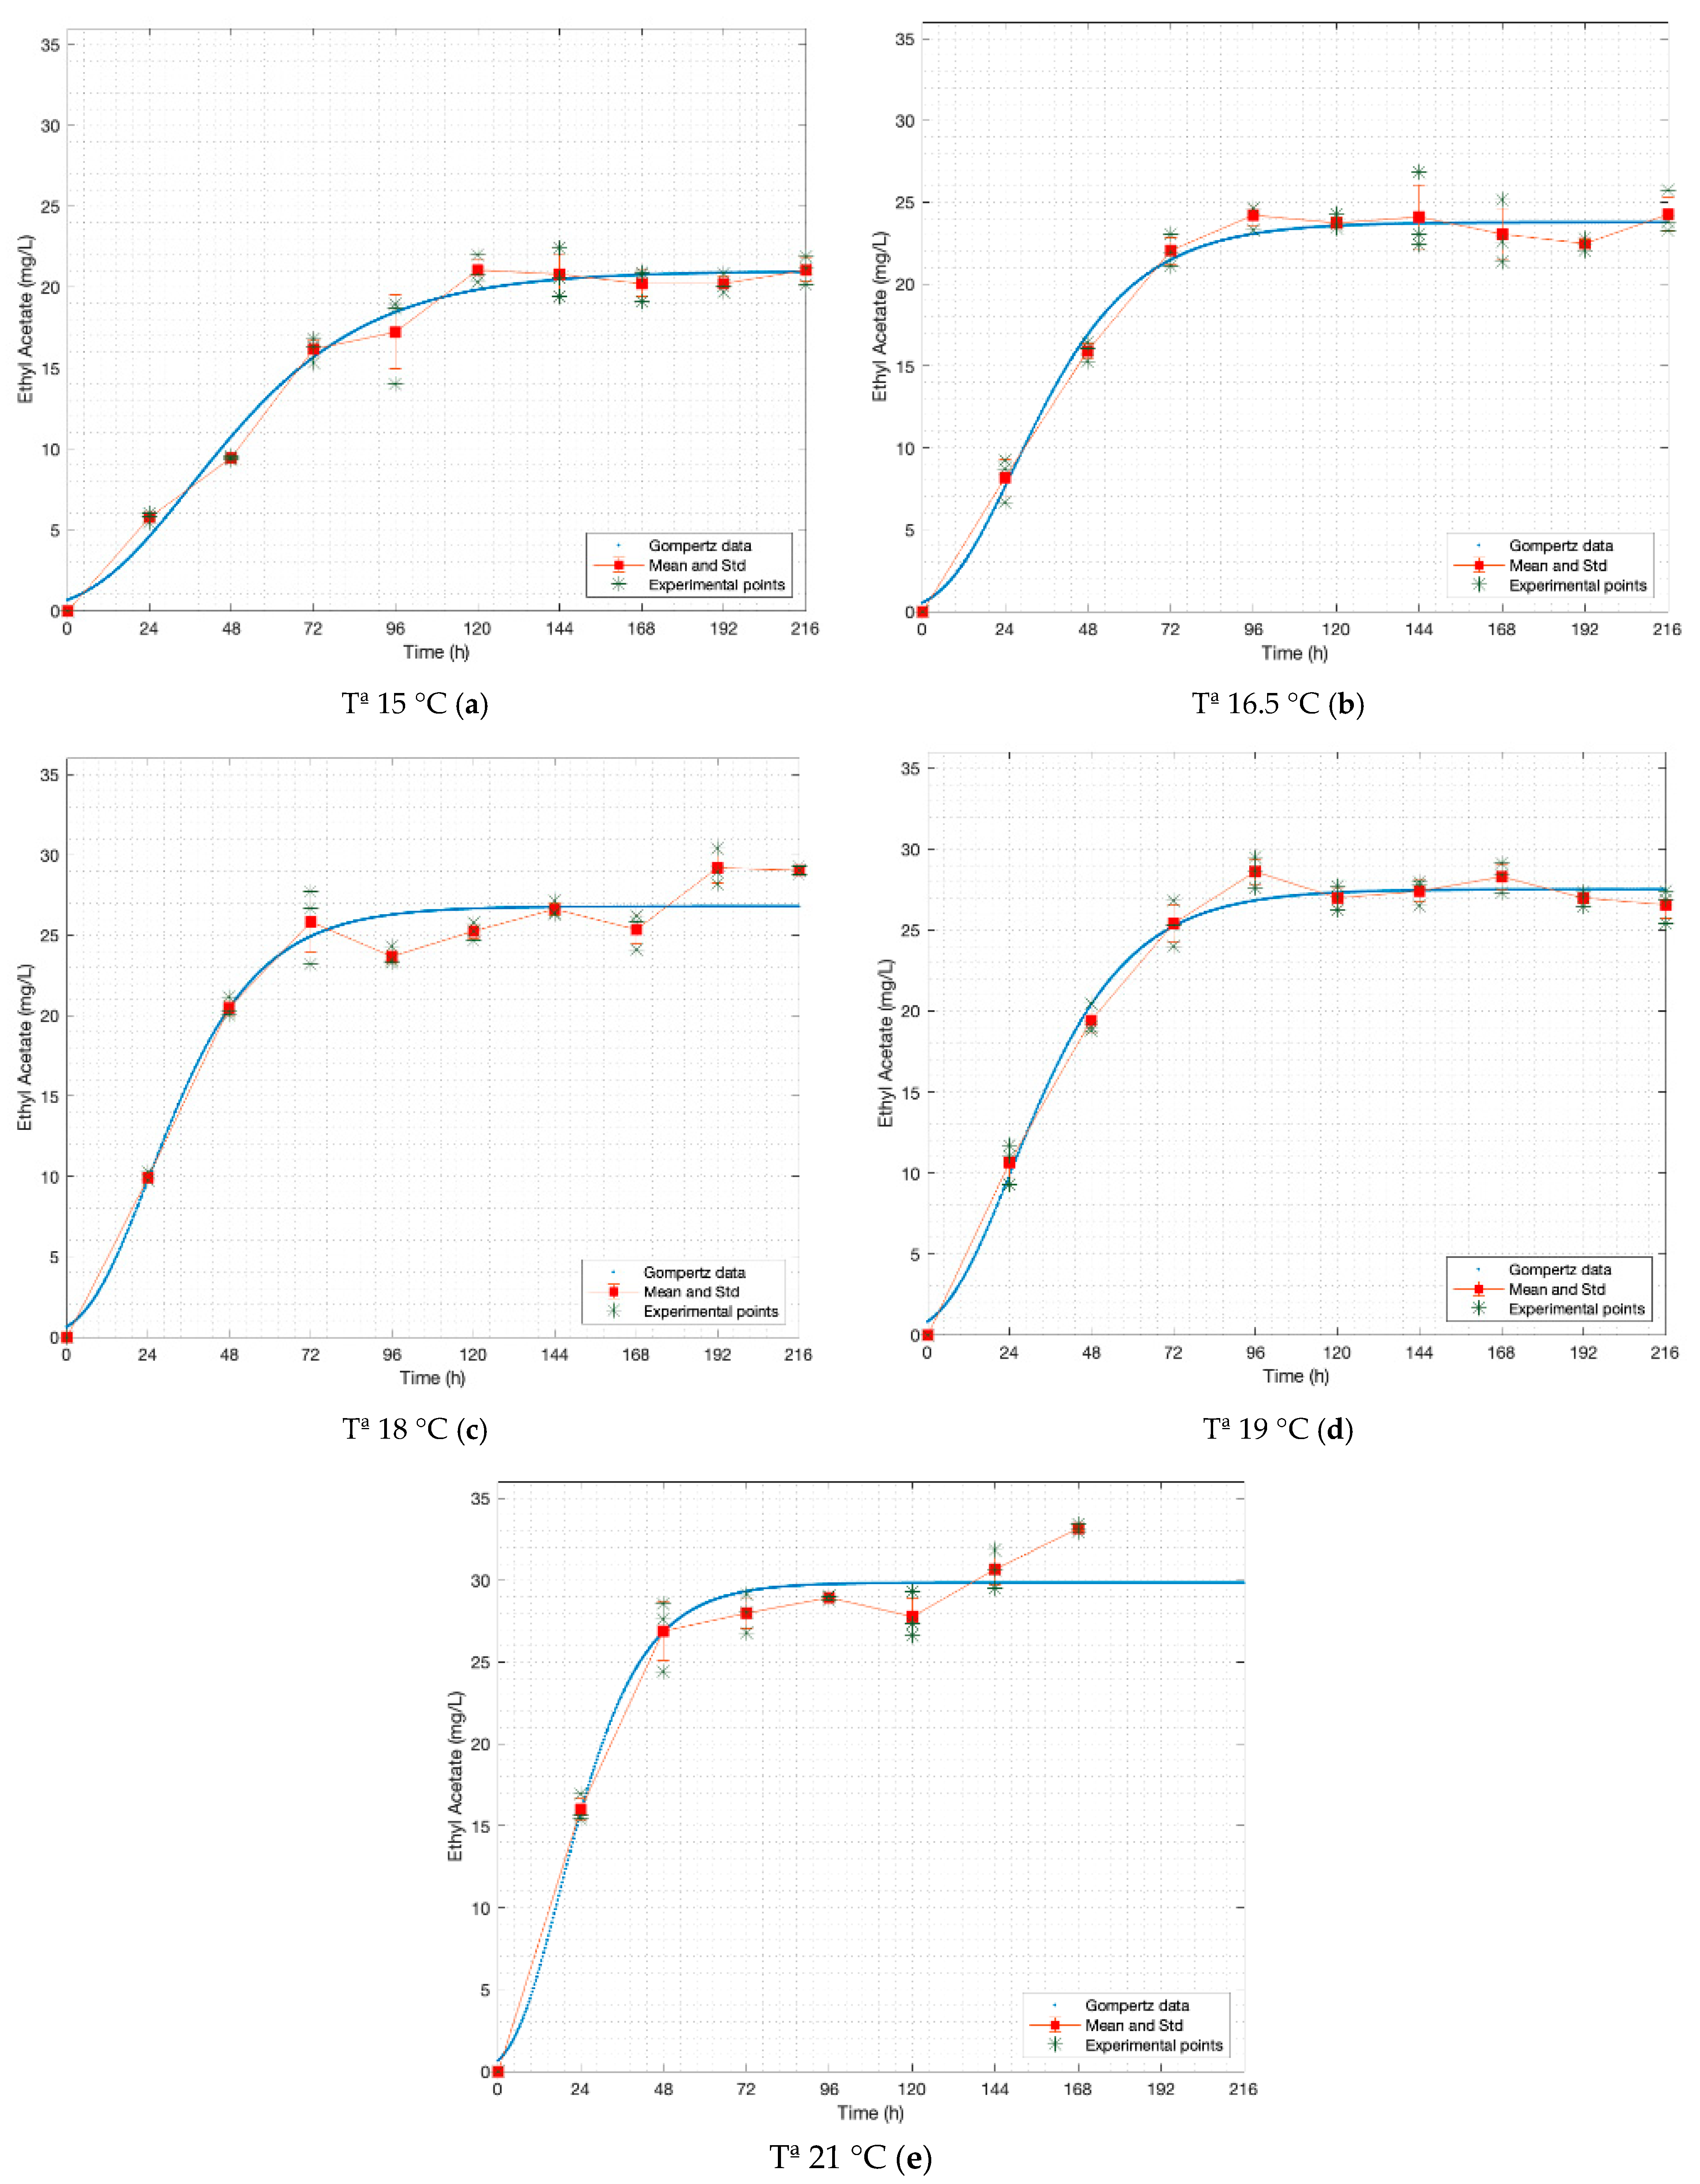
| 1 | ethyl acetate | 15.0 | 20.99 (20.17, 21.81) | 1.240 (0.943, 1.538) | 0.823 (0.657, 0.989) | 0.27 | 7.01 |
| 2 | 16.5 | 23.78 (23.08, 24.47) | 1.339 (0.985, 1.694) | 1.210 (0.953, 1.467) | 0.44 | 6.73 | |
| 3 | 18.0 | 26.80 (25.89, 27.71) | 1.326 (0.873, 1.780) | 1.319 (0.963, 1.675) | 0.54 | 5.94 | |
| 4 | 19.0 | 27.53 (26.86, 28.20) | 1.261 (0.966, 1.556) | 1.235 (1.009, 1.460) | 0.52 | 5.07 | |
| 5 | 21.0 | 29.85 (28.77, 30.93) | 1.343 (0.681, 2.004) | 1.793 (1.153, 2.433) | 0.82 | 4.59 | |
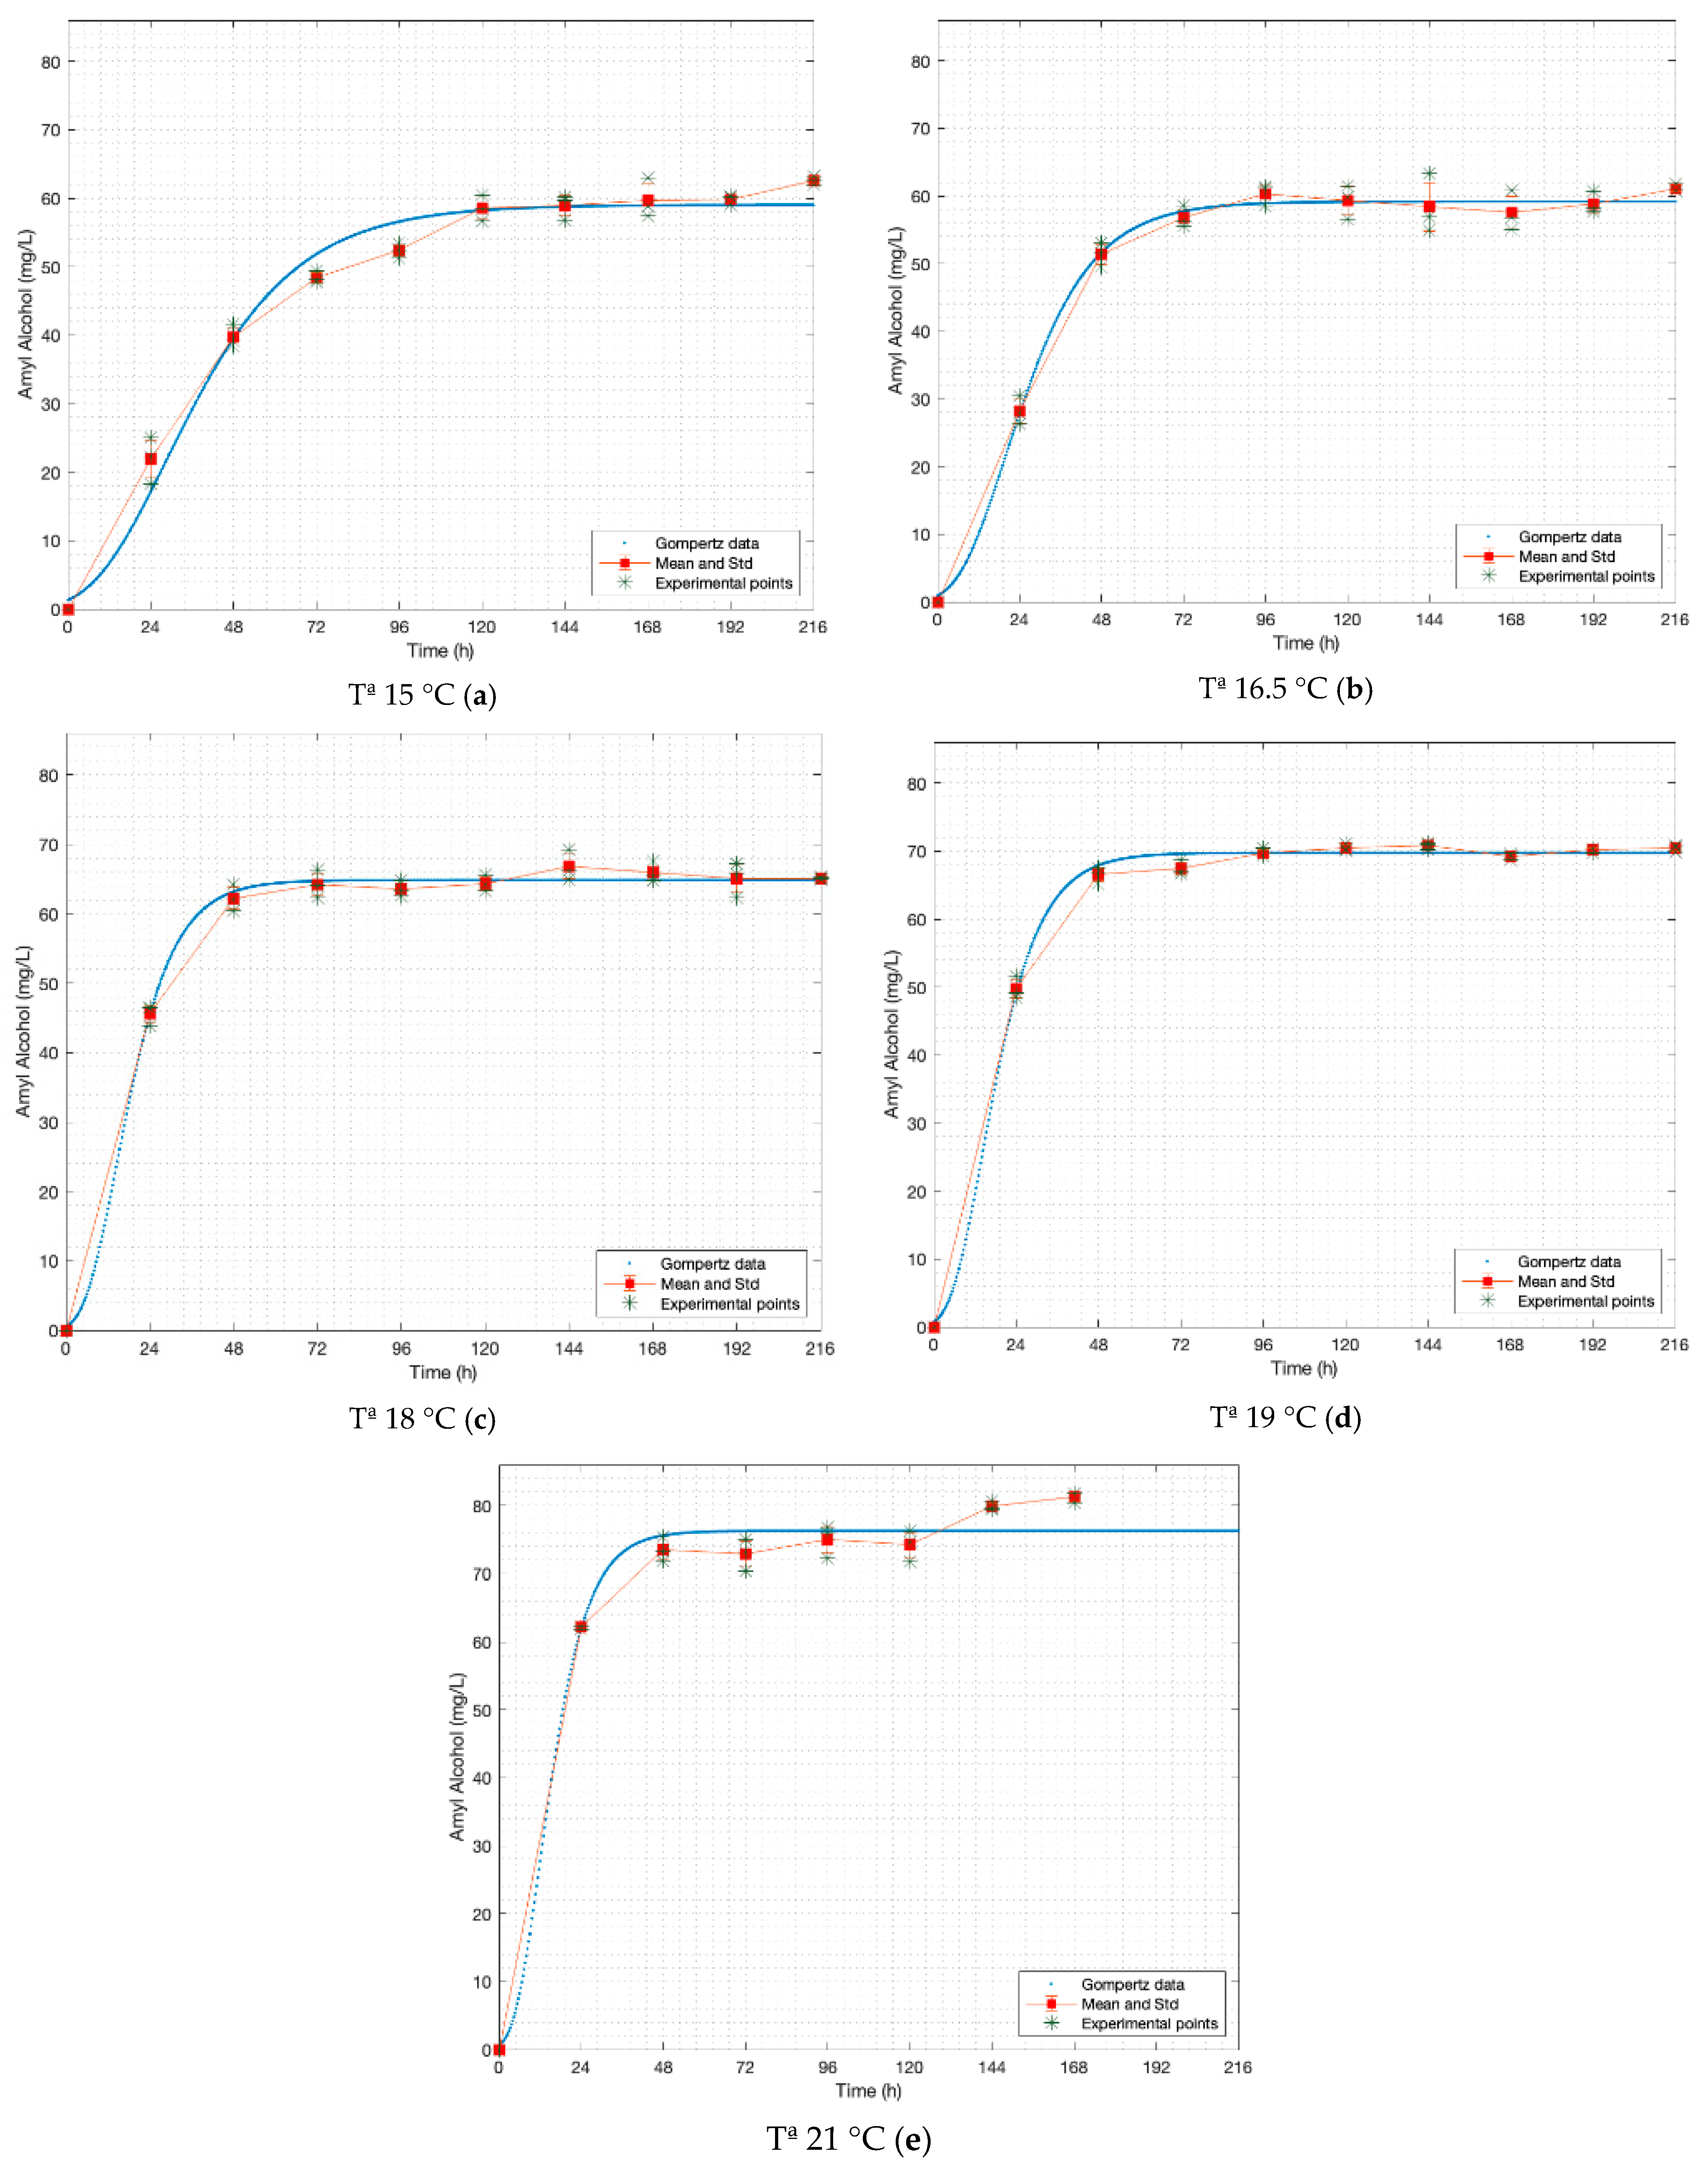
| 1 | amyl alcohol | 15.0 | 59.04 (57.45, 60.63) | 1.340 (ND *) | 1.127 (1.031, 1.223) | 1.02 | 7.24 |
| 2 | 16.5 | 59.18 (58.05, 60.31) | 1.432 (1.028, 1.835) | 1.714 (1.346, 2.082) | 1.56 | 6.05 | |
| 3 | 18.0 | 64.88 (64.12, 65.63) | 1.575 (0.875, 2.275) | 2.611 (1.905, 3.317) | 2.60 | 5.29 | |
| 4 | 19.0 | 69.79 (69.24, 70.33) | 1.526 (1.120, 1.933) | 2.572 (2.160, 2.984) | 2.75 | 4.91 | |
| 5 | 21.0 | 76.28 (74.65, 77.91) | 1.589 (0.217, 2.961) | 3.156 (1.743, 4.569) | 3.69 | 4.48 | |
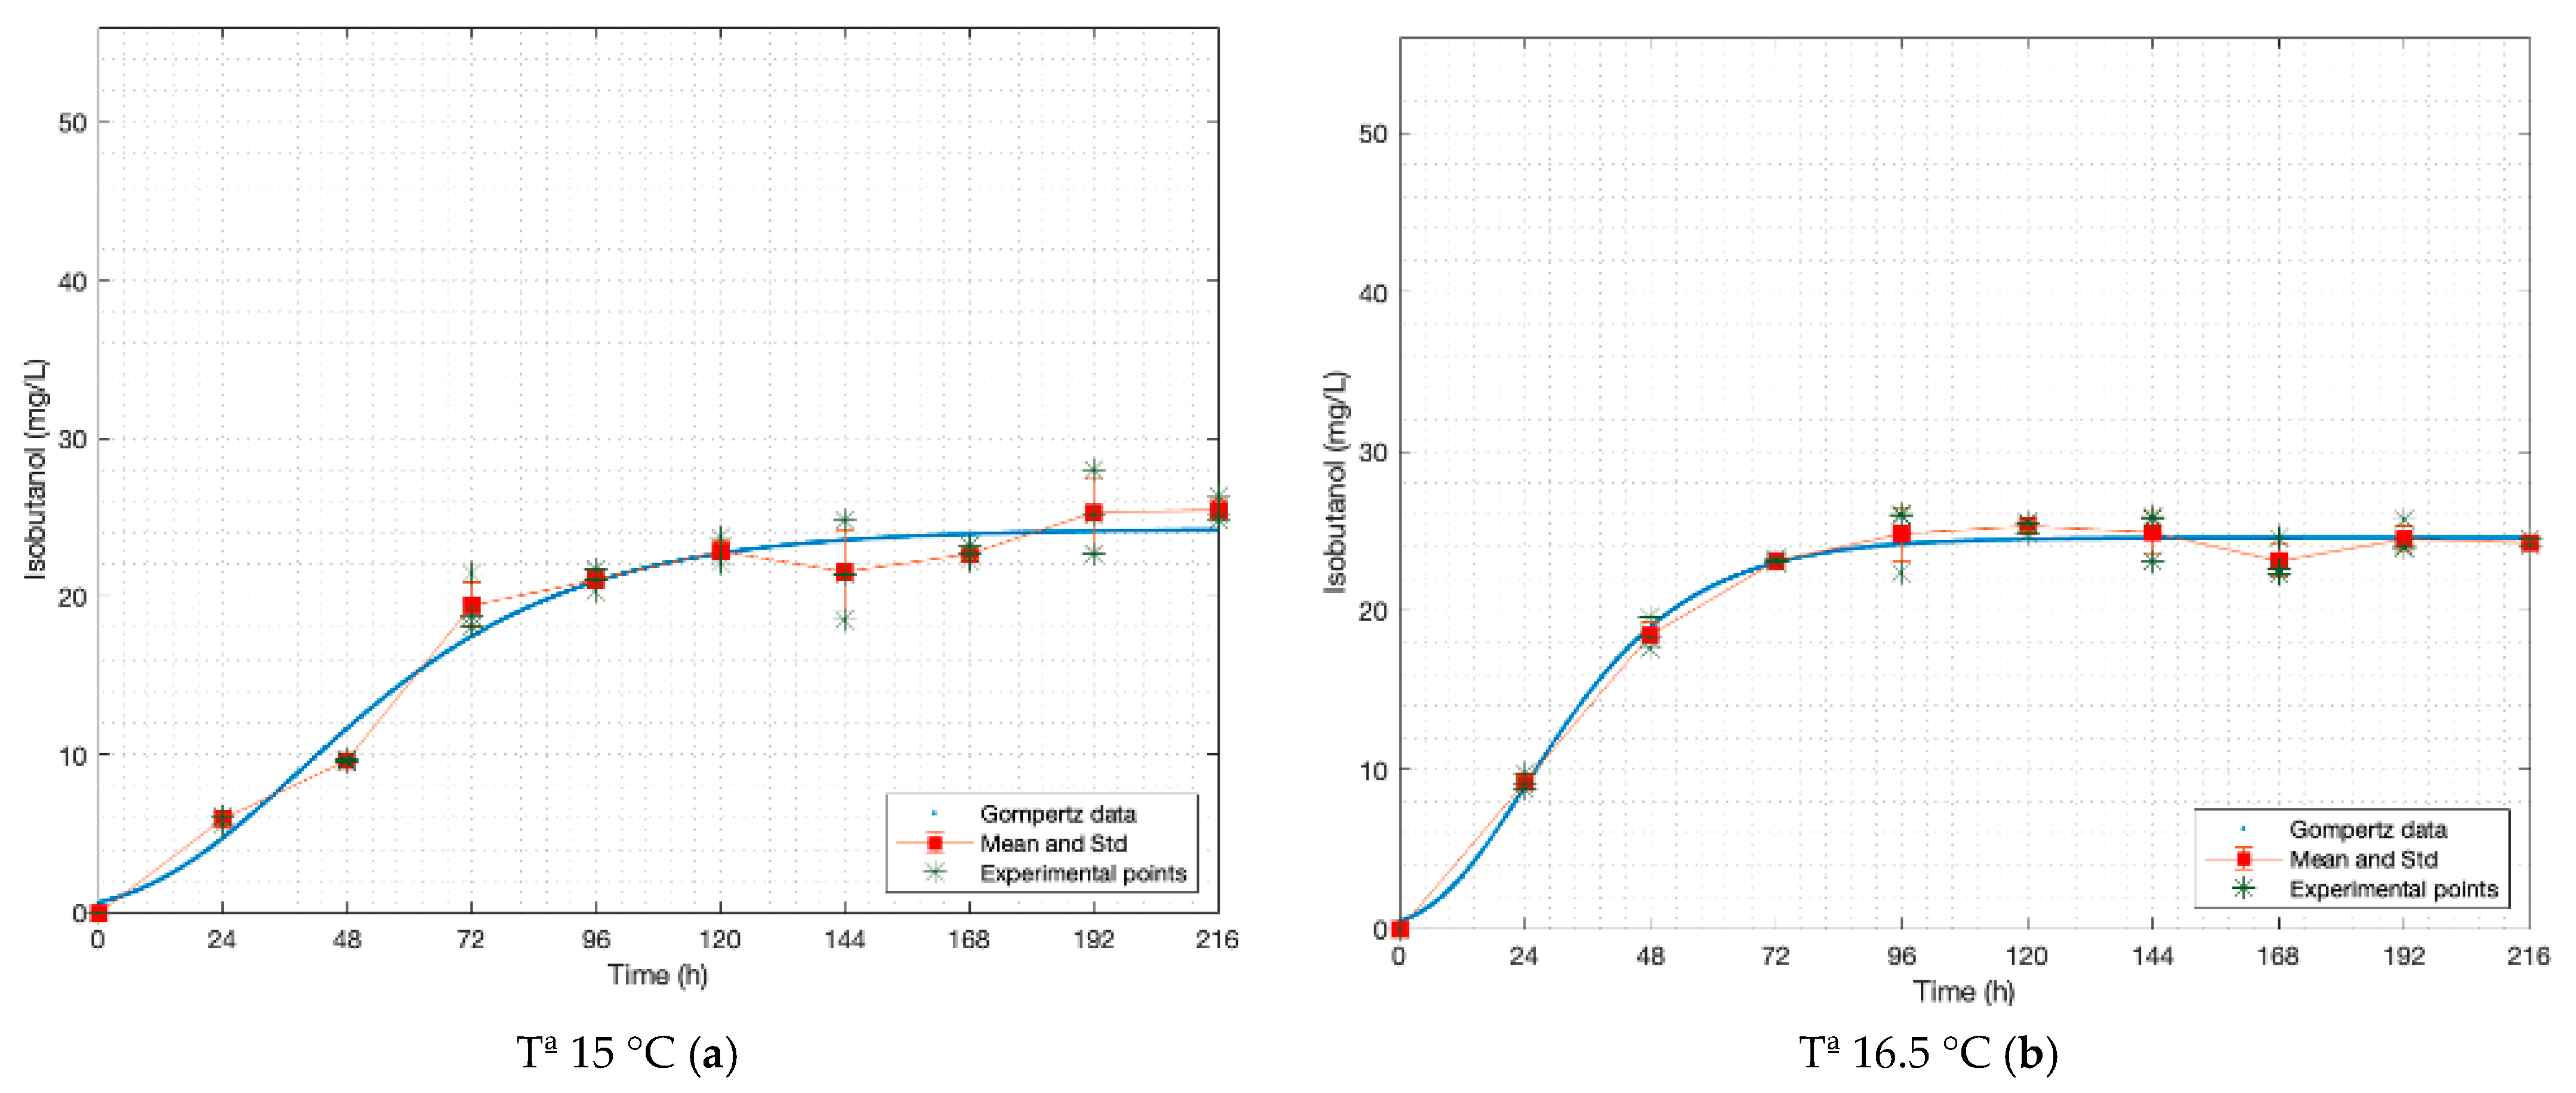
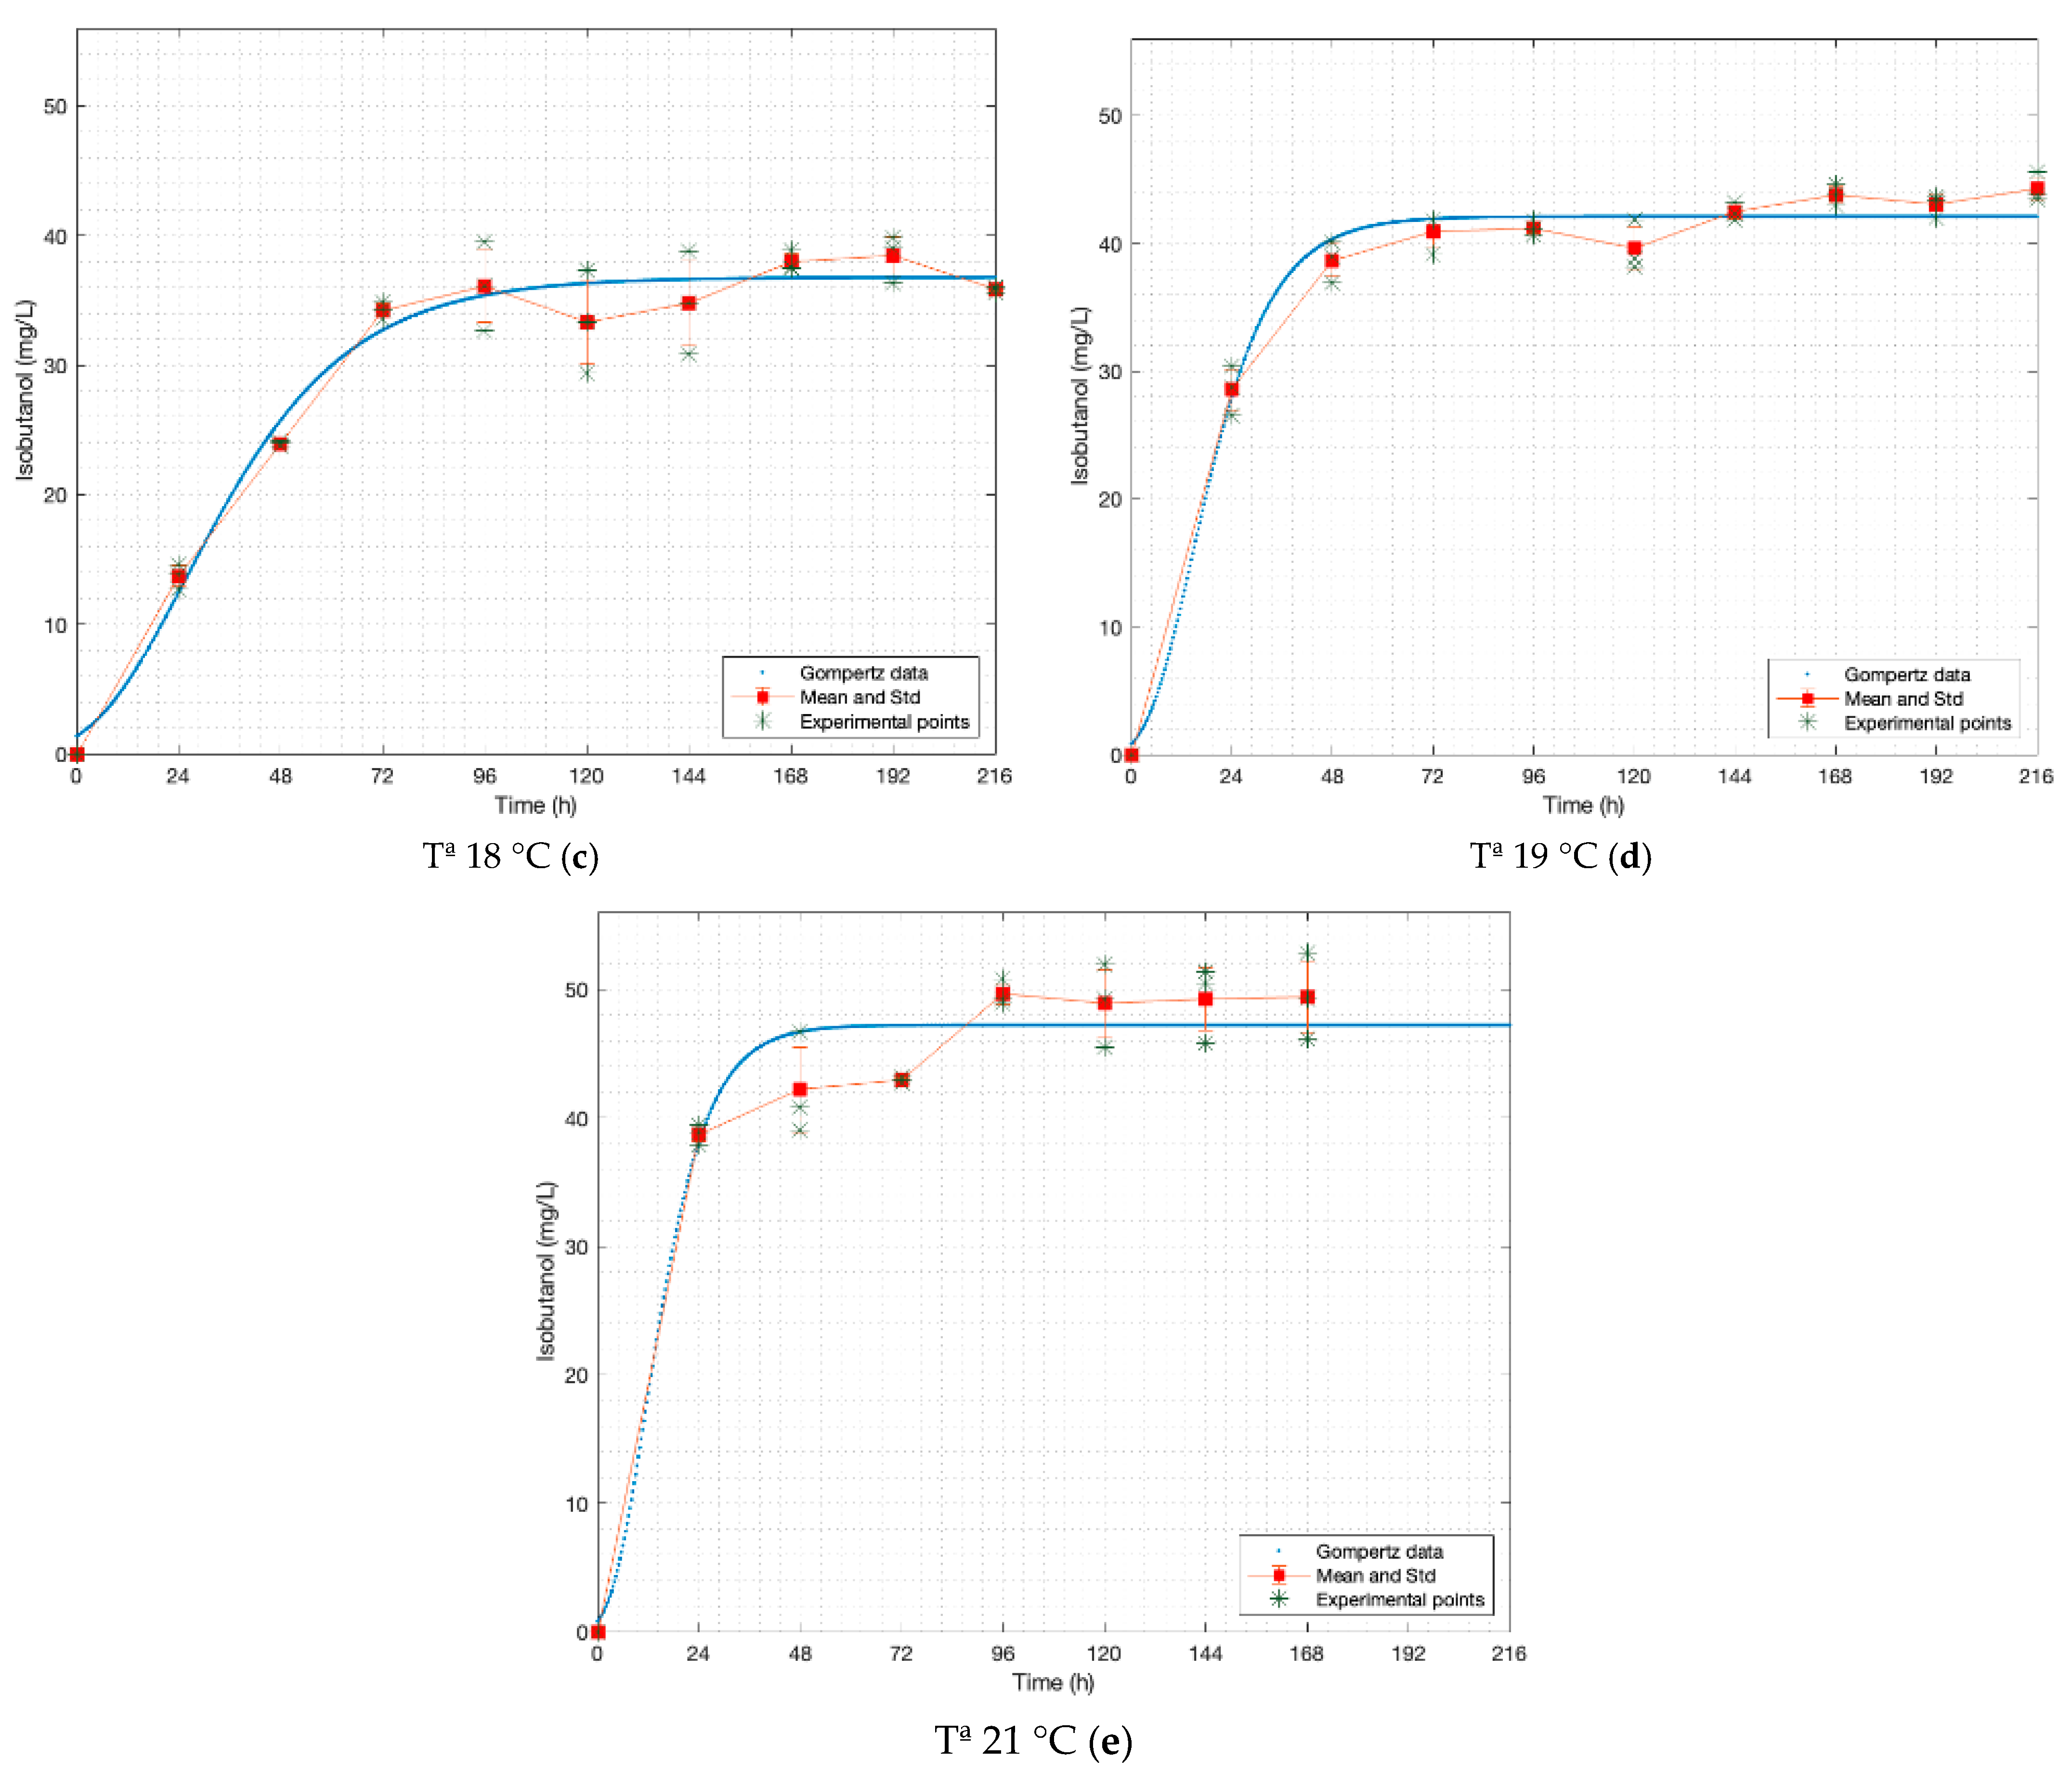
| 1 | isobutanol | 15.0 | 24.27 (23.00, 25.54) | 1.296 (0.900, 1.692) | 0.803 (0.592, 1.014) | 0.30 | 8.85 |
| 2 | 16.5 | 24.58 (23.97, 25.19) | 1.376 (1.024, 1.729) | 1.364 (1.085, 1.642) | 0.51 | 6.62 | |
| 3 | 18.0 | 36.78 (35.44, 38.13) | 1.193 (0.812, 1.574) | 1.112 (0.836, 1.389) | 0.63 | 4.17 | |
| 4 | 19.0 | 42.10 (41.23, 42.96) | 1.365 (0.728, 2.001) | 2.259 (1.605, 2.912) | 1.46 | 3.87 | |
| 5 | 21.0 | 47.24 (45.45, 49.03) | 1.405 (0.107, 2.704) | 2.945 (1.530, 4.360) | 2.13 | 3.30 | |
| Dataset (T °C) | Compound | Gompertz vs. Raw Data | ANN vs. Raw Data | ||||
|---|---|---|---|---|---|---|---|
| F * | p-Value | R2 | F * | p-Value | R2 | ||
| 1 (15 °C) | n-propanol | 1.0812 | 0.8349 | 0.9412 | 1.1323 | 0.7402 | 0.9390 |
| 2 (16.5 °C) | 1.0194 | 0.9592 | 0.9908 | 0.9838 | 0.9653 | 0.9857 | |
| 3 (18 °C) | 1.0124 | 0.9737 | 0.9927 | 0.9136 | 0.8094 | 0.9879 | |
| 4 (19 °C) | 1.0230 | 0.9517 | 0.9899 | 0.9465 | 0.8833 | 0.9896 | |
| 5 (21 °C) | 1.2432 | 0.5734 | 0.9881 | 0.9526 | 0.9083 | 0.9874 | |
| 1 (15 °C) | Ethyl Acetate | 1.0377 | 0.9213 | 0.9716 | 1.0258 | 0.9457 | 0.9659 |
| 2 (16.5 °C) | 1.0489 | 0.8985 | 0.9749 | 0.9935 | 0.9861 | 0.9743 | |
| 3 (18 °C) | 1.0711 | 0.8544 | 0.9637 | 1.0210 | 0.9557 | 0.9626 | |
| 4 (19 °C) | 1.0504 | 0.8957 | 0.9811 | 1.0444 | 0.9077 | 0.9831 | |
| 5 (21 °C) | 1.2610 | 0.5493 | 0.9694 | 1.0505 | 0.9071 | 0.9705 | |
| 1 (15 °C) | Amyl Alcohol | 0.9869 | 0.9719 | 0.9764 | 1.0074 | 0.9844 | 0.9772 |
| 2 (16.5 °C) | 1.0350 | 0.9268 | 0.9856 | 1.0256 | 0.9463 | 0.9856 | |
| 3 (18 °C) | 1.0263 | 0.9447 | 0.9930 | 1.0010 | 0.9978 | 0.9925 | |
| 4 (19 °C) | 1.0189 | 0.9601 | 0.9968 | 1.0278 | 0.9418 | 0.9962 | |
| 5 (21 °C) | 1.2502 | 0.5638 | 0.9853 | 1.0234 | 0.9562 | 0.9852 | |
| 1 (15 °C) | Isobutanol | 1.0619 | 0.8725 | 0.9545 | 0.9266 | 0.8386 | 0.9523 |
| 2 (16.5 °C) | 1.0384 | 0.9199 | 0.9798 | 1.0080 | 0.9831 | 0.9693 | |
| 3 (18 °C) | 1.0629 | 0.8706 | 0.9609 | 1.0508 | 0.8948 | 0.9416 | |
| 4 (19 °C) | 1.0534 | 0.8896 | 0.9790 | 0.8593 | 0.6859 | 0.9705 | |
| 5 (21 °C) | 1.3141 | 0.4822 | 0.9551 | 0.9532 | 0.9096 | 0.9537 | |
| Compound | R | R2 | MSE | |
|---|---|---|---|---|
| n-propanol | Training | 0.999 | 0.999 | 0.052 |
| Testing | 0.999 | 0.999 | 0.110 | |
| Overall | 0.999 | 0.999 | 0.060 | |
| Ethyl acetate | Training | 0.999 | 0.999 | 0.024 |
| Testing | 0.999 | 0.999 | 0.025 | |
| Overall | 0.999 | 0.999 | 0.016 | |
| Amyl alcohol | Training | 0.999 | 0.999 | 0.049 |
| Testing | 0.999 | 0.999 | 0.350 | |
| Overall | 0.999 | 0.999 | 0.090 | |
| Isobutanol | Training | 0.996 | 0.992 | 0.250 |
| Testing | 0.995 | 0.990 | 0.730 | |
| Overall | 0.996 | 0.992 | 0.320 |
Publisher’s Note: MDPI stays neutral with regard to jurisdictional claims in published maps and institutional affiliations. |
© 2021 by the authors. Licensee MDPI, Basel, Switzerland. This article is an open access article distributed under the terms and conditions of the Creative Commons Attribution (CC BY) license (https://creativecommons.org/licenses/by/4.0/).
Share and Cite
Moya Almeida, V.; Diezma Iglesias, B.; Correa Hernando, E.C. Artificial Neural Networks and Gompertz Functions for Modelling and Prediction of Solvents Produced by the S. cerevisiae Safale S04 Yeast. Fermentation 2021, 7, 217. https://doi.org/10.3390/fermentation7040217
Moya Almeida V, Diezma Iglesias B, Correa Hernando EC. Artificial Neural Networks and Gompertz Functions for Modelling and Prediction of Solvents Produced by the S. cerevisiae Safale S04 Yeast. Fermentation. 2021; 7(4):217. https://doi.org/10.3390/fermentation7040217
Chicago/Turabian StyleMoya Almeida, Vinicio, Belén Diezma Iglesias, and Eva Cristina Correa Hernando. 2021. "Artificial Neural Networks and Gompertz Functions for Modelling and Prediction of Solvents Produced by the S. cerevisiae Safale S04 Yeast" Fermentation 7, no. 4: 217. https://doi.org/10.3390/fermentation7040217
APA StyleMoya Almeida, V., Diezma Iglesias, B., & Correa Hernando, E. C. (2021). Artificial Neural Networks and Gompertz Functions for Modelling and Prediction of Solvents Produced by the S. cerevisiae Safale S04 Yeast. Fermentation, 7(4), 217. https://doi.org/10.3390/fermentation7040217