1. Introduction
Microbial biomass is a catalytic chassis for numerous biotechnological processes. Yeasts are one of the traditional organisms used in biotechnology. Among them,
Saccharomyces cerevisiae is a well-known workhorse, which was used in food and beverage production for thousands of years. During the past 100 years, the mentioned budding yeast has been widely applied in bioethanol, recombinant protein, glycerol, and cell biomass production [
1]. However, in order to widen microbial conversion of industrially relevant, complex substrates, accelerate biomass production, and perform fermentation in elevated temperatures, use of other yeast species might be more feasible than
S. cerevisiae [
2].
Besides
S. cerevisiae, other yeast species are emerging as potential candidates for biotechnological manufacturing. Among them, Kluyveromyces marxianus is of particular interest, due to its rapid growth, wide applicable substrate range, temperature, and acetic acid tolerance [
3,
4].
K. marxianus is a prospective organism for a secondary metabolite, e.g., fragrances (2-phenylethanol, isoamyl alcohol, 2-phenylethyl acetate, isoamyl acetate) and precursor (ethyl acetate) production for the chemical industry, with potential to replace petrochemicals [
5,
6].
In order to increase the efficiency of a particular biotechnological process, higher amounts of microbial biomass should be obtained. Several cultivation process modes exist. Among them, the most widely applied are batch, fed-batch, and continuous. The batch mode is likely the easiest from the process control perspective. However, such regimes may well lead to accumulation of by-products in the medium, which, in turn, can significantly affect the biomass yield. The continuous mode can provide constant growing biomass efflux from the bioreactor. However, on-site separation of the biomass should be ensured in order to provide appropriate target product quality. Fed-batch cultivations combine the best features both from batch and continuous modes. If correctly implemented, accumulation of by-products can be minimized, substrate concentration control in the growth medium can be ensured, the conversion efficiency of all media components can be improved, and the growth and accumulation of microbial biomass can be carried out in a single vessel [
7].
2-phenylethanol (2-PE) is one of the high-value added products, which can be produced by the
K. marxianus yeast. Conventional methods of 2-PE production (chemical synthesis and extraction from plants) seem to pose significant problems in providing proper product quality or are simply too expensive. Currently, 2-PE is produced either by chemical synthesis or by extraction from rose flowers. Chemical synthesis is cheap, but it possesses a threat to human health and the environment. Carbon from the petrochemical industry is used in 2-PE synthesis and by products of the synthesis are carcinogenic. On the other hand, when using rose flowers for 2-PE extraction, the price for the product is too high. Microbial production of 2-phenylethanol is environmentally friendly. Bio-renewable substrates are used in the production process and no carcinogenic by-products accumulate. The overall cost of the production process is significantly lowered with respect to plant extract-based 2-PE. The application of yeast for the biosynthesis of 2-phenylethanol is more environmentally friendly, in comparison to traditional chemical methods. During biosynthesis, no carcinogens or harmful metabolites are produced, while the overall cost of the production process is significantly lowered with respect to natural (plant-based) 2-phenylethanol. The main problem of biosynthesis is related to the fact that the maximum concentration of 2-PE in the fermentation broth at which no biomass growth inhibition takes place is very low (1-4 g·L
−1, depending on the applied yeast strain). Therefore, the yield of the fermentation process, which is carried out in a batch or semi-batch mode, is limited by the maximum bioreactors volume and the tolerance of microorganisms to 2-PE. In order to increase the productivity and yield of the biosynthesis, fermentation techniques such as perfusion, pertraction, extractive fermentation, or conventional continuous fermentation should be applied [
8]. 2-PE can be formed in biological processes in two ways: by utilizing phenylalanine as a precursor in the Ehrlich pathway or by converting various carbohydrates to phenylalanine via the Shikimate metabolic pathway and then converting it to 2-PE. In the first case, higher productivity can be obtained but, in the second case, cheaper substrates can be used, such as whey, molasses, and other. In the case of the Ehrlich pathway, the production rate of 2-phenylethanol is limited by the maximum biomass concentration (the higher the biomass concentration, the more 2-PE could be synthesized per unit time) and the maximum 2-PE concentration that the microorganism can tolerate. In the case of the Shikimate metabolic pathway, the productivity of 2-PE is highly dependent on the physical conditions maintained during the process and the carbon/nitrogen ratio in the fermentation medium [
9]. The highest reported 2-PE productivity (0.478 g·L
−1·h
−1) was achieved in a hybrid system (membrane extraction bioreactor). The maximal obtained concentrations of 2-PE and
K. marxianus biomass in the mentioned report were 2.0 g·L
−1 and 20 g·L
−1, respectively [
10].
In order to increase the biosynthesis rate of a chemical precursor or fragrance molecule (like 2-phenylethanol) in K. marxianus, a high initial concentration (before stimulation of target compound biosynthesis) of biomass in the culture medium is required. Fed-batch is a common method describing how to achieve high cell densities. By performing a fed-batch cultivation of K. marxianus in a complex (‘rich’) medium, it was possible to achieve a final biomass concentration of up to 105 g·L
−1 [
11]. On the other hand, when optimizing a synthetic medium for
S. cerevisiae biomass production, its productivity was revealed to be the same or even higher than in the ‘rich’ medium [
12]. The latter potentially indicates that, in the case of
K. marxianus, similarly to
S. cerevisiae, an increase in process performance can be achieved when switching from ‘rich’ to synthetic mediums. Additionally, in order to prevent the biosynthesis of by-products (ethanol, acetate, glycerol, etc.) during fed-batch cultivations, the yeast growth and feeding rates should be maintained at certain values. Such degrees of control can be achieved by advanced fed-batch control approaches, such as Model-Predictive control (MPC) and/or others [
13]. Feeding solution and growth medium composition optimization for fed-batch cultivations is critical for achieving maximum biomass yields. An inadequate supply of nutrients to the growth medium—accumulation (if supplied in excess) or limitation (if supplied in insufficient quantities) leads to suboptimal biomass growth. The carbon limit might lead to accumulation of other compounds (due to incomplete assimilation of nitrogen, phosphorous, or sulphate sources). For example, ammonium sulphate is a traditional nitrogen source used for
K. marxianus cultivation. However, when utilizing ammonia specifically, SO
42− ions can be left out and accumulate in the media. In the same time, ammonia metabolism is not a proton neutral process, metabolising one molecule of ammonia releases 1 proton [
14]. Therefore, accumulation of sulphate and a pH drop is expected when using ammonia sulphate as a nitrogen source. Alternatively, urea metabolism is proton neutral and can be considered as an N source of choice for
K. marxianus biomass production [
14,
15].
Even though complex (yeast extract-based) mediums contain all the necessary compounds for microbial growth (therefore, these media are often termed ‘rich’), their use in fed-batch might be unreliable due to suboptimal concentrations of vitamins, N, C, P, and S compounds [
16]. In addition, the presence of a large number of organic nitrogen can induce the biosynthesis of a wide variety of by-products, which, in turn, can inhibit the biomass growth. Furthermore, yeast extract (YE) costs are significantly higher in comparison to the costs of individual vitamins (if introduced into the growth medium in identical quantities as found in YE). Synthetic mediums, on the other hand, offer options to manipulate each component concentration individually, exchange carbon or nitrogen sources, and add specific substrates to induce recombinant protein production, etc. [
15,
17].
Thus, the main goal of the current research was to determine the optimal component (glucose, phosphorus, nitrogen, and potassium) concentration relations for the
Kluyveromyces marxianus DSM5422 synthetic growth medium and to practically maintain the mentioned components in appropriate amounts during fed-batch cultivations to obtain high cell densities and high productivity of 2-phenylethanol. The medium composition optimization was performed starting from a Yeast Nitrogen Base (YNB)-based medium [
18]. We estimated the specific consumption rates for glucose, urea, and phosphate by the micro-cultivation method and then fine-tuned the growth medium and feeding solution compositions during laboratory scale (5 L) bioreactor fed-batch cultivations. For the feeding rate control, an MPC algorithm with a kinetic process model (based on Monod equations) was used. The values of model parameters were estimated/fine-tuned during the course of the work.
2. Materials and Methods
2.1. Yeast Strain and Media
The Kluyveromyces marxianus DSM 5422 strain was obtained from the Leibniz-Institute DSMZ-German Collection of Microorganisms and Cell Cultures. In prior cultivation experiments, the yeast was maintained on YPD (yeast extract, peptone, dextrose) agar plates. The YPD medium contained (per liter) yeast extract (Biolife, Italy) 10 g, bactopeptone (Biolife, Italy) 20 g, glucose (Sigma, Germany) 20 g, and agar (Biolife, Italy) 20 g.
A synthetic growth medium was used during micro-cultivations and experiments in the laboratory bioreactor. The medium composition as proposed by Saldanha [
18] was as follows (per liter): biotin—0.002 mg, calcium panthotenate—0.4 mg, folic acid—0.002 mg, inositol—2 mg, niacin—0.4 mg, p-aminobenzoic acid—0.2 mg, pyridoxine hydrochloride—0.4 mg, riboflavin—0.2 mg, thiamine-HCl—0.4 mg, H
3BO
3—0.5 mg, CuSO
4∙5H
2O—0.04 mg, KI—0.1 mg, FeCl
3∙6H
2O—0.2 mg, MnSO
4∙H
2O—0.4 mg, Na
2MoO
4∙2H
2O—0.2 mg, ZnSO
4∙7H
2O—0.4 mg, CaCl
2—0.1 g, NaCl—0.1 g, and MgSO
4∙7H
2O—0.5 g [
18]. Nitrogen (urea), phosphorus (K
2HPO
4), and carbon (glucose) concentrations were varied during the course of the research.
2.2. Micro-Cultivation Experiments
In order to estimate the specific consumption rates of the main medium components (carbon, nitrogen, and phosphorous), a series of micro-cultivation experiments were performed. To decrease pipetting errors, an automatic pipetting robot Opentron OT-2 Opentrons Labworks Inc. (New York, NY, USA) was used. A microplate reader Tecan Infinite M200 PRO Tecan Group Ltd. (Männedorf, Austria), set to an absorbance regime at 590 nm, was used to determine the biomass concentrations during micro-cultivation experiments. Incubation temperature of 30 °C was maintained constant during all experiments of the current research. The measuring cycle consisted of 490 s of plate shaking with a 3.5 mm orbital amplitude, 3 s pause, OD
590 measurement, 60 s pause, and repeat. The cultivations were run for 20 h. The media composition with respect to glucose, urea, and phosphate concentrations were varied, as seen in
Table 1.
2.3. Laboratory Bioreactor Cultivation Experiments
Laboratory-scale cultivations were performed in a 5.4 L working volume bioreactor EDF-5.4_1 JSC Biotehniskais centrs (Riga, Latvia). During bioreactor cultivations, active control was performed for maintaining the temperature (at 30 °C), pH (at 5.5 ± 0.2), dissolved oxygen (at 45 ± 5%-sat.), and foam level. The pH control was performed by automatic dosing of acidic (20 W% H2SO4) or alkali (10 W% NaOH) solutions to the cultivation medium via two pre-calibrated peristaltic pumps. The dissolved oxygen (DO) control was performed according to a cascade algorithm (primarily increasing the agitation rate from 100 to 800 rpm, and, secondly, by Ehrliching the inlet gas with oxygen). During the cultivations, a constant gas flow rate of 1.6 slpm (standard liters per minute) was maintained.
Online measurements of CO2 and O2 concentrations in the off-gas were performed by a BlueInOneFerm gas analyser (BlueSens gas sensor GmbH, Germany). The ethanol concentration in the cultivation medium was estimated using an ethanol/methanol gas sensor BCP-EtOh (BlueSens gas sensor GmbH, Germany).
Process data acquisition was performed through a SCADA (supervisory control and data acquisition) software which was linked to a BIO4 bioprocess controller JSC Biotehniskais centrs (Riga, Latvia).
The inoculum for the bioreactor experiment was prepared in 100 mL shake flasks, which were incubated at 30 °C overnight in an ES-20 orbital shaker-incubator Biosan Ltd. (Riga, Latvia). The cultivation medium for shake flasks and the laboratory bioreactor was prepared, according to the compositions mentioned earlier (with glucose, urea, and potassium dihydrogenphosphate concentrations as primarily determined from the microplate experiments). After process data analysis, further optimization of component concentrations was performed. After introducing the pre-prepared inoculum into the growth medium, the cultivation was initialized in a batch mode, and proceeded in fed-batch when the substrate concentration fell to a pre-defined level (determined by the MPC algorithm).
Off-line samples for product and metabolite concentration measurements were harvested aseptically every 30–120 min. The biomass concentration was determined by measuring the optical density at 600 nm by a Jenway 6300, spectrophotometer (Staffordshire, UK). Medium samples were centrifuged at 1327×
g for 10 min, filtered, and stored at −21 °C for further analyses. The glucose concentration was measured enzymatically by an AccuChek ACTIVE blood sugar analyser (Roche, Switzerland). The concentrations of 2-phenylethanol were quantified by HPLC (Agilent 1100, HP, USA) with an XBridge BEH C18 column, 130Å, 5 µm, 4.6 mm × 250 mm, Mobile phase ACN:H
2O—78:22, sample volume −10 µL, flow rate—0.6 mL·min
−1, temperature—26 °C [
19]. Nitrogen and phosphorous were determined spectrophotometrically (see method description below). In order to determine the concentration of 2-phenylalanine, a modified Cd-Ninhydrin Method C described by Doiz et al., 1981, was used [
20].
2.4. Determination of Nitrogen
In order to determine the concentrations of nitrogen in media samples, a combination of methods described by Fawcett et al., 1960, and Weatherburn et al., 1967, was used [
21,
22].
All solutions were prepared and stored in a refrigerator at +3 °C. A calibration curve of diluted urea standards (0.0025–0.5 g·L−1) was constructed before each series of measurements.
The urea determination procedure was set up as follows: 20 µL of hydrolysed urea (0.2 mL of urea containing sample was mixed with 0.2 mL (about 200 Sumner units) of urease solution. The urease solution was prepared by dissolving 100 mg of urease (Sigma U1500) in 100 mL 0.05 M Phosphate buffer (6 g·L−1 KH2PO4, 2 g·L−1 Na2HPO4). The hydrolysed urea solutions were incubated for 1 h at +37 °C. Then the solutions were vigorously mixed with 3 mL of reagent A (10 g·L−1 of phenol with 0.5 g·L−1 of sodium nitroprusside). After mixing, 3 mL of reagent B (solution of 5 g·L−1 NaOH and 8.4 mL·L−1 of 15% NaClO) were added, mixed, and incubated for 30 min at 37 °C. The absorbance of the solutions was measured spectrophotometrically at 625 nm.
2.5. Determination of Phosphorus
In order to determine the concentration of phosphate ions in media samples, a method described by Saheki et al., 1985, was used [
23].
A calibration curve (KH2PO4 concentration range of 0.0125–0.5 g·L−1) was constructed before each series of measurements. Then, 0.2 mL of the test sample was mixed with 2 mL of the molybdate reagent (2.94 g·L−1 of ammonium molybdate and 21.9 g·L−1 of zinc acetate adjusted to pH 5.0 with 30% H2SO4), 2 mL of ascorbic acid reagent (10 g·L−1 ascorbic acid, pH 5.0 adjusted with 3 M NaOH), and 8 mL of re-distilled water. The solution was mixed and incubated for 30 min at 30 °C. The solution absorbance was measured spectrophotometrically at 850 nm.
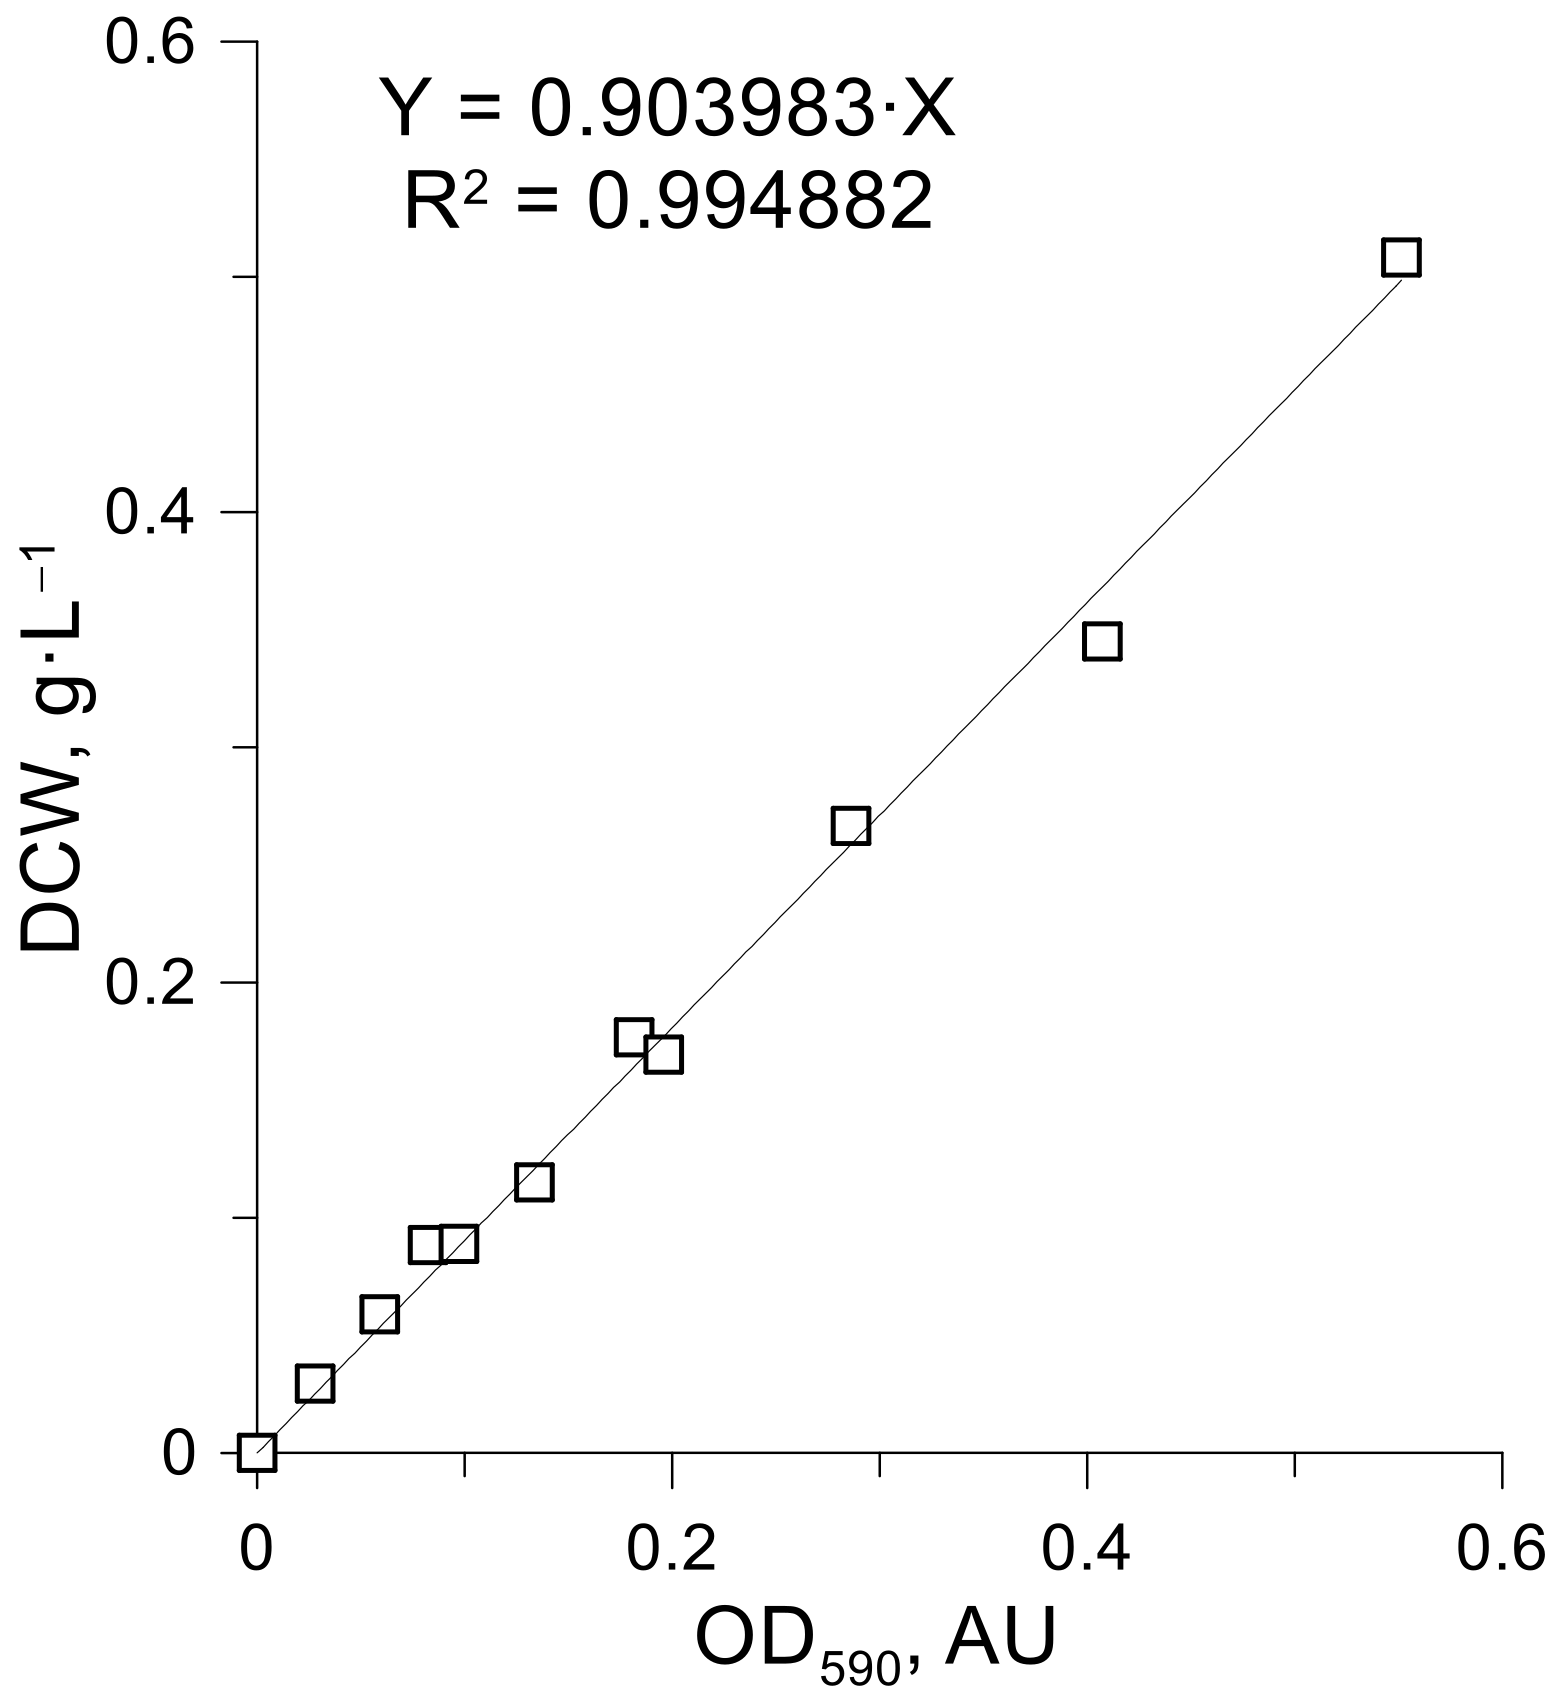
Determination of Biomass Dry Cell Weight
The biomass dry cell weight (DCW) in relation to the absorbance at a wavelength of 600 nm was determined gravimetrically. First, a portion of growth medium containing
K. marxianus cells was withdrawn from the bioreactor during the exponential growth phase. The absorbance of the solution was measured at 600 nm. Next, the solution was separated in two equal parts. One part was transferred to a vessel for drying at 60 °C for at-least 24–48 h (until the mass reading reaches equilibrium). The second part of the solution was centrifuged at 3500 rpm for 10 min. The supernatant was filtered through a glass filter and then transferred to a vessel for drying at 60 °C for at-least 24–48 h (until the mass reading reaches equilibrium). Upon reaching constant mass readings of both supernatant and growth medium samples, both masses were measured and used for correlation coefficient calculations. The correlation coefficient was calculated using the mathematical correlation presented below (Equation (1)).
where
XDCW—biomass concentration in the solution, g(DCW)·L
−1,
OD600—absorbance of the solution measured at 600 nm;
mx—mass of dry residue (left from the solution containing
K. marxianus cells), g;
msn—mass of dry residue (left from the supernatant), g;
Vx—volume of the solution containing
K. marxianus cells, L, and
Vsn—volume of the supernatant, L. During the present study, the correlation coefficients value was determined as 0.234 g(DCW)·L
−1·A.U.
−1.
2.6. Fed-Batch Model Predictive Control
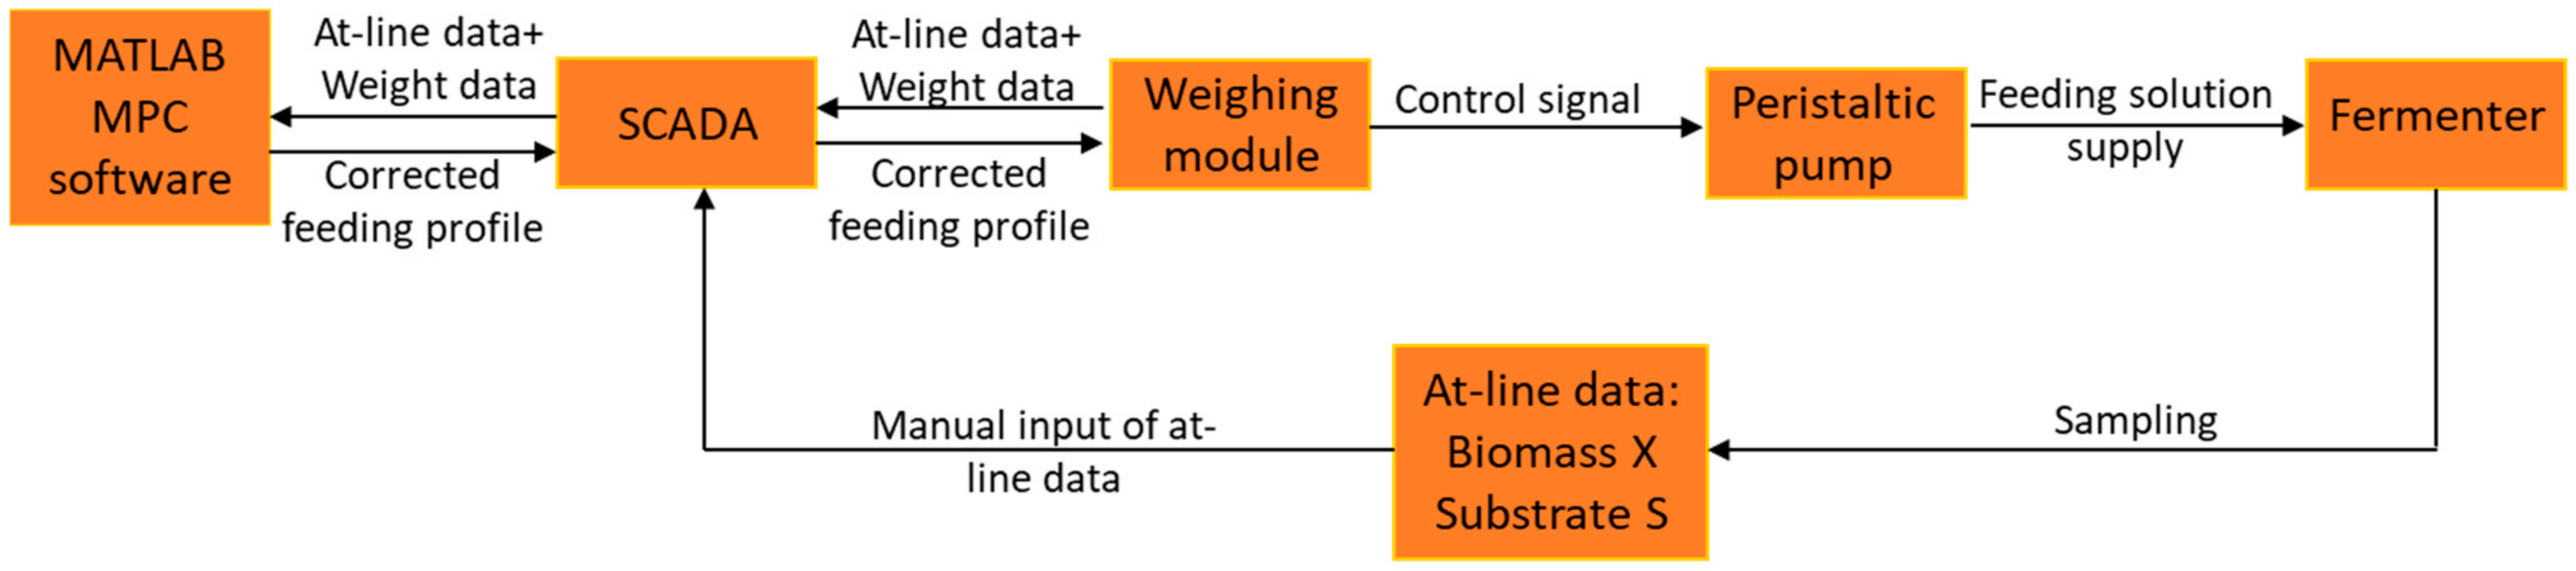
During cultivations, offline glucose and biomass measurements were carried out and the obtained results were uploaded into SCADA, which passed the updated information to the MPC software. A schematic representation of information exchange routes between the control system elements is depicted in
Figure 1.
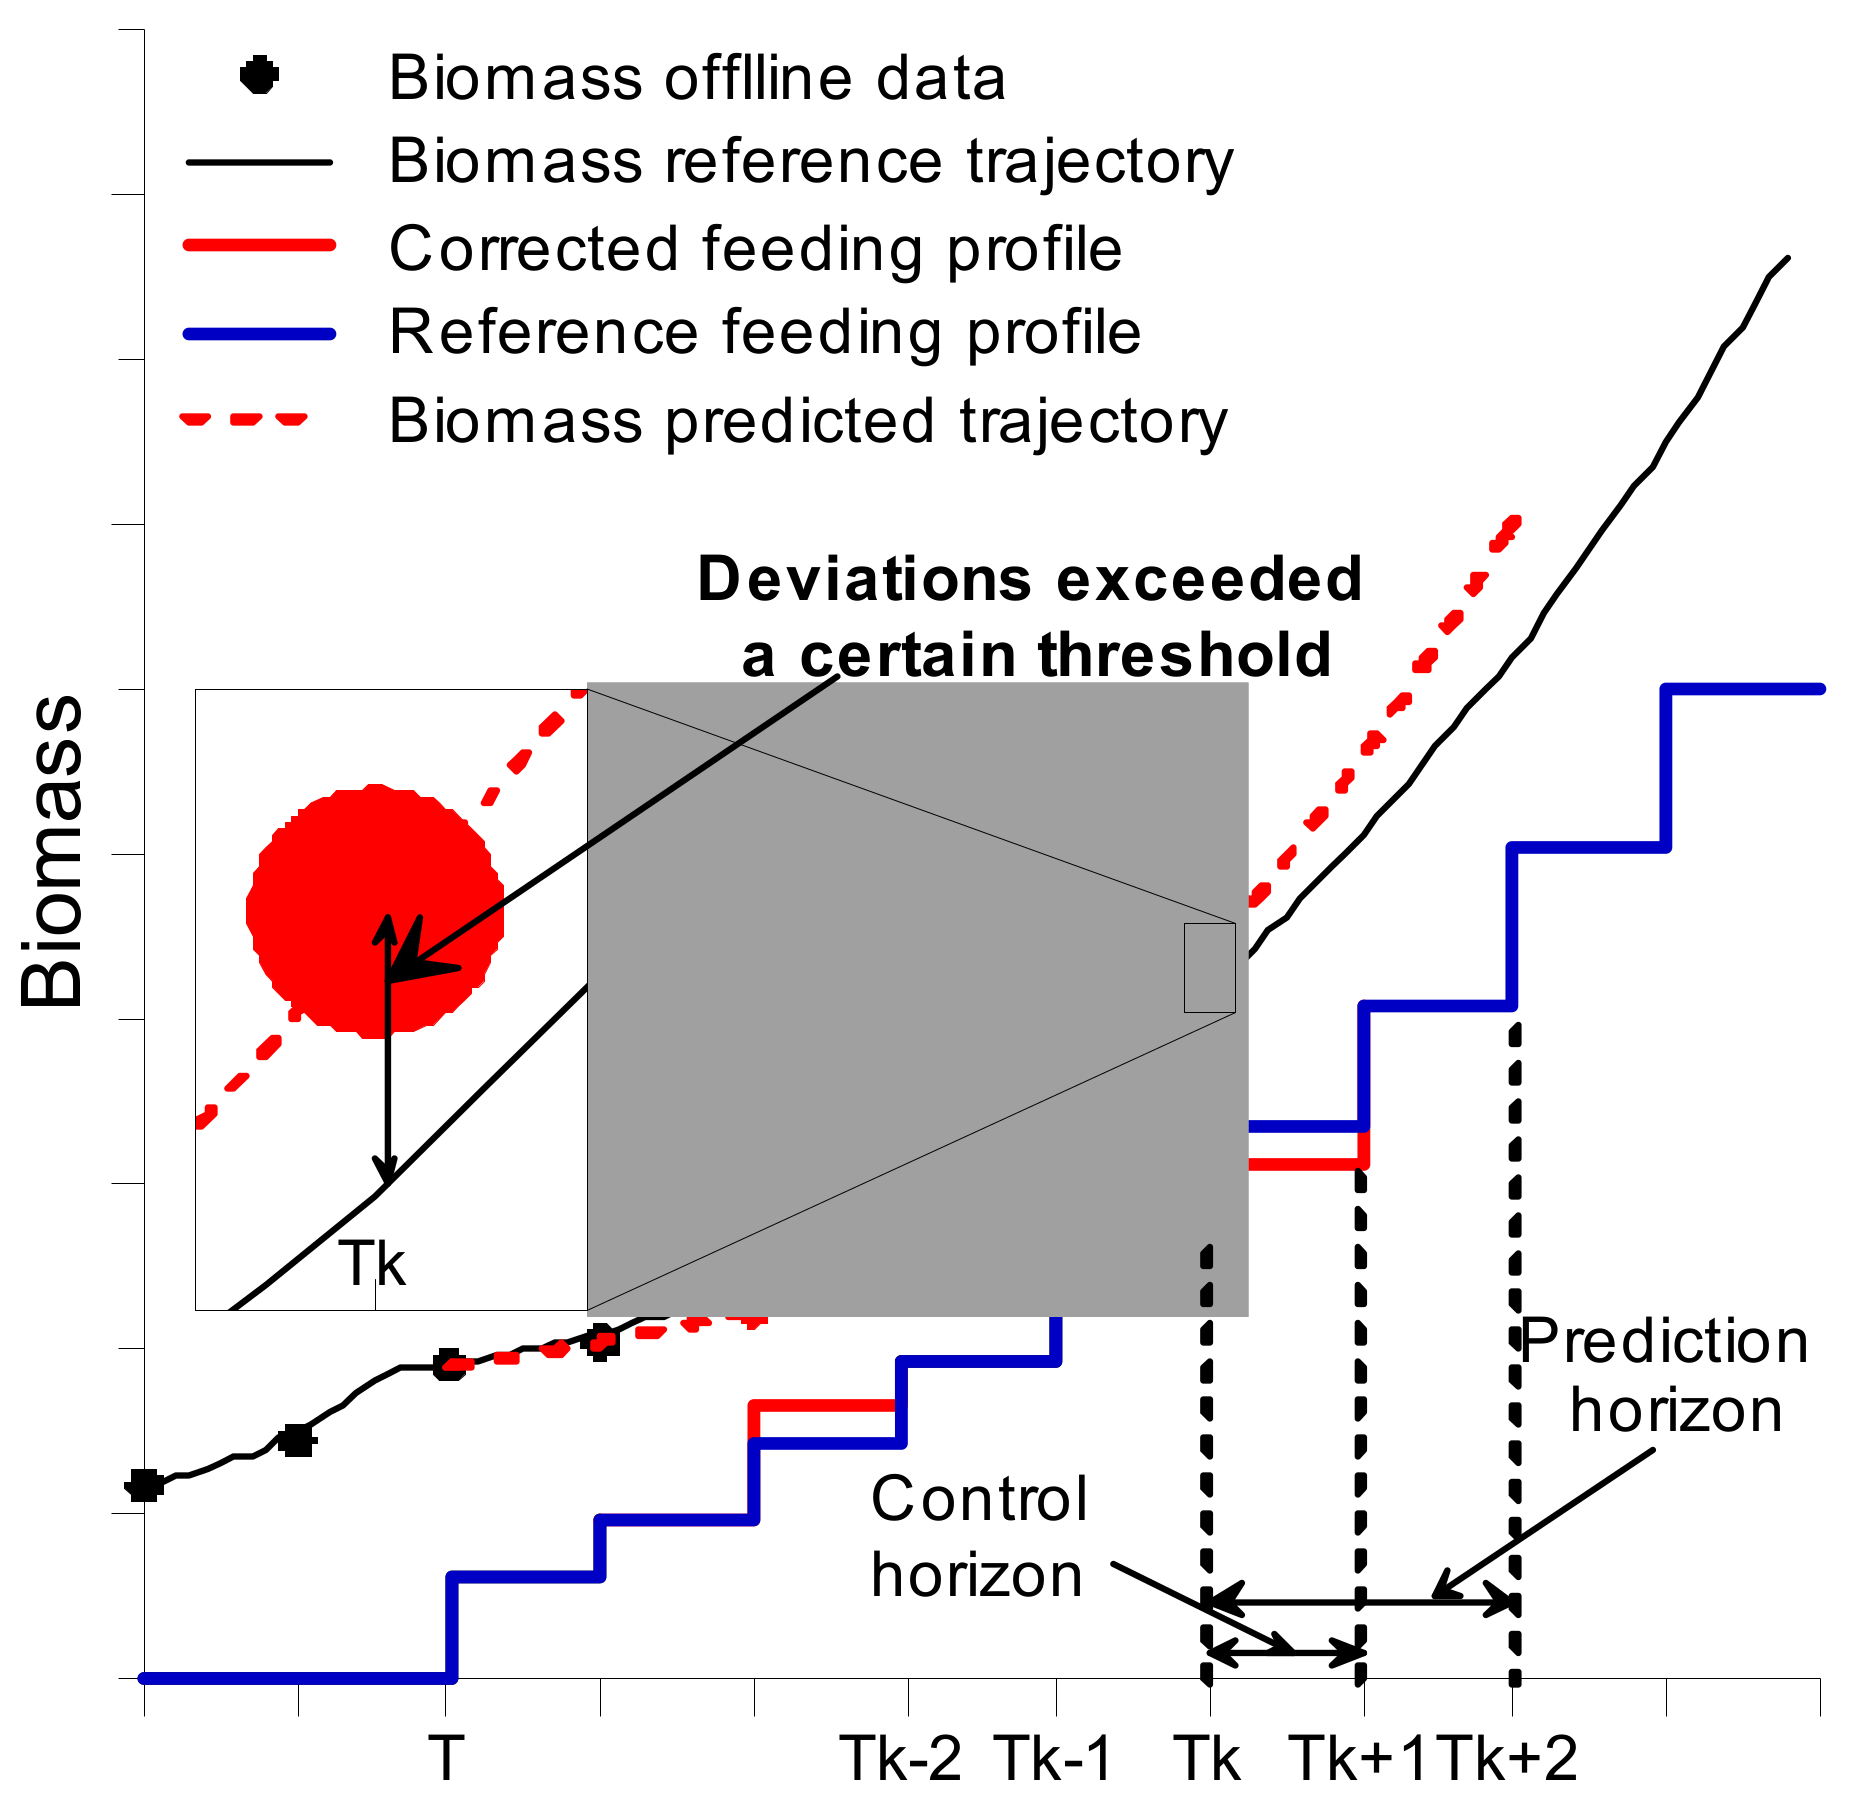
The MPC software based on off-line data (
Xreal,
Sreal), as well as taking into account the deviation of predicted pumped volumes (
Vreal) of titrants known as acid, base, and antifoam, made a prediction regarding the state of the system (
Xpred,
Spred,
Vpred) upon a defined time period (termed the prediction horizon). When a forecast was built, the software compared the mentioned predicted trajectories to the reference trajectory and, if deviations exceeded a certain threshold, the MPC algorithm performed a correction of the feeding rate profile (by adjusting the feeding rate in a defined range) for a given time period (termed the control horizon), e.g., until new sets of off-line data were supplied to the system (the MPC algorithms’ working principle is shown in
Figure 2). The corrected feeding profile was then uploaded to the BIO-4 bioprocess controller, and the analogue peristaltic pump started operating with respect to the newly updated setpoint values.
2.7. Fermentation Process Model
The mathematical model for process simulation and reference trajectory calculation was based on the model of Grigs et al., 2016 [
24]. To simplify the model, an assumption was made that oxygen mass transfer does not limit
K. marxianus growth and no ethanol formation occurs during the fermentation processes. The mentioned assumption has been made considering that dissolved oxygen levels during each fermentation process were maintained at 50 ± 5%-sat. by using a cascade control algorithm. For the current application, the following differential mass balance equations (Equations (2)–(4)) for biomass, substrate, and volume modelling in a fed-batch process were used.
where
X,
S are the concentrations (g·L−
1) of biomass and substrate, respectively.
V is the culture volume, L.
µs is the specific biomass growth rate,·h
−1 (Equation (5)).
where
Yxs—is the biomass yield from substrate, g·g
−1.
σ—is the specific substrate consumption rate, g·g
−1·h
−1 (Equation (6)).
Ks, Ksi, KXmax are the substrate half-saturation, substrate inhibition, and biomass inhibition constants. σmax—is the maximal specific glucose consumption rate, g·g−1·h−1.
F is a rate of change of the culture volume, mL·min
−1 (Equation (7)).
where
Fs—is the substrate addition rate, mL·min
−1,
Fb is the base addition rate (mL·min
−1),
Faf is the antifoam addition rate (mL·min
−1),
Fc is the carbon loss rate (g·min
−1) during the respiration,
Fe are the evaporation rate, and the
Fsmp is the rate (mL·min
−1) of the solution volume change due to sampling, and
t is the time. The equations for
Fs,
Fb,
Faf,
Fc,
Fe, and
Fsmp calculation can be found in
Appendix A.
Process modelling was performed in the MATLAB environment. For the integration of differential equations, the ODE solver ode15s (a variable-order method for solving stiff differential equation systems) was used. The function LSQCURVEFIT was used to determine the values of the mentioned model parameters.
2.8. Reference Trajectory
Reference trajectories
Xref,
Sref,
Vref, and
Fref were calculated using the model described above, so as to keep the specific growth rate (
µs) constant. The substrate feeding rate for building reference trajectories was calculated as (Equation (8)):
4. Discussion
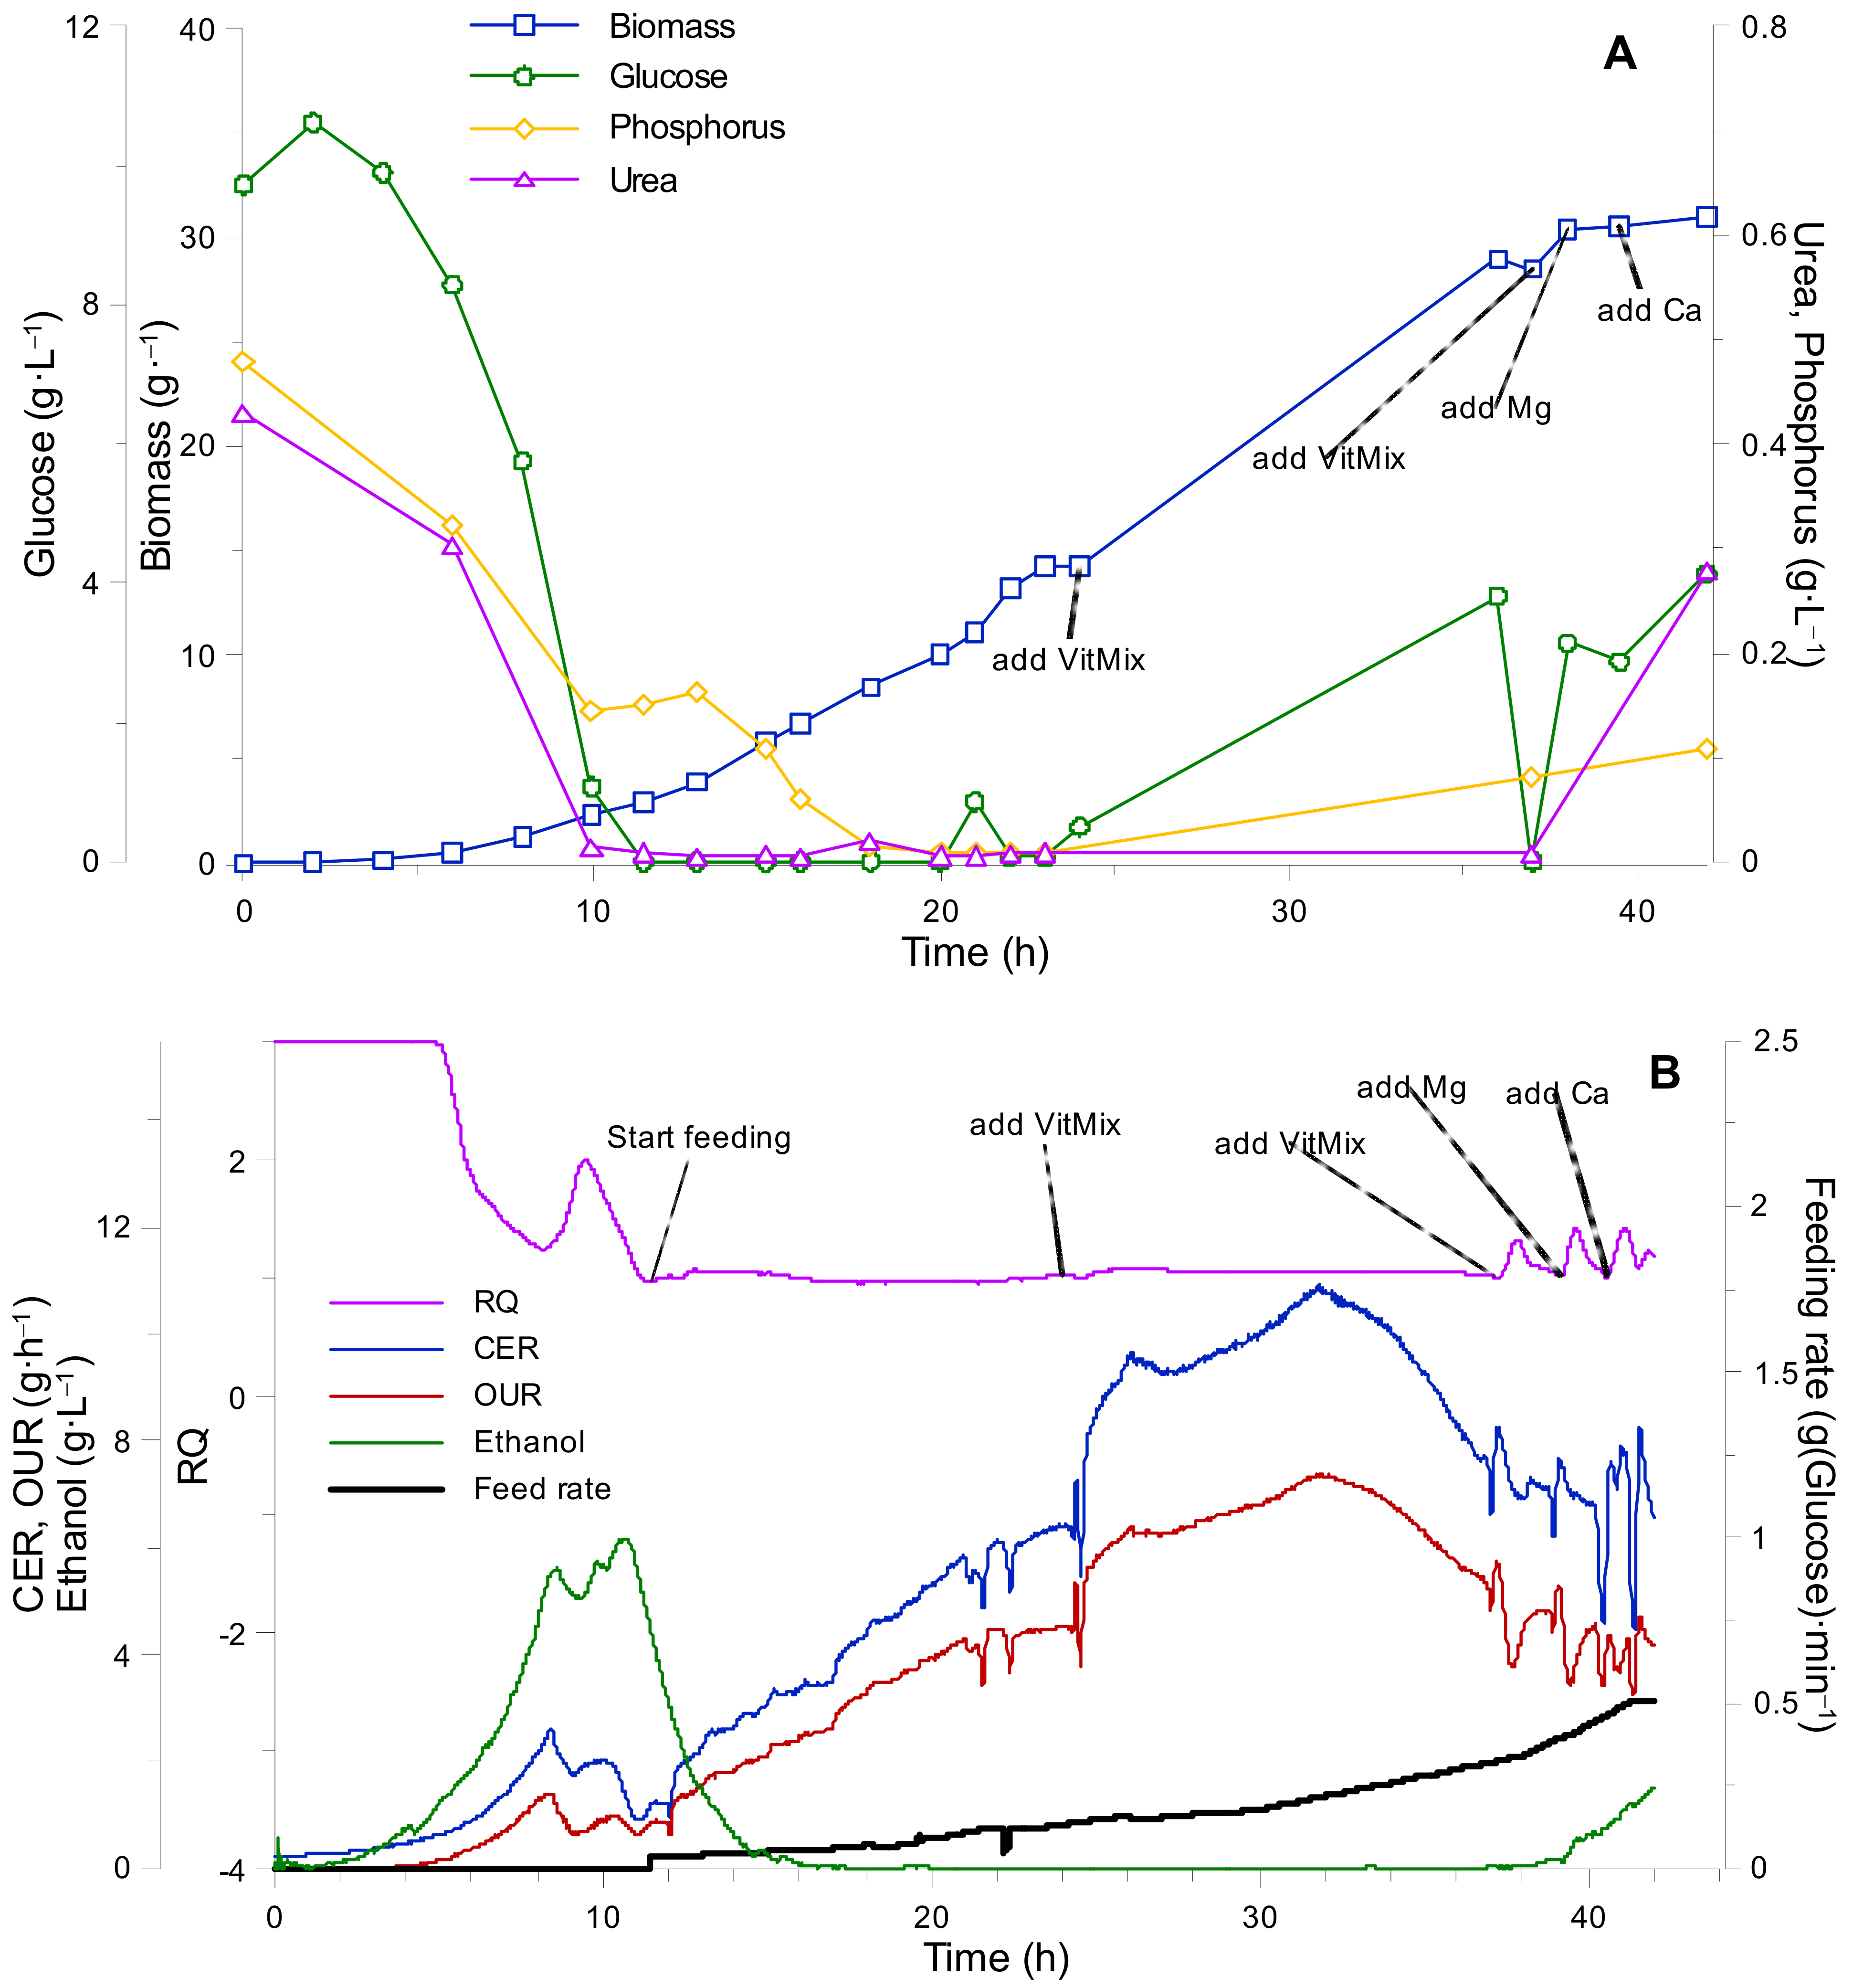
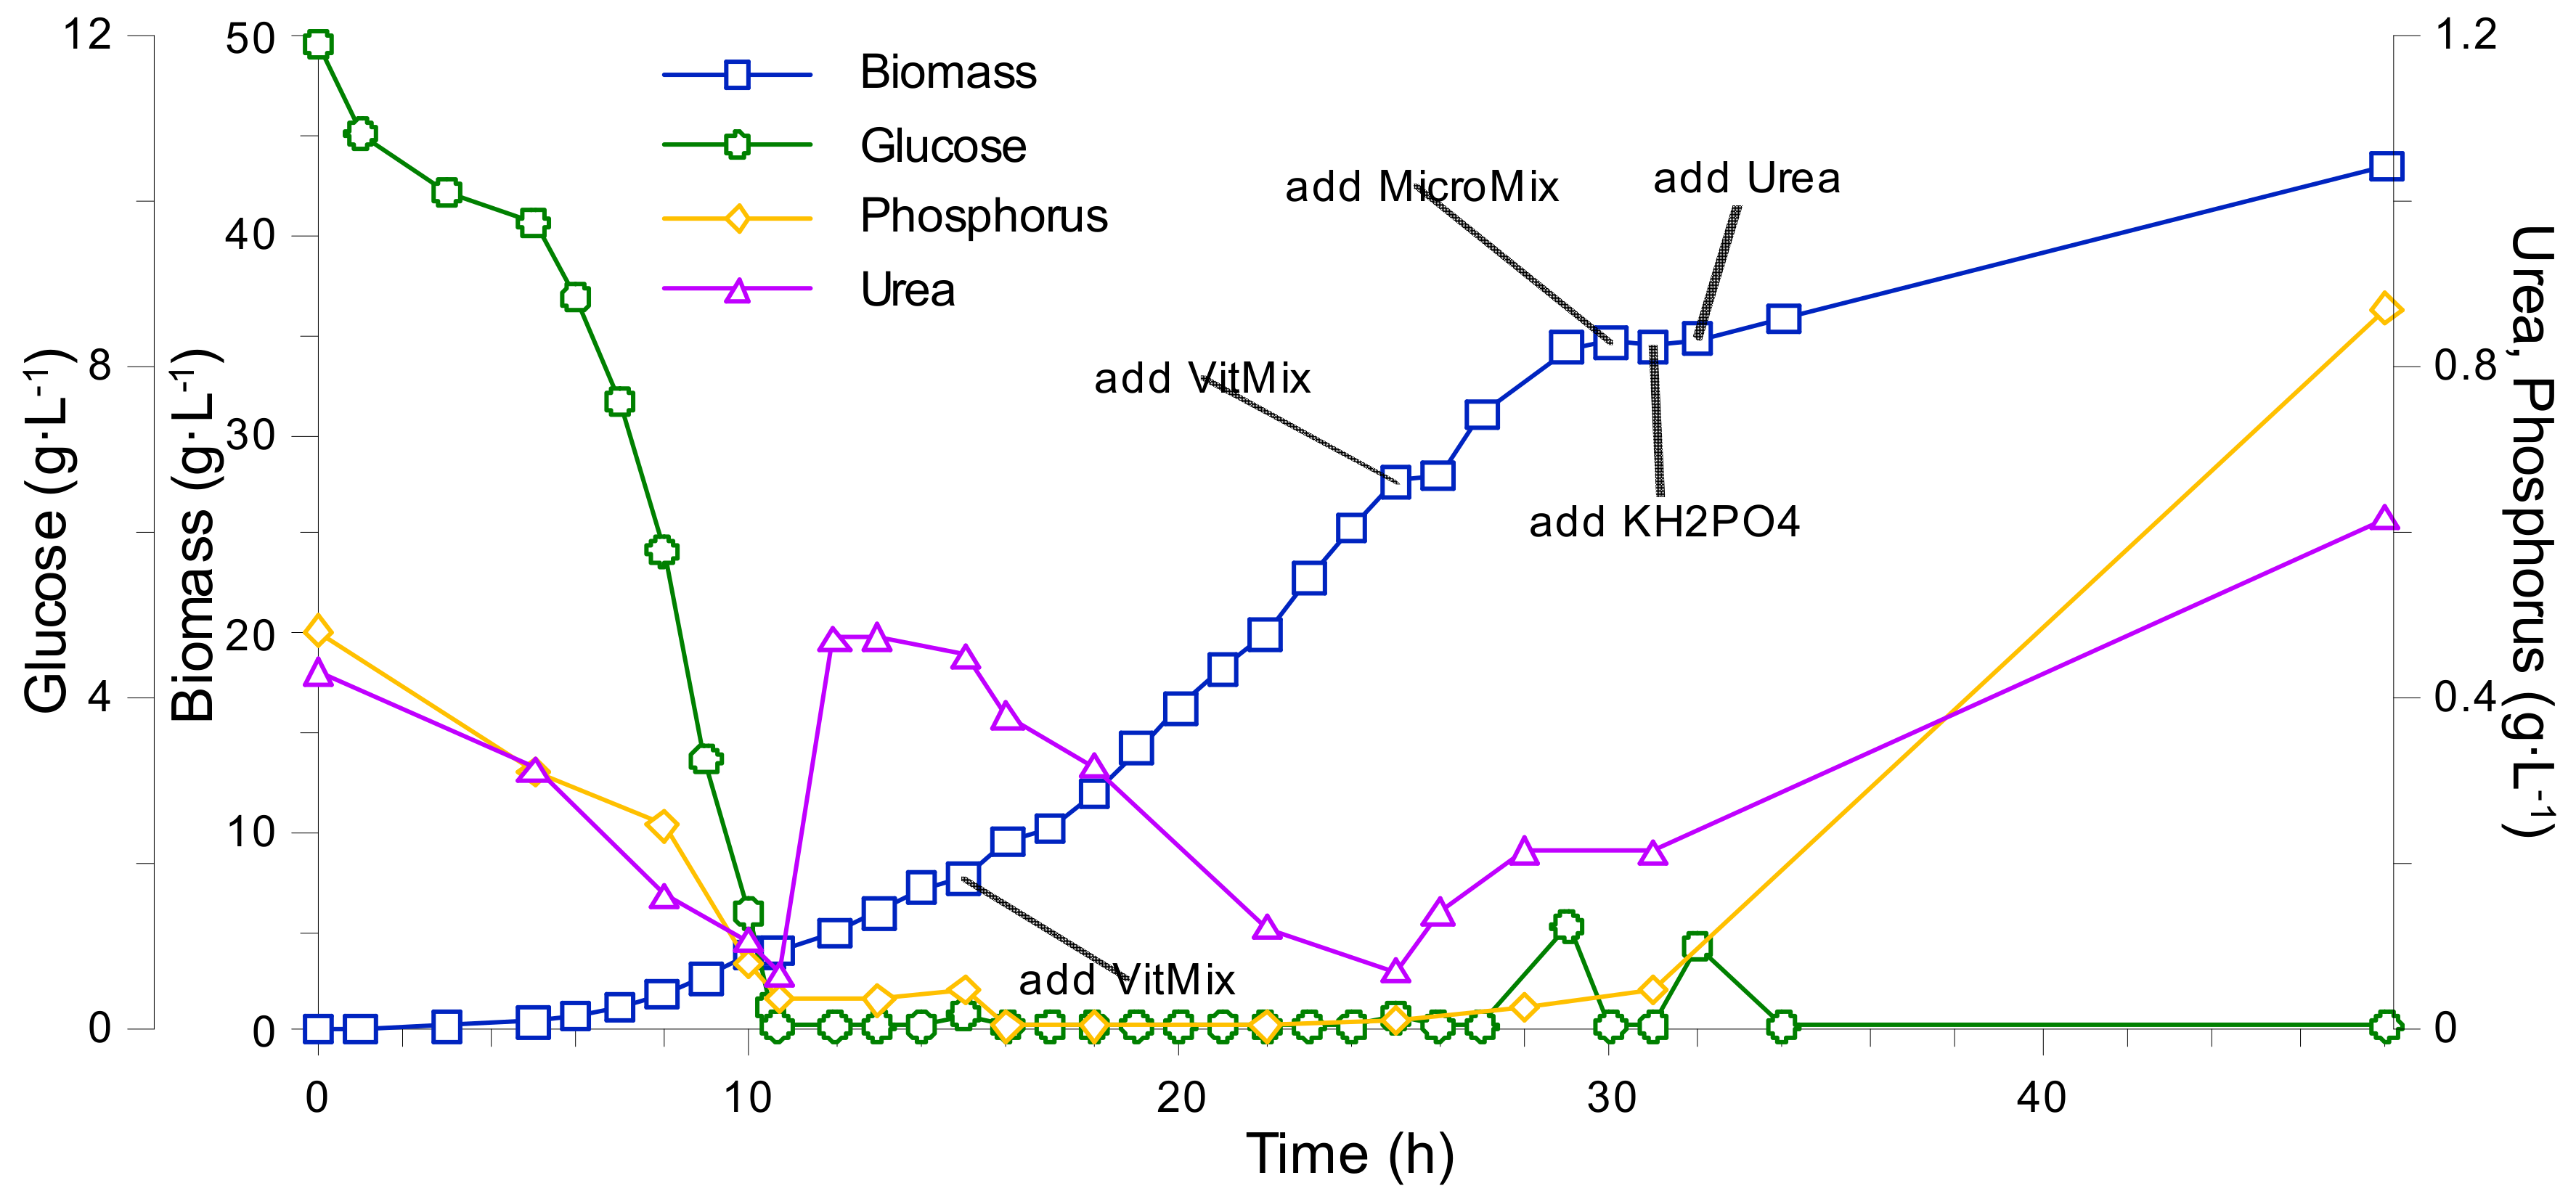
K. marxianus (a Crabtree negative yeast) is a promising biological system for the production of a wide range of chemicals. Therefore, medium composition optimisation is crucial for the development of biotechnological processes using the mentioned organism. High biomass yield and negligible substrate accumulation during fed-batch cultivations are indicators of optimal substrate concentrations and balanced media composition.
First, a set of cultivations using a microplate reader in a synthetic media with a limited supply of individual nutrients were performed. From the results of mentioned experiments, approximate values for specific
K. marxianus biomass yield and growth rate in the given media were derived. From these variables, specific consumption of individual nutrients per unit of biomass (gram dry weight) per unit time (h) was calculated (see Equations (10)–(11) and
Table 2).
However, the applied micro-cultivation approach posed minor limitations, which affected the obtained results. First and likely most important is limited oxygen diffusion within the round walled microplate well [
26]. Glucose consumption and subsequent biomass growth in Crabtree tree negative yeasts, like
K. marxianus, depends on oxygen availability. Typically, when oxygen supply is sufficient,
K. marxianus biomass yields from glucose are around 0.5 g·g
−1 [
27]. However, the value can go down to 0.09 g·g
−1 when the oxygen supply is limited [
28]. Indeed, in our micro-cultivation experiments, we observed yields of an order of 0.120 g·g
−1, while, in the bioreactor experiments with optimal aeration (see
Figure 4), the biomass yield was close to 0.5 g·g
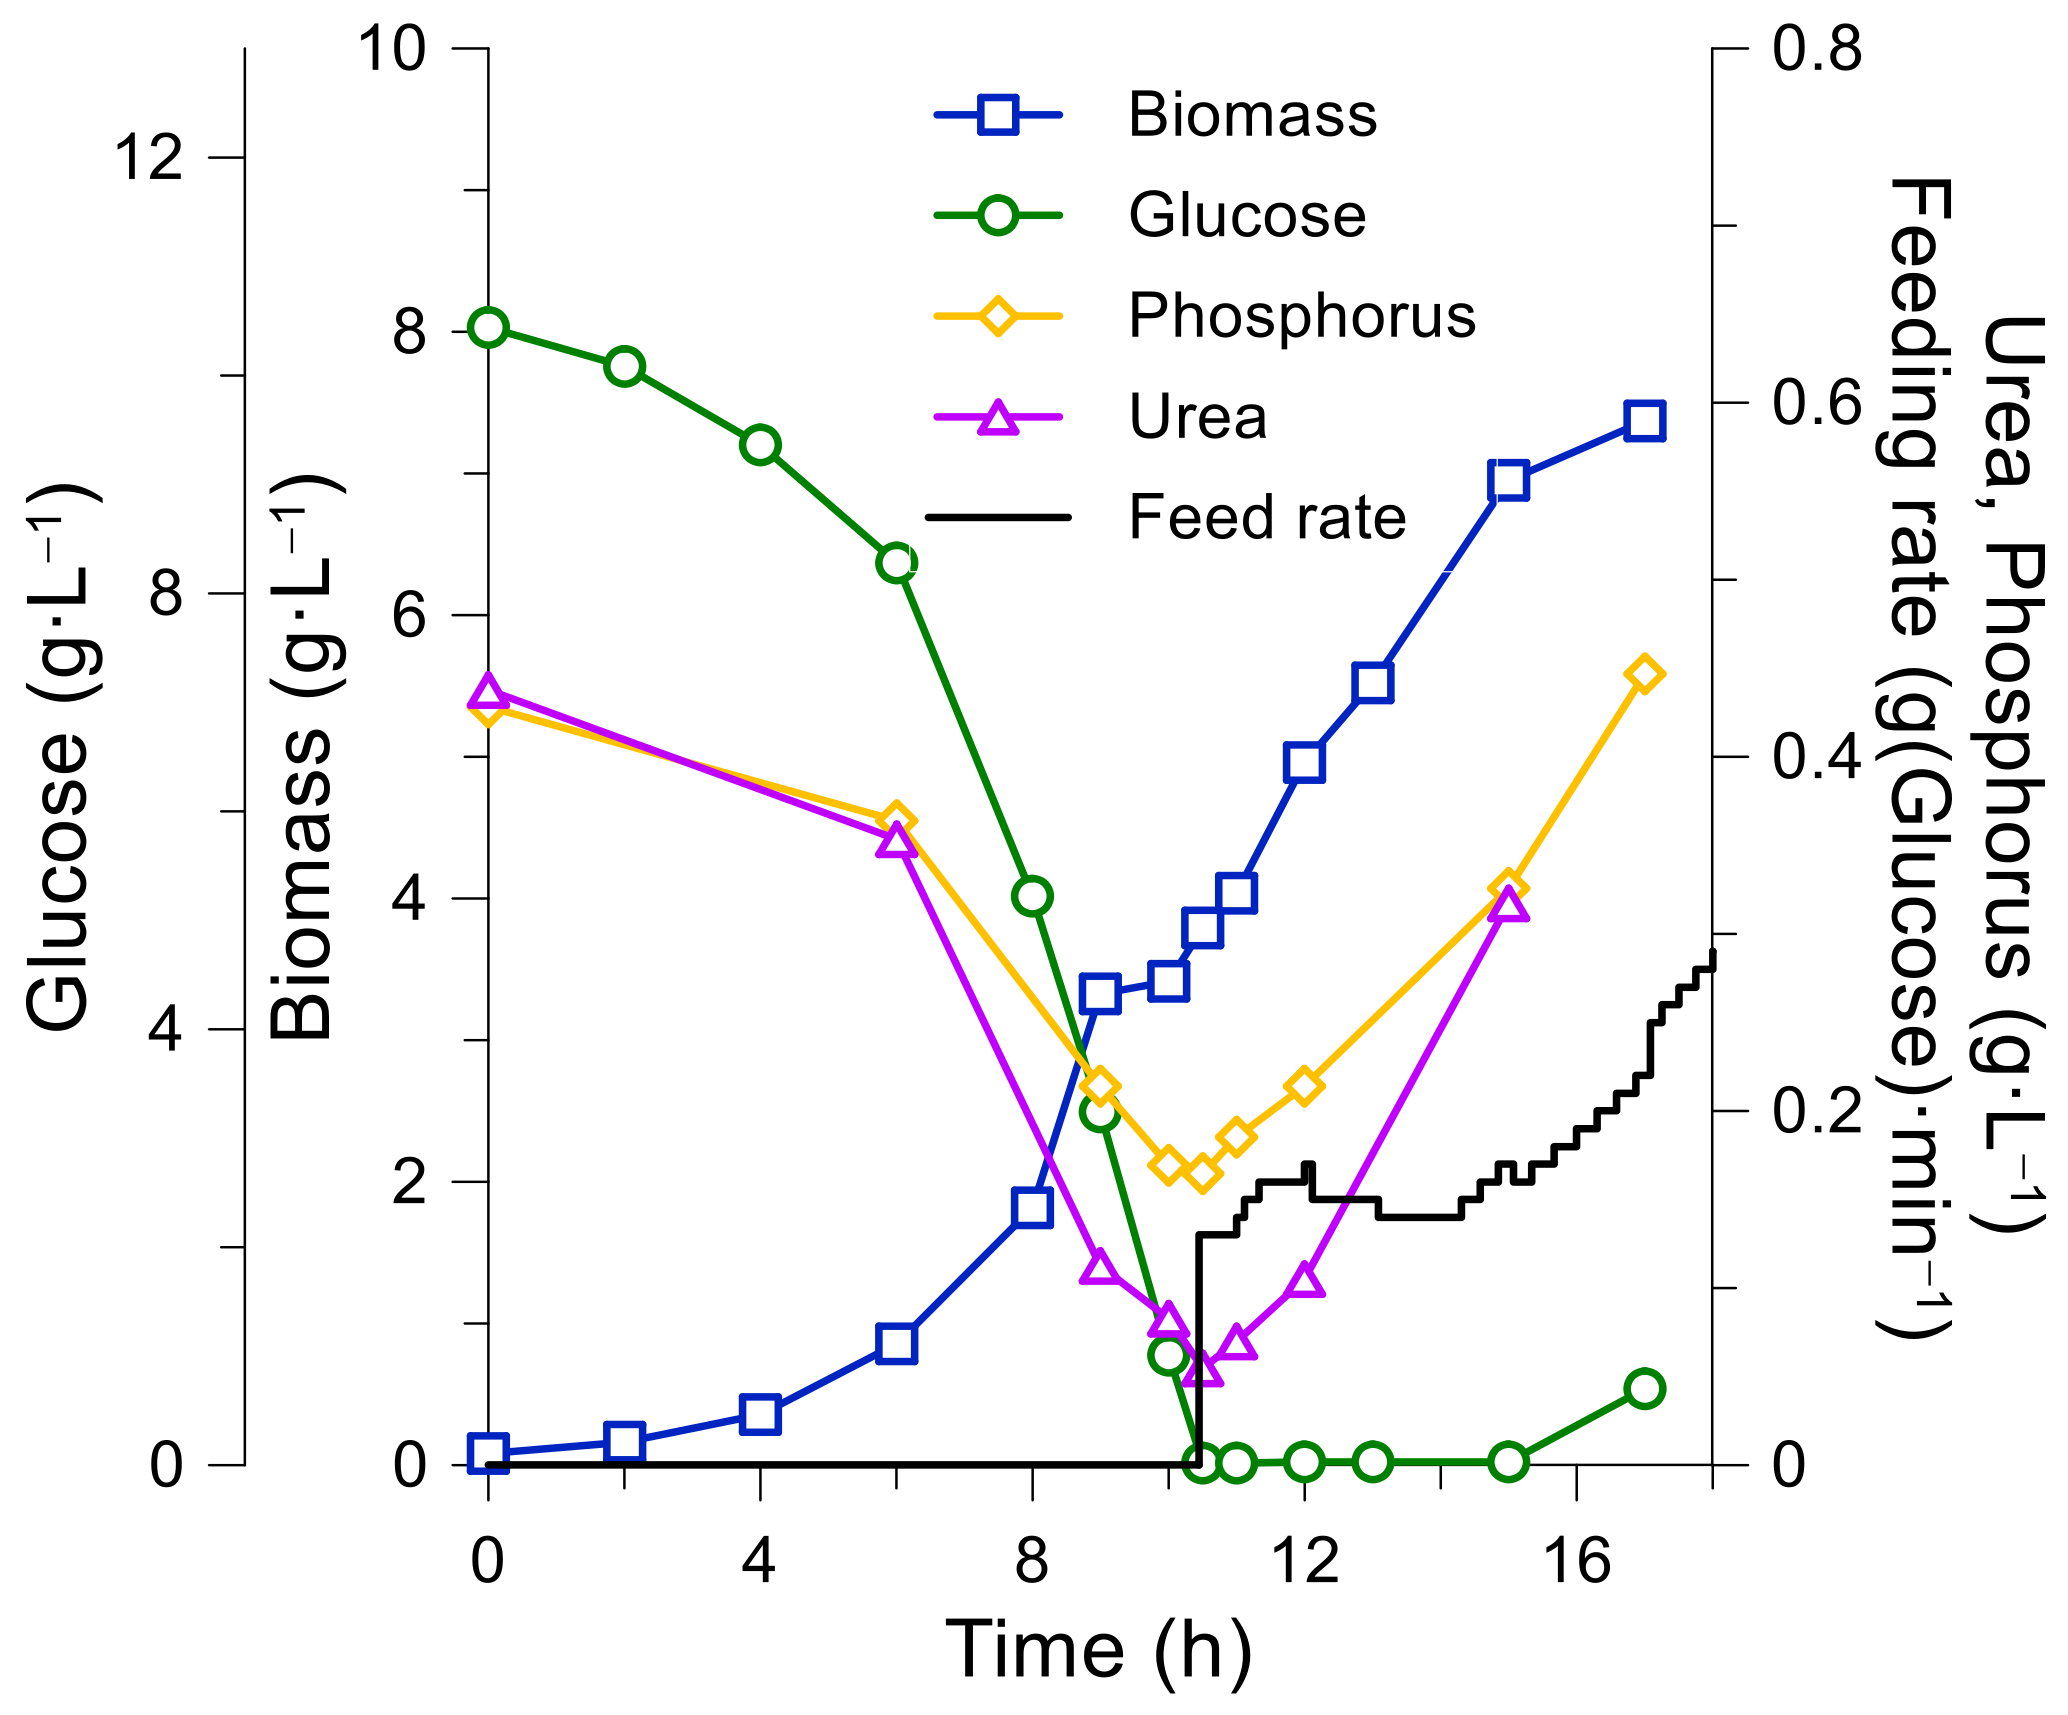
−1. By overestimating glucose consumption in the micro-cultivation system, we underestimated the urea and phosphate consumption. When calculating the nutrient concentration relations within the growth medium, the following ratios were obtained—C:N:P = 1:0.043:0.005. After performing bioreactor fed-batch cultivation experiments, the mentioned ratios were corrected to 1:0.07:0.011. Thus, the micro-cultivation experiment gave a rough estimate on
K. marxianus nutrient consumption and, due to inefficient aeration, the media composition needed to be fine-tuned in bioreactor experiments.
The applied vitamin mixture is included as a separate component in synthetic medias almost unchanged for more than 70 years (reviewed in Reference [
29]). Interestingly, not all yeasts are auxotrophic for all vitamins included in the vitamin mixture [
29,
30]. It seems, that external biotin supplementation is a typical requirement for most yeasts.
From the results of previously described cultivation experiments, it was deduced that the biomass yield from 1 mL of vitamin mixture is roughly 7.5 g·L
−1. The mentioned yield value cannot be considered as absolute due to the fact that it is possible to reach a biomass concentration of 8.5 g·L
−1 with the same number of vitamins, even though the growth rate starting from a biomass concentration of 7.5 g·L
−1 is considerably slowed down. Additionally, multiple experiments were carried out in order to determine the limiting component of the vitamin mixture, which were performed by adding individual vitamins to the growth medium upon registering a biomass growth rate decrease. As a result, it was observed that none of the individual components of the vitamin mixture posed a positive effect on the biomass growth rate (see
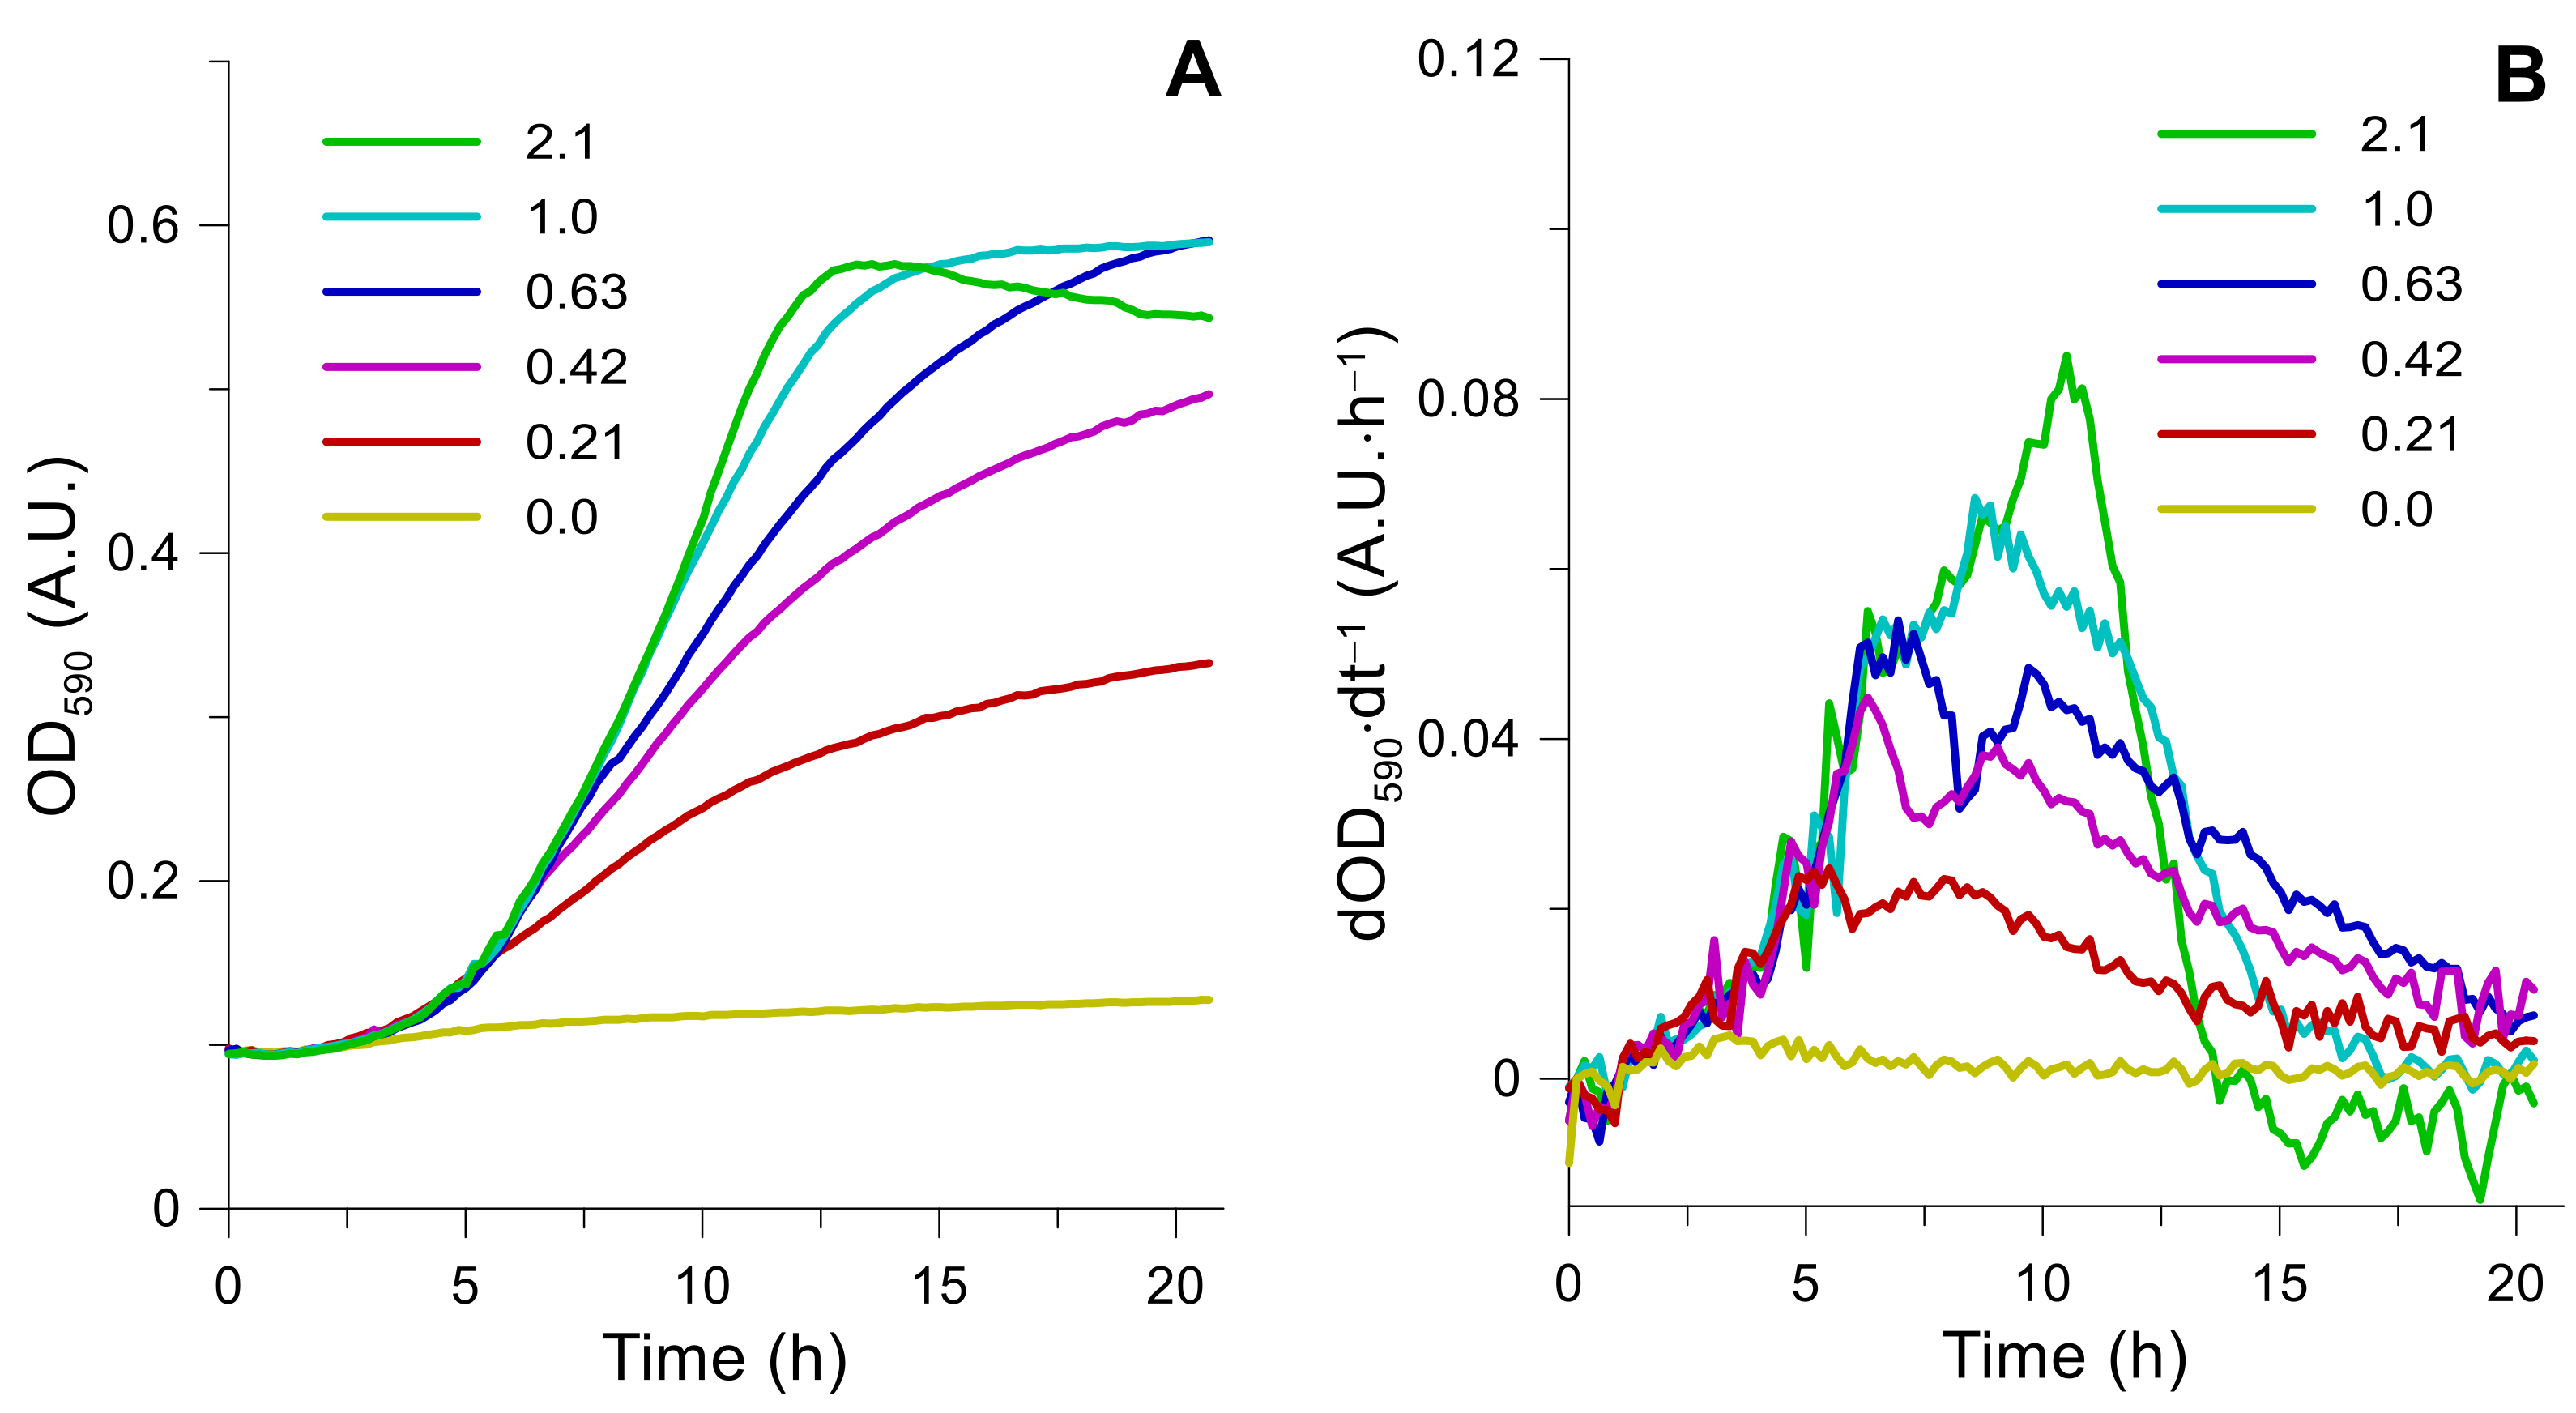
Appendix C,
Figure A3 and
Table A1). Furthermore, the addition of the vitamin mixture in quantities, which resulted in final concentrations below 1 g·L
−1 in the growth medium, also did not stimulate any growth rate increases. From these observations, it was concluded that the vitamin effect on biomass growth displays a complex characteristic, which implies that biomass growth is stimulated only due to a parallel effect of multiple chemical compounds. Furthermore, it seems that there exists a critical concentration of said chemical compounds, e.g., upon traversing the critical concentration value, the biomass growth rate is significantly limited/boosted.
A shortage of any components necessary for biomass synthesis (oxygen, microelement, vitamin, or nitrogen) can lead to unbalanced growth and overflow carbon metabolism in
K. marxianus [
25,
31]. At the end of the batch phase, we observed accumulation of ethanol, which is a typical overflow metabolite. At the same time, during the batch phase, phosphate accumulated in the medium (consumption was decreased when compared to the fed-batch phase). However, phosphorus as well as ethanol was gradually depleted throughout the feeding phase (by comparing
Figure 4,
Figure 5 and
Figure 6 metabolite and off-gas curves). Therefore, it is assumed that phosphate accumulation and ethanol biosynthesis might be related. The switch from fermentative (glucose) to oxidative (pyruvate, acetaldehyde) substrates leads to a decrease in phosphorous uptake in
S. cerevisiae. The phosphorus uptake decreased almost twice when
Saccharomyces cerevisiae was cultivated with oxidative rather than fermentative substrates [
32]. During the course of bioreactor cultivations, the ethanol accumulation diminished when the urea content in the growth medium was increased for the batch phase (see
Figure 7A), thus, improving glucose consumption and lowering overflow metabolism.
Kluyveromyces marxianus is considered a urease-negative yeast and it is argued that the urea uptake in this organism is performed via the urea carboxylase and allophanate hydrolase complex in which the activity is mediated by biotin [
15,
33,
34]. Thus, it was hypothesized that the addition of vitamins to the cultivation medium upon registering a particular cell growth limitation after reaching a biomass concentration of 35 g·L
−1 should have promoted the nitrogen uptake, e.g., growth rate increase. However, we did not observe an increase in biomass concentration when adding the vitamin mixture (including biotin) or other macro/micro components in surplus. This observation casts doubt on the
K. marxianus urea uptake via the carboxylase pathway. In turn, the addition of nickel to the cultivation environment resulted in a two-fold increase of maximum biomass concentration and increased the urea consumption rate. A positive reaction to nickel may indicate that the assimilation of urea occurs through the urease pathway. On the other hand, previously published studies revealed no urease activity in the
Kluyveromyces spp. [
15,
33,
35]. Although, upon further inspection of published literature, it was observed that the applied urease tests identify solely extracellular urease. Unfortunately, no data was found in the literature on the presence of intracellular urease in
K. marxianus. The latter may explain the mechanism of urea assimilation. However, to draw a concrete conclusion, further research should be performed to identify the exact mechanism of urea consumption in
Kluyveromyces marxianus DSM 5422.
The increase in the rate of nitrogen consumption also positively affected the biomass yield during the batch phase, while reducing ethanol production. Therefore, for cultivations 2 and 4, the biomass yield from glucose increased from 0.35 to 0.43 g.g−1, and the maximum ethanol concentration decreased from 5.6 to 2.2 g·L−1, respectively.
In addition to the balanced uptake of the main cultivation medium components, it is worth noting a significant decrease in the consumption of titrants (used for pH control) during the process. The consumption of the NaOH during the 4th experiment decreased 2.2 fold in comparison to the 2nd experiment and amounted to 60 mg·g−1 DCW. Furthermore, antifoam was not consumed during each performed cultivation, which points to the absence of cell lysis and inhibition of by-product synthesis. In turn, the absence of foam formation promotes the use of online sensors (turbidity or permittivity based) for determining biomass concentrations, as the mentioned sensors are very sensitive to rheological changes of the growth medium.
The maximal obtained biomass concentration was equal to 73 g·L
−1, which is comparable to other previously published cultivation results when using synthetic growth mediums [
36]. Although, the maximal biomass value can be improved, taking into account the fact that biomass limitation was not reached at the mentioned concentration.
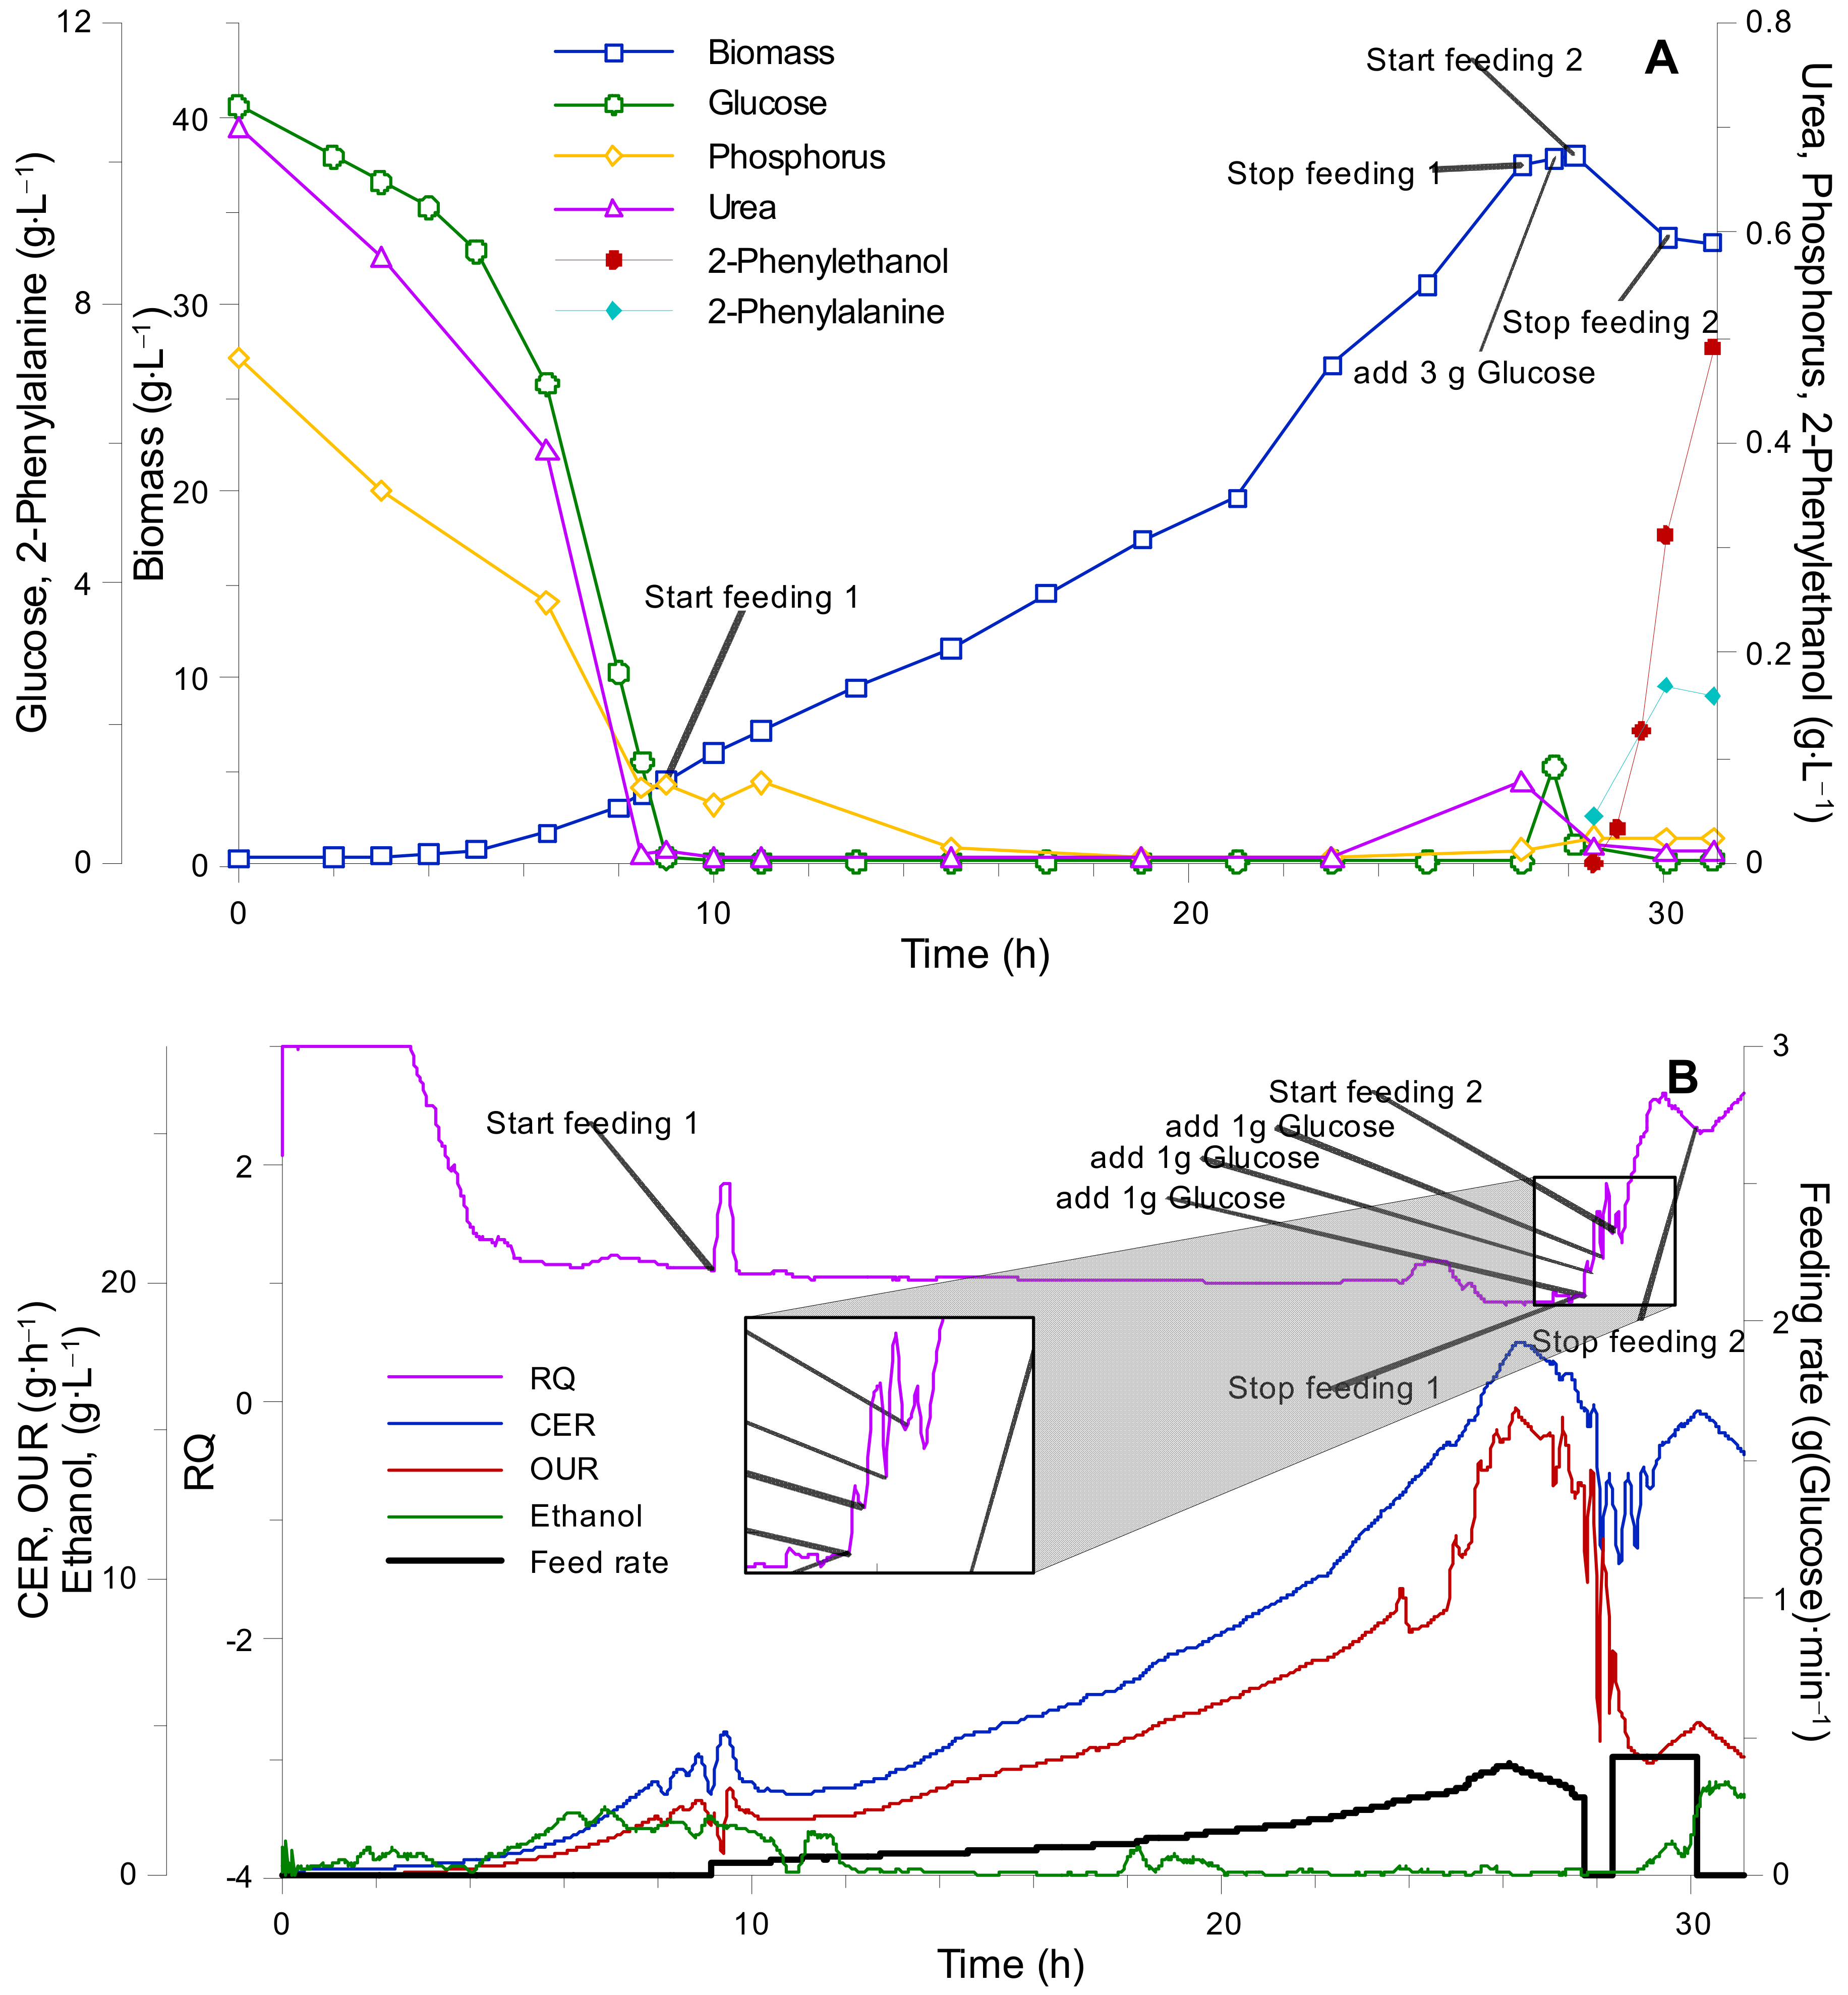
During the biosynthesis phase, the maximum obtained productivity of 2-PE was 0.372 g·L
−1·h
−1, with a yield of 74%, which is very close to the data presented by other authors [
10]. The biomass yield from glucose during the 2nd fed-batch phase (with 2-PHE) was 0.23 g·g
−1 and accumulation of 2-phenylalanine was observed. This indicates that the utilization of nitrogen contained in 2-phenylalanine proceeded more slowly in comparison to using urea. Thus, the excess carbon was re-directed toward synthesis of ethanol, which accumulated immediately after initiation of the 2nd feeding stage. The maximum nitrogen utilization rate, and biomass-to-nitrogen yields were 0.0178 g(2-PHE)·g
−1 h
−1 (0.108 mM(2-PHE)·g
−1·h
−1), and 4.11 g·g
−1, respectively.
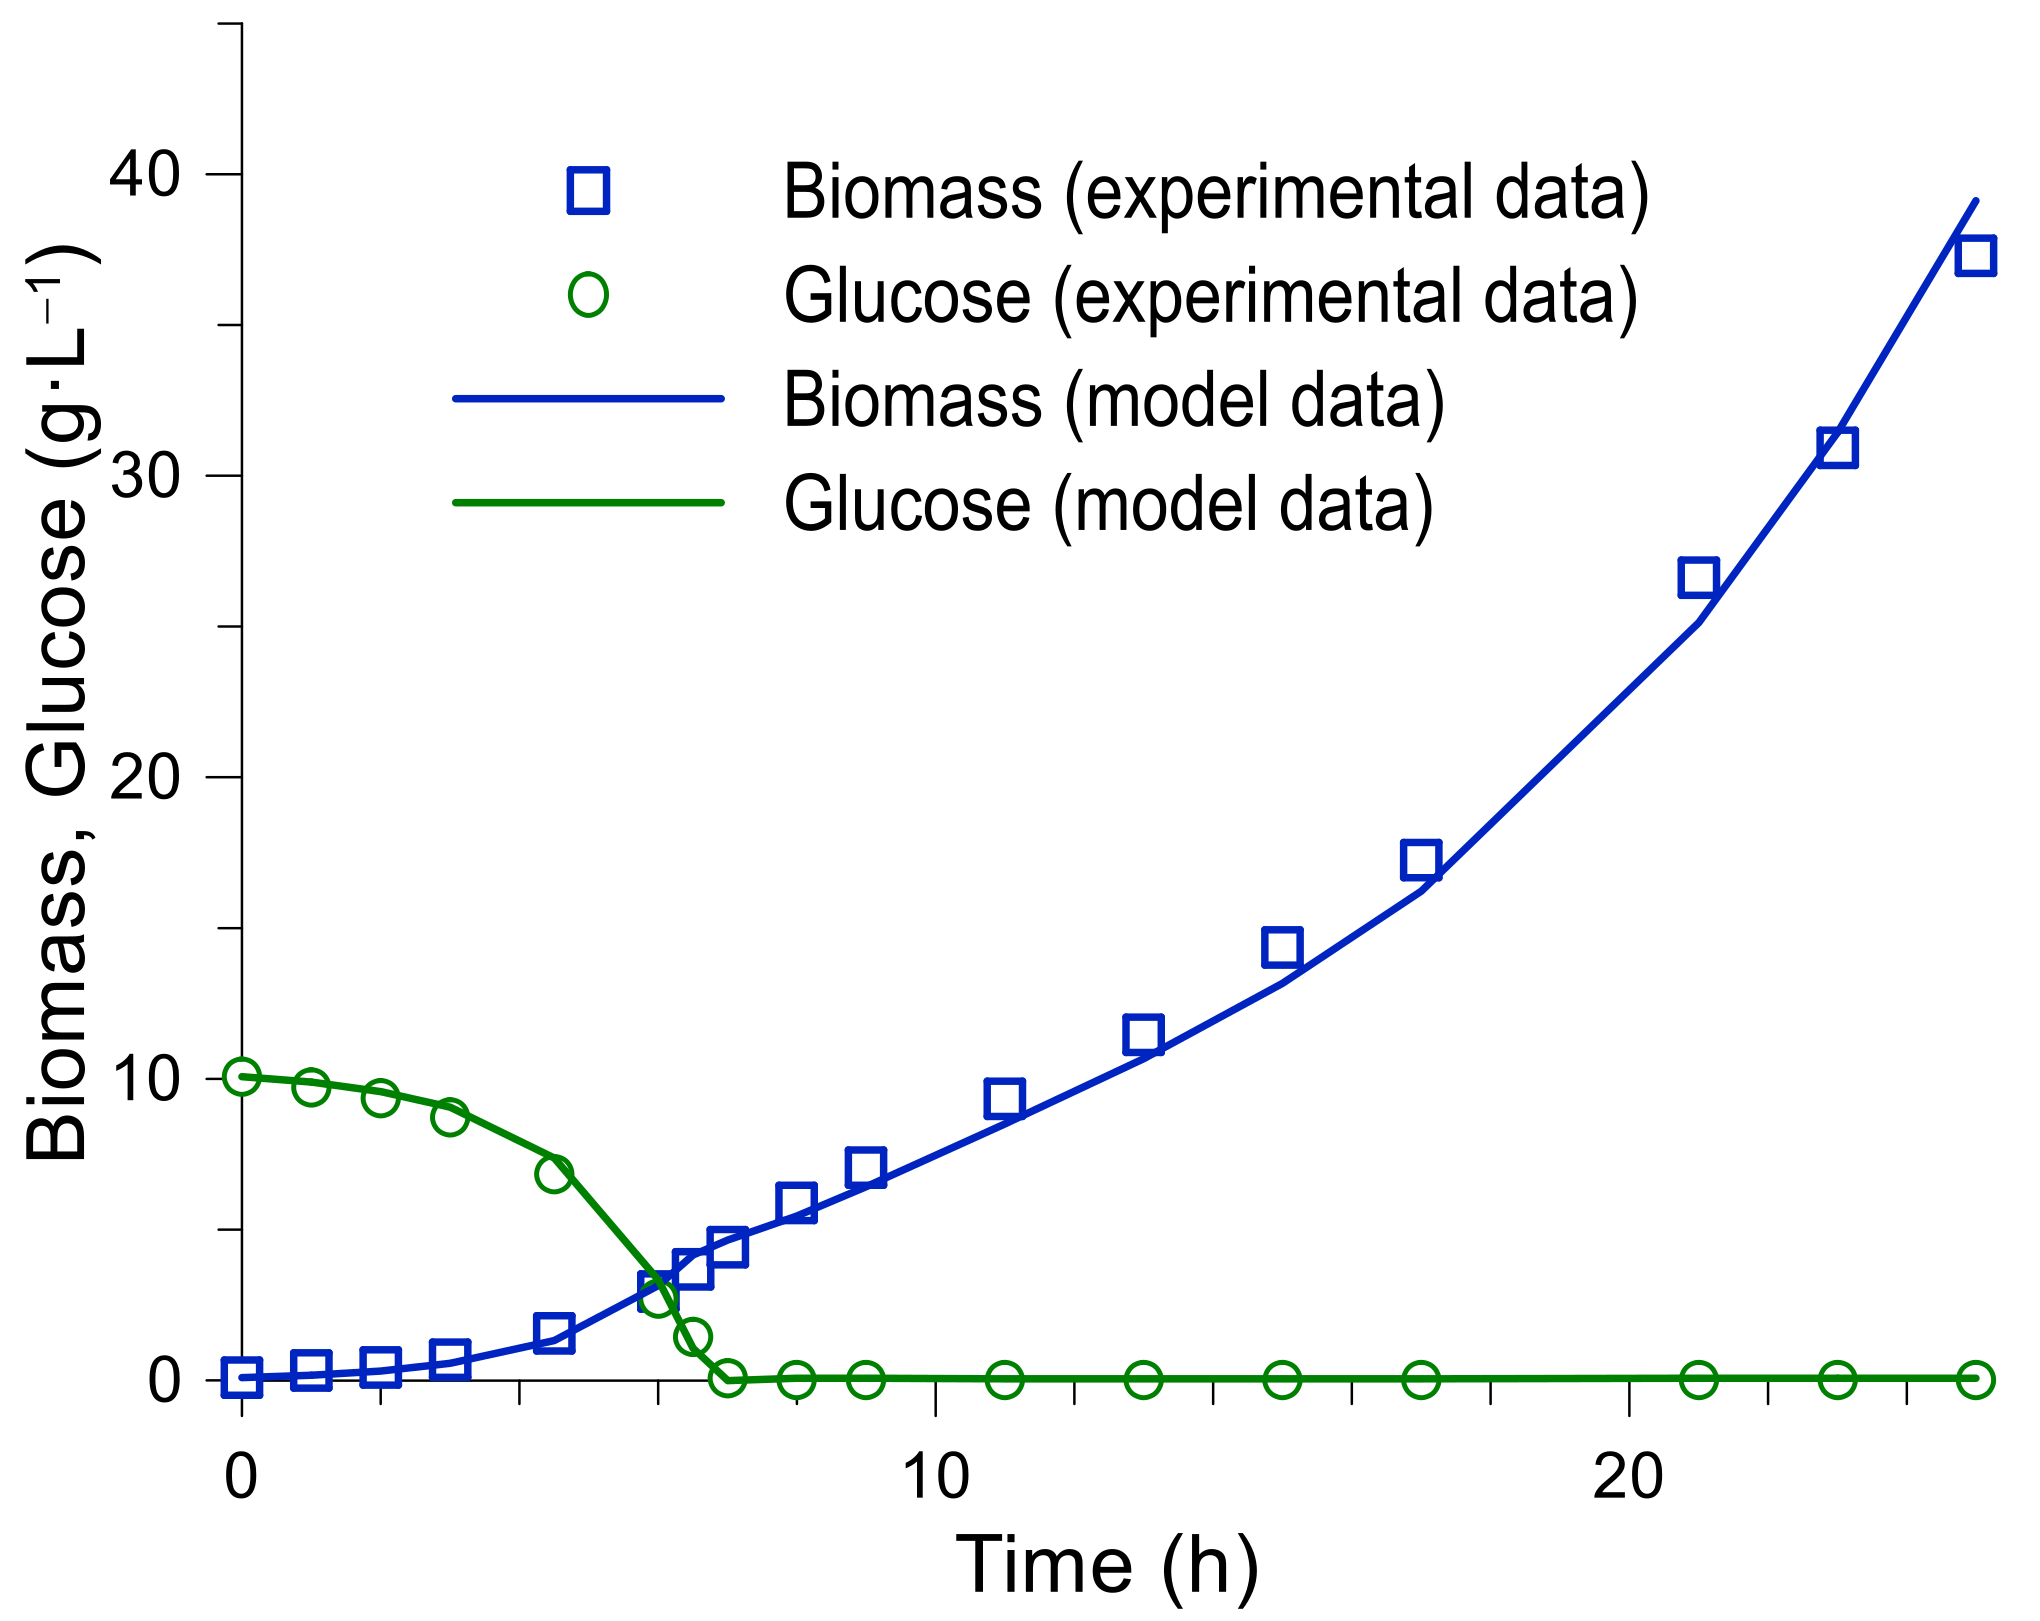
In order to improve the performance of the MPC algorithm, the model parameters were optimized based on the obtained experimental data. The simulation results of the 4th process up to 27 h are presented in
Figure 8 and in
Table 4. The obtained kinetic constants differ from the real values since they represent only averages and have a complex characteristic. Although the acquired values have sufficient accuracy, WAPE
X = 6% to describe the biomass growth to a concentration of 40 g·L
−1 at a given specific growth rate of 0.2·h
−1.
5. Conclusions
The optimization of synthetic media composition for K. marxianus fed-batch cultivations was successfully performed during the course of the present research. Primarily, the micro-cultivations gave an approximate estimate of specific glucose, urea, and phosphate consumption rates, which was fine-tuned by fermentation experiments. For K. marxianus DSM 5422 fed batch cultivation in synthetic media, we suggest the C:N:P ratio to be 1:0.07:0.011.
The use of optimized composition of the growth medium and feeding solution led to optimal consumption of main nutrients and no accumulation of those were observed. The use of an optimized medium composition reduces accumulation of by-products and substrate, thus, reducing osmotic stress on the cells and promoting biomass growth.
Additionally, the biomass yields from the vitamin mixture (YXVit = 7.5 g·mL−1), microelements (YXMicro = 31 g·mL−1), and other macro-components such as Mg and Ca (YXMg = 66 g·g−1, YXCa = 330 g·g−1) were identified, which makes it possible to estimate the minimum required amounts of components in the growth medium in order to obtain the required amount of biomass.
Unexpectedly, supplementing the growth medium with Ni2+ ions allowed us to elevate the biomass titer up to 70 g·L−1. This is a remarkable achievement, even though the mechanisms showing how Ni2+ improves K. marxianus biomass production is yet to be elucidated.
Urea is a proton neutral nitrogen source. The consumption of urea lowered use of titrants (for pH and/or foam level control) and eased the control of the fermentation process.
After a biomass production phase in the fed batch process, a 2-PE synthesis phase was launched. The 2-PE production reached 0.372 g·L−1·h−1, with an overall production effectivity of 74% from substrate 2-phenylalanine. This result is similar to other optimization results and demonstrates acceptable catalytical activity of obtained biomass from the optimized fed batch process.
The mathematical model parameters, which were obtained through process modelling, describe the experimental data with acceptable accuracy (WAPEX = 6%) and allow the calculation of the feeding rate and process reference trajectories for the application of a model’s predictive control.


 ,
, 


