Article

Gasification of Woody Biomasses and Forestry Residues: Simulation, Performance Analysis, and Environmental Impact

by
Sahar Safarian
1,*,
Seyed Mohammad Ebrahimi Saryazdi
2,
Runar Unnthorsson
1 and
Christiaan Richter
1
1
Mechanical Engineering and Computer Science, Faculty of Industrial Engineering, University of Iceland, Hjardarhagi 6, 107 Reykjavik, Iceland
2
Department of Energy Systems Engineering, Sharif University of Technologies, Tehran P.O. Box 14597-77611, Iran
*
Author to whom correspondence should be addressed.
Fermentation 2021, 7(2), 61; https://doi.org/10.3390/fermentation7020061
Submission received: 16 March 2021 / Revised: 7 April 2021 / Accepted: 9 April 2021 / Published: 11 April 2021
(This article belongs to the Special Issue Biomass and Waste Valorization)

Abstract

:
Wood and forestry residues are usually processed as wastes, but they can be recovered to produce electrical and thermal energy through processes of thermochemical conversion of gasification. This study proposes an equilibrium simulation model developed by ASPEN Plus to investigate the performance of 28 woody biomass and forestry residues’ (WB&FR) gasification in a downdraft gasifier linked with a power generation unit. The case study assesses power generation in Iceland from one ton of each feedstock. The results for the WB&FR alternatives show that the net power generated from one ton of input feedstock to the system is in intervals of 0 to 400 kW/ton, that more that 50% of the systems are located in the range of 100 to 200 kW/ton, and that, among them, the gasification system derived by tamarack bark significantly outranks all other systems by producing 363 kW/ton. Moreover, the environmental impact of these systems is assessed based on the impact categories of global warming (GWP), acidification (AP), and eutrophication (EP) potentials and normalizes the environmental impact. The results show that electricity generation from WB&FR gasification is environmentally friendly for 75% of the studied systems (confirmed by a normalized environmental impact [NEI] less than 10) and that the systems fed by tamarack bark and birch bark, with an NEI lower than 5, significantly outrank all other systems owing to the favorable results obtained in the environmental sector.

1. Introduction

To mitigate serious climate change, greenhouse gas (GHG) emissions must be reduced to net zero or even negative all over the world. Many experts indicate that we have to completely phase out fossil fuels and replace them with local and renewable energy sources such as solar, hydroelectric power, biofuels, and wind [1,2,3]. Among the various renewable energy sources, biomass is one of the most promising optional energy carriers that can be applied instead of conventional resources. Biomass is the only renewable energy source that can serve as the substitution for fossil fuels as it is widely available and assures continuous power generation and the synthesis of different products such as chemicals or transportation fuels [4,5].
Typically, biomass fuels are categorized into four main classes of agriculture: wood and forestry residues, municipal solid wastes (MSW), and various types of biomass energy crops. As co-products, wood and forestry residues are wastes along with the processing of forest products such as needles, prunings, bark, wood sawdust, and wood chips [6]. Woody biomass is also a highly important energy sources, and it is currently the most important source of renewable energy globally [7,8,9]. In 2010, the worldwide use of woody biomass as an energy resource was about 3.8 Gm3 (30 EJ/year), which consisted of 1.9 Gm3 (16 EJ/year) for household fuelwood and 1.9 Gm3 (14 EJ/year) for the large-scale industrial sector. During this period, global primary energy consumption and global renewable energy consumption were 541 EJ and 71 EJ, respectively. Hence, in 2010, woody biomass comprised roughly 9% of the world‘s primary energy consumption and 65% of the world‘s renewable primary energy consumption [10,11]. In addition, the potential of the current forest bioenergy is appraised to be in the range of 0.8 to 10.6 EJ per year by 2050. Among woody biomass feedstocks, the utilization of forestry wastes has become a practical option, especially in the countries of the European Union, where forest biomass-derived energy accounts for approximately 50% of renewable energy [6].
To draw out energy from biomass fuels, gasification, an immensely efficient and green conversion technology, is employed to convert various biomass feedstocks to a wide range of products for different applications [4,12]. Biomass gasification systems produce a much lower amount of air pollutants. The by-products of this system are also non-hazardous and readily marketable. Importantly, biomass gasification units can be combined with power generation units to allow for the installation of a more reliable energy supply technology for places far from the central energy networks that need a district heat and power system [13].
Gasification enables a versatile and feed-flexible means for the thermal decomposition of feedstocks at moderate-to-high temperatures while simultaneously reacting with suitable gasifying agents such as oxygen, air, steam, or carbon dioxide into a syngas of high calorific content (gases containing H2, CO CO2, CH4, C2H6, and trace amounts of other higher series of hydrocarbons) [14]. Moreover, gasification has the advantage of the complete decomposition of various kinds of materials that may be present in the waste, including pine bark, to provide clean energy from such wastes [15,16]. Biomass gasification offers a sound method for mitigating irreversible fossil fuel depletion [17,18].
Performance analysis of biomass gasification systems has been studied in many researches [17,18,19,20,21,22,23,24,25,26,27,28]. However, the authors are not aware of any reported paper about the modeling of integrated downdraft biomass gasification with a power production unit. Li et al. [29] proposed a non-stoichiometric equilibrium model to predict the performance of a pilot circulating fluidized bed (CFB) coal gasifier. Other authors have developed other equilibrium models to evaluate the effect of the equivalence ratio, moisture content and reaction temperature in a downdraft gasifier, using different biomasses such as wood chips, paper, paddy husk and municipal wastes [30] and cashew nut shells [31]. Dhanavath et al. [32] used karanja press seed cake as a biomass feedstock to study the effect of oxygen–steam as gasifying agents in a fixed bed gasifier, and the experimental data were simulated with an equilibrium model developed with Aspen Plus. Other works performed sensitivity analyses to evaluate the changes in syngas quality using various biomasses as a function of process conditions, i.e., the steam-to-biomass ratio, air equivalence ratio and temperature [33,34]. Monir et al. [35] presented a simulation model to study the impact of pressure and temperature on syngas production. The gasification process was divided into four stages represented by four different blocks in the Aspen Plus model. Experimental data were obtained in a pilot-scale downdraft reactor using a mixture of empty fruit brunch and charcoal. Ramzan et al. [36] developed a steady state simulation model for downdraft gasification by using Aspen Plus. The model can be used as a predictive tool for optimization of the gasifier performance. The gasifier has been modeled in three stages. The gasification reactions have been modeled using the Gibbs free energy minimization approach. In the simulation study, the operating parameters, such as the temperature, equivalence ratio (ER), biomass moisture content and steam injection, have been varied over a wide range and the effect of these parameters on syngas composition, high heating value (HHV) and cold gas efficiency (CGE) has been investigated. Shahabuddin and Bhattacharya [37] investigated the gasification behavior of bituminous coal using different reactants of CO2, steam and a mixture of CO2 and steam under entrained flow gasification conditions at temperatures of 1000 °C and 1200 °C with atmospheric pressure. González-Vázquez et al. [38] developed two thermodynamic equilibrium models in Aspen Plus. Both models were validated with experimental data from a semi-pilot scale gasifier using pine kernel shells (PKS) as feedstock. The influence of temperature, stoichiometric ratio (SR) and the steam-to-biomass ratio (SBR) were analyzed.
From a literature review, it can be concluded that there is not any presented research that has comprehensively performed both a performance analysis and environmental assessment of the of integrated downdraft biomass gasification with a power production unit. However, this system has been proved as a sustainable option for the treatment of biowastes such as wood and forestry residues (WB&FR) as well as electricity generation.
In this work, we will study the potential of gasification for energy production and woody biomass and forestry residue (WB&FR) treatment for small communities in Iceland. Most of Iceland‘s municipalities, which are semi-autonomous administrative zones, contain several disparate cities with a population less than 10,000 persons. In these very distant areas, where a wide grid is not feasible, decentralized power generation by gasification offers a viable option for meeting the electricity needs of the local population.
The primary aim of this work was to develop a steady-state computer model using ASPEN Plus for a performance analysis of 28 WB&FR gasification processes in a downdraft gasifier integrated with power production. The case study assesses the power production in Iceland from one ton of each type of feedstock. The objective was to find the most efficient WB&FR for power production. Then, an environmental impact analysis containing global warming, acidification, and eutrophication potentials for the mentioned WB&FR is carried out in this paper. Finally, the normalized environmental impact (NEI) for the integrated system of a gasification and power generation plant is compared and interpreted for all considered systems. In this work, tar production and cleaning have not been considered and this technical environmental assessment is a preliminary work; a comprehensive environmental assessment considering tar production should be carried out in future works.

2. Material and Methods

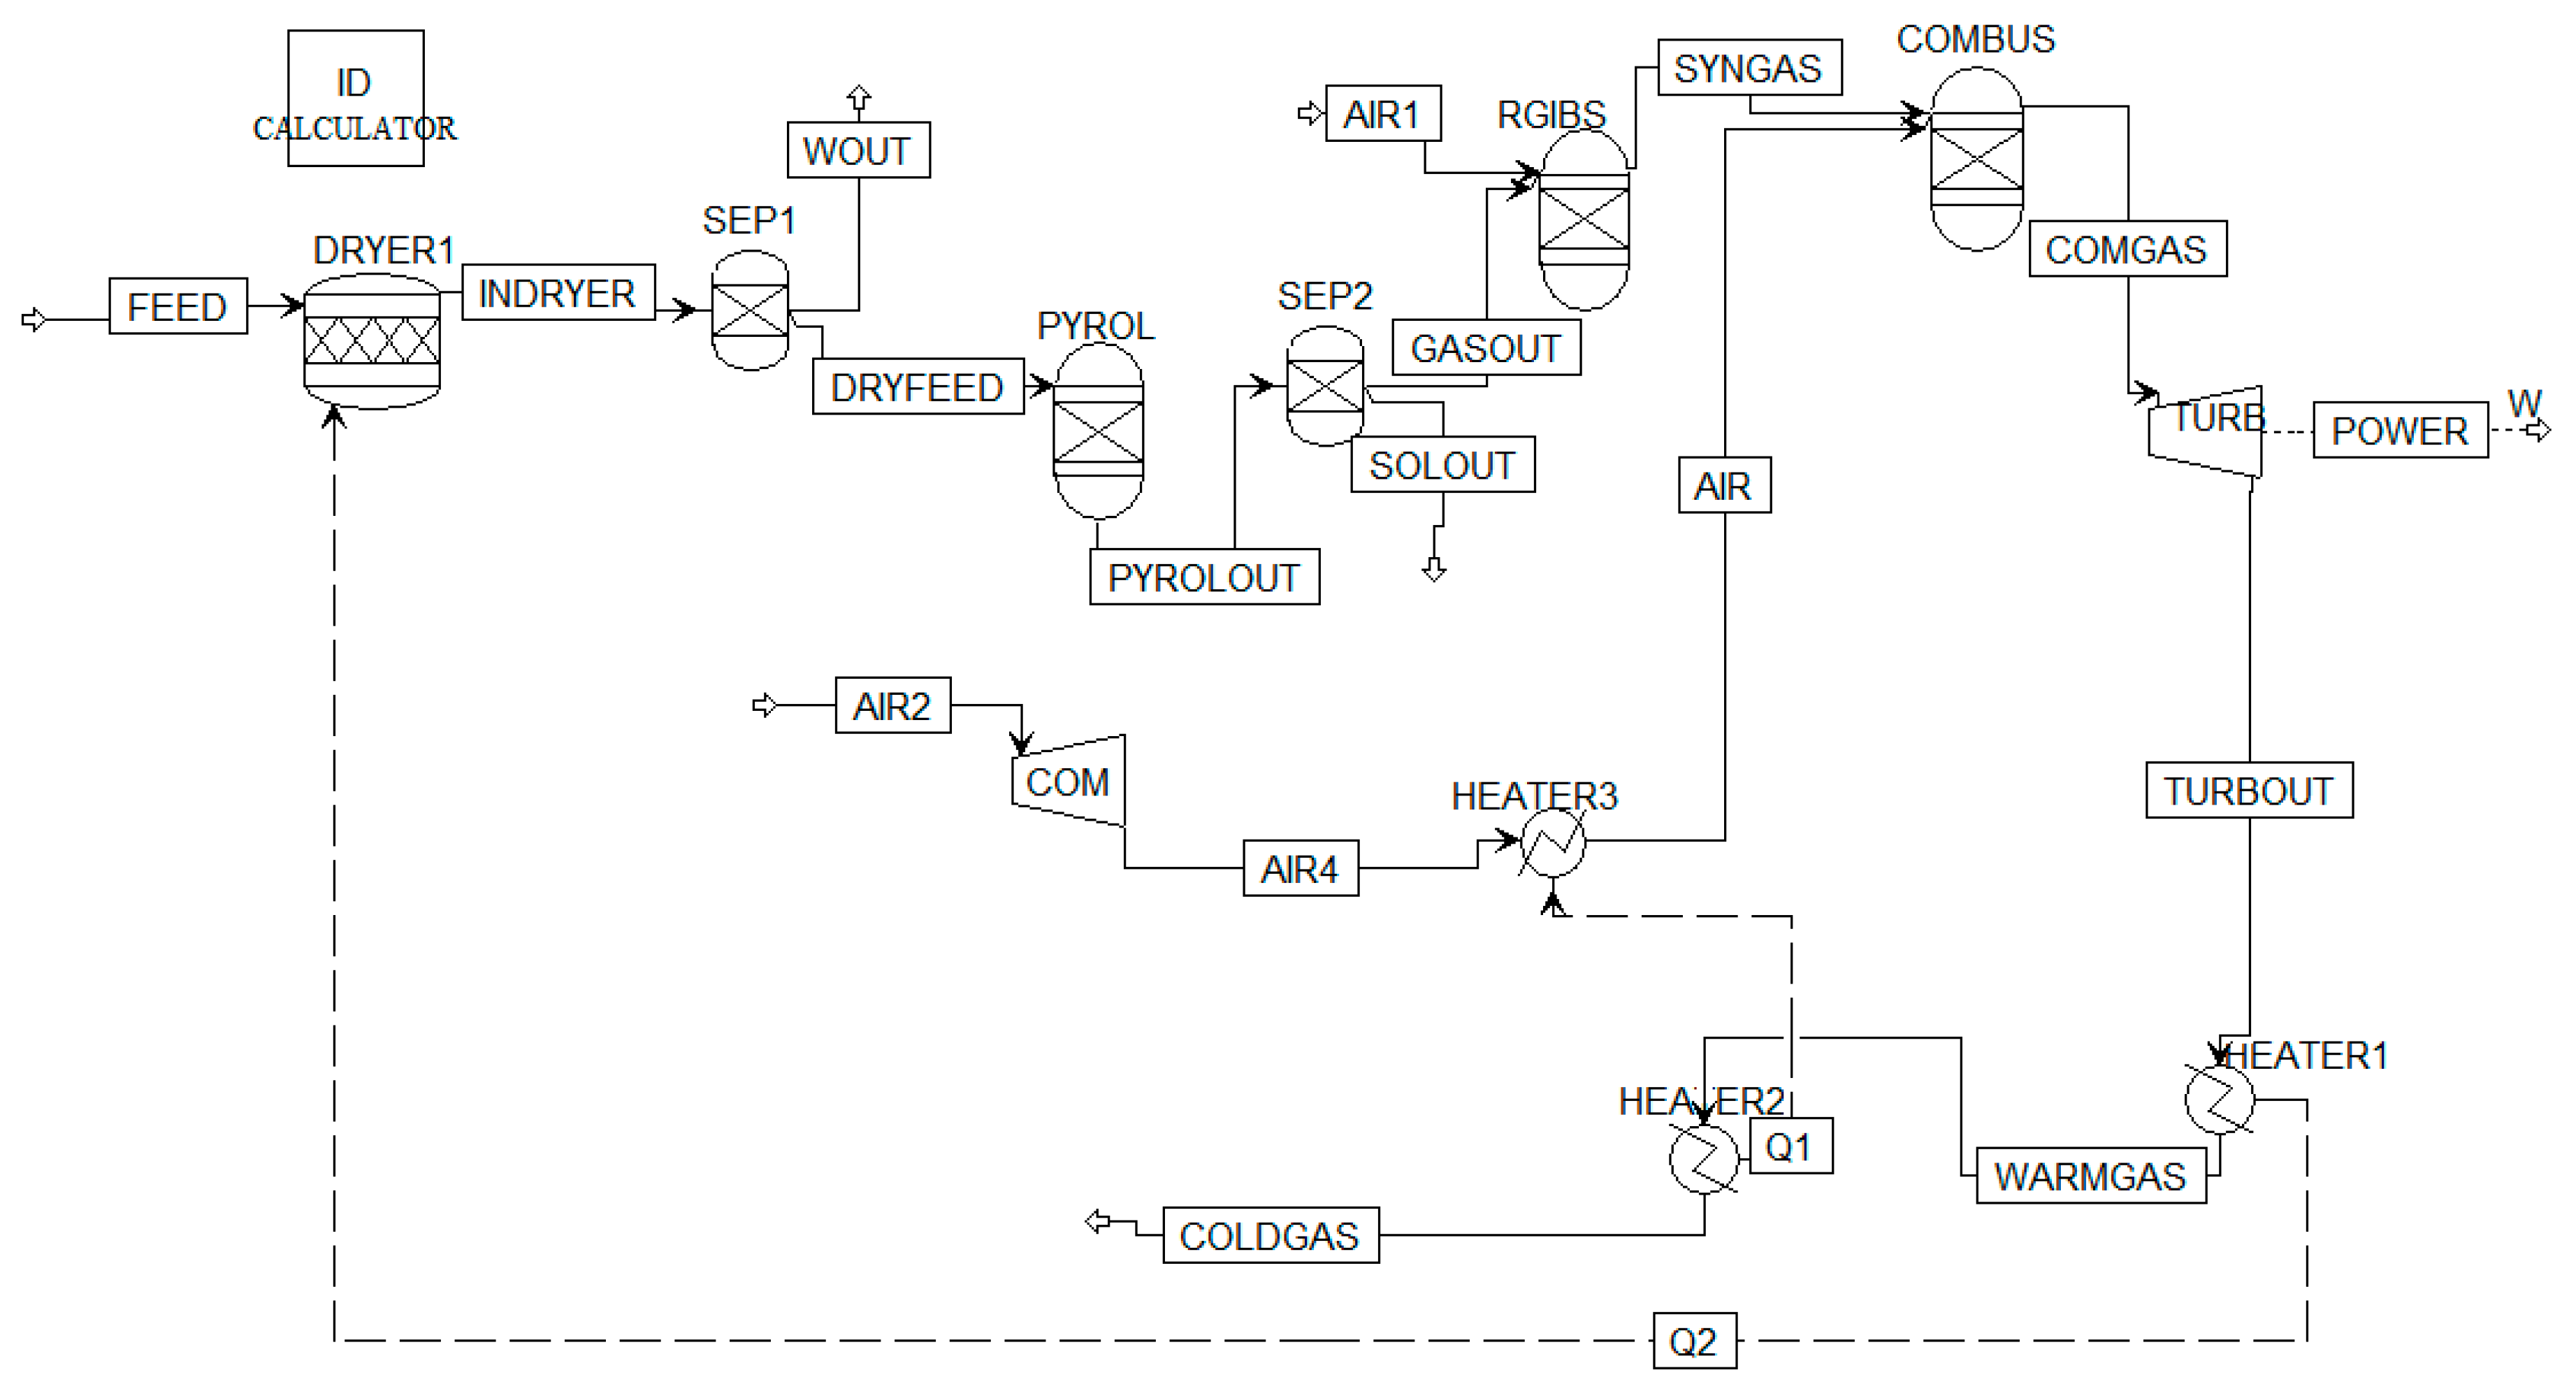
2.1. System Description

Figure 1 shows the system boundaries considered by this work containing the process steps from the initial resources to the end products.
In the resource step, WB&FR are the main input resources. Moreover, liquid fuel and electricity are brought in as accessory inputs. Diesel fuel is consumed by trucks for transportation, and electricity is supplied for driving force and heat generation over the process. The electricity production in Iceland is derived from geothermal and hydropower, which make up Iceland’s main source of clean energy. WB&FR are transferred from the feedstock fields to the pre-treatment area next to the gasification and power generation plant. The gasification process consists of drying, pyrolysis, combustion, and gasification [39]. Typically, drying takes place at a temperature of 100 to 150 °C, and through this step, the moisture in the biomass that is in the range of 5 to 60% is decreased to less than 5%. Pyrolysis occurs around 200 to 700 °C; in this process, biomass is heated in the absence of oxygen/air and then its volatile components are vaporized. The volatile vapor is composed mainly of H2, CO, CO2, CH4, hydrocarbon gases, tar, and steam. Finally, combustion occurs at 700 to 1500 °C, and gasification occurs at between 800 and 1100 °C. In this work, the downdraft reactors operate at atmospheric pressure to gasify WB&FR, and air is used as the gasification agent, resulting in CO2 and H2O, which subsequently undergo reduction upon contact with the char produced from pyrolysis. This reduction yields combustible gases such as H2, CO, and CH4 through a series of reactions. Then the gas product moves to the internal combustion engine that is modeled as a combustion chamber followed by a gas turbine. The combination of these two modules represents the behavior of a combustion engine in which the reaction with air occurs [40].
It is noteworthy that all analysis is directed based on a functional unit of 1 ton/h for each input of feedstock under atmospheric pressure, 900 °C for the gasifier temperature and air to fuel a mass flow rate of 2. A distance of 50 km was also taken into account for biomass transportation from the field to the energy conversion plant. Other assumptions regarding energy and efficiency inputs are listed in Table 1 [41].

2.2. Simulation Model Implementation

2.2.1. Model Inputs

The inputs required for the model are as follows:
  • Feedstock composition (using ultimate and proximate analysis of biomass feedstocks)
  • Initial conditions of input feedstock (i.e., temperature: 25 °C, pressure: 1 atm, and the mass flow rate: 1 ton/h)
  • Initial conditions of dryer (temperature: 150 °C and pressure: 1 atm)
  • Initial conditions and yield distribution through the pyrolysis (temperature: 500 °C, pressure: 1 atm, and the yield distribution is described based on the ultimate and proximate analysis of biomass feedstocks [24])
  • Initial conditions of input air to the gasifier (temperature: 25 °C, pressure: 1 atm, and the mass flow rate is defined based on air-to-fuel ratio [AFR] of 2 [42])
  • Initial conditions through the gasifier (temperature: 900 °C and pressure: 1 atm)
  • Initial conditions in the combustion chamber (pressure: 11 atm and heat duty: 0 kW by considering an adiabatic reactor)
  • Initial conditions in the gas turbine (Isentropic efficiency: 92% and pressure ratio: 0.5 [41])
  • Initial conditions of input air to the combustion chamber (temperature: 25 °C and pressure: 1 atm)
  • Initial conditions in the air compressor (Isentropic efficiency: 90%, mechanical efficiency: 99%, and pressure ratio: 10 [41,43])
  • Output temperature of flue gas: 200 °C

2.2.2. Model Output

The model outputs are compositions and properties of the produced syngas as well as the value of the power output from the system.

2.2.3. Model Implementation

A simulation model has been established for WB&FR gasification integrated with a power generation unit based on an equilibrium approach by applying ASPEN Plus software. To compute the physical properties of the components in the gasification, an equation of the state of PR-BM, Penge Robinson-Boston-Mathias alpha is applied. In addition, for the modeling of the enthalpy and density of the biomass and ash as nonconventional materials, HCOALGEN and DCOALIGT models are used. It is noteworthy that the MCINCPSD stream includes three streams of MIXED, NCPSD, and CIPSD classes to define the biomass structure and ash streams that are not in the Aspen Plus database [43].
Figure 2 shows the flow chart of the system simulated in ASPEN Plus. The feedstock stream has been described as a nonconventional material, and it was defined by the determination of the elemental and proximate analysis of the feedstock. For a detailed study, 28 WB&FR were considered as feedstock for the gasifier. Table 2 shows the proximate and elemental analyses of all these feedstocks [44,45,46,47,48,49,50,51,52,53,54,55,56,57,58,59,60,61]. The temperature through the drying process is around 150 °C to reduce the moisture of the original biomass to less than 5 wt%. This step is done by utilizing an RSTOIC stoichiometric reactor in Aspen Plus. The RSTOIC module is practical for chemical reactions with known stoichiometry [62]. At the next stage, the yield reactor, RYIELD, is simulated for feed pyrolysis. In this part, the studied biomass is transformed into volatile materials (VM) and char. VM include mainly carbon, hydrogen, oxygen, and nitrogen. Char also includes ash and carbon. After pyrolysis, RGibbs is applied for the simulation of the biomass gasification. This reactor computes the syngas composition by minimizing the Gibbs free energy based on a complete chemical equilibrium assumption. Input streams to the RGibbs are decomposed biomass and air, then combustion and reduction reactions will occur inside the reactor. For the combustion level, another RGibbs reactor needs to be simulated with minimum air mixing. This process will also be based on the minimization of Gibbs free energy [63,64]. To generate power, the combustion chamber has to be connected with a gas turbine [40]. The thermal content of the flue gas is achieved as the combustion heat is recovered to preheat the input air to the combustion chamber as well as to supply the heat required in the dryer. The recovered heat can also be utilized for the conversion of water to high-pressure steam to be able generate extra power by steam driving a steam turbine [65,66] (this part was not considered in this study). The solid lines and the dashed lines in Figure 2 present the mass streams and heat streams, respectively. The system is also assumed to be auto-thermal, meaning a part of the feedstock is combusted inside the gasifier to provide the heat required in situ. Heat is also obtained by the hot syngas and the combustion chamber, then it is consumed wherever required.

2.2.4. Model Convergence

In fact, the convergence of the developed simulation model in Aspen Plus has been analyzed for mass and energy balances of each unit blocks. In the process simulation, it is necessary to set up the tearing flow, convergence method, convergence module, and convergence order. These can be determined automatically by Aspen Plus or set by the user. Checkup of convergence is important especially for the pyrolysis yield. It should give a closed mass balance; 100% of biomass should be converted in output products from the pyrolysis. It is achieved as a result of the correlations followed by the char mass yield calculation by difference. In the simulation options of Aspen Plus, the mass balance error around blocks was checked and its tolerance set at 0.0001. For energy balance, the error tolerance (in the Flash convergence menu) was set at 10−7. The Newton method was chosen as the convergence options method.

2.3. Environmental Impact Assessment

Generally, an impact assessment is categorized based on the following stages: classification, characterization, normalization, and weighting. In classification, items extracted from the analysis are gathered along with their impact categories. In characterization, the items are divided into impact categories, and the impact for each one is quantified. In normalization, the environmental impact of each indicator is divided by the minimum or maximum or total environmental impact of a specific period. Lastly, for weighting, the relative advantage among the impact categories is identified [67]. In this subject, the classification and characterization stages are essential components, based on IPCC 2007 and other research in this field [41,68], while the normalization and weighting steps can be applied as optional components. Currently, as normalization and weighting factors customized for biomasses are not yet developed, this study evaluated up to the characterization and normalization stages. Environmental problems arising from this are global warming, eutrophication, and acidification. Therefore, as shown in Table 3, based on the reference material and impact index of the three environmental impact categories of global warming potential (GWP), acidification potential (AP), and eutrophication potential (EP), the characterization values for each environmental impact of converting biomass to power were determined.
Global warming is a phenomenon that increases the Earth’s average surface temperature. Primarily, greenhouse gases (GHGs) are atmospheric gas compounds (CO2, CH4, and NO2) that trap heat through emitting radiation in the atmosphere, then the rise in the amount of these gases results in keeping the surface of the Earth warmer by the absorption of sunlight that passes through the atmosphere freely [69]. The standard substance for GWP is CO2. Global warming causes changes in the terrestrial and aquatic ecosystems and in coastlines due to rising sea levels. The category indicator of GWP is expressed by Equation (1) [67,70]:
G W P = L o a d ( i ) × G W P ( i )
where Load(i) is the experimental load of the global warming inventory item (i), and GWP(i) is the characterization factor of global warming inventory item (i).
Acidification is an environmental problem caused by acidified rivers/streams and soil due to anthropogenic air pollutants such as SO2, NH3, H2SO4, H2S, HCL, SO3, and NOx. Acidification increases the mobilization and leaching behavior of heavy metals in soil and exerts adverse impacts on aquatic and terrestrial animals and plants by disturbing the food web. The standard substance for assessing AP is SO2. The category indicator of AP is expressed by Equation (2) [67,71]:
A P = L o a d ( i ) × A P ( i )
where Load(i) is the experimental load of the acidification inventory item (i) and AP(i) is the characterization factor of inventory item (i) of the acidification category.
Eutrophication is a phenomenon in which inland waters are heavily loaded with excess nutrients due to chemical fertilizers or discharged wastewater, triggering rapid algal grow and red tides. The standard substance for EP is NO3. The major substances with impacts on eutrophication were found to be NOx, NH3, N2, and NO3 in the case of air [71]. The category indicator of EP is expressed by Equation (3):
E P = L o a d ( i ) × E P ( i )
where Load(i) is the experimental load of the acidification inventory item (i), and EP(i) is the characterization factor of inventory item (i) of the acidification category.
In this work, normalization is used to have a single environmental impact. For the NEI, the environmental impact of each indicator is divided by the minimum impact value (Equation (4)):
N E I = G W P ( i ) G W P ( min ) + A P ( i ) A P ( min ) + E P ( i ) E P ( min )

3. Results and Discussion

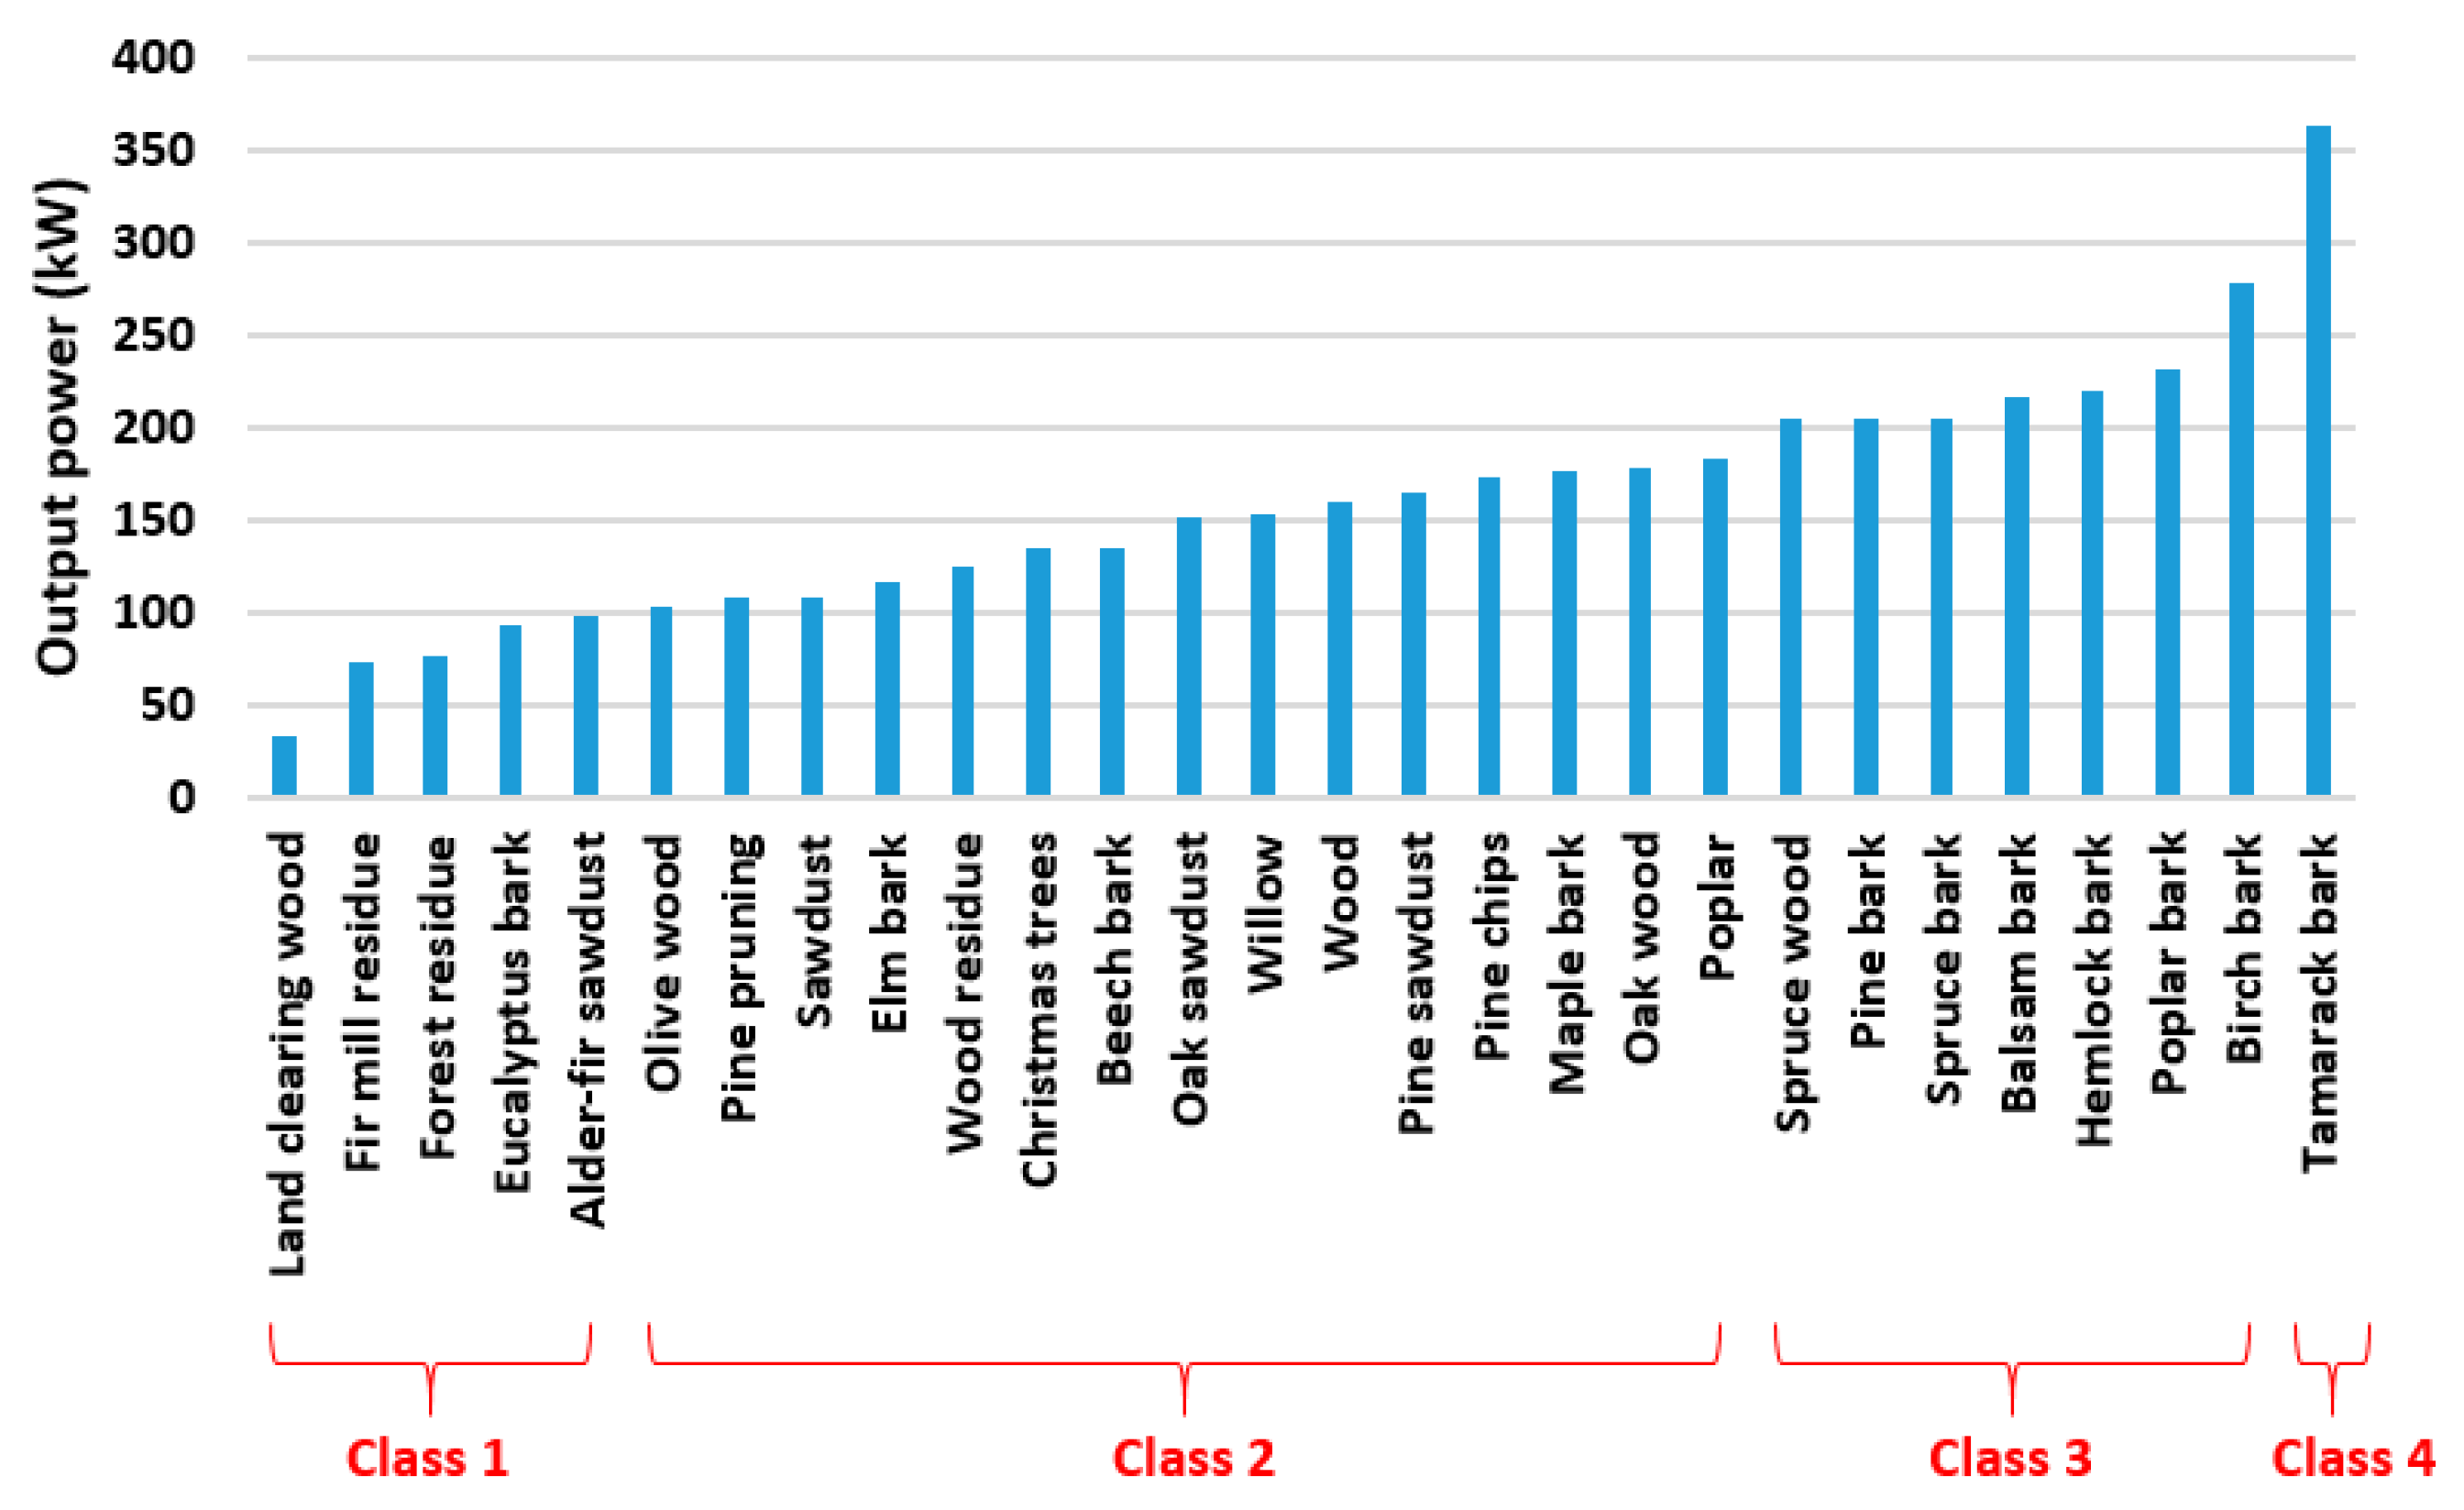
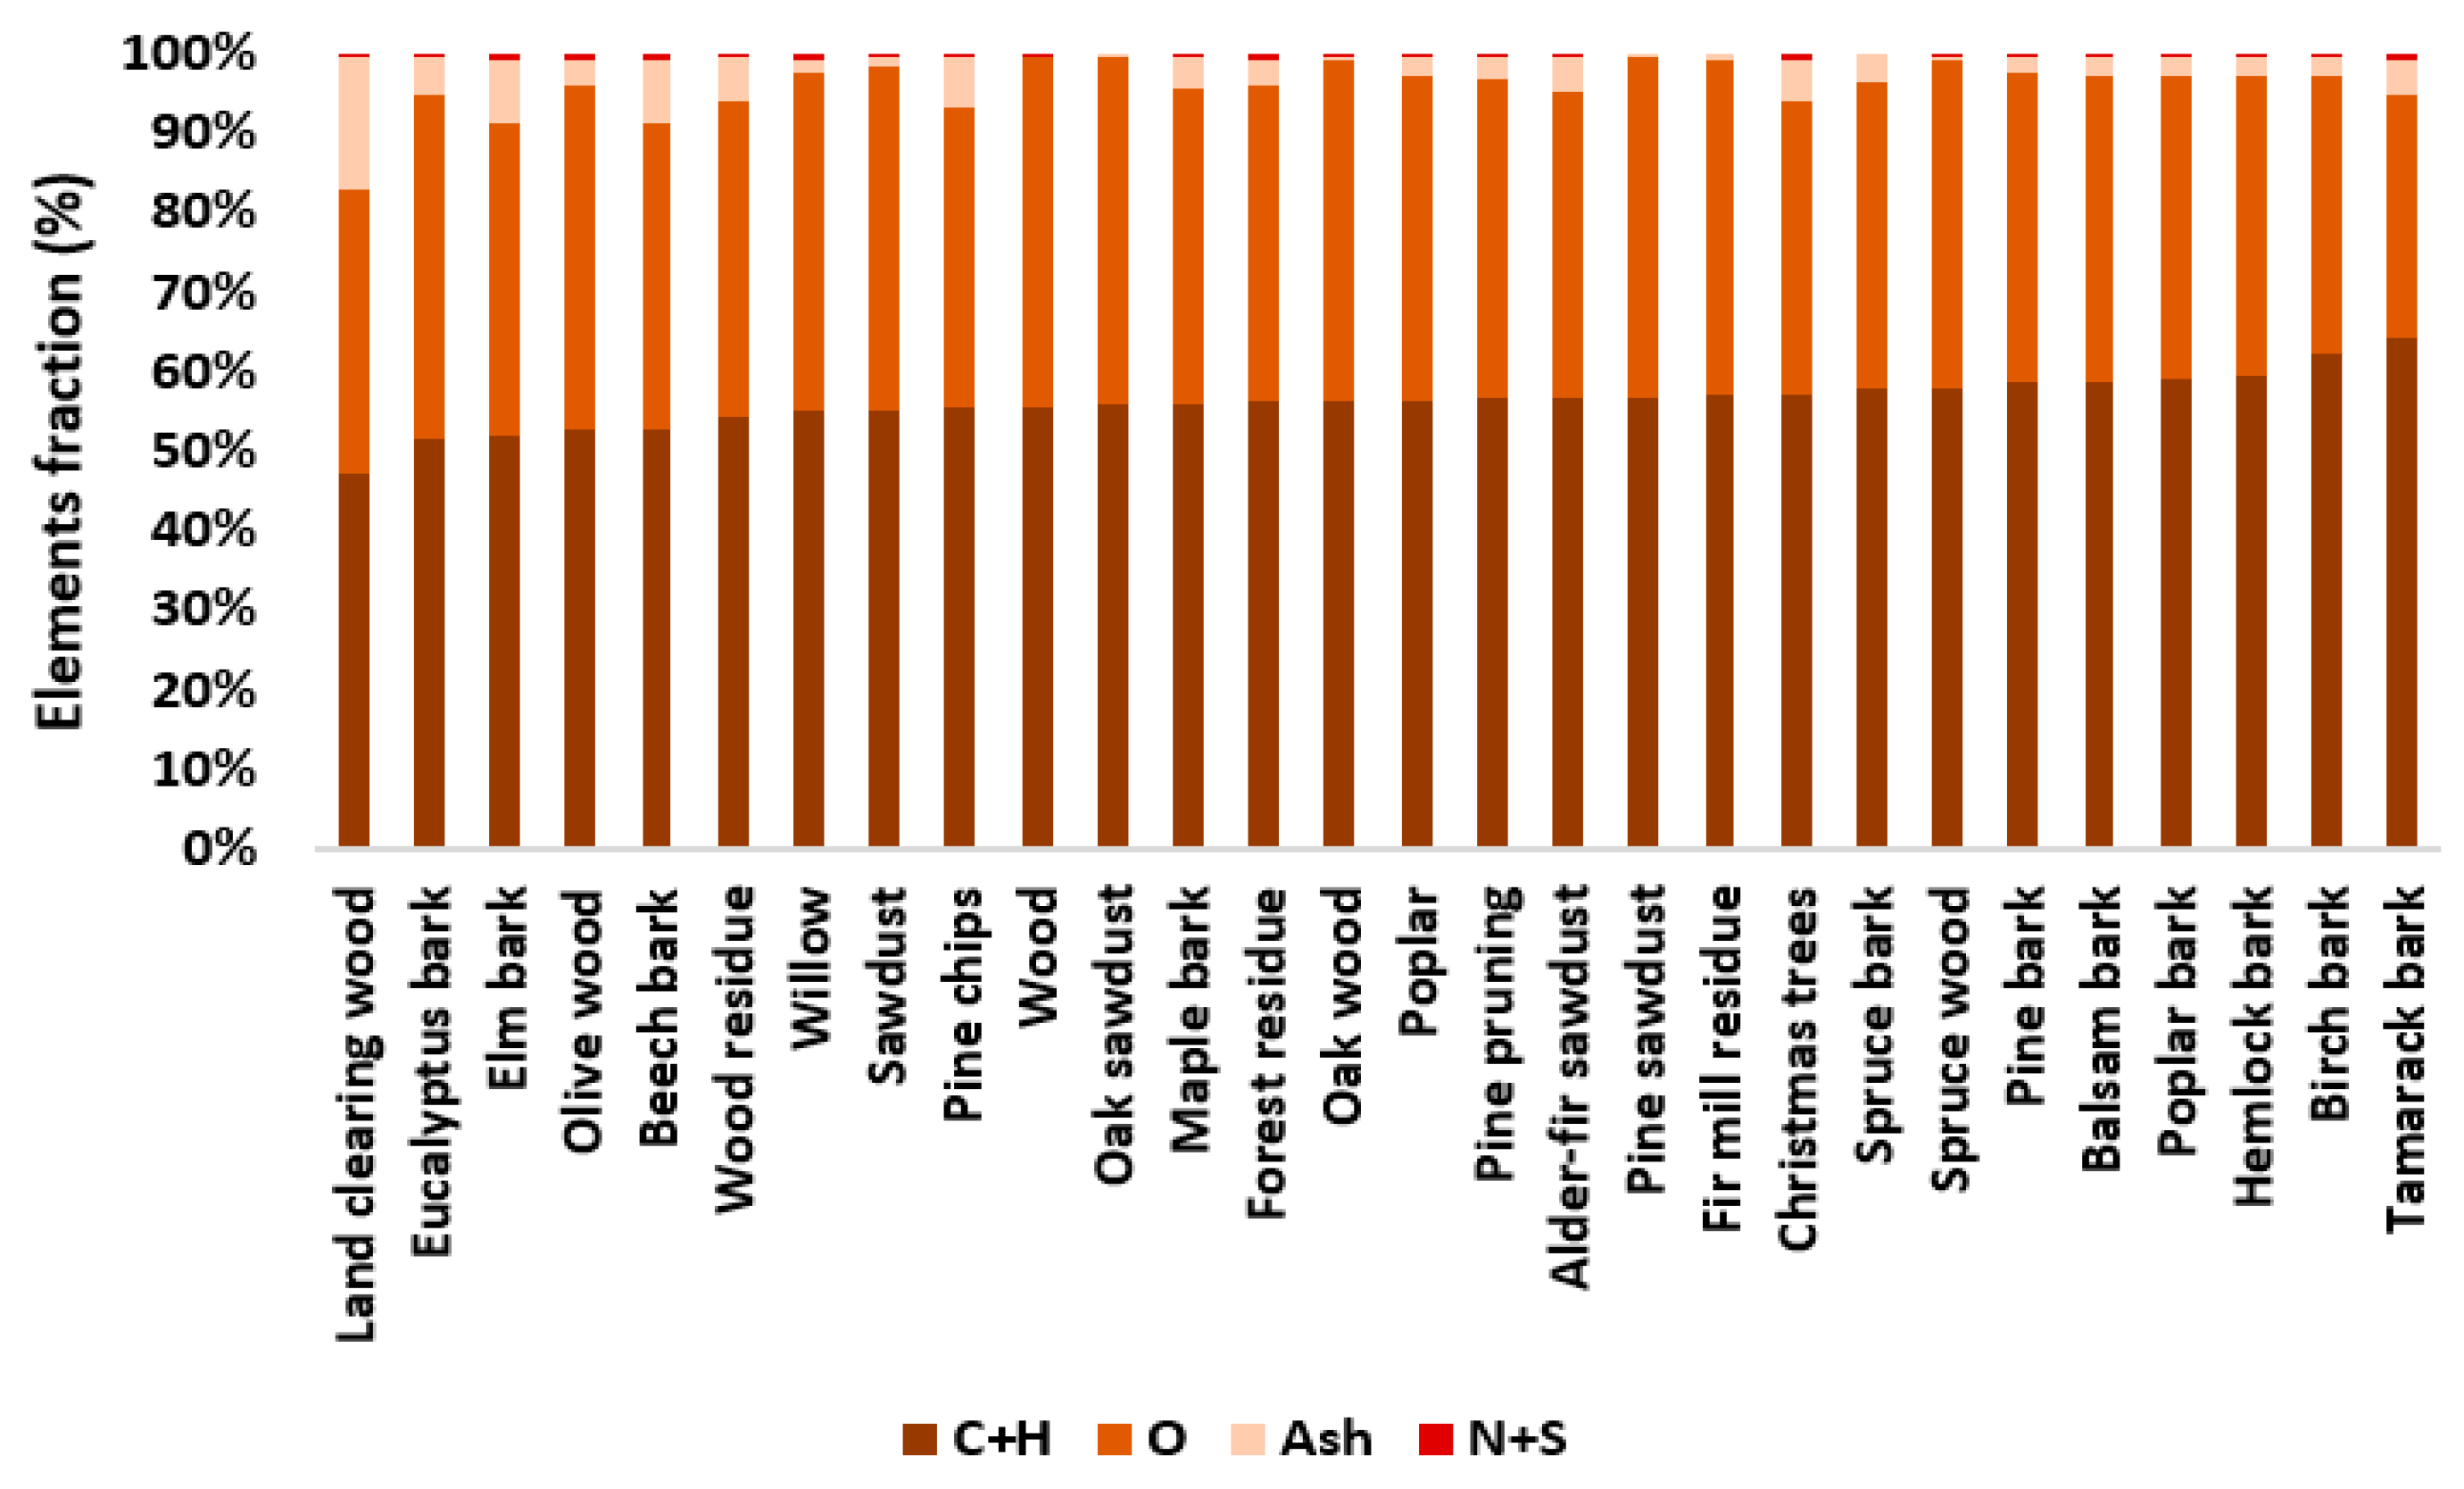
3.1. Performance Analysis

The results for the simulation model of the 28 WB&FR alternatives have been ranked regarding their contribution to output net power ( W n e t = W g a s   t u r b i n e W c o m p r e s s o r ) in Figure 3. All cases rely on a functional unit of 1 ton/h for each biomass fuel under atmospheric pressure, a gasifier temperature of 900 °C, and an air-to-fuel mass flow rate of 2. This ordering is based on a net power in the interval of 0 to 400 kW per feedstock ton, values highlighting the lowest and highest efficient options, respectively. Class 1 includes five woody biomass gasification systems containing land clearing wood, fir mill residue, forest residue, eucalyptus bark, and alder-fir sawdust, which generate the minimum amounts of output net power (their values are in the span of 0 to 100 kW per one ton of feedstock). Many of the studied WB&FR gasification plants are located in class 2, whose output power is in the range of 100 to 200 kW/ton. Class 3 includes seven WB&FR gasification systems based on spruce wood, pine bark, spruce bark, balsam bark, hemlock bark, poplar bark, and birch bark, which produce a relatively higher net power.
Apparently, the gasification technology derived by tamarack bark remarkably outranks all other systems in regard to the aspect of power, with a production of 363 kW/ton, owing to the favorable results obtained in the performance analysis. This could be because tamarack bark has the highest percentage of carbon and hydrogen (Figure 4). The percentage shares depicted in Figure 4 are contributions of carbon and hydrogen, oxygen, ash and nitrogen, and sulfur in the elemental analysis of each biomass feedstock.
Carbon and hydrogen are critical components in each input biomass. Thus, the higher the C and H2 content, the more carbon monoxide and hydrogen will be in the syngas, which leads to the growth of the heating value (LHV) of syngas. In fact, based on Equation (5) [72,73], the LHV of the gas product from the gasifier is strongly dependent on the mole fraction of carbon monoxide, hydrogen, and methane in the syngas. CO and H2 are combustible substances that are converted to flue gas (mainly CO2 and H2O) through the combustion chamber. Therefore, improving the LHV of syngas leads to gases at high temperatures entering the gas turbine. Raising the turbine inlet temperature ameliorates the output power from that, and also more net power will result.
L H V s y n g a s ( kJ Nm 3 ) = 4.2 × ( 30 × y C O + 25.7 × y H 2 + 85.4 × y C H 4 )
where y is the mole fraction of gas pieces in the syngas (dry basis).

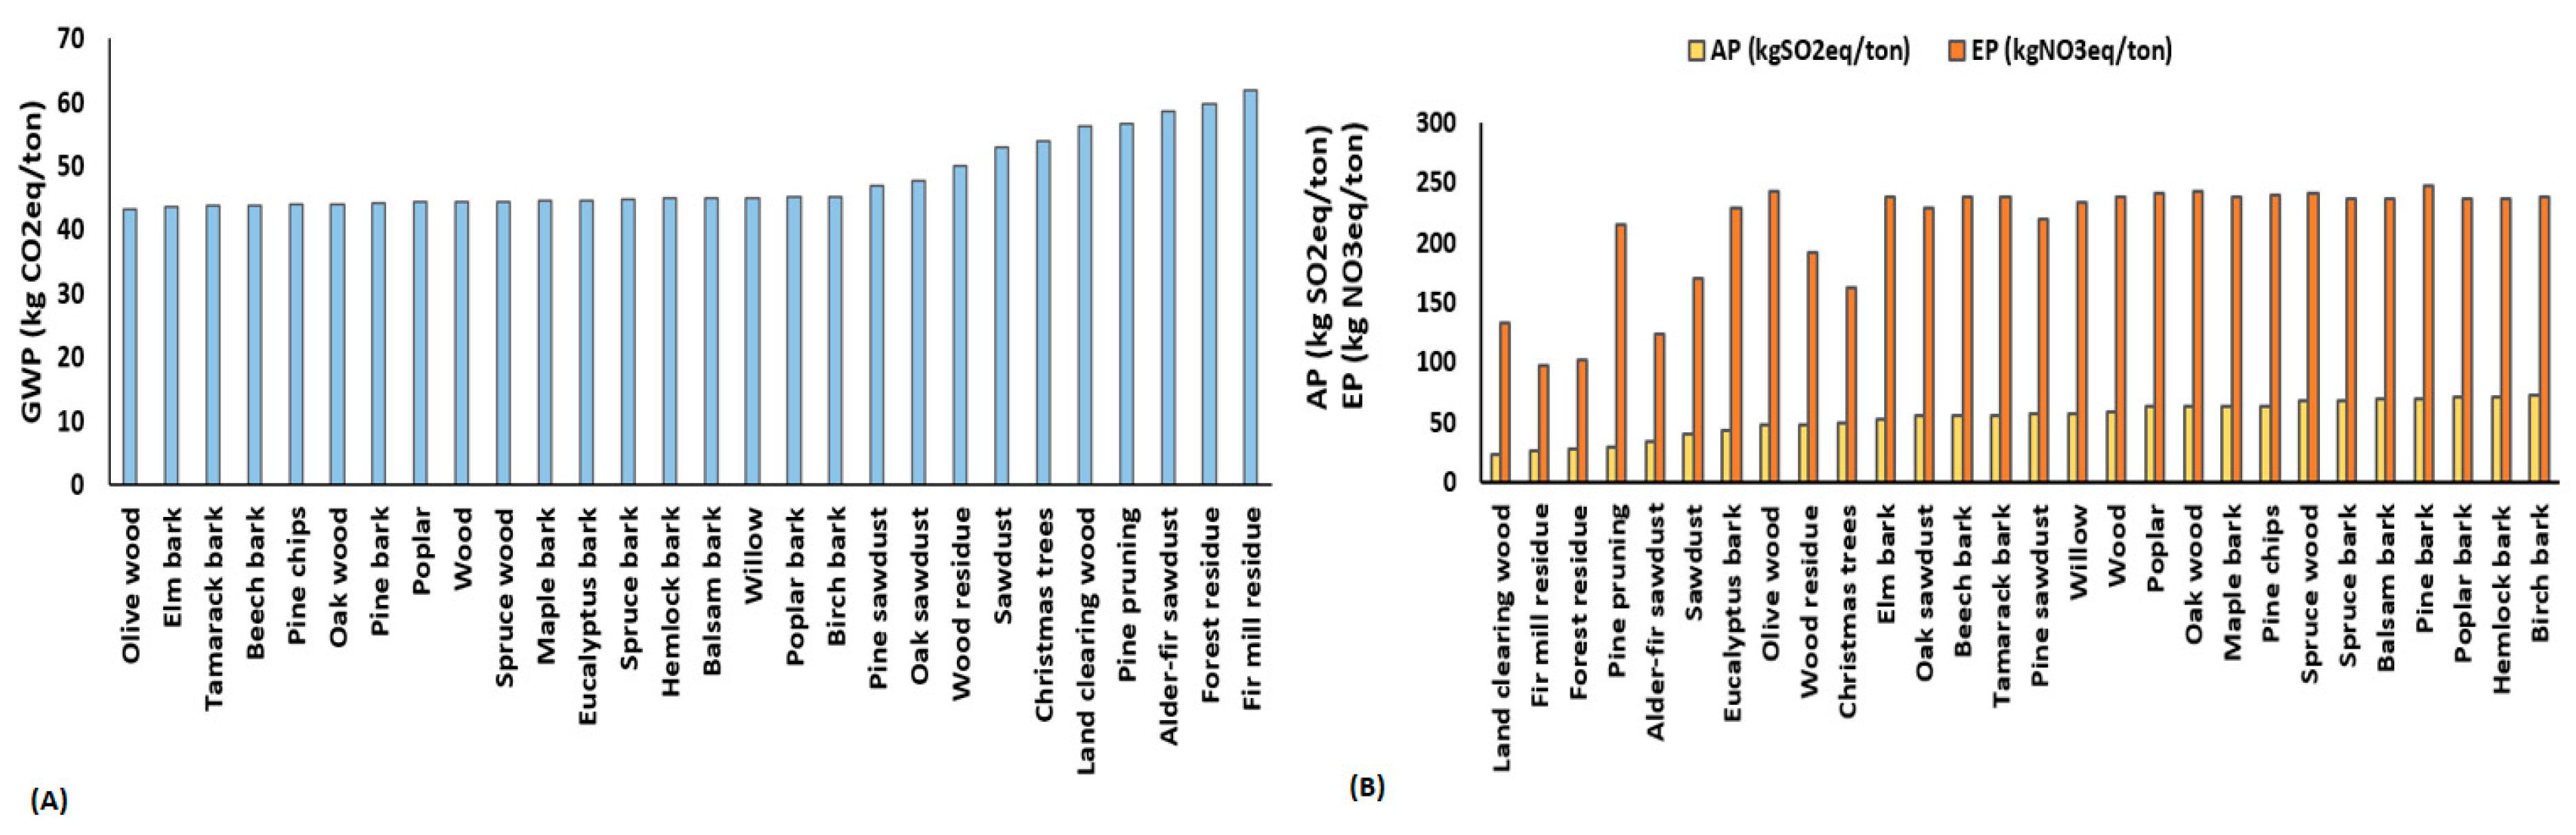
3.2. Environmental Impact Assessment

The environmental impact of the biomass gasification combined with the power generation unit is investigated relying on three categories of global warming, acidification, and eutrophication potentials. This analysis is carried out based on a functional unit of one ton for each input feedstock and under the optimum operating conditions.
The GWP values for the gasification systems derived by 28 WB&FR are ranked and compared in Figure 5a. Regarding this impact category, the production of electricity from WB&FR releases greenhouse gasses in the interval of 43 to 62 kgCO2eq per ton, in which 75 and 50% of systems have a GWP lower than 50 and 45 kgCO2eq/ton, respectively. The major share of GWP for all feedstocks is due to the transport level through the use of diesel fuel followed by drying, cutting, and handling in the pre-process stage. Of the process chain, the second conversion containing the combustion chamber and gas turbine makes up the smallest contribution of GHG emissions since while the biomass is burnt, carbon dioxide releases to the atmosphere, but this biogenic CO2 is not considered as a contributor to global warming.
Moreover, the values of the AP and EP indicators for the various WB&FR gasification systems are shown in Figure 5b. Regarding the AP index, the generation of power by the gasification of one ton of wood or forestry material creates acidic gasses in the range of 23 to 74 kgSO2eq per ton of raw feedstock, where in 32% of the alternatives present, the great statues regarding the impact category of AP have a release of less than 50 kgSO2eq/ton. In fact, the emissions of acidic gases through the combustion process in the second conversion stage account for a main share of the impact, leaving a relatively smaller quota to the other steps.
As seen in Figure 5b, on a per-ton-of-raw-feedstock basis, the power production by applying WB&FR gasification systems releases eutrophic gasses between 97 and 247 kgNO3eq, in which only 25% of the systems have an EP less than 200 kgNO3eq/ton. The significant effective factor in this indicator could be the emissions of particulate matter, N2, NO, NO3, and NH3, from the combustion step, whereas the other stages, such as preparation, transport, and gasification, make relatively minor contributions.
As shown in Figure 5, the gasification systems fed by land clearing wood, fir mill residue, forest residue, pine pruning, and alder-fir sawdust have the lowest amount of AP and EP in comparison with other biomass feedstocks. However, the highest values of GHG emissions belong to theses feedstocks. This can be because these biomasses have the lowest amount of or even zero sulfur and nitrogen (based on Table 2), which leads to a lower emission of acidic and eutrophic gasses. Nevertheless, these feedstocks have the highest moisture content (their moisture content is in the range of 47 to 63%), so they require much more energy for drying, leading to higher GHG emissions released into the atmosphere.
In this part, to have a more accurate comparison of the various feedstocks, the functional unit has been changed to 1 kWh electricity production, and the environmental impacts are assessed based on this function for the 28 considered gasification systems. In addition, to have three environmental impact categories all together, the NEI is developed as a single indicator for environmental evaluation. The model results for the 28 alternatives, ranked according to their contribution to NEI based on 1 kWh power production, are shown in Figure 6. This ordering is based on an NEI that it is between the interval of 3 to 69, values highlighting the highest and lowest environmental options, respectively. As shown in Figure 6, the power generation systems derived from tamarack bark and birch bark, with an NEI lower than 5, significantly outrank all the other systems in terms of NIE, owing to the favorable results obtained in the environmental sector. These results for tamarack bark and birch bark are due to the fact that these kinds of biomasses contain high levels of carbon and hydrogen (based on Table 2), which leads to high power generation. Moreover, they contain a low amount of moisture content, which requires lower energy for drying in the pre-process stage, leading to only slight pollutant gas emissions released into the atmosphere. Overall, 75% of WB&FR are beneficial from an energy and environmental perspective by having an NEI less than 10.
As mentioned above, the element percentage of carbon and hydrogen are the main factors affecting the power production and environmental evaluation. The variation of NEI versus the element percentage of C and H in dry basis and its exponential trend line is presented in Figure 7. Obviously, by increasing C and H in the biomass, a higher amount of power can be produced, and also lower values of pollutant gases are created. As shown in Figure 7, the exponential curve with an R-square of 0.92 indicates a fairly good fit for woody biomasses and forestry residues data (Equation (6)):
N E I = 6740 . 5   exp   ( -   0 . 12 x ) R 2 = 0.92
where x is the weight fraction of C and H2 in dry basis. By employing Equation (6), it would be easy to confidently assess the overall environmental impact of the WB&FR gasification systems integrated with power generation units.

4. Conclusions

In this study, a gasification simulation model was established containing a series of submodules that model the individual steps through the gasification of biomass (drying, pyrolysis, combustion, and gasification) integrated with a power generation plant as a post-process system. The developed model is based on thermodynamic equilibrium calculations and was applied to 28 WB&FR.
The developed model is a useful tool for the prediction of several outputs, such as net power in a wide range of operating conditions and for different types of biomass fuels with a defined ultimate composition and proximate analysis. This simulation model is able to direct the preliminary calculations, design, and operation of biomass gasifiers. Moreover, the obtained results offer that to design policies to encourage the use of woody wastes and forestry residues for energy production may appeal to decision-makers with a diverse range of economic, environmental, and energy preferences. Finally, this type of research can provide arguments to support decisions tending toward a more structured and strategic approach in implementing sustainable energy policies.
The simulation model results for the 28 WB&FR alternatives show that the net power generated from 1 ton/h of input feedstock to the system is in the range of 0 to 400 kW/ton, and, among them, the gasification system derived by tamarack bark biomass significantly outranks all the other systems by generating 363 kW/ton—favorable results were achieved in the performance analysis.
The generation of electricity from WB&FR gasification integrated with a power unit appears to be environmentally friendly for 75% of the studied systems (confirmed by NEI less than 10). In fact, woody biomass gasification technology has a minor level of exhaust emissions of air pollutants, and most of the carbon is retained in the ash. Moreover, the power generation systems fed by tamarack bark and birch bark, with an NEI lower than 5, significantly outrank all the other systems, owing to the favorable results obtained in the environmental sector.
It was also found that the element percentages of carbon and hydrogen have a major effect on the power generation and environmental evaluation. Actually, by increasing C and H in the biomass, a higher amount of electricity along with lower values of pollutant gases could be produced. Finally, an exponential curve with an R-square of 0.92 has been extracted, indicating a fairly good fit for WB&FR data. By employing this curve, it would be easy to confidently assess the overall environmental impact of WB&FR gasification systems for preliminary calculations.

Author Contributions

S.S.: Conceptualization, Methodology, Validation, Formal analysis, Investigation, Resources, Writing of original draft, review & editing. S.M.E.S.: Conceptualization & Formal analysis, Investigation. R.U.: Supervision, review & editing. C.R.: Software & Supervision. All authors have read and agreed to the published version of the manuscript.

Funding

This research received no external funding.

Acknowledgments

This paper was a part of the project funded by Icelandic Research Fund (IRF), (in Icelandic: Rannsoknasjodur) and the grant number is 196458-051.

Conflicts of Interest

The authors declare no conflict of interest.

References

  1. Rajaeifar, M.A.; Akram, A.; Ghobadian, B.; Rafiee, S.; Heijungs, R.; Tabatabaei, M. Environmental impact assessment of olive pomace oil biodiesel production and consumption: A comparative lifecycle assessment. Energy 2016, 106, 87–102. [Google Scholar] [CrossRef]
  2. Talebnia, F.; Karakashev, D.B.; Angelidaki, I. Production of bioethanol from wheat straw: An overview on pretreatment, hydrolysis and fermentation. Bioresour. Technol. 2010, 101, 4744–4753. [Google Scholar] [CrossRef]
  3. Safarian, S.; Unnthorsson, R.; Richter, C. Techno-Economic Analysis of Power Production by Using Waste Biomass Gasification. J. Power Energy Eng. 2020, 8, 1–8. [Google Scholar] [CrossRef]
  4. Puig-Arnavat, M.; Hernández, J.A.; Bruno, J.C.; Coronas, A. Artificial neural network models for biomass gasification in fluidized bed gasifiers. Biomass- Bioenergy 2013, 49, 279–289. [Google Scholar] [CrossRef]
  5. Speirs, J.; McGlade, C.; Slade, R. Uncertainty in the availability of natural resources: Fossil fuels, critical metals and biomass. Energy Policy 2015, 87, 654–664. [Google Scholar] [CrossRef] [Green Version]
  6. Xie, J.; Zhong, W.; Jin, B.; Shao, Y.; Liu, H. Simulation on gasification of forestry residues in fluidized beds by Eulerian–Lagrangian approach. Bioresour. Technol. 2012, 121, 36–46. [Google Scholar] [CrossRef] [Green Version]
  7. Nasir, V.; Cool, J. A review on wood machining: Characterization, optimization, and monitoring of the sawing process. Wood Mater. Sci. Eng. 2020, 15, 1–16. [Google Scholar] [CrossRef]
  8. Nasir, V.; Nourian, S.; Avramidis, S.; Cool, J. Classification of thermally treated wood using machine learning techniques. WWood Sci. Technol. 2019, 53, 275–288. [Google Scholar] [CrossRef]
  9. Nasir, V.; Nourian, S.; Avramidis, S.; Cool, J. Prediction of physical and mechanical properties of thermally modified wood based on color change evaluated by means of “group method of data handling”(GMDH) neural network. Holzforschung 2019, 73, 381–392. [Google Scholar] [CrossRef]
  10. Lauri, P.; Havlík, P.; Kindermann, G.; Forsell, N.; Böttcher, H.; Obersteiner, M. Woody biomass energy potential in 2050. Energy Policy 2014, 66, 19–31. [Google Scholar] [CrossRef]
  11. IEA. International Energy Association (IEA) Database; 2013; Available online: http://www.iea.org/ (accessed on 10 April 2021).
  12. Safarian, S.; Unnthorsson, R.; Richter, C. Hydrogen production via biomass gasification: Simulation and performance analysis under different gasifying agents. Biofuels 2021, 2021, 1–10. [Google Scholar] [CrossRef]
  13. Safarian, S.; Unnthorsson, R.; Richter, C. Techno-economic and environmental assessment of power supply chain by using waste biomass gasification in Iceland. Biophys. Econ. Sustain. 2020, 5, 1–13. [Google Scholar] [CrossRef]
  14. Burra, K.; Gupta, A. Synergistic effects in steam gasification of combined biomass and plastic waste mixtures. Appl. Energy 2018, 211, 230–236. [Google Scholar] [CrossRef]
  15. Sripada, P.P.; Xu, T.; Kibria, M.; Bhattacharya, S. Comparison of entrained flow gasification behaviour of Victorian brown coal and biomass. Fuel 2017, 203, 942–953. [Google Scholar] [CrossRef]
  16. Mahishi, M.; Goswami, D. An experimental study of hydrogen production by gasification of biomass in the presence of a CO2 sorbent. Int. J. Hydrogen Energy 2007, 32, 2803–2808. [Google Scholar] [CrossRef]
  17. Li, Y.-H.; Chen, H.-H. Analysis of syngas production rate in empty fruit bunch steam gasification with varying control factors. Int. J. Hydrog. Energy 2018, 43, 667–675. [Google Scholar] [CrossRef]
  18. Wang, Z.; Burra, K.G.; Zhang, M.; Li, X.; He, X.; Lei, T.; Gupta, A.K. Syngas evolution and energy efficiency in CO2-assisted gasification of pine bark. Appl. Energy 2020, 269, 114996. [Google Scholar] [CrossRef]
  19. Eikeland, M.S.; Thapa, R.K.; Halvorsen, B.M. Aspen plus simulation of biomass gasification with known reaction kinetic. In Proceedings of the 56th Conference on Simulation and Modelling (SIMS 56), Linköping University, Linköping, Sweden, 7–9 October 2015. [Google Scholar]
  20. Fernandez-Lopez, M.; Pedroche, J.; Valverde, J.; Sanchez-Silva, L. Simulation of the gasification of animal wastes in a dual gasifier using Aspen Plus®. Energy Convers. Manag. 2017, 140, 211–217. [Google Scholar] [CrossRef]
  21. Gagliano, A.; Nocera, F.; Bruno, M.; Cardillo, G. Development of an equilibrium-based model of gasification of biomass by Aspen Plus. Energy Procedia 2017, 111, 1010–1019. [Google Scholar] [CrossRef]
  22. Han, J.; Liang, Y.; Hu, J.; Qin, L.; Street, J.; Lu, Y.; Yu, F. Modeling downdraft biomass gasification process by restricting chemical reaction equilibrium with Aspen Plus. Energy Convers. Manag. 2017, 153, 641–648. [Google Scholar] [CrossRef]
  23. Hantoko, D.; Yan, M.; Prabowo, B.; Susanto, H.; Li, X.; Chen, C. Aspen Plus modeling approach in solid waste gasification. In Current Developments in Biotechnology and Bioengineering; Elsevier: Amsterdam, The Netherlands, 2019; pp. 259–281. [Google Scholar]
  24. Kaushal, P.; Tyagi, R. Advanced simulation of biomass gasification in a fluidized bed reactor using ASPEN PLUS. Renew. Energy 2017, 101, 629–636. [Google Scholar] [CrossRef]
  25. Liu, R.; Graebner, M.; Tsiava, R.; Zhang, T.; Xu, S. Simulation analysis of the system integrating oxy-fuel combustion and char gasification. J. Energy Resour. Technol. 2021, 143, 1–12. [Google Scholar] [CrossRef]
  26. Moshi, R.E.; Jande, Y.A.C.; Kivevele, T.T.; Kim, W.S. Simulation and performance analysis of municipal solid waste gasification in a novel hybrid fixed bed gasifier using Aspen plus. Energy Sources Part A Recover. Util. Environ. Eff. 2020, 2020, 1–13. [Google Scholar]
  27. Porcu, A.; Sollai, S.; Marotto, D.; Mureddu, M.; Ferrara, F.; Pettinau, A. Techno-Economic Analysis of a Small-Scale Biomass-to-Energy BFB Gasification-Based System. Energies 2019, 12, 494. [Google Scholar] [CrossRef] [Green Version]
  28. Samadi, S.H.; Ghobadian, B.; Nosrati, M. Prediction and estimation of biomass energy from agricultural residues using air gasification technology in Iran. Renew. Energy 2020, 149, 1077–1091. [Google Scholar] [CrossRef]
  29. Li, X.; Grace, J.; Watkinson, A.; Lim, C.; Ergüdenler, A. Equilibrium modeling of gasification: A free energy minimization approach and its application to a circulating fluidized bed coal gasifier. Fuel 2001, 80, 195–207. [Google Scholar] [CrossRef]
  30. Zainal, Z.; Ali, R.; Lean, C.; Seetharamu, K. Prediction of performance of a downdraft gasifier using equilibrium modeling for different biomass materials. Energy Convers. Manag. 2001, 42, 1499–1515. [Google Scholar] [CrossRef]
  31. Ramanan, M.V.; Lakshmanan, E.; Sethumadhavan, R.; Renganarayanan, S. Modeling and experimental validation of cashew nut shell char gasification adopting chemical equilibrium approach. Energy Fuels 2008, 22, 2070–2078. [Google Scholar] [CrossRef]
  32. Dhanavath, K.N.; Shah, K.; Bhargava, S.K.; Bankupalli, S.; Parthasarathy, R. Oxygen–steam gasification of karanja press seed cake: Fixed bed experiments, ASPEN Plus process model development and benchmarking with saw dust, rice husk and sunflower husk. J. Environ. Chem. Eng. 2018, 6, 3061–3069. [Google Scholar] [CrossRef]
  33. Haugen, H.H.; Halvorsen, B.M.; Eikeland, M.S. Simulation of gasification of livestock manure with Aspen Plus. In Proceedings of the 56th Conference on Simulation and Modelling (SIMS 56), Linköping University, Linköping, Sweden, 7–9 October 2015. [Google Scholar]
  34. Villarini, M.; Marcantonio, V.; Colantoni, A.; Bocci, E. Sensitivity analysis of different parameters on the performance of a CHP internal combustion engine system fed by a biomass waste gasifier. Energies 2019, 12, 688. [Google Scholar] [CrossRef] [Green Version]
  35. Monir, M.U.; Aziz, A.A.; Kristanti, R.A.; Yousuf, A. Co-gasification of empty fruit bunch in a downdraft reactor: A pilot scale approach. Bioresour. Technol. Rep. 2018, 1, 39–49. [Google Scholar] [CrossRef]
  36. Ramzan, N.; Ashraf, A.; Naveed, S.; Malik, A. Simulation of hybrid biomass gasification using Aspen plus: A comparative performance analysis for food, municipal solid and poultry waste. Biomass Bioenergy 2011, 35, 3962–3969. [Google Scholar] [CrossRef]
  37. Shahabuddin, M.; Bhattacharya, S. Effect of reactant types (steam, CO2 and steam+ CO2) on the gasification performance of coal using entrained flow gasifier. Int. J. Energy Res. 2021. [Google Scholar] [CrossRef]
  38. Pilar González-Vázquez, M.; Rubiera, F.; Pevida, C.; Pio, D.T.; Tarelho, L.A. Thermodynamic Analysis of Biomass Gasification Using Aspen Plus: Comparison of Stoichiometric and Non-Stoichiometric Models. Energies 2021, 14, 189. [Google Scholar] [CrossRef]
  39. Safarianbana, S.; Unnthorsson, R.; Richter, C. Development of a new stoichiometric equilibrium-based model for wood chips and mixed paper wastes gasification by ASPEN Plus. In Conference Development of a New Stoichiometric Equilibrium-Based Model for Wood Chips and Mixed Paper Wastes Gasification by ASPEN Plus; American Society of Mechanical Engineers: New York, NY, USA, 2019; Volume 59438, p. V006T06A2. [Google Scholar]
  40. Safarian, S.; Bararzadeh, M. Exergy analysis of high-performance cycles for gas turbine with air-bottoming. J. Mech. Eng. Res. 2012, 5, 38–49. [Google Scholar]
  41. Nguyen, T.L.T.; Hermansen, J.E.; Nielsen, R.G. Environmental assessment of gasification technology for biomass conversion to energy in comparison with other alternatives: The case of wheat straw. J. Clean. Prod. 2013, 53, 138–148. [Google Scholar] [CrossRef]
  42. Safarian, S.; Unnthorsson, R.; Richter, C. Performance analysis of power generation by wood and woody biomass gasification in a downdraft gasifier. Int. J. Appl. Power Eng. 2021, 10, 80–88. [Google Scholar]
  43. Safarian, S.; Unnthorsson, R.; Richter, C. Simulation of small-scale waste biomass gasification integrated power production: A comparative performance analysis for timber and wood waste. Int. J. Appl. Power Eng. 2020, 9, 147–152. [Google Scholar] [CrossRef]
  44. Vassilev, S.V.; Baxter, D.; Andersen, L.K.; Vassileva, C.G. An overview of the chemical composition of biomass. Fuel 2010, 89, 913–933. [Google Scholar] [CrossRef]
  45. Miles, T.J.; Baxter, L.; Bryers, R.; Jenkins, B.; Oden, L. Alkali Deposits Found in Biomass Power Plants: A Preliminary Investigation of Their Extent and Nature. 1995. Available online: https://www.nrel.gov/docs/legosti/fy96/8142v1.pdf (accessed on 10 April 2021).
  46. Bryers, R.W. Fireside slagging, fouling, and high-temperature corrosion of heat-transfer surface due to impurities in steam-raising fuels. Prog. Energy Combust. Sci. 1996, 22, 29–120. [Google Scholar] [CrossRef]
  47. Theis, M.; Skrifvars, B.-J.; Hupa, M.; Tran, H. Fouling tendency of ash resulting from burning mixtures of biofuels. Part 1: Deposition rates. Fuel 2006, 85, 1125–1130. [Google Scholar] [CrossRef]
  48. Theis, M.; Skrifvars, B.-J.; Zevenhoven, M.; Hupa, M.; Tran, H. Fouling tendency of ash resulting from burning mixtures of biofuels. Part 2: Deposit chemistry. Fuel 2006, 85, 1992–2001. [Google Scholar] [CrossRef]
  49. Zevenhoven-Onderwater, M.; Backman, R.; Skrifvars, B.-J.; Hupa, M. The ash chemistry in fluidised bed gasification of biomass fuels. Part I: Predicting the chemistry of melting ashes and ash–bed material interaction. Fuel 2001, 80, 1489–1502. [Google Scholar] [CrossRef]
  50. Zevenhoven-Onderwater, M.; Blomquist, J.-P.; Skrifvars, B.-J.; Backman, R.; Hupa, M. The prediction of behaviour of ashes from five different solid fuels in fluidised bed combustion. Fuel 2000, 79, 1353–1361. [Google Scholar] [CrossRef]
  51. Demirbas, A. Combustion characteristics of different biomass fuels. Prog. Energy Combust. Sci. 2004, 30, 219–230. [Google Scholar] [CrossRef]
  52. Vamvuka, D.; Zografos, D. Predicting the behaviour of ash from agricultural wastes during combustion. Fuel 2004, 83, 2051–2057. [Google Scholar] [CrossRef]
  53. Vamvuka, D.; Zografos, D.; Alevizos, G. Control methods for mitigating biomass ash-related problems in fluidized beds. Bioresour. Technol. 2008, 99, 3534–3544. [Google Scholar] [CrossRef]
  54. Moilanen, A. Thermogravimetric Characterisations of Biomass and Waste for Gasification Processes; VTT: Espoo, Finland, 2006. [Google Scholar]
  55. Masiá, A.T.; Buhre, B.; Gupta, R.; Wall, T. Characterising ash of biomass and waste. Fuel Process. Technol. 2007, 88, 1071–1081. [Google Scholar] [CrossRef]
  56. Lapuerta, M.; Hernández, J.J.; Pazo, A.; López, J. Gasification and co-gasification of biomass wastes: Effect of the biomass origin and the gasifier operating conditions. Fuel Process. Technol. 2008, 89, 828–837. [Google Scholar] [CrossRef]
  57. Tillman, D.A. Biomass cofiring: The technology, the experience, the combustion consequences. Biomass Bioenergy 2000, 19, 365–384. [Google Scholar] [CrossRef]
  58. Demirbas, A. Potential applications of renewable energy sources, biomass combustion problems in boiler power systems and combustion related environmental issues. Prog. Energy Combust. Sci. 2005, 31, 171–192. [Google Scholar] [CrossRef]
  59. Wei, X.; Schnell, U.; Hein, K.R. Behaviour of gaseous chlorine and alkali metals during biomass thermal utilisation. Fuel 2005, 84, 841–848. [Google Scholar] [CrossRef] [Green Version]
  60. Safarian, S.; Ebrahimi Saryazdi, S.M.; Unnthorsson, R.; Richter, C. Artificial neural network integrated with thermodynamic equilibrium modeling of downdraft biomass gasification-power production plant. Energy 2020, 213, 118800. [Google Scholar] [CrossRef]
  61. Safarian, S.; Ebrahimi Saryazdi, S.M.; Unnthorsson, R.; Richter, C. Artificial Neural Network Modeling of Bioethanol Production Via Syngas Fermentation. Biophys. Econ. Sustain. 2021, 6, 1–13. [Google Scholar] [CrossRef]
  62. Damartzis, T.; Michailos, S.; Zabaniotou, A. Energetic assessment of a combined heat and power integrated biomass gasification–internal combustion engine system by using Aspen Plus®. Fuel Process. Technol. 2012, 95, 37–44. [Google Scholar] [CrossRef]
  63. Safarian, S.; Unnthorsson, R.; Richter, C. The equivalence of stoichiometric and non-stoichiometric methods for modeling gasification and other reaction equilibria. Renew. Sustain. Energy Rev. 2020, 131, 109982. [Google Scholar] [CrossRef]
  64. Safarian, S.; Unnthorsson, R.; Richter, C. Simulation and Performance Analysis of Integrated Gasification–Syngas Fermentation Plant for Lignocellulosic Ethanol Production. Fermentation 2020, 6, 68. [Google Scholar] [CrossRef]
  65. Safarian, S.; Bararzadeh, M. Exergy Recovery in Gas Pressure Compression Stations (GPCSs). Gas Process. 2015, 3, 11–18. [Google Scholar]
  66. Safarian, S.; Mousavi, M. Improvement of overall efficiency in the gas transmission networks: Employing energy recovery systems. Gas Process. J. 2015, 2, 1–24. [Google Scholar]
  67. Kim, T.; Tae, S.; Chae, C.U. Analysis of environmental impact for concrete using LCA by varying the recycling components, the compressive strength and the admixture material mixing. Sustainability 2016, 8, 389. [Google Scholar] [CrossRef] [Green Version]
  68. Paengjuntuek, W.; Boonmak, J.; Mungkalasiri, J. Environmental assessment of integrated biomass gasification fuel cell for power generation system. Int. J. Environ. Sci. Dev. 2015, 6, 445–450. [Google Scholar] [CrossRef] [Green Version]
  69. Balaman, Ş.Y. Chapter 4—Sustainability Issues in Biomass-Based Production Chains. Decis. Mak. Biomass Based Prod. Chain. 2019, 77–112. [Google Scholar] [CrossRef]
  70. Schreiber, A.; Zapp, P.; Marx, J. Meta-Analysis of life cycle assessment studies on electricity generation with carbon capture and storage. J. Ind. Ecol. 2012, 16, S155–S168. [Google Scholar] [CrossRef] [Green Version]
  71. Kim, T.H.; Chae, C.U. Environmental impact analysis of acidification and eutrophication due to emissions from the production of concrete. Sustainability 2016, 8, 578. [Google Scholar] [CrossRef] [Green Version]
  72. Kuo, P.-C.; Wu, W.; Chen, W.-H. Gasification performances of raw and torrefied biomass in a downdraft fixed bed gasifier using thermodynamic analysis. Fuel 2014, 117, 1231–1241. [Google Scholar] [CrossRef]
  73. Lv, P.; Xiong, Z.; Chang, J.; Wu, C.; Chen, Y.; Zhu, J. An experimental study on biomass air–steam gasification in a fluidized bed. Bioresour. Technol. 2004, 95, 95–101. [Google Scholar] [CrossRef] [PubMed]
Figure 1. System boundaries, technologies, and associated inputs.
Fermentation 07 00061 g001
Figure 2. Diagram of gasification simulation in Aspen Plus.
Fermentation 07 00061 g002
Figure 3. Net output power from 28 WB&FR gasification systems.
Fermentation 07 00061 g003
Figure 4. Percentage shares of composing elements for different WB&FR.
Fermentation 07 00061 g004
Figure 5. Environmental impact assessment of various WB&FR gasifications: (A) GWP, (B) AP, and EP.
Fermentation 07 00061 g005
Figure 6. Environmental impact assessment of various WB&FR gasification per 1 kWh net power production.
Fermentation 07 00061 g006
Figure 7. Variation of NEI versus element percentage of C and H.
Fermentation 07 00061 g007
Table 1. Some assumption for energy and efficiency inputs [41].
StepUnitAmount
Diesel fuel used in trucksL/km·ton0.06
Electricity for pressing and cuttingkWh/ton5.48
Fuel oil used for gasifier (for start-up)L/ton0.2
Electricity used for gasifierkWh/ton83
Isentropic efficiency of compressor%90
Mechanical efficiency of compressor%99
Isentropic efficiency of gas turbine%92
Table 2. Ultimate and proximate analysis of 28 WB&FR [44,45,46,47,48,49,50,51,52,53,54,55,56,57,58,59,60,61], (M: moisture content, VM: volatile materials, FC: fixed carbon, A: ash, C: carbon, O: oxygen, H: hydrogen, N: nitrogen and S: sulfur).
Proximate Analysis (wt%)Elemental Analysis (wt% − Dry Basis)
MVMFCACOHNS
1Alder-fir sawdust52.676.619.24.250.965638.51165.84380.4790
2Balsam bark8.477.4202.652.59638.4736.03880.19480.0974
3Beech bark8.473.718.57.847.390838.53965.5320.64540.0922
4Birch bark8.478.519.42.155.80334.95036.55930.48950.0979
5Christmas trees37.874.220.75.151.720536.72635.59910.47450.3796
6Elm bark8.473.118.88.146.777139.05755.33020.64330.0919
7Eucalyptus bark127817.24.846.362443.12565.42640.28560
8Fir mill residue62.98217.50.551.14342.28755.970.09950
9Forest residue56.879.916.93.251.013639.78485.22720.67760.0968
10Hemlock bark8.47225.52.553.62537.835.75250.1950.0975
11Land clearing wood49.269.713.816.542.334535.7385.010.3340.0835
12Maple bark8.476.619.4449.9239.6485.9520.3840.096
13Oak sawdust11.586.313.40.349.949743.76835.88230.09970
14Oak wood6.578.121.40.550.34742.68556.06950.29850.0995
15Olive wood6.679.617.23.247.43243.46325.22720.67760
16Pine bark4.773.724.41.952.777839.14195.78790.29430.0981
17Pine chips7.672.421.6649.63238.075.7340.470.094
18Pine pruning47.482.215.12.750.498740.18496.12990.48650
19Pine sawdust15.383.116.80.150.94942.85715.9940.09990
20Poplar6.885.612.32.150.516440.82435.97190.58740
21Poplar bark8.480.317.52.252.420838.43546.55260.29340.0978
22Sawdust34.984.614.31.149.252243.21935.9340.49450
23Spruce bark8.473.423.43.251.884838.726.00160.09680.0968
24Spruce wood6.781.218.30.552.038540.9946.06950.29850.0995
25Tamarack bark8.469.526.34.254.60630.6569.77160.67060.0958
26Willow10.182.515.91.649.003242.70566.00240.59040.0984
27Wood7.884.115.70.249.500844.01186.08780.09980.0998
28Wood residue26.47816.65.448.624439.63745.77060,.730.0946
Table 3. GWP, AP, and EP factors for different inputs [41].
InputUnitGWP Factor (kgCO2eq/unit)AP Factor (gSO2eq/unit)EP Factor (gNO3eq/unit)
Electricity generated from geothermalkWh0.0581.952.8
Transport by truckton·km0.32.14.2
Liquid fuel used in gasifierlit2.7610.521
Publisher’s Note: MDPI stays neutral with regard to jurisdictional claims in published maps and institutional affiliations.

